studies on composite biomaterials
TRANSCRIPT

Studies on composite biomaterials PhD thesis summary
Faculty of Physics
PhD Student: Scientific Supervisor: Adriana Vulpoi Prof. Dr. Viorica Simon
2011
Contents 1 Introduction .......................................................................................................................................... 3
2 Silver-bioactive glass composites .......................................................................................................... 4
2.1 Materials and samples preparation .............................................................................................. 4
2.2 Characterization of the prepared sol-gel glasses .......................................................................... 5
2.2.1 DTA/TG .................................................................................................................................. 5
2.2.2 XRD ........................................................................................................................................ 7
2.2.3 IR ........................................................................................................................................... 8
2.2.4 Surface area and pore structure analyses ............................................................................ 9
2.2.5 UV-vis .................................................................................................................................. 11
2.2.6 TEM ..................................................................................................................................... 12
2.3 Bioactivity studies ....................................................................................................................... 13
2.3.1 XRD ...................................................................................................................................... 14
2.3.2 FTIR ...................................................................................................................................... 15
2.3.3 SEM/EDS .............................................................................................................................. 16
2.3.4 XPS ....................................................................................................................................... 17
2.3.5 Antibacterial studies ........................................................................................................... 20
2.3.6 Protein adsorption studies .................................................................................................. 20
3 Polymer\silver-bioactive glass composites ......................................................................................... 25
3.1.1 Polymer textile fabrication.................................................................................................. 25
3.1.2 Obtaining of bioactive glass/polymer composites .............................................................. 25
3.1.3 Characterization .................................................................................................................. 26
3.1.4 Bioactivity ............................................................................................................................ 29
3.1.5 Antibacterial effect ............................................................................................................. 36
4 Conclusions ......................................................................................................................................... 38
General conclusion ................................................................................................................................. 38
references ................................................................................................................................................... 39

1 INTRODUCTION
The aim of this thesis is to synthesise composite biomaterials for further possible tissue
engineering purposes. Tissue engineering is an interdisciplinary field that applies the principles
of life science and engineering to the development of biological substitutes that aim to maintain,
restore or improve tissue function. Biodegradable materials have found enormous interest as
supports because of the fact that the support disappears from the transplantation site with the
passage of time, leaving behind a perfect patch of the natural tissue. Therefore this thesis is based
on preparation and characterization of bioactive, biodegradable and antibacterial polymer/
bioactive glass composites.
The bioactive property of the chosen composite is given by bioactive glass in the formula
56SiO2∙(40-x)CaO·4P2O5·xAg2O with x = 0, 2, 4, 6, 8 and 10 mol%. The preparation method
chosen for these bioactive glasses is sol-gel method because it permits a low temperature
preparation and a better controllability of the bioactive glass structure and morphology. This
method also permitted the introduction of the antibacterial agent in the glass composition giving
these samples a composite nature with metallic silver as dispersed phase in an almost amorphous
glass structure.
The biodedegradable component is given by a Poly-96L/4 D-lactide copolymer highly
porous structures. A slurry-dipping technique was use to obtain the polymer/silver-bioactive
glass composites.
This thesis begins with the present introduction followed by four chapters and finishes
with conclusions. Each chapter is followed by references.
The introduction presents the motivation and the main objective of this thesis. The first
chapter of this thesis is dedicated to Biomaterials, beginning with a general definition of these
materials and trying to overview this vast domain, focusing on bioactive glasses, polymers and
their composites, as biomaterials. The second chapter contains brief descriptions of the
experimental techniques used for analysis of the samples. In the third chapter are described the
experimental proceedings for both preparing and analyzing the samples. In the last chapter are
presented the experimental results and also discussions on their behalf.

2 SILVER-BIOACTIVE GLASS COMPOSITES
One of the aims of this study was to evaluate the nature of the silver species embedded
into the bioactive glass network before and after immersion in simulated body fluid (SBF), and
to characterize the structural, morphological and textural changes induced by the silver addition
to the bioactive glass matrix. Special attention was also focused on determining how silver
content influences the bioactivity of the investigated glasses and to investigate the protein
binding capability of the Ag containing bioactive glasses.
2.1 Materials and samples preparation
Samples belonging to the system 56SiO2∙(40-x)CaO·4P2O5·xAg2O with x = 0, 2, 4, 6, 8
and 10 mol% were prepared via sol-gel method. The gels were obtained by hydrolysis and
condensation of tetraethyl orthosilicate (TEOS), calcium nitrate tetrahydrate (Ca(NO3)2∙4H2O)
ammonium phosphate dibasic ((NH4)2HPO4) and silver nitrate (AgNO3).
First the bioactive glass matrix belonging to the composition 56SiO2∙40CaO·4P2O5 was
prepared. It was further denoted the sample with x=0. For this reason TEOS was mixed with
ethanol in a weight ratio of 1:1 and kept on a magnetic stirrer at room temperature for an hour. In
this time Ca2O and P2O5 precursors were dissolved in distillated water separately and left on
magnetic stirrers for 30 minutes also at room temperature. After one hour the three clear
solutions were mixed together. First the calcium containing solution was added drop by drop to
the TEOS solution under continuous stirring. After that the phosphor containing solution has
been added also drop by drop under continuous stirring. The pH of the final solution was
adjusted to 1.5 with nitric acid (HNO3), and left on the magnetic stirrer for other two hours. After
removing from the stirrer the samples the pot containing the solution was transferred to an
incubator and kept there for seven days in order to obtain the gel, respectively aging. The aged
gel was placed on a watch glass dried in an oven at 110 ºC for 24 hours in order to eliminate
water excess and the alcohol obtained from the hydrolysis..
The silver containing samples were prepared similar with the silver free sample. This
samples were named x=2, x=4, x=6, x=8 and x=10 respectively closely related with the silver
concentration added. Ag2O was introduced by partially substitution of CaO. The Ag2O precursor
was also dissolved in distillated water but this time the pH of the solution was adjusted to 2 with

nitric acid to avoid precipitation. In this case the first solution added on the TEOS solution was
the silver containing one. The rest of the preparation protocol was the same with the one of the
silver free sample.
After drying, all the samples were well grounded and were heat treated at 580°C for 1/2h.
The samples were introduced in the preheated oven and taken out after 30 minutes.
2.2 Characterization of the prepared sol-gel glasses
DTA and TGA were used to understand how the silver presence influences the thermal
events, while XRD, FTIR spectroscopy were applied to determine both the developed crystalline
phases and the structural changes generated inside the matrix by the addition of such high
amount of silver. The textural particularities of the investigated samples are proposed to be
determined by performing N2-adsorption measurements. The shape and size distribution of the
silver particles located inside the glass matrix were studied by TEM, UV-vis
2.2.1 DTA/TG
The TGA/DTA curves of the as prepared samples are shown in Fig. 1. The first
endothermic peak located around 60-80 ºC and associated with the weight loss can be observed
in all investigated samples and corresponds to the release of physisorbed water and the pore
liquor [1]. The exothermic peak with an onset around 277 ºC could be assigned to the removal of
organic residues. A relative intense endothermic signal appears in the DTA curves around 485 ºC
for the samples with x=4 and x=6 and could be associated with the silver oxide decomposition
and possibly metallic silver nanocrystals formation. Its presence for higher silver content (x=8
and x=10) cannot be excluded as long as the peak located around 500 ºC becomes more
pronounced and cover the temperature range near 485 ºC.

Fig. 1 TG/DTA curves of the 56Si02∙(40-x)CaO·4P2O5·xAg2O samples. Note that the DTA curve
is represented by the top line, while the bottom line represents the TG signal.
0 200 400 600 800 100040
50
60
70
80
90
100
-20
-10
0
10T
G %
Temperature ºC
DT
A
V
76
216
280
554
526
TG
DTA
x=0
0 200 400 600 800 1000
50
60
70
80
90
100
-80
-60
-40
-20
0
20
40
TG
%
TG
DTA
Temperature ºC
x=2
79
278
527544
DT
A
V
0 200 400 600 800 1000
40
50
60
70
80
90
100
-80
-60
-40
-20
0
20
T
G %
Temperature ºC
DT
A
VTG
DTAx=4
70
273
486542
0 200 400 600 800 100050
60
70
80
90
100
-80
-60
-40
-20
0
TG
%
Temperature ºC
DT
A
V
TGDTA
x=6
70
280
482542
0 200 400 600 800 100050
60
70
80
90
100
-60
-40
-20
0TG
DTA
D
TA
V
65
280
501
410
TG
%
Temperature ºC
x=8
0 200 400 600 800 100050
60
70
80
90
100
-80
-60
-40
-20
0
20
TG
DTA
78
285
500 DT
A
V
TG
%
Temperature ºC
x=10
The endothermic peaks from the 540-550 ºC temperature range, which occur for the
samples with 0 x 6, are mainly due dehidroxylation and are associated with the weight loss
from the corresponding TGA curves [2]. The thermal events corresponding to the metallic silver
nanocrystals formation and dehidroxilation are overlaid with the silver addition (x=8 and x=10)
and lead to a maximum around 500 ºC. A close analysis of the endothermic peaks position
between 540 and 550 ºC reveals the decrease of the temperature, where the thermal event takes
place, as silver content increases.
2.2.2 XRD
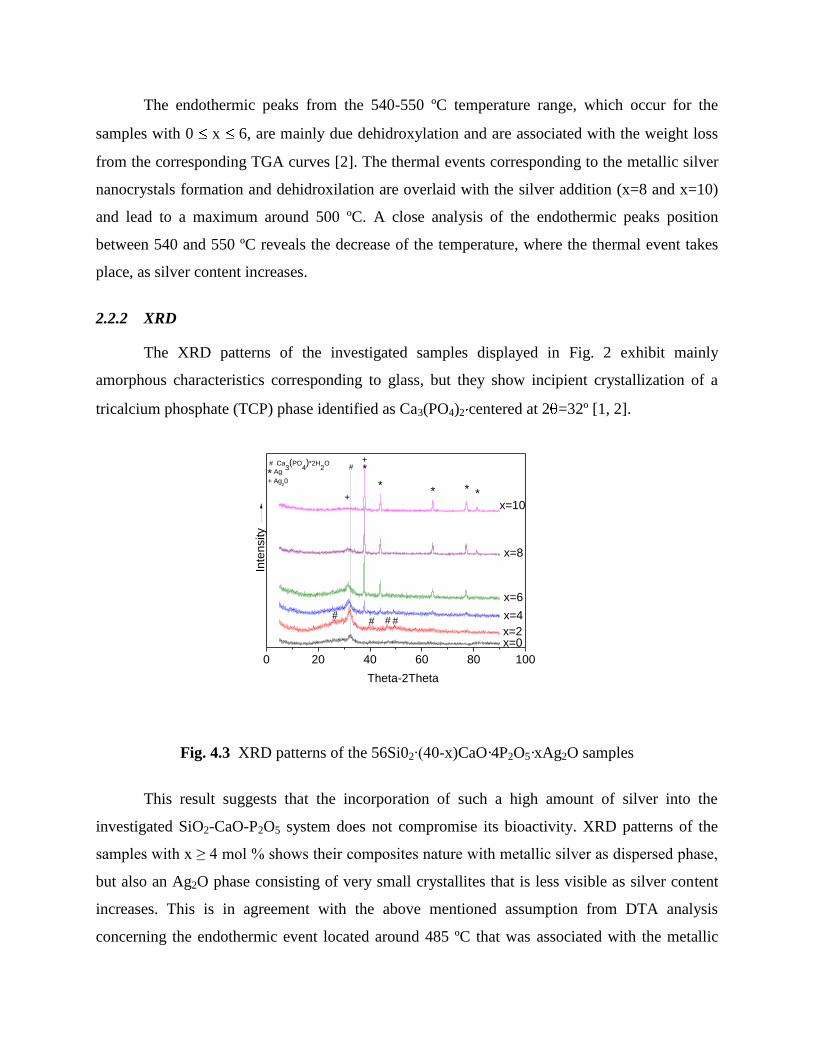
The XRD patterns of the investigated samples displayed in Fig. 2 exhibit mainly
amorphous characteristics corresponding to glass, but they show incipient crystallization of a
tricalcium phosphate (TCP) phase identified as Ca3(PO4)2 centered at 2 =32º [1, 2].
0 20 40 60 80 100
+ Ag20
+
# ##
#
**
*
Theta-2Theta
x=0x=2
x=4
x=6
x=8
x=10
#
**
Inte
nsity
# Ca3(PO
4)*2H
2O
+
Ag *
Fig. 4.3 XRD patterns of the 56Si02∙(40-x)CaO·4P2O5·xAg2O samples
This result suggests that the incorporation of such a high amount of silver into the
investigated SiO2-CaO-P2O5 system does not compromise its bioactivity. XRD patterns of the
samples with x ≥ 4 mol % shows their composites nature with metallic silver as dispersed phase,
but also an Ag2O phase consisting of very small crystallites that is less visible as silver content
increases. This is in agreement with the above mentioned assumption from DTA analysis
concerning the endothermic event located around 485 ºC that was associated with the metallic

silver nanocrystals formation. One also observes that the increase of the silver content causes an
expected increase of crystallized metallic silver amount.
2.2.3 IR
The IR spectra presented in Fig. 3 show the existence of Q4 units (1200-1260 cm-1
) in all
samples. No other significant change can be observed in the IR spectra of the investigated silver
containing bioactive glasses.
1200 1000 800 600 400
Si-O-Si Si-O
-
Si-O-Si
Absorb
ance
Wavenumber/ cm-1
PO4
3- Si-O-Si
x=10
x=8
x=6
x=4
x=2
x=0
Si-O- P-O
Fig. 3 FTIR spectra of the 56Si02∙(40-x)CaO·4P2O5·xAg2O samples.
In the 550-610 cm-1
spectral region absorption signals associated with P-O vibrations can
be observed. A strong IR signal located between 850 and 1250 cm-1
dominate the spectra and is
given by the convoluted bands of stretching vibrational modes of SiO4 and PO4 tetrahedra. The
shoulder situated around 1233 cm-1
can be ascribed to the longitudinal optical Si-O-Si stretching
vibration [7]. The absorption band located at 1090 cm-1
is attributed to the stretching mode of Si-
O- bonds in the Q
3 tetrahedral units, while the shoulder centered on 930 cm
-1 is given by the
vibration of two non-bridging oxygen atoms in the Si-O-Si environment (Q2 units) [8, 10]. The
silanol vibrations give rise to a signal at 960 cm-1
, which is convoluted with that given by the Q2
unit vibrations [11, 12]. The IR band at about 1034 cm-1
can be associated with the P-O
stretching vibrational mode of PO43-
tetrahedra. An intense absorption signal occurs at 470 cm-1

and can be assigned to the rocking motion of the bridging oxygen atoms perpendicularly to the
Si-O-Si plane [7]. The bending motion of oxygen atoms along the bisector of the Si-O-Si
bridging group give rise to the band centered on 800 cm-1
[7]. A doublet corresponding to P-O
asymmetric bending vibrations in the PO4 tetrahedra was observed at 567 and 601 cm
-1 [13].
2.2.4 Surface area and pore structure analyses
For a better understanding of silver distribution in the glass matrix, textural analyses were
also performed. According to IUPAC classification the isotherms obtained from the samples are
type IV and type II isotherms, implying that each of these samples contains mesopores, i.e. pores
with diameters in the range 2–50 nm [14] (See Fig. 4), and exhibit type H1 hysteresis loops
typical of large pore ordered mesoporous silica for the samples with 0 x 6 and type H3
hysteresis loops for the samples with x=8 and x=10, respectively (Fig. 5) [15].
0 2 4 6 8 10
0,00
0,02
0,040 1 2 3 4 5 6 7 8 9 10
0,00
0,02
0,040 2 4 6 8 10
0,000
0,008
0,0160 2 4 6 8 10
0,000
0,006
0,012
0 2 4 6 8 100,000
0,002
0,004
0 2 4 6 8 10
0,000
0,003
0,006
dV
/dR
, cm
3/g
* n
m
R, nm
x=0
x=2
x=4
x=6
x=8
x=10
Fig. 4. Textural pore size distribution of the 56Si02∙(40-x)CaO·4P2O5·xAg2O samples.

This morphological behavior could be caused by the potential presence of Ag
nanoparticles that are deposited on the pore walls and block the pores. Another reason enforcing
this assumption that the pores are gradually being field with silver nanoparticles is the fact that
the specific surface area of the samples decreases with the increasing of the silver concentration.
The data are reported in Table 1
Table 1. Textural properties of the 56Si02∙(40-x)CaO·4P2O5·xAg2O samples.
x
(wt %)
Pore
volume
(cm3/g)
BJH
maximum
pore radius
(nm)
BJH
median
pore radius
(nm)
BET
Surface area
(m2/g)
0 0.26 3.05 3.82 118.37
2 0.22 4.05 4.39 76.16
4 0.16 4.96 4.57 63.21
6 0.13 5.92 5.75 37.19
8 0.05 4.11 5.59 16.53
10 0.03 3.87 4.42 12.30
A progressive decrease of total pore volume occurs, the value is diminished more than
eight times, from 0.26 to 0.03 cm3g
-1 with increasing Ag2O content. These changes, which occur
as a result of the increasing of Ag2O concentration, could be due to the progressive decreasing of
the viscosity that is expected to occur as the silver content becomes higher. Fig. 4.7 shows
nitrogen adsorption/desorption isotherms of the different silver containing samples sintered at
580ºC.
The textural properties expressed in terms of pore size distributions obtained from the
desorption branch of the nitrogen sorption isotherms using BJH analysis are illustrated in Fig. 4
as a function of silver content. One can see a progressive broadening of the mesopores
distribution as the silver content increases. This behavior becomes more visible for the sample
with x 4.

2.2.5 UV-vis
UV-vis absorption spectra (Fig. 5) were further recorded in order to get more information
on the structure of the investigated samples. The electronic absorption band located between 220
and 300 nm is present in all investigated samples, but it is clearly evidenced in the glass matrix
spectrum, where its maximum appears at 217 nm. Typically, the Ag+ signature can be seen inside
of the spectral region between 200 and 250 nm, and, therefore, the analysis of this signal
becomes difficult.
200 300 400 500 600 700 800
from
matr
ix
Abso
rptio
n
Wavelength [nm]
388
x=0
x=2
x=4x=6
x=8
x=10
429
425
420
422
236
242 2
47
25
2252from
matr
ix
Fig. 5 UV-vis absorption spectra of the 56SiO2∙(40-x)CaO·4P2O5·xAg2O samples.
However, a shift of the maximum value of this band from 217 to 221 nm can be observed
as silver amount increases. Moreover, an absorption signal around 240 nm increases in intensity
as the silver content becomes higher than 4 mol%. These spectral behaviors could be associated
with the raise of the number of silver ions and recommend the use of these samples as potential
biomaterials with antimicrobial properties. The absorption around 420 nm in the UV-VIS spectra
of the samples with x=4, 6, 8 and 10 is attributed to the presence of silver nanoparticles [18].
The asymmetry of this broad band comes from the convolution of the signal given by individual
silver nanpoarticles with that associated with the existence of silver clusters that arises at higher
wavelengths [19, 20].

It is justified to assume that the appearance of the absorption signal at around 390 nm in
the spectrum of the sample with 2 mol% Ag2O (Fig. 5) is mainly due to the existence of almost
spherical silver nanoparticles having small dimension within the glass matrix. What concerns the
samples with higher silver content, the absorption maximum at 420-430 nm is caused by
nonspherical silver particles or/and particles with higher sizes. The appearance of less spherical
nanoparticles as silver particles become larger was also previously observed [23].
2.2.6 TEM
In order to validate the assumed hypothesis concerning the presence of Ag nanoparticles,
TEM images were recorded and analyzed. The TEM pictures prove for all Ag2O containing
samples that the silver is present as nanoparticles and/or nanosized silver clusters of various
dimensions and shapes, inside the composites glass matrix, depending on the silver oxide content
(Fig. 6)
Fig. 6 TEM images of the 56SiO2∙(40-x)CaO·4P2O5·xAg2O samples
(a) x=2, (b) x=4, (c) x=8, (d) x=10
50nm
50nm
50nm
50nm
(a)
(d) (c)
(b)

Fig. 7 The normalized size distribution of the silver nanoparticles
obtained from the TEM pictures analysis of the 56SiO2∙(40-x)CaO·4P2O5·xAg2O samples
(a) x=2, (b) x=4, (c) x=8, (d) x=10
For the sample containing 2 mol% Ag2O (Fig. 8a) one can observe a distribution of silver
particles with almost spherical shapes and sizes in the range between 1.5 and 4 nm (Fig7a). By
looking at the particles size distributions derived from the TEM images of the silver/bioactive
glass composites with 4, 8 and 10 mol% Ag2O, which are presented in Figs. 7b, 7c and 7d, one
can remark the spreading of a relatively high number of silver particles with different sizes that
occurs as the Ag2O content increases. For the samples with the higher silver content (x=8 and
x=10) one can see spherical and nonspherical particles with dimensions of tens nanometers.
2.3 Bioactivity studies
The bioactivity was investigated by soaking the materials in SBF at 37 ºC to study de
hydroxyapatite/carbonated hydroxyapatite (HA/HCA) formation by XRD, FTIR, SEM
observation, EDS analysis, and XPS. It were selected 3 samples with x=0, x=2 and x=8 silver
content. In vitro tests were carried out by soaking the samples in SBF according with Kokubo
composition up to 14 days.
0 1 2 3 4 5 6 7 8 910
0.0
0.2
0.4
0.6
0.8
1.0 (b)
Par
ticle
siz
e di
strib
utio
n
Particle size (nm)
0 1 2 3 4 5 6 7 8 910
0.0
0.2
0.4
0.6
0.8
1.0 (c)
Par
ticle
siz
e di
strib
utio
n
Particle size (nm)
0 3 6 9 12151821
0.0
0.2
0.4
0.6
0.8
1.0 (d)
Par
ticle
siz
e di
strib
utio
n
Particle size (nm)
0 1 2 3 4 5 6 7 8 910
0.0
0.2
0.4
0.6
0.8
1.0 (a)
Par
ticle
siz
e di
strib
utio
n
Particle size (nm)

2.3.1 XRD
XRD analyses performed after SBF immersion allow to verify how silver content
influences the self-assembling process on samples surface induced by the ionic exchange
between the glasses and the SBF solution.
10 20 30 40 50 60 70 80 90
(a)(b)
(f)
(e)
(c)
*^
^^^
#
##
##
** ** *
2 theta (degree)
HA
(d)
Fig. 8 XRD pattern of the 56SiO2∙(40-x)CaO·4P2O5·xAg2O samples: (a) x=0, (c) x=2 and (e) x=8
prior to SBF soaking; (b) x=0,(d) x=2 and (f) x=8 after SBF soaking (* -HA, # -Ag, ^ -Ag3PO4)
The XRD patterns of non immersed samples already shows a broad halo of the non-
crystalline calcium phosphosilicate matrix (x=0), with a maximum centered at 2θ=32º and weak
features of an apatite like phase with nanosized crystallites. In order to clearly distinguish the
apatite phase a standard hydroxyapatite (HA) pattern [25] was inserted in Fig. 8. For the sample
without silver only the strongest lines relative to HA is evident, while after soaking in SBF (14
days) new peaks corresponding to crystallized HA phase appear. For the sample with x=2 one
can observe small peaks that can be attributed to metallic silver, but also to silver oxide crystals.
After SBF immersion these signals grow in intensity, and some new peaks attributed to Ag3PO4
phase appear [26]. The sample with high silver concentration exhibits the same behavior as the
one with x=2, but in this case the new crystalline phases formation is more evident.
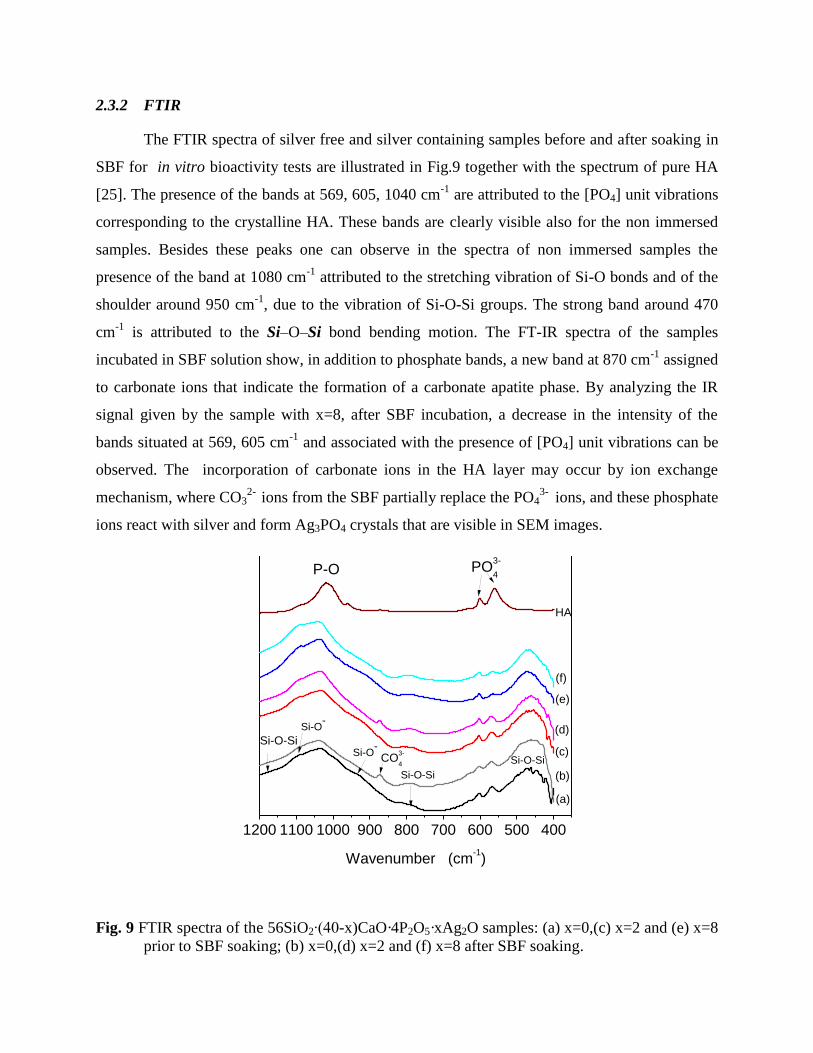
2.3.2 FTIR
The FTIR spectra of silver free and silver containing samples before and after soaking in
SBF for in vitro bioactivity tests are illustrated in Fig.9 together with the spectrum of pure HA
[25]. The presence of the bands at 569, 605, 1040 cm-1
are attributed to the [PO4] unit vibrations
corresponding to the crystalline HA. These bands are clearly visible also for the non immersed
samples. Besides these peaks one can observe in the spectra of non immersed samples the
presence of the band at 1080 cm-1
attributed to the stretching vibration of Si-O bonds and of the
shoulder around 950 cm-1
, due to the vibration of Si-O-Si groups. The strong band around 470
cm-1
is attributed to the Si–O–Si bond bending motion. The FT-IR spectra of the samples
incubated in SBF solution show, in addition to phosphate bands, a new band at 870 cm-1
assigned
to carbonate ions that indicate the formation of a carbonate apatite phase. By analyzing the IR
signal given by the sample with x=8, after SBF incubation, a decrease in the intensity of the
bands situated at 569, 605 cm-1
and associated with the presence of [PO4] unit vibrations can be
observed. The incorporation of carbonate ions in the HA layer may occur by ion exchange
mechanism, where CO32-
ions from the SBF partially replace the PO43-
ions, and these phosphate
ions react with silver and form Ag3PO4 crystals that are visible in SEM images.
1200 1100 1000 900 800 700 600 500 400
(f)
(e)
(d)
(c)
(b)
Wavenumber (cm-1)
Si-O-Si Si-O
-
Si-O-Si
Si-O-Si
Si-O-
PO3-
4P-O
CO3-
4
(a)
HA
Fig. 9 FTIR spectra of the 56SiO2∙(40-x)CaO·4P2O5·xAg2O samples: (a) x=0,(c) x=2 and (e) x=8
prior to SBF soaking; (b) x=0,(d) x=2 and (f) x=8 after SBF soaking.

2.3.3 SEM/EDS
Fig. 10 shows the SEM images of the three samples before and after soaking in SBF. The
HA/HCA layer is clearly visible on the surface of the SBF immersed samples (Fig. 10b, e, h),
and the HA crystals size increases with the increasing of silver concentration (Fig. 10h). By
analyzing the SEM images, performed with back scattered electrons, well defined Ag3PO4 sub-
microcrystals were observed in the silver containing sample [27].
Fig. 10 SEM images of the bioactive glass samples with different silver content: (a) x=0, (d) x=2
and (g) x=8 prior to SBF soaking; (b) x=0,(e) x=2 and (h) x=8 after SBF soaking; (c) x=0,(f) x=2
and (i) x=8 back scattered electron images after SBF soaking

This crystalline phase was also observed in the XRD pattern of SBF soaked silver containing
samples. For a better understanding of the SEM images EDS analyses were also conducted, the
result being presented in Table 2 It can be seen that the Ca:P ratio decreases after the SBF
soaking and for the compound with 8% silver this ratio (1.65) is very close to the theoretical
value of pure HA (1.67).
Table 2 Elemental composition in at % obtained from EDS analysis of the 56SiO2∙(40-
x)CaO·4P2O5·xAg2O samples prior and after SBF soaking
2.3.4 XPS
The XPS survey spectra recorded for bioactive glasses with different silver content before
and after immersion in SBF are presented in Fig. 11. The elemental composition recorded at the
surface of the samples before and after immersion in SBF was also determined from XPS survey
spectra and presented in Table 3. One should stress that the uncertainty of the measurements was
of ±0.05. From the data obtained for the samples incubated in SBF, one can see that the highest
Ca:P ratio (4.46) was determined for the compound with 2 % Ag and lowest one (2.33) for the
8% silver containing bioactive glass. A special remark should be highlighted, namely, a high
silver amount preferentially determines the formation of HA. The results also show a
considerably increase of the relative atomic percent of carbon for the samples with silver, which
represents another proof that the silver content favors the formation of carbonated apatite.
Si Ca P Ca/P Ag O
X=0 14,8 14,4 2,96 4,86 0 67,85
X=0 SBF 6,17 9,29 6,34 1,465 0 78,2
X=2 13,16 16,7 5,13 3,25 0,35 64,66
X=2 SBF 3,98 13,81 10,96 1,26 0,69 70,56
X=8 14,41 8,93 4,42 2,9 5,01 67,23
X=8 SBF 10,39 9,97 6,04 1,65 3,29 70,3
010203040506070
Ato
mic
pe
rce
nta
ge

600 400 200 0
Ca 2
s
(f)
(e)
(d)
(c)
(b)
Inte
nsity
(a
.u.)
Binding energy (eV)
(a)
O 1
s
Ca 2
pA
g 3
d
C 1
s
Si 2p
P 2
p
Ag 3
p
Si 2s
Fig. 11 XPS survey spectra of the 56SiO2∙(40-x)CaO·4P2O5·xAg2O samples: (a) x=0,(c) x=2
and (e) x=8 prior SBF soaking; (b) x=0,(d) x=2 and (f) x=8 after SBF soaking
Table 3 Elemental composition in at % obtained from XPS measurements of the 56SiO2∙(40-
x)CaO·4P2O5·xAg2O samples prior and after SBF soaking
Furthermore, the XPS Ag 3d high resolution spectra appear broader and asymmetric
evidencing a shoulder at lower binding energy that signalizes the presence of new type of bonds.
Si Ca P Ca:P Ag O C Cl
x=0 21,79 13,46 1,93 6,97 0 49,93 12,86 0
x=0 SBF 18,74 12,87 3,008 4,27 0 52,57 12,8 0
x=2 25,22 12,15 2,27 5,35 1,11 52,16 7,06 0
x=2 SBF 18,37 11,83 2,65 4,46 1,17 49,65 14,73 1,57
x=8 21,67 9,74 4,21 2,31 5,78 44,29 14,29 0
x=8 SBF 17,83 7,23 3,09 2,33 3,41 38,91 26,75 2,74
0
10
20
30
40
50
Ato
mic
pe
rce
nta
ge

The deconvolution of Ag 3d photoelectron peaks (Fig. 12) shows for Ag 3d5/2 line two
components at the binding energies around 368.5 eV and 367 eV corresponding to metallic silver
and silver oxide, respectively (Fig. 12) [28]. After immersion in SBF solution, the Ag 3d5/2 line
is well fitted with four components. The new components occur at 367.9 eV and 364.7 eV. The
component recorded around 367.9 eV is attributed to Ag3PO4 [29]. One should emphasize that
the signature of this structure was also evidenced in XRD patterns and SEM images. The
component at lower binding energy, about 365 eV, may be associated to AgCl formation that
seems very likely, as a visible amount of chlorine was evidenced after immersion in SBF
solution (Table 3).
380 375 370 365 360
380 375 370 365 360
380 375 370 365 360
380 375 370 365 360
Inte
nsity (
a.u
.)
Binding Energy (eV)
(a)
(b)
(c)
(d)
Fig. 12 Deconvoluted XPS Ag 3d high resolution spectra of the 56SiO2∙(40-
x)CaO·4P2O5·xAg2O samples prior and after SBF soaking: (a) x=2 prior SBF, (b) x=2 after
SBF(c) x=8 prior SBF and (d) x=8 after SBF soaking

2.3.5 Antibacterial studies
Antibacterial tests were caried out by difusion method on powder samples using a
dilution of 1% on staphylococus aureus and on escherichia coli. The antibacterial activity was
evaluated by measuring the zone of inhibition against the test organism. The results are presented
in Fig. 13. The sample with the highest silver content (x=10) produced the higest zone of
inhibition against both S.aureus and and E.coli. However the gram-negative bacteria (E. coli)
was less sensitive than the gram-positive one (S. aureus) on all silver containing samples. For the
silver free sample it cannot be observed any antibacterial effect.
Fig. 13 Inhibitory zone test results of the 56SiO2∙(40-x)CaO·4P2O5·xAg2O samples
2.3.6 Protein adsorption studies
Protein binding capability to the bioactive glasses surface was investigated by cw-EPR
experiments and XPS measurements. For this reason there were selected 3 samples: the silver
free one (x=0), one with low silver concentration (x=2) and a high silver concentration (x=8). In
order to investigate the protein-binding capability of the bioglass, the surfaces were
functionalized with horse methemoglobin. This protein has a molecular mass of 66.5 kDa and a
diameter of about 5.6 nm (1ZLU, Protein Data Bank). Hemoglobin molecule is an assembly of
four polypeptide chains (two β-chains and two α-chains), and each protein chain contains a heme
group whose iron ion binds reversibly with one oxygen molecule. In methemoglobin the iron is
oxidized to Fe3+
, inhibiting the oxygen-binding capabilities of the protein.
05
1015
x=0
x=2
x=4
x=6
x=8
x=1
0
Inh
ibit
ion
zo
ne
(m
m)
x=0 x=2 x=4 x=6 x=8 x=10
S. aureus 0 9 7 11 13 13
E.Coli 0 6 6 10 11 12

Horse methemoglobin has 2 native cysteines accessible for spin labels, situated in
position β-93 from the two β chains. These cysteines were labeled with (1-oxyl-2,2,5,5-
tetramethylpyrroline-3-methyl) methanethiosulfonate spin label (MTSSL) (see Fig. 14).
Fig. 14 Structure of methemoglobin obtained by X-ray crystallography (1ZLU from Protein Data
Bank). The α-chains are colored in green and the β-chains are colored in blue. The native
cysteines from position β-93 are colored in red and for each position β-93 all possible rotamers
for MTSSL are shown (populations calculated for room temperature (298 K));
For this measurements powder samples were incubated for 4 hours at 37°C in a solution
of 22.5 mg/ml (300 µM) horse methemoglobin in phosphate buffer (0.01M, pH 7.4) with low salt
concentration (10 mM NaCl). After immersion the samples were washed three times with buffer
solution, to remove the detachable protein molecules from the surface. Prior functionalization,
horse methemoglobin was spin-labeled with MTS in position β-93.
2.3.6.1 RES
X-band cw-EPR spectra recorded at room temperature for methemoglobin in solution and
after adsorption onto bioactive glasses with different silver content are shown in Fig. 15. In all
EPR spectra were identified two components, which correspond to spin label populations with
different mobility.

Fig. 15 Room temperature X-band cw-EPR spectra of horse methemoglobin spin-labeled
in position β-93* recorded in solution (green), and in in adsorbed state, immediately after
immersion on bioactive glass with 0 % (black), 2 % (red), and 8 % (blue) of silver content
respectively. The mobile and immobile components visible in the lower field spectral lines are
depicted with α and β respectively (inset)
In solution, the mobile EPR component (α in Fig. 4.20) arises from the surface exposed
spin labels (which point out of the protein, such that some flexibility is allowed), while the
immobilized component (β in Fig. 4.20) is interpreted as corresponding to the spin labels trapped
in a protein pocket (the so called tyrosine pocket, due to the penultimate residue being Tyr β145).
This interpretation is in agreement with the results obtained by Moffat [30] for horse
methemoglobin spin labeled with 4-(2-Iodoacetamido)-2,2,6,6-tetramethyl-1-piperidinyloxy) in
position β-93.
Upon adsorption of protein on bioactive glass the equilibrium between the two
conformations is significantly shifted towards the component β (see Fig. 4.20). The spin labels of
this fraction interact with the surface of the bioactive glass or with adjacent folded parts of
protein and the observed shift of the equilibrium between immobile and mobile states suggests
that the environment of the β-93* residue is perturbed by the adsorption process. The increasing
of silver content in the bioactive glass leads to further immobilization of the protein.
Methemoglobin becomes more rigid as a consequence of interaction between spin label and
silver ions that are disposed at the surface of the bioactive glass. The explanation can be based on

the fact that Ag+ reacts with thiol groups in proteins, due to the high affinity between the soft
sulfide and the soft metal [31, 32] . Although the protein was labeled with MTS spin label and,
therefore, the cysteine sulfur is blocked by the spin label and thus not accessible for Ag, the
labeling efficiency was 50%, so there are unlabeled cysteines in the sample. We assume that
these cysteines, which do not carry a spin label interact with Ag, and consequently, unlabeled
molecules bind easier than spin labeled protein. This interaction can induce a closer packing of
methemoglobin on the surface, which would lead to enhanced interaction of the spin label side
chain with neighboring protein atoms. Protein-binding capability of the Ag containing bioactive
glasses was also investigated by means of XPS analysis, method that supports the conclusions
from EPR measurements
2.3.6.2 XPS
Protein-binding capability of the silver containing bioactive glasses was also investigated
by means of XPS analysis (Fig. 16). The effect of silver content on adsorption of methemoglobin
from solution is reflected by the evolution of the new N 1s and S 2p photoelectron peaks, and by
the great amount of C 1s recorded after immersion in protein solution.
600 400 200 0
8
2
Inte
nsity
(a
.u.)
Binding energy (eV)
x
0
Ca
2s
O 1s
Ca
2pA
g 3
d
C 1
s
Si 2p
P 2
p
Ag 3
p
Si 2sN
1s
Cl 2p
Fig. 16 XPS survey spectra of the 56SiO2∙(40-x)CaO·4P2O5·xAg2O samples
after protein attachment

The amounts of each of these elements were found to increase significantly with the
silver content (Table 4), while the amounts of the main elements were reduced due to the protein
coverage of the surface. The nitrogen concentration was practically zero before immersion and
considerably increased after immersion due to protein attachment [33, 34].
Table 4 Elemental composition in at % obtained from XPS analysis of 56SiO2∙(40-
x)CaO·4P2O5·xAg2O glass samples prior to and after protein binding.
This result clearly shows a larger coverage with protein for the sample with higher silver
content. On the other hand, not only the amount of the adsorbed protein but also the protein
conformation is important for further cell proliferation on these materials [35]. In this respect,
both EPR and XPS measurements reported the highest agglomeration of protein molecules on
bioactive glass with 8 % silver content, pointing out that in this case the protein is somehow
“forced” by the neighbor molecules to keep its compact structure. Accordingly, increasing of
silver concentration up to 8% might prevent protein unfolding on bioactive glass surface.
Si Ca P Ag O C N S Fe
x=0 21,79 13,46 1,93 0,00 49,93 12,86 0,00 0,00 0,00
x=0 Hgb 13,47 12,65 6,65 0,00 49,32 15,99 1,19 0,70 0,00
x=2 25,22 12,15 2,27 1,11 52,16 7,06 0,00 0,00 0,00
x=2 Hgb 12,31 8,99 4,81 1,11 43,42 25,95 2,59 2,59 0,00
x=8 21,67 9,74 4,21 5,78 44,29 14,29 0,00 0,00 0,00
x=8 Hgb 15,49 4,34 2,29 3,08 37,84 27,93 4,96 1,41 2,62
0,00
10,00
20,00
30,00
40,00
50,00
Ato
mic
pe
rce
nta
ge

3 POLYMER\SILVER-BIOACTIVE GLASS COMPOSITES
The composites consist of poly-D,L-lactic acid nonwoven textiles coated with sol-gel
derived bioactive glasses. The polymer textiles were made from a commercially available Poly-
96L/4D-lactide copolymer fiber containing 16 filaments provided by Tampere University of
technology from Tampere, Finland and the bioglasses were prepared by sol-gel-derived glass
containing Ag nanoparticles in the system 56SiO2-36CaO-4P2O5-4Ag2O (mol %) and its three-
component counterpart 56SiO2-40CaO-4P2O5.
3.1.1 Polymer textile fabrication
For the fabrication of textiles there were used 4 km of Poly-96L/4D-lactide copolymer
fibers provided by Tampere University of Technology from Tampere, Finland. The fibers were
uniformly combed to a roll little by little and a fabric with a parallel orientation of fibers was
obtained. The fabric was cut in 4 pieces. Every two pieces were overlaid taking care to obtain
perpendicular orientation of the fibers from the two fabric sheets, and there were processed in a
needle pouncing machine that contained a matrix of needles that went through the fabric several
times giving it a pattern.
Fig. 17. Fabrication of Poly-96L/4D-lactide copolymer fabric: (A) Poly-96L/4D-lactide
copolymer fibers, (B) Fiber roller comb, (C) obtained polymer fabric
3.1.2 Obtaining of bioactive glass/polymer composites
The obtained polymer meshes were coated with bioactive glass particles using aqueous
slurry dipping as the processing method. Because of the poor adherence of the bioactive glass
coating to the polymer fabric, another component in the coating slurry was added, that acted as
glue promoting the adhesion of the glass particles to mesh surfaces. This component was
polyvinyl alcohol (PVA) which is also a polymer. After several tests, a final slurry composition
of 60% w/v of bioactive glass in 4% PVA solution was obtained. Pieces of 10x10 mm of fabric

were first pre treated in ethanol for 30 minutes to improve wetability, washed with distillate
water and lowered in the slurry using tweezers and left immersed for 3 min under continuous
slow steering to avoid precipitation of bioactive glass powder. After withdrawing, the samples
were set on a glass to dry at room temperature. During the first half hour they were turned very
often, once every two minutes. The obtained composites were left to dry for 3 days at room
temperature for 3 days.
3.1.3 Characterization
The microstructure of the composites was studied by SEM and EDS analyses.
Differential thermal analysis (DTA) and thermogravimetric analysis (TG) were used to verify the
thermal degradation temperatures of these composite materials and to quantify the bioactive
glass content on the polymer meshes.
3.1.3.1 SEM
The surface morphology of the polymer and the composites are presented in Fig. 18. As
one can see the PLA sample presents voids between the fibers, showing an overall porous
structure. The PLA+PVA hybrid composite polymer sample presents a thin film between the
PLA fibers associated with PVA. Bioactive glass particles are angular in shape and are caught
between the PLA polymer fibers with PVA.
PLA

PLA+PVA
PLA+PVA+BG0
PLA+PVA+AgBG
Fig. 18. SEM images of the polymer respectively polymer/ bioactive glass samples at low and
high magnification and their corresponding EDS spectra
3.1.3.2 DTA/TG
Differential thermal analysis (DTA) and thermogravimetric analysis (TG) were used to
verify the thermal degradation temperatures of these composite materials and to quantify the
bioactive glass content on the polymer meshes [37]. The weight percentage of bioactive glasses
was estimated from the difference in percentage mass, of the composites, at the beginning and at
the end of each DTA run, where the polymer was assumed to be totally thermally degraded. In
order to support this assumption DTA/TG analysis were performed also on the two types of
polymers used for the preparation of the composites both individually and together.

By inspecting the DTA (Fig. 19 B) curve of PLA fiber meshes one can observe the glass
transition temperature Tg around 73 ºC, which is followed by melting behavior around 159 ºC.
Tg and the melting temperature Tm strongly depend on molecular weight. Both Tg and Tm
increase with molecular weight and reach constant values beyond molecular weight 20.000. It is
important to note that Tg is influenced by the degree of crystallinity in PLA [38]. The
decomposition of PLA starts around 260 ºC. The decomposition is rapid at this temperature and
it completes at 380 ºC. The DTA curve of PLA presentedin Fig. 4.25B that shows two not well
separated endothermic peaks at around 364 ºC and 384º, respectively, with a corresponding
massive weight loss, as shown in the TG curve, that is associated with the complete dissolution
of PLA. A total of 97% of weight loss was observed in the decomposition of PLA [39].
By looking at the TG (Fig. 19A) curve corresponding to neat PVA polymer one can
observe two distinct and well separated weight-loss turns with two corresponding weight loss
peaks in the DTA curve. The first stage of decomposition (250– 350°C) corresponds mainly to
elimination reaction of hydroxyl side groups, while the second degradation stage (above 380°C)
is dominated by chain-scission and cyclization [40, 41]. The first degradation stage is associated
with a weight loss of 60%, and the second stage with 32% of weight loss. The events
corresponding to glass transition and melting point could not be observed in case of this polymer.
The initial molecular weight and the hydrolysis degree influenced the thermo-oxidative
degradation of PVA under dynamic thermogravimetric conditions. Higher molecular weight
caused greater complexity in the degradation process, whereas higher hydrolysis degree reduced
the decomposition temperature of PVA [42-44].
For PLA+PVA sample can be observed a degradation pattern consisting of two stages
like in the case of neat PVA sample, and it can be observed also the lower temperature events
which appear in case of neat PLA (Tg point at around 73 ºC and melting point around 159 ºC).
Among this samples the initial degradation temperature of PVA is the lowest, whereas that of
PLA is the highest, and the one for PLA+PVA is somewhere between that is in agreement with
the literature [41].

0 100 200 300 400 500
0
20
40
60
0 100 200 300 400 5000
20
40
60
80
100
DT
A S
ignal (
V)
Temperature (ºC)
Weig
ht (%
)
PLA
PVA
PLA+PVA
A
0 100 200 300 400 5000
10
20
30
40
0 100 200 300 400 5000
20
40
60
80
100
DT
A s
ign
al (
V)
Temperature ºC
B
We
igh
t (%
)
PLA+PVA
PLA+PVA+BG0
PLA+PVA+AgBG
A
Fig. 19 (A) and DTA (B) curves of polymers:
PLA (black), PVA (red) and PLA+PVA (blue)
Fig. 20 TGA (A) and DTA (B) curves of the
composites
PLA+PVA (black), PLA+ PVA+BG0 (red)
and PLA+PVA+AgBG (blue)
The DTA signal given by the bioactive glasses containing composites exhibits the same behavior
as the PLA+PVA polymer composite sample but the corresponding events happen at lower
temperature as seen in Fig. 20. The shifts can be attributed to the better thermal conductivity of
the bioactive glasses respectively of the silver. The weight percentage of bioactive glasses
content in the composites was found to be 6.5% BG0 and 14.7% AgBG, respectively, suggesting
more adhesion of the silver containing glasses to the polymer structure, thus confirming the SEM
observations.
3.1.4 Bioactivity
This part of the study was carried out with the use of the standard acellular in vitro
procedure described by Kokubo and colleagues. Pieces of 5x5mm of coated polymer fabrics
were immersed in 25 ml of SBF in clean conical flasks, which had previously been washed using

HCl and deionized water. The conical flasks were placed inside an orbital shaker, which rotates
at 100 rpm at controlled temperature of 37°C. The samples were extracted from the SBF
solution after given times of 1, 7, 14, and 21 days. The SBF was replaced twice a week because
the cation concentration decreases during the course of the experiments, as a result of the
changes in the chemistry of the samples. Once removed from the incubation flasks, the samples
were rinsed gently first in pure ethanol and then with deionized water and left to dry at ambient
temperature.
The formation of HA on the surface of composites after immersion in SBF was
investigated with analytical tools, such as SEM, XRD, XPS and IR spectroscopy, in order to
assess the chemical reactivity of the materials.
3.1.4.1 SEM
Fig. 21 and Fig. 22 show SEM images of polymer meshes coated with BG0 and AgBG
respectively after immersion for up to 21 days in SBF. First HA crystals developed in just 1 day
of dynamic immersion in SBF. In addition to HA specific crystals, on the composite containing
AgBG one can observe also silver phosphate crystals, which also develop from the first day
immersion and do not inhibit HA crystal formation. This crystalline phase was also observed on
the X-ray difractograms. As expected, the amount of HA crystals increased with the immersion
time. This is visible also on the SEM images of the sample immersed in SBF for 21 days [50].
The high magnification SEM images prove that HA is formed also on the polymer fibers not
only on the bioactive glass phase from the composite. This results are also confirmed by EDX
measurements presented in Table 5, were also can be seen that is no HA formation in the case of
neat polymer samples.

Global 40 μm Glass 5 μm Polymer 5 μm
A
B
C
D
E
Fig. 22 SEM images of Polymer/BG0 after incubation in SBF for: A-0, B-1, C-7, D-14, E-21, days

Global 40 μm Glass 5 μm Polymer 5 μm
A
B
C
D
E
Fig. 23 SEM images of Polymer/AgBG after incubation in SBF for : A-0, B-1, C-7, D-14, E-21, days

3.1.4.2 XRD
XRD results showed that characteristic HA diffraction peaks appeared after just 1 day of
immersion in SBF with one peak at 26º (2 ) and another one between 2 = 31º and 33º, as shown
in Fig. 24 . The relatively narrow peaks indicate high crystalliniti of the apatite formed in vitro at
this early stage of immersion in SBF. The intensity of the apatite peaks seems to increase with
immersion time as shown in Fig. 4.32, suggesting the growth of the number of HA crystals
formed on the PLA+PVA+BG0 composite surface. What regards the PLA+PVA+AgBG
composite, one can see some additional peaks attributed to silver phosphate formation on the
sample in addition to HA after SBF immersion as sown in Fig. 4.32B.
10 20 30 40 50 60 70 80 90
(e)
(d)
(c)
(b)
Inte
nsity (
a.u
)
Theta-2Theta
HA
(a)
A
10 20 30 40 50 60 70 80 90
(e)
(d)
(c)
(b)
^
*Ag3PO
4
*
*
^^ ^
Inte
nsity (
a.u
.)
Theta-2Theta
*^ ^
^
^Ag
HA
(a)
B
Fig. 24 XRD patterns of the Polymer/BG) (A) and Polymer/AgBG (B) composites:
(a) prior, (b)1 day, (c) 7days, (d) 14 days (e) 21 days, of SBF soaking
3.1.4.3 XPS
The elemental composition recorded at the surface of the pure polymers and the
composite samples before and aftere immersion in SBF was determined from XPS survey
spectra (Fig. 25) and are presented in Table 5

1200 1000 800 600 400 200 0
(h)
(g)
(f)
(e)
(d)
(c)
(b)
Inte
nsity (
a.u
.)
Binding Energy/ eV
O 1
s
C 1
s
Ag 3
dC
a 2
p
Si 2p
P 2
pNa
1s
O K
LL
N 1
sC
a 2
s
(a)
Fig. 25 XPS survey spectra of PLA (a), PLA+PVA (c), PLA+PVA+BG0 (e), PLA+PVA+AgBG
(g) before SBF soaking respectively after 21 days SBF (b), (d), (f), (h)
From the data obtained for the samples incubated in SBF, one can see that there is no HA
formation on the surface of PLA and PLA+PVA samples. In the case of bioactive glass
containing samples with and without silver one can observe a considerable increase of calcium
and phosphorus atoms on the surface of the composites after SBF, and a decrease of the
contribution given by carbon, silica and silver. This result suggest the formation of a HA layer on
the surface of this composites, layer that is clearly visible also from the SEM images.
Table 5 Surface elemental analysis results obtained from XPS survey spectra before and after
incubation for 21 days in SBF

3.1.4.4 IR
In Fig. 26 the FTIR-ATR of the polymer meshes with and without coating, before and
after SBF immersion for 21 days are sown respectively. The spectra of the uncoated polymers
(PLA and PLA+PVA) after 21 days in SBF are similar to that observed before soaking. The IR
spectra of the polymers coated with both BG0 and AgBG bioactive glasses exhibit a variation in
the shape of the band at 1035 cm-1
. This variation could be due to the appearance of P-O anti-
symmetric stress band that is a spectral characteristic of HA.
2000 1800 1600 1400 1200 1000 800 600
Inte
nsity (
a.u
.)
Wavenumber/ cm-1
1040
(h)(g)
(f)
(e)
(d)
(c)
(b)
(a)
Fig. 26 ATR-FTIR spectra of PLA (a), PLA+PVA (c), PLA+PVA+BG0 (e), PLA+PVA+AgBG
(g) before SBF soaking respectively after 21 days SBF (b), (d), (f), (h)
C O Si Ca P Ca/P Ag
PLA 69,429 27,773 2,798 0 0 0 0
PLA_SBF 74,257 24,957 0,786 0 0 0 0
PLA+PVA 74,097 24,554 0,85 0,499 0 0 0
PLA+PVA_SBF 74,879 24,193 0,928 0 0 0 0
PLA+PVA+BG0 68,916 26,942 2,618 1,522 0 0 0
PLA+PVA+BG0_SBF 45,467 39,174 0 8,1 7,258 1,116 0
PLA+PVA+agBG 69,491 26,943 1,756 1,044 0 0 0,763
PLA+PVA+agBG_SBF 32,439 44,79 1,142 11,273 9,906 1,138 0,451
01020304050607080

3.1.5 Antibacterial effect
Two classic pathogenic bacteria Escherichia coli, a gram positive bacteria and
Staphylococcus epidermidis, a gram negative bacteria, both of them potential infection sources in
wound healing, were used in the present study. The bacteria used were genetically modified light
emitting bacteria, and the testing method was imaging the light emission from those bacteria in
contact with the scaffolds, using a light sensitive camera. It was examined the bioluminescent
time course for 24 hours of the incubated samples together with the luminescent bacterial strains
to determine the antibacterial effect. The bioluminescence assay was performed every 2 hours in
triplicates in six well plates: three control samples which are pure PLA mats and three bioactive
glass containing samples. There were made a total of four plates.
As can see in Fig. 27 both bioactive glass containing composites (PLA+PVA+BG0 and
PLA+PVA+AgBG respectively) inhibited the bacterial growth. The time needed for the effect
varied depending on the composites. The effect also varied between bacterial species, but no
significant difference was seen between gram positive and gram negative bacteria. The silver
containing composite not only inhibited the bacterial growth, but it has also bactericidal effect.
This affirmation is supported by the fact that the luminescent effect is proportional with the
metabolism of the bacteria, so in conclusion if they do not present luminescence they don’t do
any metabolism and die. In the case of PLA+PVA+BG0 composite sample one can observe from
Fig. 27 that the time zero is characterized by increasement in luminosity, most probably because
the bacteria recognize the presence of the sample and increase their metabolism.

Fig. 27 Antibacterial test results

4 CONCLUSIONS
• Sol-gel route has been successfully used to obtain new silicate based composites
containing high silver amount
• Silver nanoparticles incorporated into the matrix, revealed by TEM and UV-vis, are
potentially deposited on the pore walls and block them as seen from specific surface area
and porosimetry analyses
• XRD, FTIR, SEM and XPS data reveal that the silver addition to SiO2-CaO-P2O5 glass
matrix favors the formation of HA/HCA, and also of Ag3PO4 crystals on the surface of
the samples immersed in SBF
• EPR and XPS results show that high silver content incorporated in BG has an important
effect in improvement of protein affinity toward this kind of materials suggesting a closer
packing of proteins at the sample surface
• As expected the antibacterial properties of the bioactive glasses increased with silver
concentration on both gram positive and gram negative bacteria
• Synthetic biodegradable Poly-96L/4D-lactide copolymer meshes were fabricated from
the same polymer fibers
• SEM analysis revealed the porous structure of the obtained composites while the amount
of bioactive glass from composites were estimated from thermal analyses
• The slurry dipping technique proved to be an apropiate technique for coating the
polymers with bioactive glasses
• The high chemical reactivity of the composites was confirmed by detection of HA
crystals already after first day immersion in SBF also on the polymeric phase of the
composite due to dynamic SBF incubation
• The silver containing meshes exhibit a marked bacteriostatic effect on both gram negative
(Escherichia coli) and gram positive (Staphylococcus epidermidis) bacteria
General conclusion
Composite materials comprising a biodegradable polymeric phase, a bioactive inorganic
phase, and an antibacterial agent were successfully obtained. These composites seem to
be a promising approach for scaffold production especially regarding bone tissue
engineering due to: silicate based bioactive glass that has the ability to stimulate
ostegenesis and to promote bone growth: silver, a potent antibacterial agent, that forms
Ag3PO4 crystals on the bioactive glass, permitting a long time release of the antibacterial
agent; biodegradable and high porous polymer (PLA+PVA) that is a support for bone
formation, permitting tissue ingrowths and vascularisation.

REFERENCES
1. M. Vallet-Regi, J. Roman, S. Padilla, J.C. Doadrio, F.J. Gil Bioactivity and mechanical
properties of SiO2–CaO–P2O5 glass-ceramics, J. Mater. Chem. 15 (2005) 1353-1359
2. B.S. Lee, S. H. Kang, Y.L. Wang, F.H. Lin, C.P. Lin, In Vitro Study of Dentinal Tubule
Occlusion with Sol-gel DP-bioglass for Treatment of Dentin Hypersensitivity, Dent. Mat.
J. 26 (2007) 52-61.
3. J.
4. S.
5. T.
6. P. A. Chrissanthopoulos, N. Bouropoulos, S.N. Yannopoulos, Vibrational spectroscopic
and computational studies of sol–gel derived CaO–MgO–SiO2 binary and ternary
bioactive glasses, Vib. Spectrosc. 48 (2008) 118–125.
7. R.S. Pryce, L.L. Hench, Tailoring of bioactive glasses for the release of nitric oxide as an
osteogenic stimulus, J. Mater. Chem. 14 (2004) 2303–2310.
8. T. Wenzel, J. Bosbach, F. Stietz, F. Träger, In situ determination of the shape of
supported silver clusters during growth, Surface Science, 432 (1999) 257-264 + J R
Osiecki, K Takusari, H Kato, A Kasuya, S Suto, The atomistic growth of silver clusters
on a Si(111)7x7 surface, J. Phys.: Conference Series 61 (2007) 1107–1111
9. F.
10. R.H. Stolen, G.E. Walrafen, Water and its relation to broken bond defects in fused silica
J. Chem. Phys. 64(1976) 2623-2632.
11. G. Melinte, L. Baia, V. Simon, S. Simon, Hydrogen peroxide versus water synthesis of
bioglass-nanocrystalline hydroxyapatite composites, J. Mater. Sci. 2011, DOI:
10.1007/s10853-011-5700-8.
12. M.M. Pereira, A.E. Clark, L.L. Hench Effect of Texture on the Rate of Hydroxyapatite
formation on Gel-Silica Surface, J. Am. Ceram. Soc. 78 (1995) 2463–2468.
13. K.S.W. Sing, D.H. Everett, R.A.W. Haul, L. Moscou, R.A. Pierotti, J. Rouquerol, et al.
Reporting physisorption data for gas/solid systems, Pure Appl. Chem. 57 (1985) 603–619
14. J.R. Jones, L.M.Ehrenfried, L.L. Hench, Optimising bioactive glass scaffolds for bone
tissue engineering, Biomaterials 27 (2006) 964-973
15. M.T Colomer, Nanoporous anatase thin films as fast proton-conducting materials, Adv.
Mater. 18 (2006) 371–374
16. J.

17. P.
18. G. Le Saout, P. Simon, F. Fayon, A. Blin, Y. Vaills, J. Raman Spectrosc. 33, 740 (2002),
19. Mie, G., Ann.Physik, [4] 25, 377(1908)
20. M. Bellantone, H. D. Williams, and L. L. Hench, Broad-spectrum bactericidal activity of
Ag2O-doped bioactive glass, Antimicrobial Agents and Chemotherapy, vol. 46, no. 6, pp.
1940–1945, 2002.
21. S.
22. L.
23. Pászti Z, Petö G, Horváth ZE, Karacs A, Guczi L. Electronic structure of Ag
nanoparticles deposited on Si. Solid State Commun 1998;107:329-333.
24. http://rruff.info/hydroxylapatite/display=default/R050512
25. M. Shirkhanzadeh, M. Azadegan. Formation of carbonate apatite on calcium phosphate
coatings containing silver ions. J Mater Sci Mater Med 1998;9:385-391.
26. Y. Bi, S. Ouyang, J. Cao, J. Ye, Facile Synthesis of Rhombic Dodecahedral
AgX/Ag3PO4 (X=Cl, Br, I) Hetero-crystals with Enhanced Photocatalytic Properties and
Stabilities. Phys Chem Chem Phys 2011;13:10071-10075.
27. P. A. Kumar, M.P. Reddy, L. K. Ju, H. H. Phil, Novel Silver Loaded Hydroxyapatite
Catalyst for the Selective Catalytic Reduction of NOx by Propene, Catal Lett
2008;126:78-83.
28. J.J. Buckley, A.F. Lee, L. Olivic, K. Wilson, Hydroxyapatite supported antibacterial
Ag3PO4 nanoparticles. J Mater Chem 2010;20:8056-8063.
29. JK. Moffat, Spin-labelled haemoglobins: a structural interpretation of electron
paramagnetic resonance spectra based on X-ray analysis. J Mol Biol 1971;55:135-146.
30. A. Simchi, E. Tamjid, F. Pishbin, A.R. Boccaccini, Recent progress in inorganic and
composite coatings with bactericidal capability for orthopaedic applications. Nanomed-
Nanotechnol 2011;7:22–39.
31. Q.L. Feng, J. Wu, G.Q. Chen, F.Z. Cui, T.N. Kim, J.O. Kim, A mechanistic study of the
antibacterial effect of silver ions on Escherichia coli and Staphylococcus aureus. J
Biomed Mater Res 2000;52:662-668.
32. A. Arvidsson, F. Currie, P. Kjellin, Y.T. Sul, V. Stenport, Nucleation and growth of
calcium phosphates in the presence of fibrinogen on titanium implants with four
potentially bioactive surface preparations. An in vitro study. J Mater Sci Mater Med
2009;20:1869-1879.
33. E. Vanea, V. Simon, XPS study of protein adsorption onto nanocrystalline
aluminosilicate microparticles. Appl Surf Sci 2011;257:2346-2352.

34. L.J. Gauckler, K. Rezwan, Adsorption of biomolecules on ceramic particles and the
impact on biomedical applications. Adv Sci Tech 2006;45:741-751
35. P. Ruuttila, 2000. Material properties and tissue reactions to bioabsorbable composite
orbital implant, Master of Science thesis, Tampere University of Technology, Department
of Materials Engineering
36. J.J.Blaker, A.R. Boccaccini, S.N. Nazhat, Thermal Characterizations of Silver-containing
Bioactive Glass-coated Sutures, J Biomater Appl 1(2005) 81-98
37. B. Gupta, N. Revagade, J. Hilborn, Poly(lactic acid) fiber: An overview, Progress in
Polymer Science, Volume 32, Issue 4, 2007, 455-482
38. S.S. Ray, M. Bousmina, Biodegradable polymers and their layered silicate
nanocomposites in greening the 21st century materials world. Prog. Mater. Sci., 50
(2005) 962-1079.
39. D. Brizzolara, H.J. Cantow, K. Diederichs, E. Keller, A.J. Domb, Mechanism of the
stereocomplex formation between enantiomeric poly(lactide)s. Macromolecules 29
(1996), 191–197
40. J.T. Yehabc, M.C. Yanga, C. J Wua, X. Wub, C.S. Wud, Study on the Crystallization
Kinetic and Characterization of Poly(lactic acid) and Poly(vinyl alcohol) Blends,
Polymer-Plastics Technology and Engineering, 47 (2008) Issue 12, 1289-1296
41. M. Popa, C. Vasile, I. A. Schneider Thermoxidative degradation of poly(vinyl alcohol)
under dynamic thermogravimetric conditions I. Influence of heating rate and of molecular
weight, J Polym Sci Part A-1: Polym Chem 10 (1972) 3679- 3684
42. C. Vasile, E.M. Călugăru, S. F. Bodonea Thermoxidative degradation of poly(vinyl
alcohol) under dynamic thermogravimetric conditions. II. Influence of the hydrolysis
degree J Polym Sci Polym Chem Ed 19 (1981), 897–905
43. S. P. Vijayalakshmi, Giridhar MadrasThermal Degradation of Water Soluble Polymers
and Their Binary Blends, Journal of Applied Polymer Science, 101 (2006) 233 – 240
44. Z. Zhoua, X. Liua, Fabrication of Poly-l-lactide Biomaterials with High Mechanical
Properties Using Fiber Oriented Pressing, Journal of Macromolecular Science, Part B 47
(2008) 847-858
45. E. Pamula, M. Blazewicz, C. Paluszkiewicz, P. Dobrzynski, FTIR study of degradation
products of aliphatic polyesters-carbon fibres composites, Journal of Molecular Structure,
596 (2001), 69-75
46. P. Ping, W. Wang, X. Chen, X. Jing, Poly(epsilon-caprolactone) polyurethane and its
shape-memory property, Biomacromolecules 6 (2005) 587-92.
47. J.W. Huang, Y.C. Hung, Y.L. Wen, C.C. Kang, M.Y. Yeh, Polylactide/Nano and
Microscale Silica Composite Films.I. Preparation and Characterization, Journal Of
Applied Polymer Science, 112 (2009), 1688 – 1694

48. Elizabeth Fonseca dos et al. Synthesis and characterization of poly (vinyl alcohol)
hydrogels and hybrids for rMPB70 protein adsorption. Mat. Res 9 (2006), 185-191
49. J. Olsen-Claire, J. J. Blaker, J. A. Roether, A. R. Boccaccini, G. Schmack, K. Gliesche,
Bioglass® Coatings on Biodegradable Poly(3-hydroxybutyrate) (P3HB) Meshes for
Tissue Engineering Scaffolds, Materialwissenschaft und Werkstofftechnik 37 (2006)
577–583