studies of wildlife water developments in southwestern ......and july (figure 4). mule deer visits...
TRANSCRIPT

Technical Guidance Bulletin No. 8 – December 2004
Studies of Wildlife Water Developments in Southwestern Arizona:Wildlife Use,Water Quality,Wildlife Diseases,Wildlife Mortalities,and Influences on Native Pollinators
Federal Aid in Wildlife RestorationProject W-78-R
Steven S. RosenstockChantal S. O’BrienRobert B. WaddellArizona Game and Fish DepartmentResearch Branch2221 W. Greenway Rd.Phoenix, Arizona 85023
Michael J. RabeArizona Game and Fish DepartmentGame Branch2221 W. Greenway Rd.Phoenix, Arizona 85023

AZFGD—Research Branch Technical Guidance Bulletin No. 8
1
SUMMARY
Water developments are a widely used wildlifemanagement tool in the arid Southwest. The ecological effects of those facilities have receivedlittle study and remain a source of controversy. Westudied direct and indirect effects of wildlife waterdevelopments in southwestern Arizona from1999–2003. Our results did not support hypothesizednegative impacts suggested by critics of wildlifewater development programs. Specifically, wefound that water developments were used by adiverse array of wildlife, including at least 1 species(kit fox) previously reported not to need free water.The waters we studied were heavily used by muledeer and game birds, however, the number of visitsby nongame species exceeded those by game species.We also found frequent use of catchments outsidesummer months. Despite frequent visitation byavian and mammalian predators, we observed onlya handful of successful predation events at wildlifewaters, all of which involved capture of small vertebrates. We did not find significant evidence of water quality problems associated with waterchemistry and did not detect toxins produced byblue-green algae. The wildlife water developmentswe studied did not appear to play a significant rolein transmission of the protozoan parasite that causestrichomoniasis or provide larval habitat for bitingmidges (genus Culicoides) that transmit hemorrhagicdisease viruses. We documented few instances ofanimals drowning in wildlife water developments,most of which involved small vertebrates.Africanized honeybees were widely distributed andabundant near wildlife water developments. However,the presence of water developments and large numbers of feral honeybees had no detectable influ-ence on the diversity and abundance of native bees.
INTRODUCTION
Wildlife water developments are an important partof wildlife management programs in arid regionsof the western United States. Beginning in the1940s, state and federal resource managementagencies initiated water development programsintended to benefit game species and otherwildlife. In cooperation with sportsman’s groupsand other land managers, the Arizona Game and
Fish Department has developed and maintainedmore than 800 water developments throughout thestate. Numerous other wildlife waters have beenbuilt by federal land management agencies and byprivate landowners.
Wildlife water development programs have evolvedconsiderably since their inception. Early wildlifewater developments were designed to benefit gamespecies, such as bighorn sheep, mule deer, quail,and doves. As human population growth and associated impacts began to affect large areas ofwildlife habitat in Arizona, water developmentprojects took on a broader context. Water develop-ments were used to mitigate for water sources thatwere lost or made inaccessible by development orchanges in land use and were designed to providewater for a variety of wildlife species. For manyyears, the need for water developments in aridhabitats was unquestioned, and such developmentswere considered universally beneficial to wildlifespecies. Despite the widespread development ofwater sources for wildlife, the benefits and ecolog-ical effects of these facilities have received scantattention. Recently, critics of water developmentprograms have suggested that artificial watersources may not yield expected benefits to wildlifeand may actually result in adverse impacts.
In 1999, the Department’s Research Branch; U.S.Army Yuma Proving Ground Conservation Program;and U.S. Fish and Wildlife Service, Kofa NationalWildlife Refuge initiated a cooperative study ofwildlife water developments in southwesternArizona. This report presents research results andmanagement recommendations from the first 5years of a planned 10-year study. Focal areas forthe first phase of our research were: (1) patterns of catchment use by wildlife, (2) water quality, (3)wildlife diseases and mortalities, and (4) nativeand nonnative pollinators.
STUDY AREA
We conducted our research on Yuma ProvingGround (YPG), Kofa National Wildlife Refuge,and adjacent areas managed by the Bureau of LandManagement (BLM). The study area encompassesabout 8,000 km2 consisting of rugged mountain
AZFGD—Research Branch Technical Guidance Bulletin No. 8
2
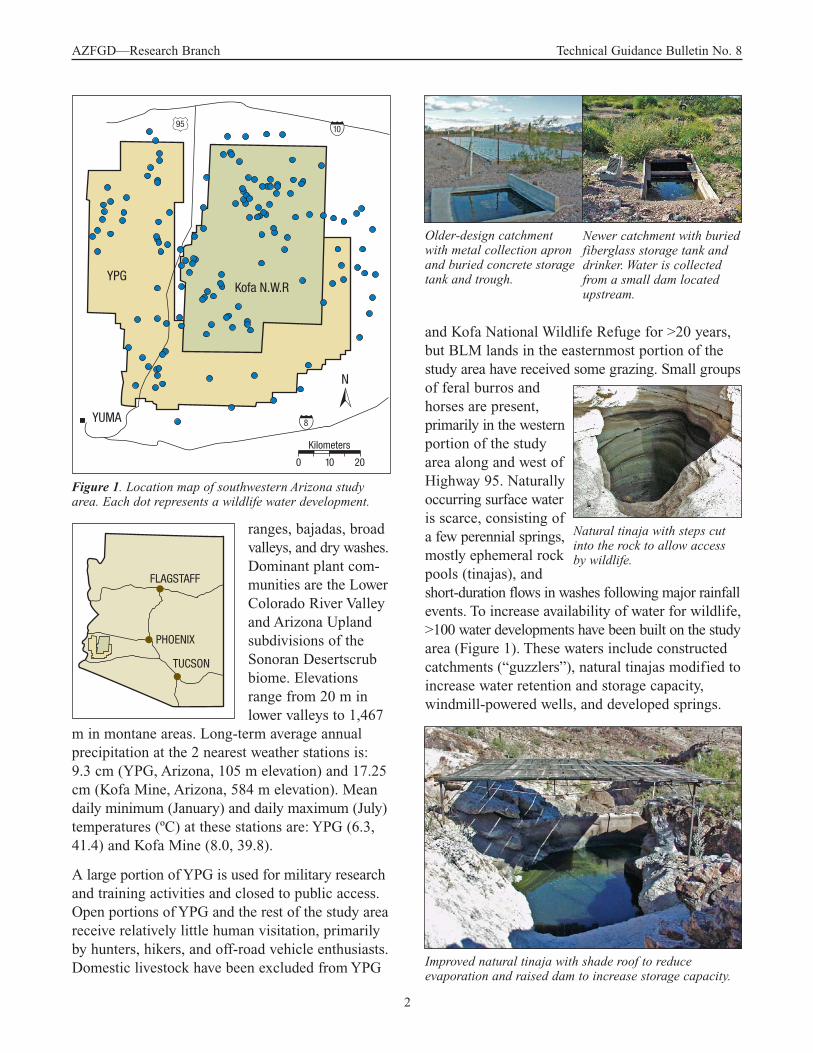
ranges, bajadas, broadvalleys, and dry washes.Dominant plant com-munities are the LowerColorado River Valleyand Arizona Uplandsubdivisions of theSonoran Desertscrubbiome. Elevationsrange from 20 m inlower valleys to 1,467
m in montane areas. Long-term average annualprecipitation at the 2 nearest weather stations is:9.3 cm (YPG, Arizona, 105 m elevation) and 17.25cm (Kofa Mine, Arizona, 584 m elevation). Meandaily minimum (January) and daily maximum (July)temperatures (ºC) at these stations are: YPG (6.3,41.4) and Kofa Mine (8.0, 39.8).
A large portion of YPG is used for military researchand training activities and closed to public access.Open portions of YPG and the rest of the study areareceive relatively little human visitation, primarilyby hunters, hikers, and off-road vehicle enthusiasts.Domestic livestock have been excluded from YPG
and Kofa National Wildlife Refuge for >20 years,but BLM lands in the easternmost portion of thestudy area have received some grazing. Small groupsof feral burros andhorses are present, primarily in the westernportion of the studyarea along and west ofHighway 95. Naturallyoccurring surface wateris scarce, consisting ofa few perennial springs,mostly ephemeral rockpools (tinajas), andshort-duration flows in washes following major rainfallevents. To increase availability of water for wildlife,>100 water developments have been built on the studyarea (Figure 1). These waters include constructedcatchments (“guzzlers”), natural tinajas modified toincrease water retention and storage capacity,windmill-powered wells, and developed springs.
YUMA
Kilometers
FLAGSTAFF
PHOENIX
TUCSON
Figure 1. Location map of southwestern Arizona studyarea. Each dot represents a wildlife water development.
Older-design catchmentwith metal collection apronand buried concrete storagetank and trough.
Newer catchment with buriedfiberglass storage tank anddrinker. Water is collectedfrom a small dam locatedupstream.
Natural tinaja with steps cutinto the rock to allow accessby wildlife.
Improved natural tinaja with shade roof to reduce evaporation and raised dam to increase storage capacity.

AZFGD—Research Branch Technical Guidance Bulletin No. 8
METHODS AND FINDINGS
Wildlife Use of Catchments
Video Observations – few studies have directlyquantified use of water developments by wildlife.Consequently, use of these facilities has often beeninferred from animal sign or limited, anecdotalobservations. It has been suggested that wildlifewater developments are only for game species andare of limited benefit to nongame wildlife. It hasalso been suggested that water developments arepredation traps where animals visiting to obtainwater can be ambushed by predators.
We collecteddetailed observa-tions of wildlifeuse at 3 catch-ments located onYPG (ArizonaGame and FishDepartment #531,#534, and #535).At each site, weinstalled a blackand white videocamera, infraredilluminator for
nighttime observations, time-lapse videocassetterecorder (VCR), and solar power system (seeAppendix A for complete list of system compo-nents). The systems recorded 1 picture/second for3 continuous days each week, from June 2000 toNovember 2003. At each site, we installed a HOBOPro® datalogger that recorded hourly measurementsof temperature and relative humidity.
We documented date, entry and exit times, species,minimum group size, and activities of owls, humans,and all animals greater than or equal to the size ofa black-tailed jackrabbit. We were unable to countindividual visits by doves and quail because largegroups of these species tended to mill about thewater for long periods, passing in and out of thefield of view, making it impossible to reliably estimate the number of individuals. Doves andquail were noted as either present or absent duringeach day of camera operation. The relatively coarse resolution of our black and white video
1 Identified by on-site capture.
American kestrel (Falco sparverius )Burrowing owl (Athene cunicularia )Common poorwill (Phalaenoptilus nuttallii )Common raven (Corvus corax )Cooper’s hawk (Accipiter cooperii )Elf owl (Micranthene whitneyi )Gambel’s quail (Callipepla gambelii )Gila woodpecker (Melanerpes uropygialis )Greater roadrunner (Geococcyx californianus )Great horned owl (Bubo virginianus )House finch (Carpodacus mexicanus )Loggerhead shrike (Lanius ludovicianus )Mourning dove (Zenaida macroura )Northern mockingbird (Mimus polyglottos )Red-tailed hawk (Buteo jamaicensis )Sharp-shinned hawk (Accipiter striatus )Turkey vulture (Cathartes aura )Western screech owl (Otus kennicotti )White-winged dove (Zenaida asiatica)Unknown bird
Badger (Taxidea taxus )Black-tailed jackrabbit (Lepus californicus )Bobcat (Lynx rufus )Coyote (Canis latrans )Desert cottontail (Sylvilagus audubonii )Grey fox (Urocyon cinereoargenteus)Kit fox (Vulpes macrotis )Mule deer (Odocoileus hemionus )Unknown batUnknown ground squirrelUnknown rodent
MAMMALS
BIRDS
REPTILES
Unknown snakeUnknown lizard
AMPHIBIANS
Red-spotted toad (Bufo punctatus ) 1
Colorado river toad (Bufo alvarius) 1
Video camera, infrared illuminator,and weather data logger used tomonitor wildlife use of catchments.
Table 1. Wildlife species observed at catchments.
3
AZFGD—Research Branch Technical Guidance Bulletin No. 8
4
images also made it difficult or impossible to identify and count small, fast-moving animals thatwere common visitors, including passerine birds,bats, small mammals, amphibians, and reptiles.
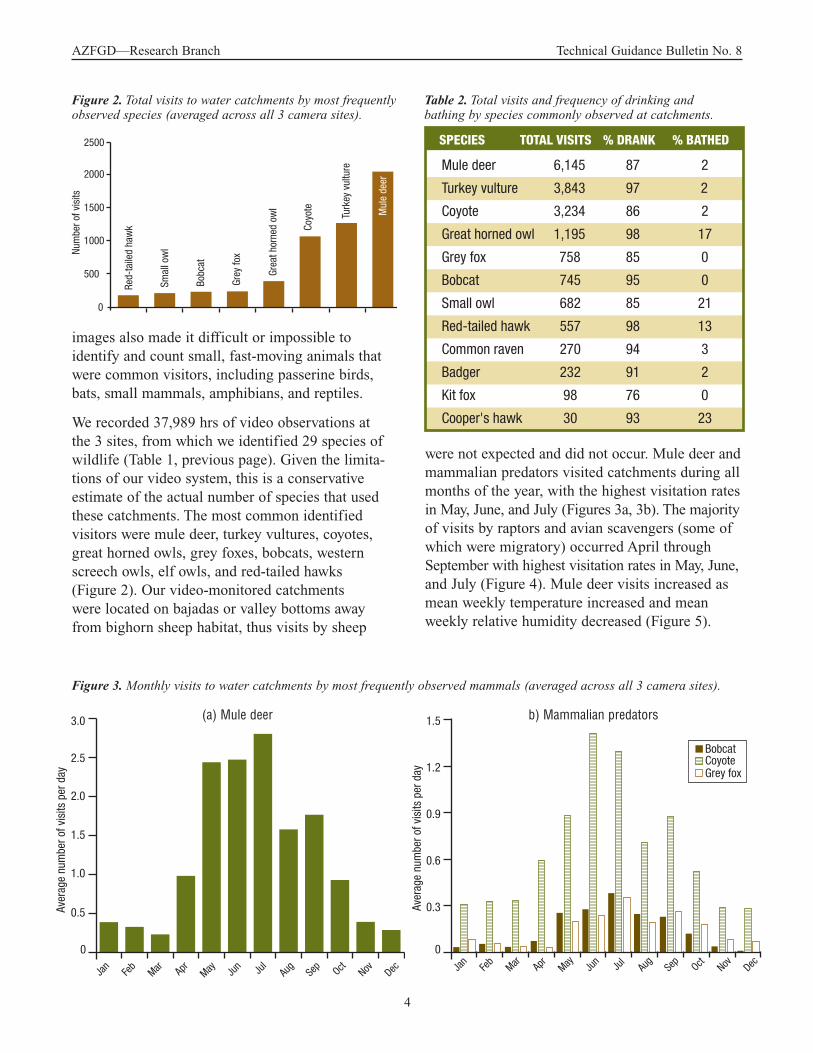
We recorded 37,989 hrs of video observations atthe 3 sites, from which we identified 29 species ofwildlife (Table 1, previous page). Given the limita-tions of our video system, this is a conservativeestimate of the actual number of species that usedthese catchments. The most common identifiedvisitors were mule deer, turkey vultures, coyotes,great horned owls, grey foxes, bobcats, westernscreech owls, elf owls, and red-tailed hawks(Figure 2). Our video-monitored catchments were located on bajadas or valley bottoms awayfrom bighorn sheep habitat, thus visits by sheep
were not expected and did not occur. Mule deer andmammalian predators visited catchments during allmonths of the year, with the highest visitation ratesin May, June, and July (Figures 3a, 3b). The majorityof visits by raptors and avian scavengers (some ofwhich were migratory) occurred April throughSeptember with highest visitation rates in May, June,and July (Figure 4). Mule deer visits increased asmean weekly temperature increased and meanweekly relative humidity decreased (Figure 5).
2500
2000
1500
1000
500
0
Num
ber o
f vis
its
Red-
taile
d ha
wk
Smal
l ow
l
Bobc
at
Grey
fox
Grea
t hor
ned
owl
Coyo
te
Turk
ey v
ultu
re
Mul
e de
er
Mule deer 6,145 87 2
Turkey vulture 3,843 97 2
Coyote 3,234 86 2
Great horned owl 1,195 98 17
Grey fox 758 85 0
Bobcat 745 95 0
Small owl 682 85 21
Red-tailed hawk 557 98 13
Common raven 270 94 3
Badger 232 91 2
Kit fox 98 76 0
Cooper's hawk 30 93 23
SPECIES TOTAL VISITS % DRANK % BATHED
0
0.5
1.0
1.5
2.0
2.5
3.0
Aver
age
num
ber o
f vis
its p
er d
ay
Jan
Feb
Mar Apr May Jun Ju
lAu
gSe
p Oct Nov Dec
0
0.3
0.6
0.9
1.2
1.5
Jan
Feb
Mar Apr May Jun Ju
lAu
gSe
pOct Nov Dec
Grey foxCoyoteBobcat
Aver
age
num
ber o
f vis
its p
er d
ay
Figure 2. Total visits to water catchments by most frequentlyobserved species (averaged across all 3 camera sites).
Table 2. Total visits and frequency of drinking andbathing by species commonly observed at catchments.
b) Mammalian predators(a) Mule deer
Figure 3. Monthly visits to water catchments by most frequently observed mammals (averaged across all 3 camera sites).

AZFGD—Research Branch Technical Guidance Bulletin No. 8
5
Use of catchments by deer decreased somewhatafter onset of the summer monsoon, but remainedhigh through the end of October. We also observedregular catchment visits by kit foxes, a speciesgenerally considered not to require freestandingwater. Kit foxes visited catchments at least 98times, during at least 8 months of the year (Junethrough January). The amount of time spent atcatchments varied considerably among species.Cooper’s hawks spent the longest average time atthe catchments (average = 14.8 minutes) while kitfoxes visited for the shortest average time (average= 1.9 minutes; Figure 6). The majority of animalsthat visited catchments were observed drinking(Table 2). Bathing was observed much less frequently, most commonly by hawks and owls
(Table 2). Doves and quail visited catchments yearround, with visitation peaking from April throughOctober. The catchments we observed held waterthroughout most of the study period and were refilledwith hauled water when necessary. We did, however,observe wildlife responses during 4 days in June2002 when Catchment #531 went dry. Six species(bobcat, coyote, grey fox, mule deer, red-tailedhawk, and turkey vulture) visited the catchmentwhen water was unavailable. Visit duration for 2species was considerably longer during the dry-up
0
Aver
age
num
ber o
f vis
its p
er d
ay
0.5
1
1.5
2
2.5
3
3.5
10
20
30
40
50
60
0
% o
r 0 C
Jan
Feb
Mar Apr May Jun Ju
lAu
gSe
p Oct Nov Dec
Mule deer visits
Temperature (average)
Relative humidity(average)
Kit fo
x0
16
2468
101214
Common
raven
Grey fo
x
Coyote
Badge
r
Turke
y
vultu
re
Mule de
er
Small
owl
Great
horne
d owl
Bobca
t
Red-ta
iled
hawk
Coope
r’s
hawk
Min
utes
Figure 5. Visits bymule deer to watercatchments in rela-tion to temperatureand relative humidity(averaged across all3 camera sites).
Figure 6. Average visit duration for species observedmost frequently at water catchments (averaged acrossall 3 camera sites).
Aver
age
num
ber o
f vis
its p
er d
ayApr May Ju
n Jul
Aug
Sep
Turkey vulture
Red-tailed hawkSmall owl
Great horned owl
0
0.5
1.0
1.5
2.0
2.5
3.0
3.5
4.0
Figure 4. Monthly visits to water catchments by mostfrequently observed raptors and avian scavengers(averaged across all 3 camera sites).
AZFGD—Research Branch Technical Guidance Bulletin No. 8
6
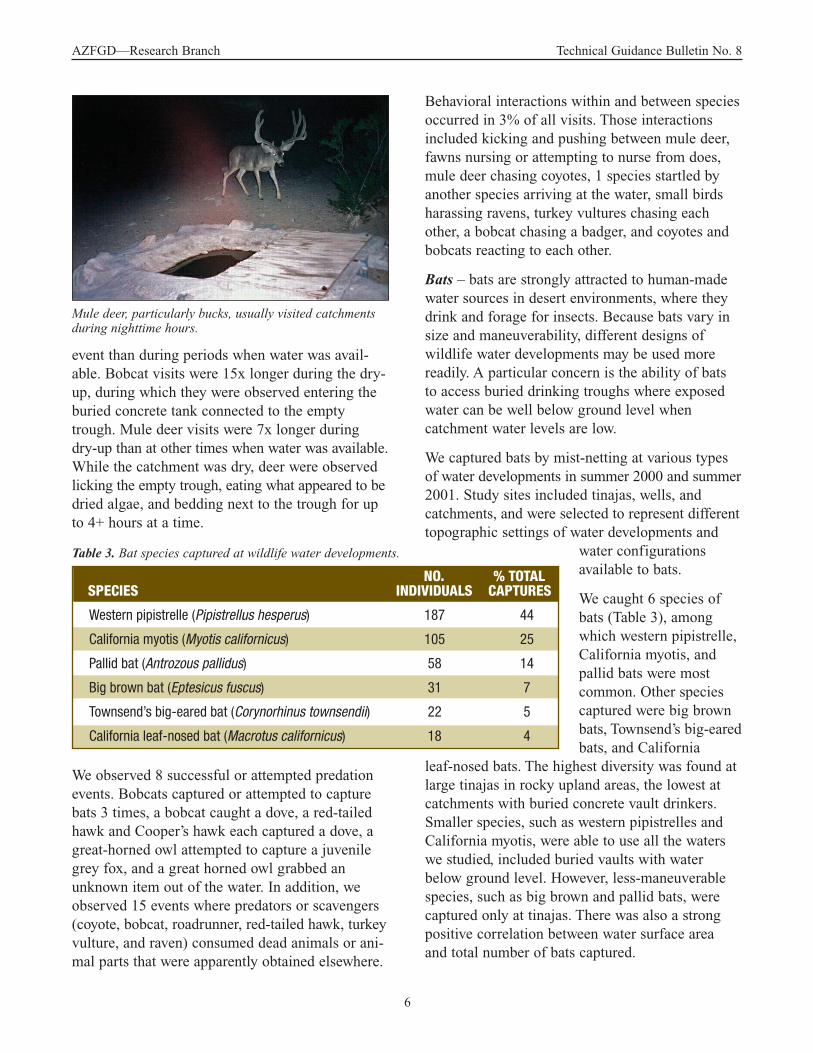
event than during periods when water was avail-able. Bobcat visits were 15x longer during the dry-up, during which they were observed entering theburied concrete tank connected to the emptytrough. Mule deer visits were 7x longer during dry-up than at other times when water was available.While the catchment was dry, deer were observedlicking the empty trough, eating what appeared to bedried algae, and bedding next to the trough for upto 4+ hours at a time.
We observed 8 successful or attempted predationevents. Bobcats captured or attempted to capturebats 3 times, a bobcat caught a dove, a red-tailedhawk and Cooper’s hawk each captured a dove, agreat-horned owl attempted to capture a juvenilegrey fox, and a great horned owl grabbed anunknown item out of the water. In addition, weobserved 15 events where predators or scavengers(coyote, bobcat, roadrunner, red-tailed hawk, turkeyvulture, and raven) consumed dead animals or ani-mal parts that were apparently obtained elsewhere.
Behavioral interactions within and between speciesoccurred in 3% of all visits. Those interactionsincluded kicking and pushing between mule deer,fawns nursing or attempting to nurse from does,mule deer chasing coyotes, 1 species startled byanother species arriving at the water, small birdsharassing ravens, turkey vultures chasing eachother, a bobcat chasing a badger, and coyotes andbobcats reacting to each other.
Bats – bats are strongly attracted to human-madewater sources in desert environments, where theydrink and forage for insects. Because bats vary insize and maneuverability, different designs ofwildlife water developments may be used morereadily. A particular concern is the ability of batsto access buried drinking troughs where exposedwater can be well below ground level when catchment water levels are low.
We captured bats by mist-netting at various typesof water developments in summer 2000 and summer2001. Study sites included tinajas, wells, andcatchments, and were selected to represent differenttopographic settings of water developments and
water configurationsavailable to bats.
We caught 6 species ofbats (Table 3), amongwhich western pipistrelle,California myotis, andpallid bats were mostcommon. Other speciescaptured were big brownbats, Townsend’s big-earedbats, and California
leaf-nosed bats. The highest diversity was found atlarge tinajas in rocky upland areas, the lowest atcatchments with buried concrete vault drinkers.Smaller species, such as western pipistrelles andCalifornia myotis, were able to use all the waterswe studied, included buried vaults with waterbelow ground level. However, less-maneuverablespecies, such as big brown and pallid bats, werecaptured only at tinajas. There was also a strongpositive correlation between water surface area and total number of bats captured.
Mule deer, particularly bucks, usually visited catchmentsduring nighttime hours.
Western pipistrelle (Pipistrellus hesperus) 187 44
California myotis (Myotis californicus) 105 25
Pallid bat (Antrozous pallidus) 58 14
Big brown bat (Eptesicus fuscus) 31 7
Townsend’s big-eared bat (Corynorhinus townsendii) 22 5
California leaf-nosed bat (Macrotus californicus) 18 4
SPECIESNO.
INDIVIDUALS% TOTAL
CAPTURES
Table 3. Bat species captured at wildlife water developments.

AZFGD—Research Branch Technical Guidance Bulletin No. 8
7
Water Quality
Desert water developments have characteristicsthat could adversely affect water quality, includinghigh water temperatures, high evaporation rates,and infrequent flushing. Those factors are mostpronounced during summer periods when desertwater developments are heavily used by a varietyof game and nongame wildlife. Hypothesized waterquality problems at wildlife water developmentsinclude high levels of mineralization, chemical toxins, and toxic blooms of blue-green algae.
Water Chemistry – wecollected water samplesfrom 5 different typesof water developments:natural tinajas (n = 14),modified tinajas (n = 9),catchments (n = 6), wells(n = 3), and developedsprings (n = 3). Foursets of samples col-lected in 2000 and2001 were analyzedfor arsenic, barium,calcium, chloride,
chromium, copper, fluoride, iron, lead, mercury,nitrate (as N), nitrite, selenium, silver, sulfate, zinc,alkalinity (as CaCO3), and total dissolved solids(TDS) by an Environmental Protection Agency-certified lab (Turner Labs Inc., Tucson, Arizona)following standard procedures. If samples haddetectable sulfur odor, we measured dissolvedhydrogen sulfide (H2S) using a reagent test kit(#HS-C, Hach Industries, Loveland, Colorado).Because published water quality standards andguidelines are lacking for wildlife, we relied pri-marily on those developed for domestic cattle,horses, sheep, goats, swine, and poultry (Table 4).
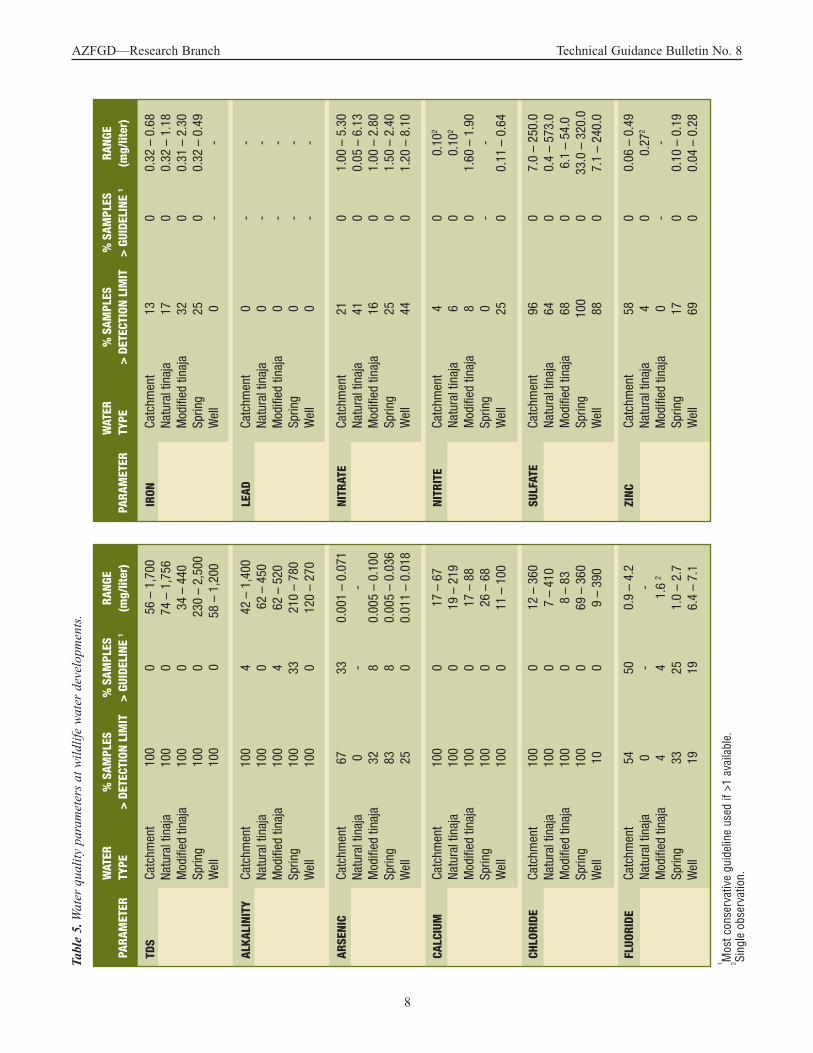
Results of water quality analyses are given in Table5 (next page). Seven constituents (barium, cadmium,chromium, copper, mercury, selenium, and silver)were absent or below detection thresholds in allsamples. Eight others (calcium, chloride, iron, lead,nitrate, nitrite, sulfate, and zinc) were present in 1 ormore water samples, but at levels well below guide-lines. Levels of arsenic above the most conservative
guideline (0.02 mg/liter), but well below the higherpublished guideline (0.5 mg/liter), were found in 8samples from catchments, 2 samples from tinajas,and 1 sample from a spring. Levels of fluorideabove the most conservative guideline (1.0 mg/liter)were found in 12 samples from catchments, 3 sampleseach from wells and springs, and 1 sample from atinaja. Hydrogen sulfide was detected infrequently(3% of samples) and occurred in all water develop-ments except wells, most frequently in tinajas.Concentrations of H2S ranged from 0.1 to 0.7mg/liter, well below the 25 mg/liter recommendedguideline. Values of alkalinity (as CaCO3) wereslightly to strongly alkaline and varied amongtypes of water developments, with the highest
Alkalinity (as CaCO3) 5004
Arsenic 0.022, 0.0256, 0.25, 0.53,4
Barium 3004
Cadmium 0.023,4, 0.052,5, 0.086
Calcium 700 – 1,0004, 1,0003,6
Chloride 15,0004
Chromium 1.02,3,4,5
Copper 0.52,5, 5.03, 0.5 – 5.04,6
Fluoride 1.0 – 2.06, 2.02,3,4,5
Iron 5.06
Lead 0.12,3,4,5,6
Mercury 0.012,5, 0.0033,4,6
Nitrate (as N) 1002,3,4,5,6
Nitrite 102,3,4,5,6
Selenium 0.052,3,4,5,6
Silver 0.056
Sulfate 1,0003,4,6
Sulfide (as H2S) 254
Total Dissolved Solids 3,0002,3,4,5,6, 5,0001
Zinc 245, 252, 503,6
CONSTITUENT GUIDELINE (mg/liter)
Table 4. Published guidelines used to evaluate waterquality at wildlife water developments.
1O’Gara and Yoakum (1992)2Runyan and Bader (1995)3Dupchak (1999)
4Peterson (1999)5Soltanpour and Raley (1999)6CCME (2002)
Catchment trough with accumulated algae, dead honeybees, and other detritus.Preventing such accumulationsof organic matter will improvewater quality.
AZFGD—Research Branch Technical Guidance Bulletin No. 8
8
PARA
MET
ERW
ATER
TY
PE%
SAM
PLES
> DE
TECT
ION
LIM
IT%
SAM
PLES
> GU
IDEL
INE
1
RANG
E(m
g/lit
er)
PARA
MET
ERW
ATER
TY
PE%
SAM
PLES
> DE
TECT
ION
LIM
IT%
SAM
PLES
> GU
IDEL
INE
1
RANG
E(m
g/lit
er)
IRON
Ca
tchm
ent
13
0 0.
32 –
0.6
8
Natu
ral t
inaj
a 17
0
0.32
– 1
.18
M
odifi
ed ti
naja
32
0
0.31
– 2
.30
Sp
ring
25
0 0.
32 –
0.4
9
Wel
l 0
- -
LEAD
Ca
tchm
ent
0 -
-
Natu
ral t
inaj
a 0
- -
M
odifi
ed ti
naja
0
- -
Sp
ring
0 -
-
Wel
l 0
- -
NITR
ATE
Catc
hmen
t 21
0
1.00
– 5
.30
Na
tura
l tin
aja
41
0 0.
05 –
6.1
3
Mod
ified
tina
ja
16
0 1.
00 –
2.8
0
Sprin
g 25
0
1.50
– 2
.40
W
ell
44
0 1.
20 –
8.1
0
NI
TRIT
E Ca
tchm
ent
4 0
0.10
2
Na
tura
l tin
aja
6 0
0.10
2
M
odifi
ed ti
naja
8
0 1.
60 –
1.9
0
Sprin
g 0
- -
W
ell
25
0 0.
11 –
0.6
4
SU
LFAT
E Ca
tchm
ent
96
0 7.
0 –
250.
0
Natu
ral t
inaj
a 64
0
0.4
– 57
3.0
M
odifi
ed ti
naja
68
0
6.1
– 54
.0
Sprin
g 10
0 0
33.0
– 3
20.0
W
ell
88
0 7.
1 –
240.
0
ZI
NC
Catc
hmen
t 58
0
0.06
– 0
.49
Na
tura
l tin
aja
4 0
0.27
2
M
odifi
ed ti
naja
0
- -
Sp
ring
17
0 0.
10 –
0.1
9
Wel
l 69
0
0.04
– 0
.28
TDS
C
atch
men
t 10
0 0
56 –
1,7
00
Natu
ral t
inaj
a 10
0 0
74 –
1,7
56
Mod
ified
tina
ja
100
0 34
– 4
40
Sprin
g 10
0 0
230
– 2,
500
W
ell
100
0 58
– 1
,200
AL
KALI
NITY
Ca
tchm
ent
100
4 42
– 1
,400
Na
tura
l tin
aja
100
0 62
– 4
50
Mod
ified
tina
ja
100
4 62
– 5
20
Sprin
g 10
0 33
21
0 –
780
W
ell
100
0 12
0 –
270
ARSE
NIC
Catc
hmen
t 67
33
0.
001
– 0.
071
Na
tura
l tin
aja
0 -
-
Mod
ified
tina
ja
32
8 0.
005
– 0.
100
Sp
ring
83
8 0.
005
– 0.
036
W
ell
25
0 0.
011
– 0.
018
CALC
IUM
Ca
tchm
ent
100
0 17
– 6
7
Natu
ral t
inaj
a 10
0 0
19 –
219
M
odifi
ed ti
naja
10
0 0
17 –
88
Sp
ring
100
0 26
– 6
8
Wel
l 10
0 0
11 –
100
CHLO
RIDE
Ca
tchm
ent
100
0 12
– 3
60
Natu
ral t
inaj
a 10
0 0
7 –
410
M
odifi
ed ti
naja
10
0 0
8 –
83
Sprin
g 10
0 0
69 –
360
W
ell
10
0 9
– 39
0
FL
UORI
DE
Catc
hmen
t 54
50
0.
9 –
4.2
Na
tura
l tin
aja
0 -
-
Mod
ified
tina
ja
4 4
1.6
2
Sp
ring
33
25
1.0
– 2.
7
Wel
l 19
19
6.
4 –
7.1
Tabl
e 5.
Wat
er q
uali
ty p
aram
eter
s at
wil
dlife
wat
er d
evel
opm
ents
.
1 Mos
t con
serv
ativ
e gu
idel
ine
used
if >
1 av
aila
ble.
2 Sing
le o
bser
vatio
n.

AZFGD—Research Branch Technical Guidance Bulletin No. 8
9
values observed in catchments. Alkalinity exceededthe recommended guideline (500 mg/liter) in 4samples from springs and 1 sample each from 1tinaja and 1 catchment. TDS levels were wellbelow recommended guidelines at all types ofwater developments.
The source of water had a strong influence on waterquality. Arsenic and fluoride occurred primarily atsprings, wells, and catchments that were fed bygroundwater or received hauled water from wells,all of which contained high natural levels of thoseelements. Levels of arsenic were well below the higherguideline and likely did not present a meaningfulrisk. Levels of fluoride above recommended guide-lines for domestic animals were not uncommon,however, the implications of observed concentrationsto wildlife are uncertain. Though well below guide-lines, sites using groundwater also had the highestvalues for TDS, particularly during summer monthswhen high evaporation rates concentrated solublesalts. Alkalinity levels that we observed represent arelatively minor concern (concentrations >500mg/liter can have a laxative effect).
Blue-Green Algae – we collected monthly samplesof surface algae, benthic algae, and phytoplanktonfrom 5 different types of water developments (nat-ural tinajas, modified tinajas, catchments, wells,and developed springs) from January to December2001. Algae cells were identified to the genus leveland counted. We conducted monthly tests (Aprilthrough October, 2002–2003) of water samplesfrom those sites for the toxins microcystin (variantsLR, LA, RR, and YR) and nodularin, using anenzyme-linked immunoassay (ELISA) test (#ET-022, Envirologix, Inc., Portland, Maine).
Wildlife water developments supported diversealgal communities. We found 82 genera in theDivisions Chlorophyta (39 genera), Cyanophyta(20 genera), Chrysophyta (17 genera), Euglenophyta(4 genera), and Pyrrophyta (2 genera). We found 8genera of blue-green algae (Oscillatoria, Lyngbya,Microcystis, Nostoc, Phormidium, Anabena,Gleotrichia, and Schizothrix) that contain toxin-producing species. However, because algae were identified only to genus, it is unknown whethertoxin-producing species were actually present.
Blue-green algae occurred in all types of waterdevelopments, but most frequently in springs,catchments, and tinajas. Relative abundance ofblue-green algae was low compared to other algaethat were present. Drinking troughs and tinajaswith shade roofs had significantly lower total algalgrowth and abundance of blue-green algae than didsimilar unshaded waters.
Despite the prevalence of blue-green algae, associ-ated toxins were absent. All water samples werenegative for microcystin and nodularin (belowELISA detection limit of 0.3 parts per billion).Wildlife water developments do not appear to provide suitable conditions for development oftoxic blooms that can cause poisoning of animals.Reported wildlife mortalities have occurred onlakes and other large bodies of water that had near-permanent, heavy standing crops of blue-greenalgae during summer months. Such conditions didnot occur at wildlife waters we studied, which hadsmall surface areas and very low abundance ofblue-green algae. Dense surface mats of filamentousalgae were common and persistent at some wildlifewaters; however these algae do not produce toxinsthat pose a risk to wildlife.
Wildlife Diseases and Mortalities
Hemorrhagic Disease Vectors – biting midges(genus Culicoides) are vectors of viruses that causethe hemorrhagic diseases bluetongue (BTV) andepizootic hemorrhagic disease (EHDV) in muledeer, desert bighorn sheep, and other ungulates.
Known hemorrhagic disease vector (Culicoides sonorensis)and potential vector (Culicoides mohave). Wildlife waterdevelopments appear to have little, if any, influence on thedistribution and reproduction of these biting midges.
AZFGD—Research Branch Technical Guidance Bulletin No. 8
10
Because larval Culicoides develop in saturatedsand or soil, it has been suggested that wildlifewater developments may provide developmentalhabitat for midges and also facilitate spread of diseases among ungulates using these facilities.
We captured and identified adult Culicoides atwildlife water developments and unwatered comparison areas from April through October2001–2003. Female midges of known or suspectedvector species were tested for BTV and EHDVusing polymerase chain reaction (PCR) and virusisolation. We collected saturated substrate samples(sand, mud, or coarse sediments) from tinajas andother potential larval development sites (waste-water and water storage ponds) from June throughOctober 2002–2003. Any larvae present wereextracted and reared to adults for identification(different species of Culicoides cannot be reliablydistinguished in their larval forms).
We captured 5 species of Culicoides, including aknown vector for BTV and EHDV (C. sonorensis),a suspected vector (C. mohave), and 3 non-vectorspecies (C. cacticola, C. cochisensis, and C.stonei). C. sonorensis and C. mohave were widelydistributed and locally abundant at both wateredand unwatered sites, primarily in the western portion of the study area. Both species occurred>20 km from known or suspected larval develop-ment sites, a far greater dispersal distance thanpreviously reported.
All tests for BTV and EHDV in the known vectorC. sonorensis were negative. A large proportion(39%) of C. mohave samples yielded PCR-positivesfor EHDV. However, subsequent sequencing of PCRproducts did not confirm these results and all virusisolations were negative. Consequently, the role ofC. mohave as an EHDV vector remains unknown.
Optimum larval development habitat for C.sonorensis consists of fine silt or mud at the marginsof standing water that is brackish or heavilyenriched with animal manure (e.g., from domesticlivestock). Larval C. sonorensis were abundant inwater treatment brine ponds that provided the former condition. A few C. sonorensis larvae werefound in 1 sample from a tinaja that had abundant
fine silt at the water margin. However, the othertinajas we sampled did not provide suitable larvaldevelopment habitat, having water with low levelsof dissolved salts, mostly rock or coarse gravelsubstrates at the water margins, and minimal inputsof animal feces, primarily from mule deer or desertbighorn. We found a west-east gradient in theabundance of adult C. mohave, with the highestconcentration in the westernmost portion of the studyarea. Preliminary evidence suggests that larvaldevelopment habitats for this species are located inwetlands along the Gila and Colorado Rivers, andadults are dispersing long distances with prevailingwesterly and southwesterly winds.
Water-borne Pathogens – during epizootic out-breaks of trichomoniasis, large numbers of deadand dying doves are sometimes found near watersources, particularly in urban areas. Birdbaths andother backyard water sources can harbor thecausative organism, the protozoan parasiteTrichomonas gallinae. Thus, it has been suggestedthat wildlife water developments in wildland areascould also play a role in spreading that disease.
We collected monthly water samples (Aprilthrough October 2002–2003) from wildlife waterdevelopments on the study area (natural tinajas,modified tinajas, catchments, wells, and developedsprings) and tested them for Trichomonas. In summer2003, we collected water samples from wildlifewater developments in west-central Arizona(Kingman area), where sick and dying mourningdoves were found during a trichomoniasis outbreak.Samples were cultured using InPouch™ TF testpouches (BioMed Diagnostics, San Jose, California)and examined for presence of trichomonads(motile protozoans).
All cultures for Trichomonas were negative. Theprotozoan was absent in all water samples from thesouthwestern Arizona study area as well as thosecollected during the Kingman area trichomoniasisoutbreak. Our results and those of other studiessuggest that wildlife water developments may notprovide suitable environments for persistence andtransmission of Trichomonas. Under experimentalconditions, trichomonads do not appear to survivein water for periods >24 hours. Mortality from

AZFGD—Research Branch Technical Guidance Bulletin No. 8
11
exposure to ultraviolet radiation and predation byother microorganisms are 2 factors that may limitpersistence of Trichomonas in wildlife water devel-opments and other aquatic environments.
Wildlife Mortalities – published literature containsanecdotal observations of mule deer, bighorn, andother animals that apparently became entrappedand drowned in wildlife water developments. Thus,it has been suggested that these developments mayrepresent a significant risk to animals that visit them.
Over the course of our research (1999–2003), weconducted >600 visits to wildlife water develop-ments located on the study area. Visits occurredyear round, but were concentrated during summermonths when wildlife use of developed waters wasgreatest. During each visit, we inspected the wateritself and the surrounding area for dead animals oranimal remains.
We recorded 19 incidents of wildlife mortalities.There were 5 mortality events of large mammals (3 involving 1–3 mule deer, 1 involving a bighornsheep, and 1 involving a coyote), all of whichoccurred at natural or modified tinajas. Theremaining mortality events involved birds, smallmammals, and reptiles and occurred at varioustypes of wildlife waters. Those mortalities included1 woodrat, 1 pocket mouse, 2 unidentified bats, 5mourning doves, 2 northern flickers, 1 house finch,and 4 unidentified lizards. We did not necropsyrecovered animals, but all were found floating inthe water and presumed to have drowned. Natural
tinajas with steep sides can entrap and cause mor-talities of desert bighorn and other vertebrates.Such “trap tanks” are relatively uncommon andusually modified by installation of escape steps orramps after mortalities are documented. Our sampledid not include known trap tanks, however, the smallnumber of observed mortalities suggests that non-trap tinajas and other types of water developmentsdo not present a significant drowning risk to wildlife.Because some animals visiting catchments bring inprey or scavenged food, previous studies that countedanimal remains in drinkers may have overestimateddrowning events.
Native And Nonnative Pollinators
The addition of human-made water sources isbelieved to have increased abundance of non-nativehoneybees in southwestern U.S. deserts. Watertransported by worker bees is used to cool the hiveduring hot summer periods and is critical to survivalof the colony. Expansion of the range of feral hon-eybees, particularly the Africanized variety, mayhave important consequences for native beesbecause of potential competition for nectar andpollen resources.
To assess the prevalence of Africanized bees, wecollected feral honeybees at 54 wildlife waterdevelopments located across the study area in June2000. We determined genetic origin of the beesusing mitochondrial DNA (mtDNA). To assess watereffects on feral honeybees and native bees, weestablished arrays of bee traps at varying distances
Mountain lion-killed mule deer found near tinaja. Wildlifemortalities from predation or drowning at wildlife waterswere very uncommon.
Feral Africanized honeybees watering at catchment trough.While abundant near wildlife waters, feral honeybees donot appear to exclude native bees.

AZFGD—Research Branch Technical Guidance Bulletin No. 8
12
from 4 wildlife water developments from February2001 through February 2002. The traps simulatedthe appearance of a large flower, capturing andpreserving both feral honeybees and native bees.
Africanized bees were present at all collection sites.The majority of bees collected (87%) possessedAfrican mtDNA, and non-Africanized strains wererelatively uncommon. Western European, EasternEuropean, and Egyptian mtDNA were present in6%, 4%, and 3% of collected bees, respectively.
The study areasupported anextremelydiverse nativebee community,1 of the richestdocumented todate in NorthAmerica. Ourtrapping effortyielded >200species, includ-ing several notpreviously
described. Not surprisingly, honeybees showed astrong relationship with water, being most abundantnear wildlife water developments and diminishingrapidly with increasing distance from water (Figure7). However, the diversity and abundance of nativebees was unaffected by distance from water developments (Figure 7). If competition occurred
between feral and native bees, we would haveexpected fewer species and individuals of nativebees close to water where honeybees were mostabundant and could have dominated available floralresources (nectar and pollen). No such relationshipwas apparent.
MANAGEMENT CONSIDERATIONS
Wildlife water developments are an effective andappropriate wildlife management tool in arid envi-ronments, particularly during periods of drought.The importance of water developments is likely toincrease as urbanization, highways, and otherdevelopments continue to fragment wildlife habitats and populations. We offer the followingrecommendations for resource managers involvedin planning, construction, and maintenance ofwildlife water developments:
1. Wildlife water developments are used by a broadvariety of game and nongame wildlife, whichshould be a consideration when locating thesefacilities. Characteristics of the surroundinghabitat are particularly important to bats; watersources in rocky uplands and canyon areas willreceive the greatest use.
2. Water surface area and accessibility are importantto bats and likely other species as well. We recom-mend additional work to examine how bats and otherspecies use deep, buried troughs at newer design,passive flow (non-float valve) catchment systems.
3. Wildlife water developments are used year round,with peak visitation by wildlife during the monthsof May, June, and July. We encourage managersto design and maintain waters in a manner thatensures year-round availability of water, particu-larly during periods of drought. Newer catchmentdesigns can maximize water collection and storageefficiency and minimize evaporative loss. Suchsystems, when properly designed, typically donot require supplemental water hauling, exceptduring prolonged drought. Reducing or eliminatinguse of supplemental hauled water will improveoverall water quality and reduce potential problemsassociated with arsenic, fluoride, dissolved salts,and other groundwater constituents.
4. Tinajas and potholes should be designed in amanner that allows easy ingress and egress, thus
200
180
160
140
120
100
80
60
40
20
0
Aver
age
num
ber c
aptu
red
per t
rap
Honeybees Native bees Native bee species
10 m500 m1000 m
Figure 7. Effect of distance to water on feral honeybeesand native bees.
Pan trap used to sample pollinators.Feral honeybees and native bees areattracted to the large yellow funnelthat mimics the appearance of aflower.

AZFGD—Research Branch Technical Guidance Bulletin No. 8
13
minimizing potential water quality problemsassociated with entrapment and decompositionof large animals. Steep-sided basins should beequipped with ramps or steps.
5. Frequency of flushing is an important factoraffecting water quality in tinajas and potholes.Where elevated dams and gabion structures areused, they should be designed in a manner thatallows regular flushing during runoff events andreduces accumulation of organic matter.
6. Where compatible with visual objectives andother planning considerations, we suggest placingshade roofs over troughs and tinajas to reducealgae growth and water loss to evaporation. Whereroofs cannot be used, we recommend shadingusing natural features present on-site and orientingtroughs to minimize solar radiation input.
7. Organic debris, dead animals, floating algae, and accumulated sediment should be regularlyremoved from water development troughs. Apreferred approach is to drain the trough andshovel out accumulated material. Where this isnot feasible, much of the suspended and settledorganic material can be removed using a poolskimmer and shovel.
8. To reduce habitat suitability for larval Culicoides,modified tinajas and other types of wildlifewater developments should be designed andmaintained in a manner that reduces accumulationof silt and mud at the water margin.
9. Africanized honeybees are widely distributed in wildland areas of southwestern Arizona.Individuals working or traveling in remotedesert areas should assume that all honeybeesencountered are Africanized and use appropriatecaution.
ACKNOWLEDGEMENTS
The research presented here was supported by aPittman-Robertson Federal Aid in WildlifeRestoration State Trust Grant to the Arizona Gameand Fish Department, Project W-78-R, and fundsprovided by the U.S. Army, Yuma Proving GroundConservation Program. The authors wish to thankthe following individuals whose contributions wereessential to the success of this project:
Susan Boe, Arizona Game and Fish Department,Research Branch – preparation of GIS maps.
Stephen Buchman and James Donovan, TheBeeWorks – collection and identification ofnative bees.
James Collins and Nancy McCulloch, Departmentof Veterinary Sciences and Microbiology,University of Arizona – PCR analysis ofCulicoides midges.
Ron Kearns, Ray Varney, and Susanna Henry,Kofa National Wildlife Refuge – logistical andfield support.
Junior Kerns, Conservation Program, White SandsMissile Range – project funding and field andlogistical support.
Valerie Morrill and Randy English, ConservationProgram, Yuma Proving Ground – project fundingand field and logistical support.
Steven Nelson and Dean Radtke, EnvironmentalResearch Laboratory, University of Arizona –identification of algae.
David Nielsen and Robert Page, Department ofEntomology, University of California, Davis –mitochondrial DNA analysis of feral honeybees.
Frank Ramberg, Department of MedicalEntomology, University of Arizona – rearing,identification, and sorting of Culicoides midges.
Carlos Reggiardo, Brooke Mourreale, andNatalie Furrey, Veterinary DiagnosticLaboratory, University of Arizona – water-bornepathogen analyses.
David Stallknecht and Daniel Mead,Southeastern Cooperative Wildlife DiseaseStudy, University of Georgia – virus isolationsfrom Culicoides midges.
AUTHOR INFORMATION
Steven Rosenstock has been with the Department’sResearch Branch since 1992. His current studiesfocus on water developments and other wildlifeconservation issues in southwestern Arizonadeserts. Michael Rabe has been with the Departmentsince 1994 and worked on the wildlife watersresearch project from 2000–2002. Chantal(Chasa) O’Brien has worked in Research Branch

AZFGD—Research Branch Technical Guidance Bulletin No. 8
14
since 2002, conducting studies of Sonoran pronghornand wildlife water developments in southwesternArizona. Robert Waddell has been with ResearchBranch since 2003, working on studies of wildlifewater developments, Sonoran pronghorn, and coyotehome range and habitat use.
SELECTED REFERENCES
Andrews, N.G.,V.C. Bleich, A.D. Morrison, L.M.Lesicka, and P.J. Cooley. 2001. Wildlife mortal-ities associated with artificial water sources.Wildlife Society Bulletin 29:275-280.
Broyles, B. 1995. Desert wildlife water developments:questioning use in the Southwest. Wildlife SocietyBulletin 23:663-675.
Burkett, D.W., and B.C. Thompson. 1994. Wildlifeassociation with human-altered water sources insemiarid vegetation communities. ConservationBiology 8:682-690.
CCME. 2002. Canadian water quality guidelinesfor the protection of agricultural water uses. In:Canadian Environmental Quality Guidelines2002. Canadian Council of Ministers of theEnvironment, Winnipeg.
Cutler, T.L., and M.L. Morrison. 1998. Habitat useby small vertebrates at two water developmentsin southwestern Arizona. SouthwesternNaturalist 43:155-162.
DeStefano, S., S.L. Schmidt, and J.C. deVos, Jr.2000. Observations of predator activity atwildlife water developments. Journal of RangeManagement 53:255-258.
deVos, J.C., Jr., and R.W. Clarkson. 1990. A historicreview of Arizona’s water developments withdiscussions on benefits to wildlife, water qualityand design considerations, p. 157-165. In: G.K.Tsukamoto and S.J. Stiver (editors), Proceedings:wildlife water development symposium. TheWildlife Society, USDI Bureau of LandManagement, and Nevada Department ofWildlife, Reno, Nevada.
Dupchak, K. 1999. Evaluating water quality forlivestock. Manitoba Agriculture, Food, and RuralInitiatives factsheet. World Wide Web documenthttp://www.gov.mb.ca/agriculture/livestock/nutri-tion/bza01s06.html (accessed 4/20/04).
Hedlund, C.A. 1996. Trichomonas gallinae inavian populations in urban Tucson, Arizona.M.Sc. Thesis, University of Arizona, Tucson.
Kocan, R.M. 1969. Various grains and liquid aspotential vehicles of transmission forTrichomonas gallinae. Bulletin of the WildlifeDisease Association 5:148-149.
Kubly, D.M. 1990. Limnological features of desertmountain rock pools, p. 103-120. In: G.K.Tsukamoto and S.J. Stiver (editors), Proceedings:wildlife water development symposium. TheWildlife Society, USDI Bureau of LandManagement, and Nevada Department ofWildlife, Reno, Nevada.
Lesicka, L.M., and J.J. Hervert. 1995. Low main-tenance water development for arid environments:concepts, materials, and techniques, p. 52-57.In: D.P. Young, R. Vinzant, and M.D. Strickland(editors), Proceedings: second wildlife watersymposium. Water for Wildlife Foundation,Laramie, Wyoming.
Mullens, B.A. 1991. Integrated management ofCulicoides variipennis: a problem of appliedecology, p. 896-905. In: T.E. Walton and B.I.Osbun (editors), Bluetongue, African horse sickness, and related orbiviruses: proceedings of the second international symposium. CRCPress, Boca Raton, Florida.
O’Gara, B.W., and J.D.Yoakum. 1992. Pronghornmanagement guides. USDI Fish and WildlifeService, Washington, D.C.
Peterson, H.G. 1999. Livestock and water quality.Agriculture and Agri-Food Canada, Prairie FarmRehabilitation Administration. World Wide Webdocument http://www.agr.gc.ca/pfra/water/livestck_e.htm (accessed 5/16/04).
Rosenstock, S.S., F. Ramberg, J.K. Collins, andM.J. Rabe. 2003. Culicoides mohave (Diptera:Ceratopogonidae): new occurrence records andpotential role in transmission of hemorrhagic dis-ease. Journal of Medical Entomology 40:577-579.
Rosenstock, S.S.,W.B. Ballard, and J.C. deVos,Jr. 1999. Viewpoint: benefits and impacts ofwildlife water developments. Journal of RangeManagement 52:302-311.
AZFGD—Research Branch Technical Guidance Bulletin No. 8
15
Runyan, C., and J. Bader. 1995. Water quality forlivestock and poultry. Cooperative ExtensionService Guide M-212, New Mexico StateUniversity, Las Cruces.
Schmidt, S.L., and S. DeStefano. 1999. Use ofwater developments by nongame wildlife in theSonoran Desert of Arizona. Arizona CooperativeFish and Wildlife Research Unit, University ofArizona, Tucson.
Schwimmer, M., and D. Schwimmer. 1968. Medicalaspects of phycology, p. 279-358. In: D.F. Jackson(editor), Algae, man, and the environment.Syracuse University Press, Syracuse, New York.
Soltanpour, P.N., and W.L. Raley. 1999. Livestockdrinking water quality. Cooperative ExtensionLivestock Series Leaflet No. 4.980, ColoradoState University, Fort Collins.
FOR MORE INFORMATION
Electronic copies of this report in Adobe AcrobatPDF format can be obtained from the senior author([email protected]). Printed copies can be obtainedby written request from the Arizona Game andFish Department, Research Branch/WMRS, 2221W. Greenway Rd., Phoenix, AZ 85023. Completeresults of research efforts summarized in this reporthave been submitted for publication in scientificjournals. Citations and reprints of those articles willbe available from the senior author after publication.Information on this and other Research Branchprojects can be found on the Department web site(www.azgfd.gov).
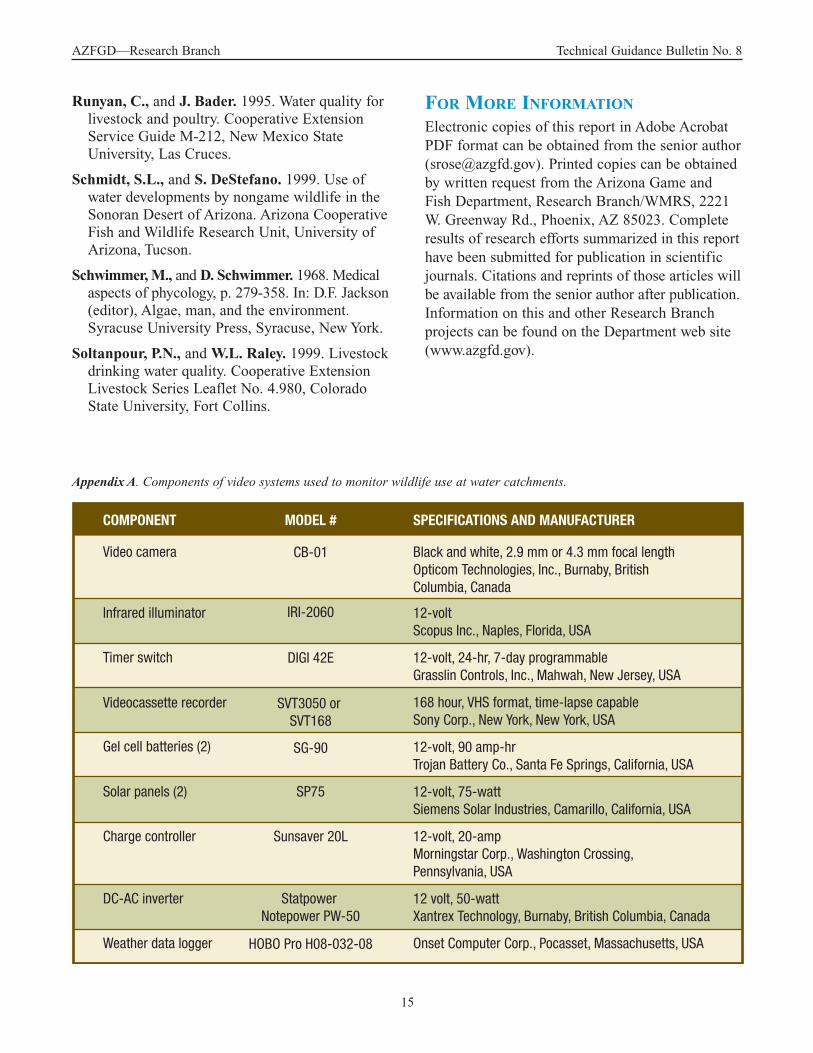
Appendix A. Components of video systems used to monitor wildlife use at water catchments.
COMPONENT MODEL # SPECIFICATIONS AND MANUFACTURER
Video camera
Infrared illuminator
Timer switch
Videocassette recorder
Gel cell batteries (2)
Solar panels (2)
Charge controller
DC-AC inverter
Weather data logger
CB-01 Black and white, 2.9 mm or 4.3 mm focal length Opticom Technologies, Inc., Burnaby, British Columbia, Canada
12-voltScopus Inc., Naples, Florida, USA
12-volt, 24-hr, 7-day programmableGrasslin Controls, Inc., Mahwah, New Jersey, USA
168 hour, VHS format, time-lapse capableSony Corp., New York, New York, USA
12-volt, 90 amp-hrTrojan Battery Co., Santa Fe Springs, California, USA
12-volt, 75-wattSiemens Solar Industries, Camarillo, California, USA
12-volt, 20-ampMorningstar Corp., Washington Crossing, Pennsylvania, USA
12 volt, 50-wattXantrex Technology, Burnaby, British Columbia, Canada
Onset Computer Corp., Pocasset, Massachusetts, USA
IRI-2060
DIGI 42E
SVT3050 or SVT168
SG-90
SP75
Sunsaver 20L
Statpower Notepower PW-50
HOBO Pro H08-032-08
Arizona Game and Fish Department MissionTo conserve, enhance, and restore Arizona’s diverse wildlife resources and habitats through aggressive protection and management programs, and to provide wildlife resources and safe watercraft and off-highwayvehicle recreation for the enjoyment, appreciation, and use by present and future generations.
The Arizona Game and Fish Department prohibits discrimination on the basis of race, color, sex, national origin, age, or disability in its programs and activities. If anyone believes they have been discriminated againstin any of AGFD’s programs or activities, including its employment practices, the individual may file a complaint alleging discrimination directly with AGFD Deputy Director, 2221 W. Greenway Rd., Phoenix,, AZ85023, (602) 789-3290 or U.S. Fish and Wildlife Service, 4040 N. Fairfax Dr., Ste. 130, Arlington, VA 22203.
Persons with a disability may request a reasonable accommodation, such as a sign language interpreter, orthis document in an alternative format, by contacting the AGFD Deputy Director 2221 W. Greenway Rd.,Phoenix, AZ 85023, (602) 789-3290, or by calling TTY at 1-800-367-8939. Requests should be made as earlyas possible to allow sufficient time to arrange for accommodation.
Suggested Citation:
Rosenstock, S.S., M.J. Rabe, C.S. O’Brien, and R.B. Waddell. 2004. Studies of wildlife water developments in southwestern Arizona: wildlife use, water quality, wildlife diseases, wildlife mortalities,and influences on native pollinators. Arizona Game and Fish Department, Research Branch TechnicalGuidance Bulletin No. 8, Phoenix. 15 pp.
Federal Aid in WildlifeRestoration Project W-78-Rfunded by your purchases of
hunting and shooting equipment