students survey 2002 report - economics network centre of the learning and teaching support network...
TRANSCRIPT

Economics Centre of the Learning and Teaching Support Network
Students Survey 2002 Report
A nationwide survey of students’ experiences
in studying Economics

ii
iii
Contents
Acknowledgements ....................................................................................................................iv
Economics LTSN Student Survey: Executive Summary........................................................... v
Purpose of the study................................................................................................................... 1
Background ................................................................................................................................ 2
Profile of survey respondents..................................................................................................... 3
Students’ overall assessment ...................................................................................................... 5
Responses to individual questions 1–27 .................................................................................... 7
Open-ended questions .............................................................................................................. 33
Factor scale analyses ................................................................................................................ 35
Correlation analysis .................................................................................................................. 40
Conclusions .............................................................................................................................. 42
Appendix 1: Text of the Survey............................................................................................... 45
Appendix 2: Percentage Respondents to Questions 1 to 27 .................................................... 49
Appendix 3: Analysis and representative quotations from the Survey.................................... 51
Q28: “Identify the best one or two aspects of your degree course and say why”................ 51
Q29: “Identify one or two aspects of your degree course that could be improved and say why.”.................................................................................................................................... 55
Q30: “What one or two aspects of your degree have you found the hardest?” ................... 60
Q31: Activities at seminars/tutorials, which participants found most useful ...................... 62
Q32: Activities in seminars/tutorials, which students found less useful. ............................ 69
Q33: Careers that students intended to pursue ..................................................................... 75

iv
Acknowledgements
We’d like to thank all the departments who agreed for their students to participate in the survey and forwarded our e-mail to them. We’d also like to thank all the students who took part in the survey and gave their time to complete the questionnaire.
We owe thanks to the ITL at the University of Sydney for letting us use their Questionnaire and Maggi Saven-Baden and Keith Trigwell for valuable consultations and advice. We’d like to thank Paul White and his colleagues, who bravely agreed to do statistical analyses for us.
The report was prepared by Inna Pomorina with help from John Sloman, Martin Poulter and the support of the whole Economics LTSN team.
v
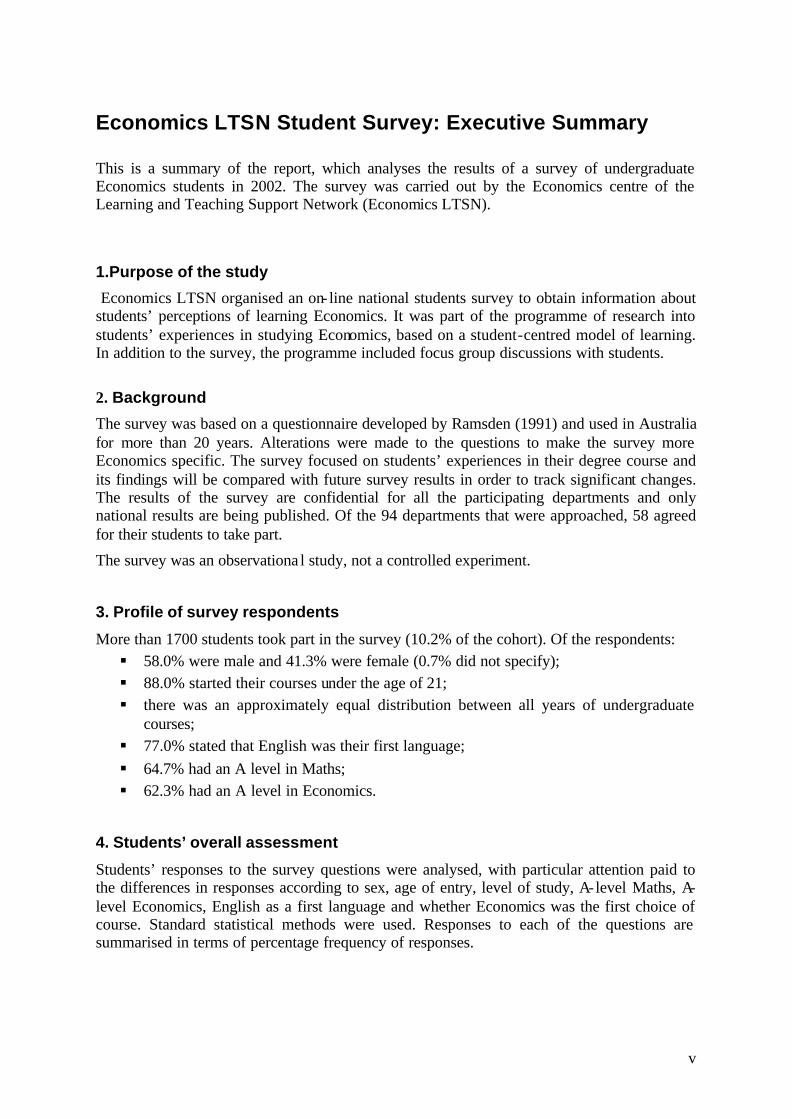
Economics LTSN Student Survey: Executive Summary
This is a summary of the report, which analyses the results of a survey of undergraduate Economics students in 2002. The survey was carried out by the Economics centre of the Learning and Teaching Support Network (Economics LTSN). 1.Purpose of the study
Economics LTSN organised an on- line national students survey to obtain information about students’ perceptions of learning Economics. It was part of the programme of research into students’ experiences in studying Economics, based on a student-centred model of learning. In addition to the survey, the programme included focus group discussions with students.
2. Background
The survey was based on a questionnaire developed by Ramsden (1991) and used in Australia for more than 20 years. Alterations were made to the questions to make the survey more Economics specific. The survey focused on students’ experiences in their degree course and its findings will be compared with future survey results in order to track significant changes. The results of the survey are confidential for all the participating departments and only national results are being published. Of the 94 departments that were approached, 58 agreed for their students to take part.
The survey was an observationa l study, not a controlled experiment.
3. Profile of survey respondents
More than 1700 students took part in the survey (10.2% of the cohort). Of the respondents: § 58.0% were male and 41.3% were female (0.7% did not specify); § 88.0% started their courses under the age of 21; § there was an approximately equal distribution between all years of undergraduate
courses; § 77.0% stated that English was their first language; § 64.7% had an A level in Maths; § 62.3% had an A level in Economics.
4. Students’ overall assessment
Students’ responses to the survey questions were analysed, with particular attention paid to the differences in responses according to sex, age of entry, level of study, A-level Maths, A-level Economics, English as a first language and whether Economics was the first choice of course. Standard statistical methods were used. Responses to each of the questions are summarised in terms of percentage frequency of responses.
vi
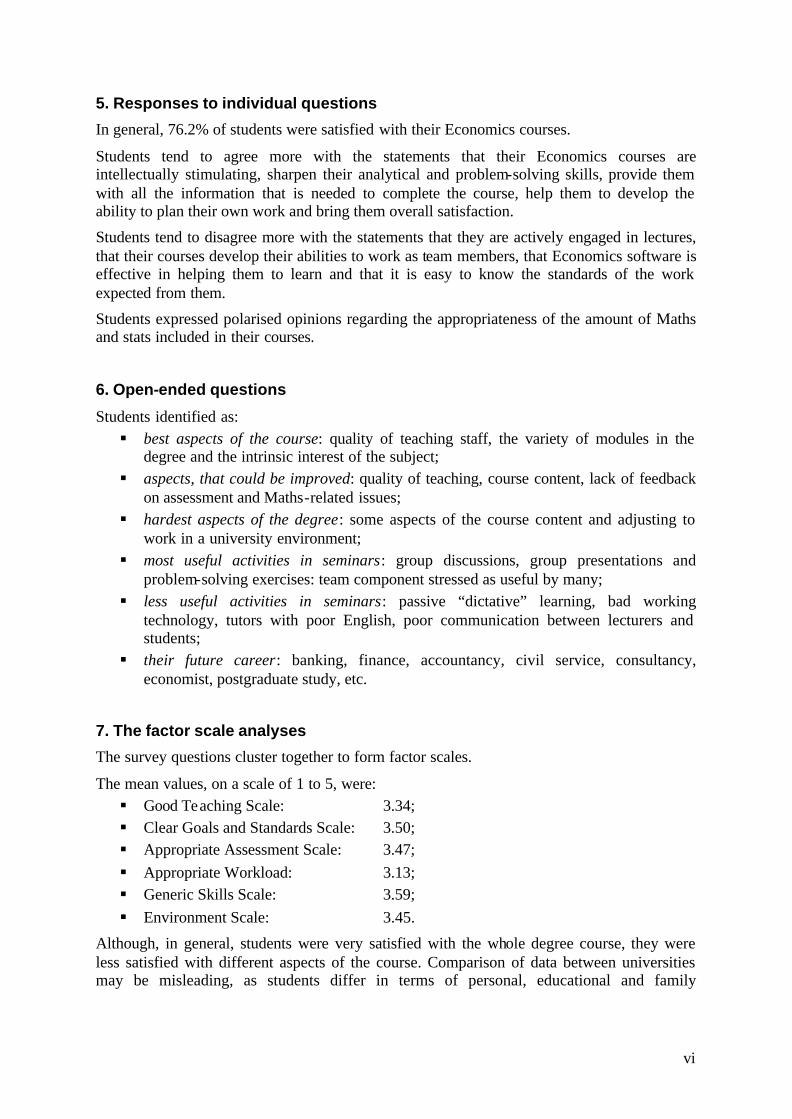
5. Responses to individual questions
In general, 76.2% of students were satisfied with their Economics courses.
Students tend to agree more with the statements that their Economics courses are intellectually stimulating, sharpen their analytical and problem-solving skills, provide them with all the information that is needed to complete the course, help them to develop the ability to plan their own work and bring them overall satisfaction.
Students tend to disagree more with the statements that they are actively engaged in lectures, that their courses develop their abilities to work as team members, that Economics software is effective in helping them to learn and that it is easy to know the standards of the work expected from them.
Students expressed polarised opinions regarding the appropriateness of the amount of Maths and stats included in their courses.
6. Open-ended questions
Students identified as: § best aspects of the course: quality of teaching staff, the variety of modules in the
degree and the intrinsic interest of the subject; § aspects, that could be improved: quality of teaching, course content, lack of feedback
on assessment and Maths-related issues; § hardest aspects of the degree: some aspects of the course content and adjusting to
work in a university environment; § most useful activities in seminars: group discussions, group presentations and
problem-solving exercises: team component stressed as useful by many; § less useful activities in seminars: passive “dictative” learning, bad working
technology, tutors with poor English, poor communication between lecturers and students;
§ their future career: banking, finance, accountancy, civil service, consultancy, economist, postgraduate study, etc.
7. The factor scale analyses
The survey questions cluster together to form factor scales.
The mean values, on a scale of 1 to 5, were: § Good Teaching Scale: 3.34; § Clear Goals and Standards Scale: 3.50; § Appropriate Assessment Scale: 3.47; § Appropriate Workload: 3.13; § Generic Skills Scale: 3.59; § Environment Scale: 3.45.
Although, in general, students were very satisfied with the whole degree course, they were less satisfied with different aspects of the course. Comparison of data between universities may be misleading, as students differ in terms of personal, educational and family

vii
backgrounds, which may have a profound effect on their perceptions of learning. The main value of the survey results lies in forming the basis for comparison with future survey results.
8. Correlation Analysis
With correlation analysis we discovered that the scales were not independent and there was a strong linear relationship between Good Teaching and Generic Skills Scales (r = 0.637). More moderate correlation existed between Good Teaching Scale and some other scales: Environment Scale (r = 0.581) and Clear Goals and Standards Scale (r = 0.544). Appropriate Workload Scale and Appropriate Assessment Scale have very poor correlation between themselves and with the rest of the scales. Students’ satisfaction with the course is positively related to the Good Teaching Scale and other scales, with the exception of Appropriate Assessment.
9. Conclusions
The conclusions summarise the results of the report and suggest that the main value of the survey will lie in its use in the longer term, as a base for tracing significant changes and patterns in students’ perceptions of learning Economics.
10. Appendixes
Appendix 1 includes the Economics LTSN students’ survey. Appendix 2 includes the Table of Responses to Questions 1 to 27. Appendix 3 includes representative answers to open-ended questions 28 to 33.

1
Purpose of the study
What do students think about studying Economics? What are the most rewarding aspects of their degree course? What aspects could be improved? Do they find their workload too heavy? What career do they intend to pursue? Are software, online materials and other innovations helping them to learn effectively? Do women and men view their learning experiences similarly? Does their age, previous qualifications or first language affect their attitudes to the course?
The Economics LTSN student survey was designed to answer questions like this, to provide lecturers and Economics departments with useful information and to encourage national discussions on teaching and learning issues within the Economics community. The last survey of Economics students in the UK took place at the beginning of the 1980s. Since that time, the teaching and learning environment has changed dramatically. The number of students has grown, but funding per student has more than halved and staff–student ratios have fallen from approximately 1:8 to 1:18. Teaching practices have changed, as has the theoretical understanding of teaching and learning processes. The effect has been a shift from a teacher- focused approach to a student- focused one. Since its establishment in 2000, the LTSN centre has had to rely upon anecdotal data to assess student experiences in learning Economics. The centre had already organised a survey of Economics lecturers in 2000 and a survey of Economics departments in 2001 and collected data on existing teaching practices, but it had no information about student perspectives on Economics teaching and learning in the UK. It was felt, therefore, that a systematic and thorough approach to information gathering from Economics students was needed.
Any system of student evaluation of teaching reflects the purposes and uses for which the evaluation is designed. Traditionally, students’ evaluations of teaching have been used as a source of feedback to support lecturers in planning improvements. For this purpose, they have focused on weaknesses and have thus normally relied, at least in part, on qualitative data. Now evaluations are also being used increasingly to help prove to external agencies that teaching in the department is of a high standard and, with this purpose in mind, tend to concentrate on strengths, not weaknesses. This leads to the development of different student evaluation systems to fulfil different functions. We were interested in both the ‘proving’ and the ‘improving’ functions of the survey and needed both qualitative and quantitative data (Barrie, 2001).
Student evaluations of teaching also reflect the understandings and conceptions of teaching and learning of those who design and use them. They, in turn, affect the choice and construction of questions in student surveys. After various consultations, a programme of research into students’ experiences in studying Economics was designed, based on a student-centred model of learning. The programme recognises that students determine the outcomes of learning, while being influenced by the teaching input. From this perspective, information about students’ perceptions of the usefulness of teaching in helping them to learn becomes very important and its collection was thus the focus of the survey. In addition to the survey, the research programme includes focus group discussions with students.

2
Background
The survey is based upon the Students Course Experience Questionnaire (SCEQ http://www.itl.usyd.edu.au/sceq/) that has been used for the past four years at Sydney University for undergraduates on all academic courses. SCEQ is itself based on a Course Experience Questionnaire (CEQ), possibly the best-researched student survey tool, which has been in use in Australia for more than 20 years. Paul Ramsden (1991) described the theory of teaching and learning that underlies the survey. It links students’ perceptions of courses to the learning outcomes. The Economics LTSN team reviewed SCEQ and suggested that a number of questions were not applicable to Economics students. So, alterations were made to it to make it more Economics-specific.
The survey focuses on students’ experiences of their degree course, not on a specific unit of study. The students were asked to think back on all their time spent at the university and to rate their agreement, along a five-point Likert scale, with 27 different statements regarding learning and teaching Economics. The statements have been shown to cluster together to form factor scales: the Good Teaching Scale (GTS), Clear Goals and Standards Scale (CGSS), Appropriate Workload Scale (AWS), Appropriate Assessment Scale (AAS), Generic Skills Scale (GSS) and Environment Scale (ES). Besides, there were additional items, concerning the students’ expectations of the whole degree course (Q1), students’ overall satisfaction with their degree course (Q27), and adequate inclusion of Maths and statistics in the course (Q11). Demographic information and free-text answers to six open-ended questions were also requested.
The survey was intended to provide valuable information on students’ perceptions of Economics courses, identifying the weak areas and more specific problems. In addition, the findings would be compared to future survey results to see if there have been any significant changes for better or worse. No comparison was made between different institutions, as there are too many variable factors to make such comparison meaningful.
All the Economics departments in UK higher education were invited to take part in the survey. A special letter was sent to the heads of departments stating that the results of the survey for their students would be confidential to their department. The organisers also presume that departments will use the results purely to reflect on their own practices. They have no intention for the survey to become a ranking exercise; the confidentiality of the results to departments, with only national aggregate results being available nationally, ensures that this will be so. Finally, 58 of 94 departments/schools approached agreed to their students taking part in the survey.
The survey was available online and, as an incentive for students to complete the survey, the centre offered five £50 prizes in a national draw.
A survey of Economics students is an observational study, not a controlled experiment. The respondents do not constitute a random sample of all Economics students in the UK, but rather a self-selected population, and as a result, their responses may not fully reflect the opinions of the entire student population. Despite the self-selection, however, there is important evidence that the attitudes expressed represent widely held student opinions. The survey reached a broad cross-section of the undergraduate student population. The demographics of the survey participants are similar to the demographics of the undergraduate student population (see below).
Measures were taken to promote the validity of responses. The participants were asked to submit their e-mail address to participate in the draw. The duplicate entries were excluded.

3
Profile of survey respondents
A total of 1,728 students took part in the survey from among 16,975 full- time Economics undergraduates in the UK (10.2%). The demographics of the survey participants can be compared to those of the survey population, using data from the HESA publication Students in Higher Education Institutions in 2000/1.
Figure 1 Characteristics of respondents: sex and age on course entry
Among the respondents, 41.3% were female, while among Economics students in general this percentage is lower at 33.3% (Figure 1). The larger proportion of female respondents is consistent with the widely reported survey research findings that females are more likely than males to return questionnaires.
In terms of age group, 88.0% of survey participants were under the age of 21 – exactly the same proportion as in the general population of Economics undergraduates (Figure 1).
Figure 2 Characteristics of respondents: course level and first language
The respondents were about equally divided between all three years of their undergraduate course: first year – 31.5%; second year – 30.6%; and final year – 32.5% (Figure 2). This is similar to the national distribution.
(20.9%)Not First Language
Missing ( 2.1%)
First Language (77.0%)
Whether English is First LanguagePercentage of Respondents According to
Final Year (32.5%)
Missing (5.4%)
First Year (31.5%)
Second Year (30.6%)
Percentage of Respondents by Level
Missing (0.8%)
26 or older (3.0%)
21-25 (8.2%)
18-20 (88.0%)
Percentage of Respondents by Age On Entry
M i s s i n g ( 0 . 7 % )
F e m a l e ( 4 1 . 3 % )
M a l e ( 5 8 . 0 % )
P e r c e n t a g e o f R e s p o n d e n t s b y S e x

4
In conclusion, it can be said that the demographic characteristics of survey respondents were similar to the national profile, and the survey may be considered fairly representative of UK Economics undergraduates. At the same time, we acknowledge the possible effects of partial response to the survey, particularly the possibility that those who did not respond to the survey might have answered differently from those who did.
The question of English as the first language was included in the survey because it was presumed to be an important variable that influences students’ experiences in studying Economics. Students for whom English was not their first language may have different experiences, not only because of possible language problems, but also because their training in schools may differ from that in the UK.
Seventy-seven per cent of respondents stated that English was their first language (Figure 2). There are no national statistics regarding this question. The closest match is the domicile of students. According to HESA, 67.6% of UK Economics undergraduates come from the United Kingdom and a further 17.0% come from the USA and Australia, for whom English is likely to be their first language. So the survey respondents by these criteria also match the general population.
Other aspects of the respondents’ background that are important to take into consideration while talking about students’ experiences are, first, whether or not they have studied Economics or Mathematics at A-level and, second, whether their current course was their first choice.
Figure 3 Characteristics of respondents: qualifications and choice of course
The results were as follows: 64.7% of the respondents had an A-level in Mathematics or equivalent and 62.3% had an A-level in Economics or equivalent. As far as choice of course
Missing (0.7%)
Without A-level (34.6%)
With A-level (64.7%)
Percentage of Respondents with A-level Maths
Missing (1.1%)
Without A-level (36.6%)
With A-level (62.3%)
Percentage of Respondents with A-level Economics
Missing (1.7%)
Not First Choice (20.9%)
First Choice (77.4%)
Choice of CoursePercentage of Respondents According to First

5
is concerned, 77.4% stated that their course was their first choice when applying to university (Figure 3).
We appreciate that students’ experiences vary according to the type of university they are attending. Universities have very different histories and resources to draw on. This is an interesting theme in its own right, and requires further investigation. It was not, however, considered as part of this survey.
We also have not included in the survey questions regarding the facilities provided by the university. Although various facilities, especially the library and computing, are very important to students’ perception of learning, they form a separate category and are usually surveyed centrally by the universities themselves. Some of the students, while answering a question about possible improvements, have asked for better library services: for example, ‘The limited number of course books available to us in the library has made research and extra reading difficult at times.’
Students’ overall assessment
In the analyses that follow, students’ responses to the survey questions are examined and differences in responses are sought due to sex, age on entry, level of study, A-level Mathematics, A-level Economics, English as a first language and first choice of course. All the data were analysed using standard statistical methods. Only relationships that are statistically significant at the 0.05 level are discussed.
Responses to each of the questions are summarised in terms of percentage frequency of responses. In each instance the outcome categories have been coded
1 – Strongly disagree
2 – Disagree
3 – Neutral
4 – Agree
5 – Strongly agree
Unless specifically mentioned, in the following analysis the term ‘agree’ is used for both ‘strongly agree’ and ‘agree’ answers and the term ‘disagree’ for both ‘strongly disagree’ and ‘disagree’ answers. To aid comparison, the mean and standard deviation for each question have been calculated by using the codes 1, 2, 3, 4 and 5 as if they were scores of 1, 2, 3, 4 and 5. The percentage responses for each category and summary statistics have been calculated using all of the available data, irrespective of whether some of the demographic information on the respondent is missing. Repeat analysis using only those respondents with complete records gives the same broad conclusions. Students’ qualitative remarks from the open-ended questions have been added to substantiate their quantitative answers.
Students tend to agree more with the statements describing Economics courses as intellectually stimulating, sharpening their analytical and problem-solving skills, providing them with all the information that is needed to complete the course, helping them to develop the ability to plan their own work and bringing them full satisfaction with the course.
Students tend to disagree more with statements concerning their active engagement in lectures, developing their abilities to work as team members. They do not feel that Economics

6
software is effective in helping them to learn and they do not find it easy to know the standards of the work expected from them. As will be shown later, the question of Maths and statistics prompted the greatest variability in scores and had the highest standard deviation (1.22). Students expressed polarised opinions about whether an adequate amount of Maths and statistics was included in their courses.

7
Responses to individual questions 1–27
Question 1 Studying this degree course has turned out to be much as I had expected.
In the first question, students were asked about their expectations of the whole degree course.
The data received showed that 58.5% agreed with the statement that ‘Studying the degree course has turned out to be much as I expected’, 19.4% were neutral on this statement and 22.2% disagreed with it. That means that nearly every fifth student of Economics is not sure whether studying the degree has turned out to be much as they expected, and another one in five students is sure that it has not turned out as they expected. We will not speculate here about why this has happened. It requires further investigation. In their answers to open-ended questions, some of the students gave their own explanations of the way the course differed from their expectations.
Table 1.1 Percentage response to ‘Studying the degree course has turned out to be much as I expected’, according to sex
Sex 1 2 3 4 5 N Mean Standard deviation
Female 1.7 23.2 19.6 50.0 5.5 710 3.34 0.950
Male 2.7 17.2 19.3 52.1 8.7 999 3.47 0.965
( 7.152 =χ df = 4, p < 0.01)
There are slight differences in the responses due to sex and whether English is their first language. Males were more likely than females to report their agreement with this statement; 60.8% of males compared to 55.5% of females.
Table 1.2 Percentage response to ‘Studying the degree course has turned out to be much as I expected’, according to whether English is the first language of the respondent
English first
1 2 3 4 5 N Mean Standard deviation
No 2.2 15.2 24.4 46.8 11.4 361 3.50 0.958
Yes 2.3 21.3 18.0 52.2 6.2 1328 3.39 0.963
( ,3.232 =χ df = 4, p < 0.001)
2.3
19.4
51.1
7.4
19.8
0% 20% 40% 60% 80% 100%
Strongly disagree
Disagree
Neutral
Agree
Strongly agree
.

8
Those for whom English is not the ir first language had more positive opinions about this statement than English speakers: 11.4% of them ‘strongly agreed’ with it, compared to only 6.2% of English speakers; and 17.4% of them disagreed with it, compared to 23.6% of English speakers. According to students’ remarks, some of them expected the course to be similar to Economics A-level and had not expected the level of Maths necessary for the course. Comments included ‘The level of Maths expected has been too high from the information they have given us’, ‘Personally what I liked about Economics at A-level was the critical analyses and discussion of theories and issues. It seems all I do here is work out formulas and assess data’ and ‘The Economics side of the course has not always been as relevant as I had hoped to reality.’ These responses suggest that some students would gain from fuller prior information about the courses they will be studying.
Question 2 The degree course is intellectually stimulating.
The number of students who ‘find [their] degree course intellectually stimulating’ is even higher, with 81.6% of respondents agreeing with the statement. Students from different levels seemed to view it slightly differently.
Table 2.1 Percentage response to ‘The degree course is intellectually stimulating’ according to level of study (undergraduate)
Level 1 2 3 4 5 N Mean Standard deviation
First year 2.4 5.6 13.8 56.5 21.7 536 3.89 0.89
Second year 0.6 5.7 10.9 57.2 24.6 521 3.98 0.82
Final year 1.1 6.0 7.4 57.8 27.7 552 3.81 1.07
( ,34.222 =χ df = 8, p < 0.01)
The higher the level of students’ studies, the more stimulating they find their course. So among first-year students 78.2% agreed with the statement, among second years 81.8% agreed, while among final-year students 85.5% agreed. Nearly all of the 7.2% increase in the agreement to this statement comes from the undecided group. But one in every 12–14 students does not find their course intellectually stimulating at any of the levels of study. Does it have to be that way? If not, what could be done to make it intellectually stimulating for all of them? In comments students stressed, ‘The course is interesting, and stimulating. It has given me a different perspective of the world in economic terms, helping me to formulate
1.5
10.9
57.1
24.5
6.0
0% 20% 40% 60% 80% 100%
Strongly disagree
Disagree
Neutral
Agree
Strongly agree
.

9
my own opinion on issues such as the euro’ and that they enjoyed ‘intellectual challenge and responsibility for my own work’.
Question 3 The workload is too heavy.
Responding to statement 3, ‘The workload is too heavy’, nearly half of the students (45.6%)
were neutral, while 29.6% disagreed and 24.6% agreed with it. Whilst clearly only a minority of students felt that the workload was too heavy, the neutrality of approximately half the students suggests that for them the workload was neither excessively heavy nor light. The evidence in the literature supports the general view that heavy workload promotes a surface approach to learning, meaning that the students are unable to spend the time to truly engage and understand the material they are meant to be learning. Students’ answers to this question require action from the departments if they want students to achieve desired outcomes.
The important variables for this question are age and language.
Table 3.1 Percentage response to ‘The workload is too heavy’, according to age on entry to course
Age 1 2 3 4 5 N Mean Standard deviation
18–20 3.1 26.3 47.0 18.3 5.3 1511 2.96 0.88
21–25 6.4 30.5 33.3 22.0 7.8 141 2.94 1.05
≥ 26 3.9 19.2 32.7 19.2 25.0 52 3.42 1.18
( ,1.472 =χ df = 8, p < 0.001)
The more mature students tend to judge their workload as heavier than the younger ones. For students in the 18–20 age group, 23.6% agree with the statement, for the 21–25 age group, 29.8% agree and for the group 26 or older, 44.2% agree.
Table 3.2 Percentage response to ‘The workload is too heavy’, according to whether English is the first language of the respondent
English first
1 2 3 4 5 N Mean Standard deviation
No 5.8 25.3 37.2 27.5 9.2 360 3.04 1.04
Yes 2.7 26.7 48.1 17.4 5.1 1324 2.96 0.87
( ,4.272 =χ df = 4, p < 0.001)
3.3
45.6
18.7
6.1
26.3
0% 20% 40% 60% 80% 100%
Strongly disagree
Disagree
Neutral
Agree
Strongly agree
.

10
The workload also seemed heavier if English was not the first language of the respondent: 36.7% of them agreed with the statement, compared to 22.5% of those for whom the first language was English. Students’ remarks on this issue were ‘The level is high and likewise the workload’ and ‘Work overload – perhaps don’t ask us to do so many things at once, spread work out more to alleviate workload.’
Question 4 The degree course has helped me develop my ability to work as a team member.
More students disagreed with the fourth statement, ‘The degree course has helped me to develop my ability to work as a team member’, than agreed: 38.2% compared to 36.2%. That means that more than a third of the students do not view their Economics courses as helping them to develop their ability to work as a team member. Given the increased stress on employability as a learning outcome, departments may wish to consider whether there is scope for increasing the opportunities for teamwork and group project work for their students. Students lacking A-level Maths have a more positive attitude on this matter: 39.6% of them agreed with this statement and 34.4% disagreed, while for those with A-level Maths the picture is the reverse: 40.2% of them disagreed with it and 34.4% agreed.
Table 4.1 Percentage response to ‘The degree course has helped me to develop my ability to work as a team member’ according to whether the respondent has A-level Mathematics
Maths A-level
1 2 3 4 5 N Mean Standard deviation
No 7.3 27.0 26.1 30.3 9.3 593 3.07 1.11
Yes 10.5 29.7 25.4 29.4 5.0 1111 2.88 1.09
( 8.162 =χ , df = 4, p < 0.01)
Students for whom English is not their first language are more undecided and less negative on this matter (32.8% neutral, 34.2% disagreed) than those for whom English was their first language (23.9% neutral, 39.2% disagreed).
9.4
25.6
29.8
6.4
28.8
0% 20% 40% 60% 80% 100%
Strongly disagree
Disagree
Neutral
Agree
Strongly agree
.

11
Table 4.2 Percentage response to ‘The degree course has helped me to develop my ability to work as a team member’, according to whether English is the first language of the respondent
English first
1 2 3 4 5 N Mean Standard deviation
No 10.6 23.6 32.8 26.1 6.9 360 2.95 1.09
Yes 9.2 30.0 23.9 30.8 6.1 1322 2.95 1.10
( 7.152 =χ , df = 4, p < 0.01)
Level of study is also related to students’ answers. In the first year only 29.5% agreed with the statement, while in the second year 40.6% agreed and in the final year 37.6 agreed with it. So students from the second year are more likely than others to agree that the course had helped them to develop their ability to work as team members.
Table 4.3 Percentage response to ‘The degree course has helped me to develop my ability to work as a team member’, according to level of study (undergraduate)
Level 1 2 3 4 5 N Mean Standard deviation
First year 9.4 32.3 26.8 24.4 5.1 533 2.86 1.07
Second year 7.9 25.2 26.4 34.8 5.8 520 3.05 1.07
Final year 11.0 28.3 23.1 28.7 8.9 562 2.96 1.17
( ,73.222 =χ df = 8, p < 0.01)
Students suggest that it could be useful to have ‘More teamwork or communication, because I believe many graduates finish an Economics degree with no communication skills’, and express their satisfaction with the group work: ‘The best aspect of the course is the strong involvement students get with one another.’
Question 5 I have usually had a clear idea of where I am going and what is expected of me in this degree course.
The majority of the students responded very positively to the fifth statement, ‘I have usually had a clear idea of where I am going and what is expected of me in my degree course’ – 63.5% agreed with it. There were no differences between various student groups. At the same
3.7
19.4
52.6
10.9
13.4
0% 20% 40% 60% 80% 100%
Strongly disagree
Disagree
Neutral
Agree
Strongly agree
.

12
time, a fifth of students are undecided on this question and a sixth lack a clear idea of where they are going and what is expected of them in their degree course. This suggests that departments may wish to give greater clarification of the aims, learning objectives and standards of their courses, since clarity of goals and standards is associated with better learning outcomes. Students’ remarks include ‘A better explanation of what is required at the start of the degree would have helped me, in terms of essays and general work standard’ and also ‘Knowing exactly what criteria essays are graded on’ could be very useful. Students suggest ‘The department should explain what it expects from you at exams, i.e. by providing feedback instead of expecting students to guess why their technique is wrong.’
Question 6 I am provided with all the information I need about the course (e.g. timetables, exam dates and regulations).
The sixth statement, ‘I am provided with all the information I need about the course (e.g. timetables, exam dates and regulations’ received the highest positive response: 82.1% agreed with it. Every twelfth student disagreed with this statement, implying that they are not happy with the administration of the course. There were no differences reported between various student groups. Although the majority of students are clearly satisfied with the administration of the course (‘Very clearly structured and deadlines are made clear’), some complained that ‘The administration of our course is often sloppy, it takes time to receive timetables at the start of each term and examination timetables are out just 1–2 weeks before they begin.’
Question 7 The teaching staff of this degree course motivate me to do my best work.
Nearly half of the students (47.6%) agreed with the seventh statement, ‘The teaching staff on this degree course motivate me to do my best work’. But at the same time nearly every third student is undecided on this question and more than a fifth do not find staff motivating them to do their best work. The more mature students are more positive on this issue.
1.9
9.4
46.4
35.7
6.6
0% 20% 40% 60% 80% 100%
Strongly disagree
Disagree
Neutral
Agree
Strongly agree
.
4.3
30.3
37.1
10.5
17.8
0% 20% 40% 60% 80% 100%
Strongly disagree
Disagree
Neutral
Agree
Strongly agree
.

13
Table 7.1 Percentage response to ‘The teaching staff on this degree course motivate me to do my best work’, according to age on entry
Age 1 2 3 4 5 N Mean Standard deviation
18–20 4.2 18.3 31.9 35.8 9.8 1513 3.29 1.01
21–25 5.6 16.2 18.3 49.3 10.5 142 3.43 1.06
≥ 26 3.8 7.7 17.3 42.3 28.9 52 3.85 1.06
( ,1.392 =χ df = 8, p < 0.001)
From the 18–20 age group, 45.6% of respondents agreed with the statement, while for the 21–25 age group 59.8% agreed and for the 26 or older group 71.2% agreed. Students have written, ‘They [teachers] are enthusiastic and I feel that that helps we to study much harder’ and ‘The majority of my lecturers are excellent, their passion for the subject helps me work hard at something I would usually not be interested in.’ Some of the students are not impressed with their lecturers: ‘I wish the lectures were more stimulating…’ ‘Had two bad lecturers last year – impedes interest in subject and doesn’t exactly improve attendance/understanding of topics.’
Question 8 The teaching staff normally give me helpful feedback on my work (oral and/or written).
More than half of the students – 52.4% of them – agreed with the eighth statement, ‘The teaching staff normally give me helpful feedback on my work (oral and/or written).’ A quarter of all students were not sure about the helpful feedback and more than one in five do not receive it. Students’ answers to this question reveal an area of possible future improvements. Again the age of the students influenced their answers to this question.
Table 8.1 Percentage response to ‘The teaching staff normally give me helpful feedback on my work (oral and/or written)’, according to age
Age 1 2 3 4 5 N Mean Standard deviation
18–20 5.8 17.4 25.6 41.3 9.9 1511 3.32 1.06
21–25 4.2 13.4 25.4 46.5 10.5 142 3.46 0.99
≥ 26 3.9 9.6 15.4 44.2 26.9 52 3.81 1.07
( ,6.202 =χ df = 8, p < 0.01)
5.7
25.2
41.8
10.6
16.7
0% 20% 40% 60% 80% 100%
Strongly disagree
Neutral
Strongly agree
.

14
From the 18–20 age group, 51.3% agreed with the statement, compared to 57.0% from the 21–25 group and 71.1% from the 26 or older group. Many students reported disappointment with the level of feedback they received and asked for ‘More written feedback on unassessed course assignments. These exercises are futile if all you receive is a mark without any description of how it could be improved’, and ‘I would like more feedback on work submitted in order to gauge the standard and style of work expected in the examinations.’
Question 9 The degree course has sharpened my analytical skills.
Nearly three-quarters of the students (73.2%) agreed with the ninth statement, ‘The degree course has sharpened my analytical skills.’ One in six were undecided and one in ten did not feel that the course had sharpened their analytical skills.
Table 9.1 Percentage response to ‘The degree course has sharpened my analytical skills’, according to sex
Sex 1 2 3 4 5 N Mean Standard deviation
Female 0.7 9.4 19.1 53.4 17.3 710 3.77 0.87
Male 1.2 8.5 15.3 50.9 24.1 997 3.88 0.91
( 5.142 =χ , df = 4, p < 0.01)
Gender influenced students’ opinions slightly: females’ responses (70.7% agreement) were less positive than males’ (75.0%). Also, fewer respondents report their analytical skills sharpening in the first year (59.1%) compared to the second year (75.4%) or final year (83.3%).
Table 9.2 Percentage response to ‘The degree course has sharpened my analytical skills’, according to level of study (undergraduate)
Level 1 2 3 4 5 N Mean Standard deviation
First year 1.1 14.4 25.4 45.9 13.2 536 3.56 0.93
Second year 0.8 7.7 16.2 55.0 20.4 520 3.87 0.85
Final year 1.1 5.0 10.6 54.2 29.1 562 4.05 0.86
( ,1.1022 =χ df = 8, p < 0.001)
1.0
16.9
51.9
21.3
8.9
0% 20% 40% 60% 80% 100%
Strongly disagree
Disagree
Neutral
Agree
Strongly agree
.

15
While writing about the activities that they found useful in seminars and tutorials, students mentioned ‘Interactive debates, that encourage critical thinking and help understanding the subject’ and pointed to the best aspect of the degree course: ‘I learnt to challenge authorities. I form and defend my own views and opinions instead of merely absorbing information.’
Question 10 The degree course has developed my problem-solving skills.
A majority of the respondents (68.2%) agree with the tenth statement, ‘The degree course has sharpened my problem-solving skills.’ But again every fifth student was undecided and one in nine did not report a sharpening of problem-solving skills. Students on higher levels of study responded more positively to this statement.
Table 10.1 Percentage response to ‘The degree course has sharpened my problem-solving skills’, according to level of study (undergraduate)
Level 1 2 3 4 5 N Mean Standard deviation
First year 1.1 15.4 25.5 46.8 11.2 534 3.52 0.92
Second year 0.8 8.7 18.9 54.8 16.8 518 3.78 0.85
Final year 1.0 6.4 17.4 53.2 22.0 562 3.89 0.86
( ,1.562 =χ df = 8, p < 0.001)
So, 58.0% of the first years agree with the question, 71.6% of the second years and 75.2% of students in their final year. Students often mentioned how they enjoyed problem solving in the tutorials: ‘Solving problems, solving questions, etc. basically making the students understand what they don’t understand’ and also ‘Problem-solving exercises are extremely useful as long as they are set at the right level (which isn’t always the case).’
Question 11 The degree course contains too much Maths and stats.
1.1
20.9
51.2
17.0
9.8
0% 20% 40% 60% 80% 100%
Strongly disagree
Disagree
Neutral
Agree
Strongly agree
.
10.0
25.5
17.9
15.2
31.4
0% 20% 40% 60% 80% 100%
Strongly disagree
Disagree
Neutral
Agree
Strongly agree
.

16
The eleventh statement, ‘The degree course contains too much Maths and stats’, was included because over the years a general impression had arisen that Economics undergraduates have negative attitudes towards the amount of Maths and statistics included in their course.
Answers to this question showed that students are more positive towards Maths and statistics than anticipated. A total of 41.4% of respondents disagreed with the statement, while about one-third agreed with it and more than a quarter were neutral. Answers to this question were influenced by various characteristics of the students. There were differences in agreement with this statement according to whether the respondents had A-level Maths or not, whether they had A-level Economics or not, and whether English was their first language or not.
Table 11.1 Percentage response to ‘The degree course contains too much Maths and stats’, according to whether the respondent has A-level Mathematics
Maths A-level
1 2 3 4 5 N Mean Standard deviation
No 4.6 24.2 27.1 20.7 23.4 594 3.34 1.21
Yes 12.8 35.4 24.8 16.2 10.7 1115 2.76 1.18
( 7.882 =χ , df = 4, p < 0.001)
Among students with A-level Mathematics, nearly half (48.2%) disagreed with the statement, compared to 28.8% of those who do not have the qualification.
Table 11.2 Percentage response to ‘The degree course contains too much Maths and stats’, according to whether English is the first language of the respondent
English first
1 2 3 4 5 N Mean Standard deviation
No 11.9 30.2 31.0 15.5 11.4 361 2.84 1.17
Yes 9.4 31.7 23.9 18.6 16.4 1325 3.00 1.24
( ,7.132 =χ df = 4, p < 0.01)
The situation is similar for those who do not have English as a first language. Only 26.9% of them agree with the statement, while the agreement among those with English as a first language is higher at 35.0%. But the situation is different for those who have A-level Economics.
Table 11.3 Percentage response to ‘The degree course contains too much Maths and stats’, according to whether the respondent has A-level Economics
Econ 1 2 3 4 5 N Mean Standard deviation
No 11.3 34.8 27.9 14.9 11.1 630 2.80 1.16
Yes 9.1 29.5 24.4 19.6 17.4 1072 3.10 1.25
( ,7.222 =χ df = 4, p < 0.001)

17
The data show a higher level of disagreement with the statement (46.2%) among those who do not have A-level Economics than among those who have the qualification (38.6%). There was also a difference in responses between students of different levels.
Table 11.4 Percentage response to ‘The degree course contains too much Maths and stats’, according to level of study (undergraduate)
Level 1 2 3 4 5 N Mean Standard deviation
First year 10.5 31.3 23.5 18.8 15.9 536 2.98 1.25
Second year 7.7 30.1 25.0 18.0 19.2 521 3.11 1.24
Final year 10.8 32.9 27.7 17.2 11.4 562 2.85 1.17
( ,2.172 =χ df = 8, p < 0.05)
Among those who agreed were 28.4% of final-year and 34.7% of first-year students, but 37.2% of second-year students. Maths was a frequently occurring topic in student responses to the open-ended questions, usually in complaints about the subject being too mathematical, about prior assurances that A-level Maths was not necessary for the course, and about there being insufficient help for those without A-level Maths. Students suggested, ‘More Maths in 1st and 2nd year, to make transition to the 3rd year smoother’ and ‘Too much time is spent going over mathematical problems. Students with difficulties in this area have the opportunity of a Maths workshop which is specifically for their use.’ However, others disagree: ‘There is too much Maths in the courses – especially in the compulsory courses.’
Question 12 My degree course has stimulated my enthusiasm for further learning.
The majority of the students (56.3%) agreed with the statement, ‘My degree course has stimulated my enthusiasm for further learning.’ However, this was not the case for every sixth student and more than a quarter of the students were undecided on this matter. The important variables for this question are age, Economics A-level and whether English is their first language.
4.3
25.6
42.6
13.7
13.8
0% 20% 40% 60% 80% 100%
Strongly disagree
Disagree
Neutral
Agree
Strongly agree
.

18
Table 12.1 Percentage response to ‘My degree course has stimulated my enthusiasm for further learning’, according to age on entry
Age 1 2 3 4 5 N Mean Standard deviation
18–20 4.7 14.6 25.6 42.5 12.6 1511 3.44 1.04
21–25 2.1 8.4 26.1 45.1 18.3 142 3.69 0.94
≥ 26 0.0 7.7 23.1 40.4 28.8 52 3.90 0.91
( ,0.222 =χ df = 8, p < 0.01)
The enthusiasm of the mature students was stimulated more by their degree course than that of their younger colleagues, with 69.2% of those older than 26 agreeing with this statement, compared to 63.4% from the 21–25 age group and 55.1% from the 18–20 age group.
Table 12.2 Percentage response to ‘My degree course has stimulated my enthusiasm for further learning’, according to whether the respondent has A-level Economics
Econ A level
1 2 3 4 5 N Mean Standard deviation
No 3.8 11.4 24.3 42.7 17.8 630 3.59 1.03
Yes 4.6 15.1 26.2 42.8 11.3 1071 3.41 1.02
( ,2.172 =χ df = 4, p < 0.01)
Students with A-levels in Economics (54.1% agreement) responded less positively to this statement than those without (60.5% agreement).
Table 12.3 Percentage response to ‘My degree course has stimulated my enthusiasm for further learning’, according to whether English is the first language of the respondent
English first
1 2 3 4 5 N Mean Standard deviation
No 2.8 7.5 23.6 45.0 21.1 360 3.59 0.97
Yes 4.8 15.6 26.4 42.0 11.2 1325 3.39 1.03
( ,1.382 =χ df = 4, p < 0.001)
Having English as a first language also influenced replies: 53.2% of these students agreed with the statement, compared to 66.1% of those for whom English was not their first language. Answering a question about what career the students would like to pursue, a group of students said that they would like to continue their education: ‘I strongly wish to go on studying Economics’ and ‘I wanted to do a PhD in Economics – now I'm not so sure as Economics is very, very hard (though it's still great).’

19
Question 13 It is always easy to know the standard of work expected.
The students were not so certain about statement 13, ‘It is always easy to know the standard of work expected’: 35.2% of them disagreed, 27.8% were neutral and 37.0% agreed with it. Greater clarity here by departments, which might involve more individual support, could help students to appreciate the standard required of them and to achieve better results.
Table 13.1 Percentage response to ‘It is always easy to know the standard of work expected’, according to whether the respondent has A-level Mathematics
Maths A-level
1 2 3 4 5 N Mean Standard deviation
No 5.3 29.0 24.5 34.5 6.8 589 3.34 1.05
Yes 6.0 29.7 29.6 31.1 3.6 1114 2.97 1.00
( 9.132 =χ , df = 4, p < 0.01)
Those who have A-level Maths were more negative in their response. Only 34.7% of them agreed with the statement, compared to 41.3% of those lacking A-level Maths. The situation was similar for those with English as a first language: 36.5% of them disagreed with the statement, compared to 30.0% of those with a different first language.
Table 13.2 Percentage response to ‘It is always easy to know the standard of work expected’, according to whether English is the first language of the respondent
English first
1 2 3 4 5 N Mean Standard deviation
No 3.9 26.1 29.2 33.6 7.2 360 3.14 1.01
Yes 6.3 30.2 27.6 32.2 3.8 1320 2.97 1.01
( ,2.122 =χ df = 4, p < 0.05)
In their remarks, students asked for improvements in ‘Mark schemes for coursework and exams so you know what is expected of you’ and for ‘Better information before the first exam about what it is going to be like, since it was very different from the class tests and tutorials.’
5.7
27.8
32.3
4.7
29.5
0% 20% 40% 60% 80% 100%
Strongly disagree
Disagree
Neutral
Agree
Strongly agree
.
20
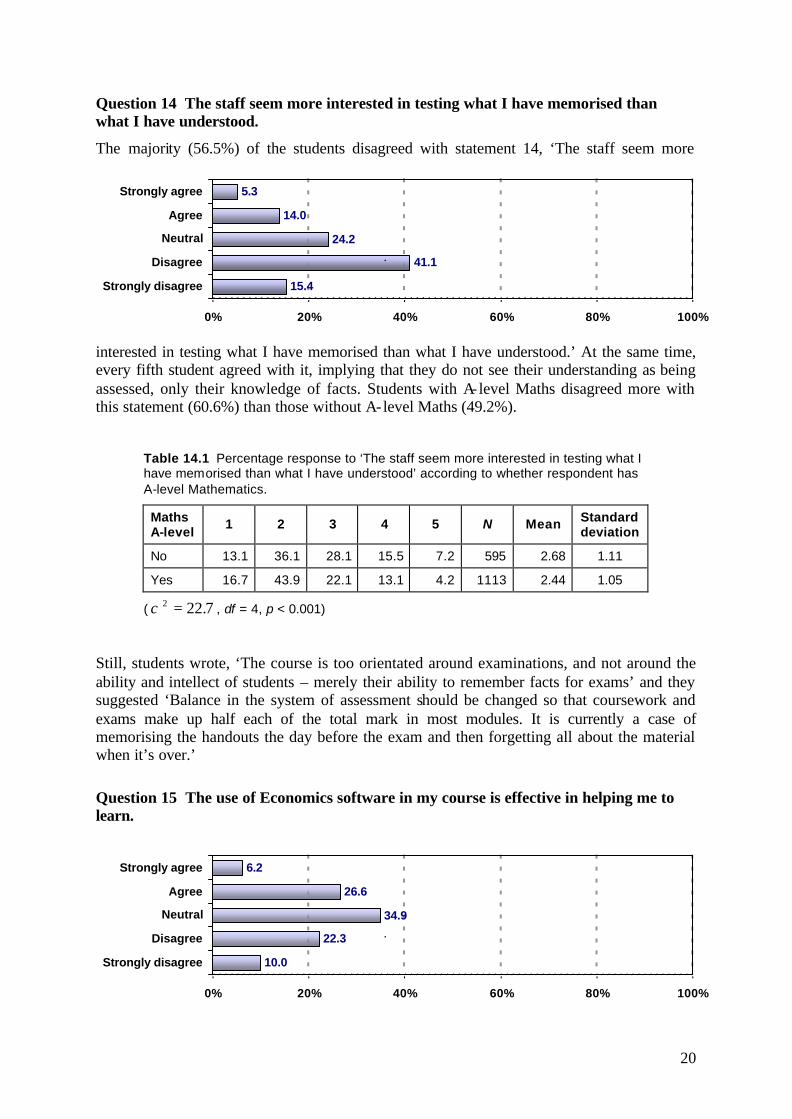
Question 14 The staff seem more interested in testing what I have memorised than what I have understood.
The majority (56.5%) of the students disagreed with statement 14, ‘The staff seem more
interested in testing what I have memorised than what I have understood.’ At the same time, every fifth student agreed with it, implying that they do not see their understanding as being assessed, only their knowledge of facts. Students with A-level Maths disagreed more with this statement (60.6%) than those without A-level Maths (49.2%).
Table 14.1 Percentage response to ‘The staff seem more interested in testing what I have memorised than what I have understood’ according to whether respondent has A-level Mathematics.
Maths A-level
1 2 3 4 5 N Mean Standard deviation
No 13.1 36.1 28.1 15.5 7.2 595 2.68 1.11
Yes 16.7 43.9 22.1 13.1 4.2 1113 2.44 1.05
( 7.222 =χ , df = 4, p < 0.001)
Still, students wrote, ‘The course is too orientated around examinations, and not around the ability and intellect of students – merely their ability to remember facts for exams’ and they suggested ‘Balance in the system of assessment should be changed so that coursework and exams make up half each of the total mark in most modules. It is currently a case of memorising the handouts the day before the exam and then forgetting all about the material when it’s over.’
Question 15 The use of Economics software in my course is effective in helping me to learn.
15.4
24.2
14.0
5.3
41.1
0% 20% 40% 60% 80% 100%
Strongly disagree
Disagree
Neutral
Agree
Strongly agree
.
10.0
34.9
26.6
6.2
22.3
0% 20% 40% 60% 80% 100%
Strongly disagree
Disagree
Neutral
Agree
Strongly agree
.

21
Students were mostly undecided when responding to statement 15, ‘The use of Economics software in my course is effective in helping me to learn’: 34.9% were neutral, compared to 32.3% who disagreed with it and 32.8% who agreed. That means that only one-third of the students find the use of Economics software effective in helping them to learn. Departments might wish to look closely at this issue given the rapid development of e-learning and the importance of developing C&IT skills.
Table 15.1 Percentage response to ‘The use of Economics software in my course is effective in helping me to learn’, according to age on entry
Age 1 2 3 4 5 N Mean Standard deviation
18–20 10.4 22.5 35.6 26.2 5.3 1509 2.94 1.05
21–25 6.3 22.5 26.8 31.7 12.7 142 3.22 1.12
≥ 26 7.7 19.2 36.5 21.2 15.4 52 3.17 1.15
( ,2.262 =χ df = 8, p < 0.01)
Age influenced students’ response to this question. The mature students were less negative with 26.9% of those 26 or older disagreeing with it, compared to 32.9% of those from the 18–20 age group. The most positive were the 21–25 age group: 44.4% of them agreed with the statement. Among the students’ remarks were the following: ‘In tutorials, working with computer programs is least useful because during tutorial they crash down, as result learning nothing’ and, as an example of least useful activities, ‘Using econometrics computer programmes to try and teach us the subject before we’d established the appropriate theory’. Others find useful ‘Terminal sessions in computing/prog to help put into practice what we have learnt.’ Students suggest, ‘Further integration of IT, accessing reading on- line from outside the university would be helpful.’
Question 16 The pace of my course is too fast.
Nearly half of the students (45.5%) disagreed with statement 16, ‘The pace of the course is too fast.’ One-third of the students were undecided about it, while more than one in five agreed with it. That actually means that less then half of all the students are satisfied with the pace of the course. The evidence from the research into student learning suggests that high pace will stimulate students to adopt a surface rather than deep approach to learning. The disagreement is higher among younger students: 46.0% of those coming from the 18–20 age group compared to 30.8% of those 26 or older.
4.0
32.4
18.2
3.8
41.5
0% 20% 40% 60% 80% 100%
Strongly disagree
Disagree
Neutral
Agree
Strongly agree
.

22
Table 16.1 Percentage response to ‘The pace of the course is too fast’, according to age on entry
Age 1 2 3 4 5 N Mean Standard deviation
18–20 4.0 42.0 32.5 18.5 3.0 1512 2.75 0.91
21–25 5.6 39.5 28.9 19.7 6.3 142 2.82 1.02
≥ 26 1.9 28.9 38.5 9.6 21.1 52 3.19 1.14
( ,4.532 =χ df = 8, p < 0.001)
Level of study had an opposite effect on this question.
Table 16.2 Percentage response to ‘The pace of the course is too fast’, according to level of study (undergraduate)
Level 1 2 3 4 5 N Mean Standard deviation
First year 4.8 38.2 28.1 23.1 5.8 537 2.87 1.01
Second year 2.9 41.8 37.2 16.2 1.9 519 2.72 0.84
Final year 4.4 44.9 31.9 15.4 3.4 562 2.68 0.90
( ,85.332 =χ df = 8, p < 0.001)
Final-year students tended to disagree more (49.3%) than second-year students (44.7%) and first-year students (43.0%).
Table 16.3 Percentage response to ‘The pace of the course is too fast’, according to whether English is the first language of the respondent
English
first 1 2 3 4 5 N Mean
Standard deviation
No 6.7 33.3 30.5 21.4 8.1 360 2.91 1.06
Yes 3.3 44.2 32.5 17.4 2.6 1326 2.72 0.88
( ,5.412 =χ df = 4, p < 0.001)
The other factor that influenced students’ replies to this question was the first language. Those for whom English was not their first language tended to agree slightly more with this statement (29.5% agreement) than those whose first language was English (20.0%). Students remark, ‘Everything taught at a very rapid pace, impossible to keep up with all reading’ and ‘Small breaks during the term time would be helpful to digest some hard topics immediately instead of leaving till end of the term.’ Some of them find, ‘Pace too slow – needs to be more than one lecture as some are struggling while others are held back by the slower pupils.’
23
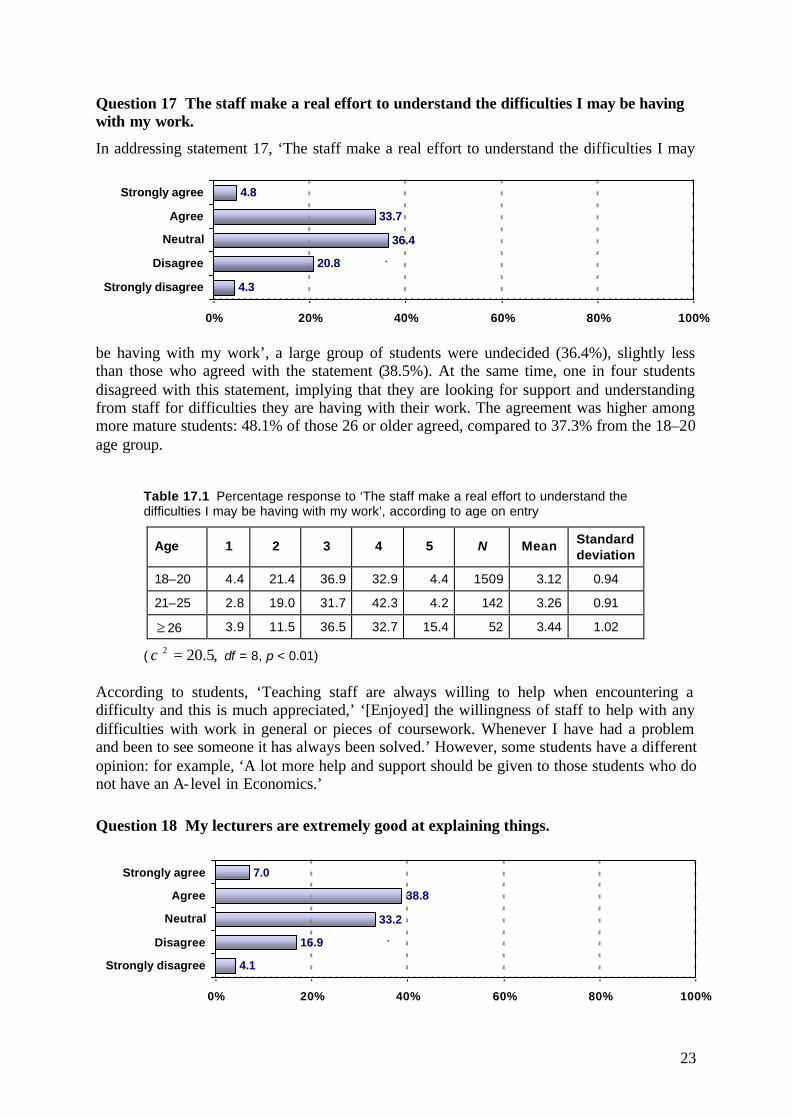
Question 17 The staff make a real effort to understand the difficulties I may be having with my work.
In addressing statement 17, ‘The staff make a real effort to understand the difficulties I may
be having with my work’, a large group of students were undecided (36.4%), slightly less than those who agreed with the statement (38.5%). At the same time, one in four students disagreed with this statement, implying that they are looking for support and understanding from staff for difficulties they are having with their work. The agreement was higher among more mature students: 48.1% of those 26 or older agreed, compared to 37.3% from the 18–20 age group.
Table 17.1 Percentage response to ‘The staff make a real effort to understand the difficulties I may be having with my work’, according to age on entry
Age 1 2 3 4 5 N Mean Standard deviation
18–20 4.4 21.4 36.9 32.9 4.4 1509 3.12 0.94
21–25 2.8 19.0 31.7 42.3 4.2 142 3.26 0.91
≥ 26 3.9 11.5 36.5 32.7 15.4 52 3.44 1.02
( ,5.202 =χ df = 8, p < 0.01)
According to students, ‘Teaching staff are always willing to help when encountering a difficulty and this is much appreciated,’ ‘[Enjoyed] the willingness of staff to help with any difficulties with work in general or pieces of coursework. Whenever I have had a problem and been to see someone it has always been solved.’ However, some students have a different opinion: for example, ‘A lot more help and support should be given to those students who do not have an A-level in Economics.’
Question 18 My lecturers are extremely good at explaining things.
4.3
36.4
33.7
4.8
20.8
0% 20% 40% 60% 80% 100%
Strongly disagree
Disagree
Neutral
Agree
Strongly agree
.
4.1
33.2
38.8
7.0
16.9
0% 20% 40% 60% 80% 100%
Strongly disagree
Disagree
Neutral
Agree
Strongly agree
.

24
Positive responses dominate for statement 18, ‘My lecturers are extremely good at explaining things’: 45.8% of the students agreed with this. At the same time, more than a third of the students were undecided on this matter and one in five students disagreed with it. Although this represents a minority of students, the size of the minority suggests that departments might wish to devote more time to staff development targeted at improving lecturers’ explanatory and presentational skills.
Gender influenced students’ responses: males (49.6% agreement) were more positive than females (40.5%). Also, mature students were more positive: 67.3% of those 26 or older agreed with the statement compared to 44.2% from the 18–20 age group.
Table 18.1 Percentage response to ‘My lecturers are extremely good at explaining things’, according to sex
Sex 1 2 3 4 5 N Mean Standard deviation
Female 4.1 19.4 36.0 35.4 5.1 709 3.18 0.94
Male 4.1 15.0 31.3 41.4 8.2 993 3.34 0.97
( 1.172 =χ , df = 4, p < 0.05)
Table 18.2 Percentage response to ‘My lecturers are extremely good at explaining things’, according to age on entry
Age 1 2 3 4 5 N Mean Standard deviation
18–20 4.2 17.4 34.2 37.6 6.6 1507 3.25 0.96
21–25 3.5 15.5 27.5 46.5 7.0 142 3.38 0.95
≥ 26 3.9 7.7 21.1 51.9 15.4 52 3.67 0.96
( ,9.172 =χ df = 8, p < 0.05)
Students for whom English was the first language were slightly more negative on this question (24.1% disagreement) than those for whom it was not (20.0%).
Table 18.3 Percentage response to ‘My lecturers are extremely good at explaining things’ according to whether English is the first language of the respondents
English first
1 2 3 4 5 N Mean Standard deviation
No 5.8 18.3 29.2 36.1 10.6 360 3.27 1.06
Yes 3.6 16.4 34.6 39.9 5.5 1325 3.27 0.92
( ,6.182 =χ df = 4, p < 0.001)
A majority of students enjoyed ‘The quality of the lecturers, because they are skilled at explanation’, but there were also critical remarks: ‘Some lecturers could be more encouraging, explanatory and less dictatorial.’

25
Question 19 The teaching staff stimulate my interest in their subject.
More than half of the students (51.6%) agreed with statement 19, ‘The teaching staff stimulate my interest in their subject.’ At the same time, nearly a third of them were undecided on this question and one in six disagreed. The important variables for this question are gender and age of entry.
Table 19.1 Percentage response to ‘The teaching staff stimulate my interest in their subject’, according to sex
Sex 1 2 3 4 5 N Mean Standard deviation
Female 2.8 18.0 29.5 43.3 6.4 709 3.32 0.94
Male 3.7 12.5 30.7 44.1 9.0 993 3.42 0.95
( 5.132 =χ , df = 4, p < 0.01)
Male students are more positive than females: 53.1% compared to 49.7%. Mature students are more positive than the younger ones: 69.3% of those 26 or older agree with the statement, as opposed to only 50.7% in the 18–20 age group.
Table 19.2 Percentage response to ‘The teaching staff stimulate my interest in their subject’, according to age on entry
Age 1 2 3 4 5 N Mean Standard deviation
18–20 3.5 15.2 30.6 43.5 7.2 1507 3.36 0.94
21–25 2.8 15.5 26.8 43.7 11.3 142 3.46 0.98
≥ 26 1.9 1.9 26.9 50.0 19.3 52 3.82 0.83
( 4.192 =χ df = 8, p < 0.05)
Among the remarks were: ‘Enthusiasm shown by lecturers is infectious, I certainly am inspired by the enthusiasm shown by lecturers for their individual subjects. It's extremely motivating.’ At the same time, some of the lecturers or seminar leaders are seen as unable to create enthusiasm for the subject: ‘Some tutors seem less interested in teaching, and so I feel as if I am wasting my time at such seminars.’
3.4
30.2
43.7
7.9
14.8
0% 20% 40% 60% 80% 100%
Strongly disagree
Disagree
Neutral
Agree
Strongly agree
.

26
Question 20 I feel that I am actively engaged in most lectures.
A majority of students (41.3%) disagreed with statement 20, ‘I feel that I am actively engaged in most lectures.’ Only one-third of students agreed with it, while a quarter were undecided. Active engagement in lectures and tutorials is an important part of a deep approach to learning, which most departments seek to encourage. Staff development sessions in the promotion of active and deep learning would help to address this issue.
Table 20.1 Percentage response to ‘I feel that I am actively engaged in most lectures’, according to age on entry
Age 1 2 3 4 5 N Mean Standard deviation
18–20 10.3 33.2 26.2 26.0 4.3 1506 2.81 1.07
21–25 6.3 24.7 19.7 40.1 9.2 142 3.21 1.11
≥ 26 3.9 11.5 15.4 46.1 23.1 52 3.73 1.07
( ,5.722 =χ df = 8, p < 0.001)
The important variables for this question were age, A-level Maths, and English as a first language. Mature students are more positive regarding this question: 69.2% of those 26 or older agree with it, while only 30.3% agree from the 18–20 age group.
Table 20.2 Percentage response to ‘I feel that I am actively engaged in most lectures’, according to whether the respondent has A-level Mathematics
Maths A-level
1 2 3 4 5 N Mean Standard deviation
No 8.3 26.9 27.3 30.8 6.7 594 3.01 1.09
Yes 10.6 34.2 24.6 26.2 4.4 1109 2.80 1.08
( 4.162 =χ df = 4, p < 0.01)
Those who have A-level Maths were less positive (30.6% agreement) than those who have not (37.5%). Those who have English as their first language were less positive (29.8% agreement) than those who have not (45.7%).
9.7
25.5
27.9
5.3
31.6
0% 20% 40% 60% 80% 100%
Strongly disagree
Disagree
Neutral
Agree
Strongly agree
.

27
Table 20.3 Percentage response to ‘I feel that I am actively engaged in most lectures’, according to whether English is the first language of the respondents
English first
1 2 3 4 5 N Mean Standard deviation
No 8.6 21.2 24.5 34.3 11.4 359 3.19 1.15
Yes 9.9 34.6 25.7 26.3 3.5 1321 2.79 1.05
( 48.572 =χ , df = 4, p < 0.001)
Students stressed that ‘The course could be improved if the method of teaching by the lecturer could be more stimulating, interesting and easier to understand’ and suggested that ‘The format of lectures should be such that handouts are distributed, and where writing is limited to just filling in a few blank spaces. This would help to ensure that students remain attentive and actually come to the lectures.’ ‘Boring lectures are the worst – they can make the most interesting topics appear incredibly dull, which is frustrating – they should receive some basic training on lecturing!’
Question 21 I feel that I am actively engaged in most seminars/tutorials.
Students were more positive in response to statement 21, ‘I feel that I am actively engaged in most seminars/tutorials’: 66.1% agreed with this. At the same time, one in seven students did not feel actively engaged in seminars, while one in six were undecided. Active engagement in tutorials is an important strategy for students who are looking to learn and is part of the deep approach to learning. The important variable for this question is whether their course was their first choice or not.
Table 21.1 Percentage response to ‘I feel that I am actively engaged in most seminars/tutorials’, according to whether current course was first choice
First choice
1 2 3 4 5 N Mean Standard deviation
No 5.0 12.6 20.4 50.0 12.0 358 3.51 1.02
Yes 3.0 12.2 17.6 48.5 18.7 1327 3.68 1.01
( 2.122 =χ , df = 4, p < 0.001)
If the course was not the student’s first choice, they tend to agree less (62.0%) than those for whom it was (67.2%). Students enjoyed ‘Activities that involve a high level of group interactivity, but that actually relates to the course. Not interactivity for the sake of interactivity.’ Some consider ‘Interactive seminars are the most successful.’
3.4
18.2
48.9
17.2
12.3
0% 20% 40% 60% 80% 100%
Strongly disagree
Disagree
Neutral
Agree
Strongly agree
.
28
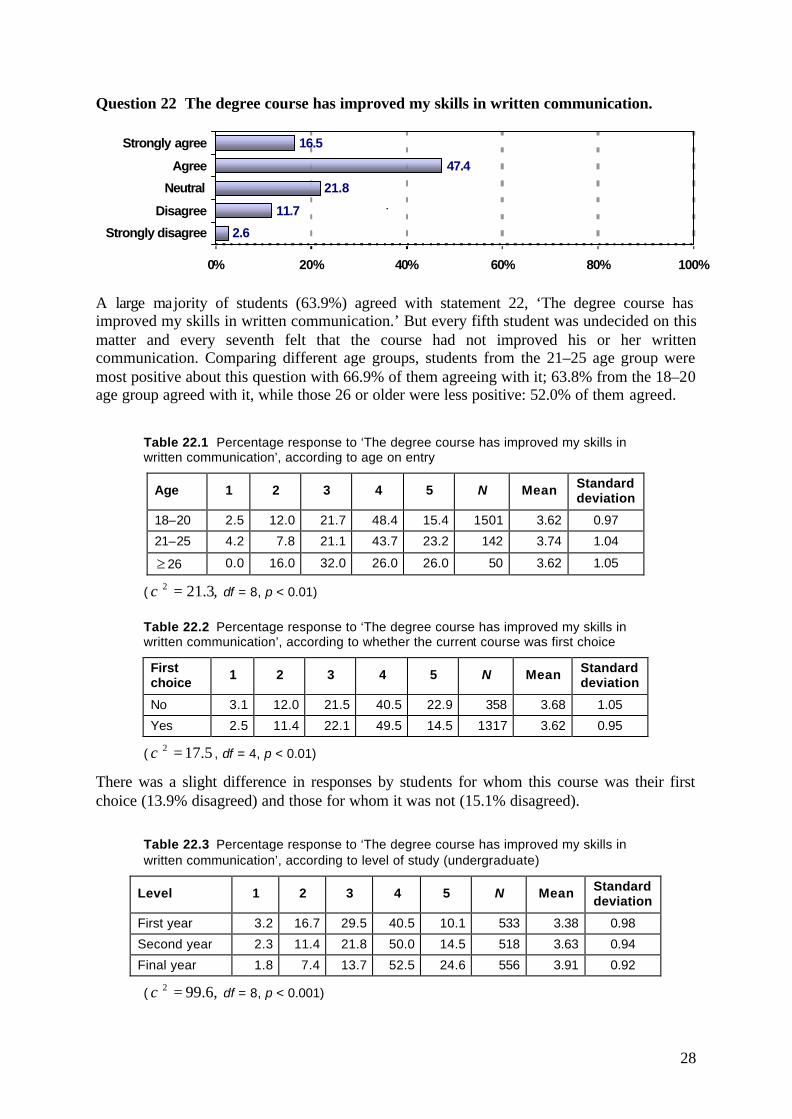
Question 22 The degree course has improved my skills in written communication.
A large majority of students (63.9%) agreed with statement 22, ‘The degree course has improved my skills in written communication.’ But every fifth student was undecided on this matter and every seventh felt that the course had not improved his or her written communication. Comparing different age groups, students from the 21–25 age group were most positive about this question with 66.9% of them agreeing with it; 63.8% from the 18–20 age group agreed with it, while those 26 or older were less positive: 52.0% of them agreed.
Table 22.1 Percentage response to ‘The degree course has improved my skills in written communication’, according to age on entry
Age 1 2 3 4 5 N Mean Standard deviation
18–20 2.5 12.0 21.7 48.4 15.4 1501 3.62 0.97
21–25 4.2 7.8 21.1 43.7 23.2 142 3.74 1.04
≥ 26 0.0 16.0 32.0 26.0 26.0 50 3.62 1.05
( ,3.212 =χ df = 8, p < 0.01)
Table 22.2 Percentage response to ‘The degree course has improved my skills in written communication’, according to whether the current course was first choice
First choice
1 2 3 4 5 N Mean Standard deviation
No 3.1 12.0 21.5 40.5 22.9 358 3.68 1.05
Yes 2.5 11.4 22.1 49.5 14.5 1317 3.62 0.95
( 5.172 =χ , df = 4, p < 0.01)
There was a slight difference in responses by students for whom this course was their first choice (13.9% disagreed) and those for whom it was not (15.1% disagreed).
Table 22.3 Percentage response to ‘The degree course has improved my skills in written communication’, according to level of study (undergraduate)
Level 1 2 3 4 5 N Mean Standard deviation
First year 3.2 16.7 29.5 40.5 10.1 533 3.38 0.98
Second year 2.3 11.4 21.8 50.0 14.5 518 3.63 0.94
Final year 1.8 7.4 13.7 52.5 24.6 556 3.91 0.92
( ,6.992 =χ df = 8, p < 0.001)
2.6
21.8
47.4
16.5
11.7
0% 20% 40% 60% 80% 100%
Strongly disagree
Disagree
Neutral
Agree
Strongly agree
.

29
Another important factor is the level of study. At the highest level, more students seemed to agree with this statement: of the first years 50.6% agreed with it, of the second years 64.5% agreed and of the final-year students 77.1% agreed. Students suggested possible improvements: ‘More study skills, such as essay writing, should form an integral part of the course’ and some even complain, ‘I don’t feel we are asked to submit enough written work (e.g. essays). I feel this doesn’t prepare me well for exams where essays are compulsory.’
Question 23 My degree course has helped me to develop my ability to plan my own work.
Reponses to statement 23, ‘My degree course has helped me to develop my ability to plan my own work’, were even more positive: 71.6% of the students agreed with it. Still, every fifth student was undecided on this question. The answers were slightly different for different levels of study.
Table 23.1 Percentage response to ‘My degree course has helped me to develop my ability to plan my own work’ according to level of study (undergraduate)
Level 1 2 3 4 5 N Mean Standard deviation
First year 2.8 9.8 27.0 48.2 12.2 533 3.57 0.92
Second year 1.2 6.4 18.6 53.5 20.3 516 3.85 0.85
Final year 0.9 5.5 13.6 53.8 26.2 560 3.99 0.84
( ,76.692 =χ df = 8, p < 0.001)
The final-year students were the most positive about it with 80.0% agreeing, while 60.4% of the first-year students and 73.8% of the second-year students agreed. Students find time management one of the hardest aspects of their course. ‘Managing my time, it’s a big jump from being at school as you are left to your own devices all the time at University’ and ‘Organising my work for myself rather than having teachers to organise it for me’ are representative answers to ‘What one or two aspects of your degree have you found the hardest?’
1.7
19.5
52.3
19.3
7.2
0% 20% 40% 60% 80% 100%
Strongly disagree
Disagree
Neutral
Agree
Strongly agree
.

30
Question 24 It has been made clear to me right from the start of each module/unit what is required of me.
Statement 24, ‘It has been made clear to me right from the start of each module/unit what is required of me’, received a positive response from 52.7% of the students. More than one in four were undecided and one in five disagreed. That means that nearly half of the students were not clear from the start of each of their modules about what was required from them. And if the students are not clear on the module requirements, their learning outcomes will inevitably suffer.
No significant differences among various student groups were found. Students wrote, ‘I felt that for the first and final year the course was very clear, I knew what was going on in relation to the context of the work and what was expected. However, in the second year I did not feel as if I understood what was going on, in the modules, the work was very jumbled; learning one thing and then jumping to something else. There was no clear logical structure to the work that was taught’ as well as ‘Sometimes the course objectives were a little unclear.’
Question 25 I feel part of a group of students and staff committed to learning.
About a third of all students were undecided about statement 25, ‘I feel part of a group of students and staff committed to learning’; one in five students disagreed with the statement, while 47.6% of them were positive. That means that more than half of all students do not feel part of a group of students and staff committed to learning, or are unsure about it. This is something that departments may wish to address in a variety of ways, from group projects and other activities, to support arrangements and social interactions.
The response was different between the groups of students for whom the course was their first choice and others for whom it was not. Among the latter, 40.2% were positive and 34.4% neutral. For the former, 49.7% were positive and 31.2% neutral.
3.3
26.1
43.9
8.8
17.9
0% 20% 40% 60% 80% 100%
Strongly disagree
Disagree
Neutral
Agree
Strongly agree
.
4.2
31.7
38.9
8.7
16.5
0% 20% 40% 60% 80% 100%
Strongly disagree
Disagree
Neutral
Agree
Strongly agree
.

31
Table 25.1 Percentage response to ‘I feel part of a group of students and staff committed to learning’, according to whether their current course was their first choice
First choice
1 2 3 4 5 N Mean Standard deviation
No 5.9 19.6 34.4 33.8 6.4 358 3.15 1.00
Yes 3.7 15.5 31.2 40.4 9.3 1332 3.36 0.97
( ,9.122 =χ df = 4, p < 0.05)
Some of the students complained about ‘No communications between student and lecturer, simply being told the answer’ and about the lack of ‘Interaction in classes/lectures [and] apathy amongst students [which] make it hard to have a discussion about Economics.’
Question 26 I feel that contact with active researchers is beneficial to undergraduate students.
Responses to statement 26, ‘I feel that contact with active researchers is beneficial to undergraduate students’, were very positive: 55.6% agreed with it. At the same time, more than a third of all students were undecided on this matter, which means that they are not sure of any benefit to them from contact with active researchers. Students’ age seemed to influence their attitudes on this matter.
Table 26.1 Percentage response to ‘I feel that contact with active researchers is beneficial to undergraduate students’, according to age on entry
Age 1 2 3 4 5 N Mean Standard deviation
18–20 2.6 8.7 34.2 39.7 14.8 1506 3.55 0.93
21–25 2.2 6.5 23.0 42.4 25.9 139 3.83 0.96
≥ 26 0.0 7.7 40.4 32.7 19.2 52 3.40 0.89
( ,9.182 =χ df = 8, p < 0.05)
Of students 26 or older, 40.4% were neutral with 51.9% positive, while for the 21–25 age group only 23.0% were neutral and 68.3% positive, and for the 18–20 age group 34.2% were neutral and 54.5% positive. Students’ attitude also depends slightly on whether this course was their first choice or not.
2.5
33.4
39.8
15.8
8.5
0% 20% 40% 60% 80% 100%
Strongly disagree
Disagree
Neutral
Agree
Strongly agree
.

32
Table 26.2 Percentage response to ‘I feel that contact with active researchers is beneficial to undergraduate students’ according to whether current course was first choice
(χ2 = 2.83, df = 4, p < 0.05)
The students for whom the course was their first choice were less positive (54.6%) and more neutral (34.9%) compared to those for whom it was not first choice, among whom 59.4% agreed with the question and 28.0% were neutral. In their answers to open-ended questions students wrote, ‘Being taught by leading researchers in Economics is a real honour’ and ‘Being taught by people who are engaged in research makes the things taught in lectures seem much more practical and relevant.’
Question 27 Overall I am satisfied with the quality of this degree course.
Students’ overall satisfaction with the course was very high. More than three-quarters of them agreed with the statement, ‘Overall I am satisfied with the quality of this degree course’; 13.6% were ‘neutral’ and only 10.2% disagreed. There is difference in agreement with this statement between those for whom their current course was their first choice (78.0% agreement) and the others (69.8% agreement).
Table 27.1 Percentage response to ‘Overall I am satisfied with the quality of this degree course’, according to whether their current course was first choice
First choice
1 2 3 4 5 N Mean Standard deviation
No 2.2 11.2 16.8 54.2 15.6 358 3.69 0.94
Yes 2.0 7.3 12.7 56.8 21.2 1328 3.88 0.89
( ,6.132 =χ df = 4, p < 0.01)
First choice
1 2 3 4 5 N Mean Standard deviation
No 2.2 10.4 28.0 37.5 21.9 357 3.66 1.00
Yes 2.5 8.0 34.9 40.4 14.2 1320 3.59 0.92
2.1
13.6
56.0
20.2
8.1
0% 20% 40% 60% 80% 100%
Strongly disagree
Disagree
Neutral
Agree
Strongly agree
.

33
Open-ended questions
Question 28 Identify the best one or two aspects of your degree course and say why.
In the answers to this question, students most frequently mentioned three themes: quality of teaching staff, the variety of modules in the degree and the intrinsic interest of Economics as a subject. Staff were praised for being good explainers, enthusiastic, receptive to student problems, approachable and knowledgeable. Students enjoyed the variety of modules in the degree and of skills developed. Economics itself came in for strong praise, although the specific target of praise varied. Students cited the best aspect of the course sometimes as its being challenging, sometimes its being easy, sometimes its having real-world application and sometimes its giving new interest and meaning to Mathematics.
Even though the majority were satisfied with their course, their answers, often lengthy and written with passion, revealed that many students had reservations about their experience.
Question 29 Identify one or two aspects of your degree course that could be improved and say why.
When answering this question, students point again to the quality of teaching. The responses directly relating to teaching staff come under three headings:
• quality of teaching, mainly that lectures are insufficiently ‘live’ and engaging;
• English language issues for international teaching assistants and lecturers;
• access to staff, including both the amount of teaching time and pastoral issues.
Lack of feedback on assessment is another area where many students want improvement. Many more had specific comments about course content. Maths was another frequently occurring topic in these responses, usually in complaints of the subject being too mathematical, or in complaints that there was insufficient help for those without A-level Maths.
Question 30 What one or two aspects of your degree have you found the hardest?
By far the most common response was the mathematical and statistical elements of the course were hardest. Often the complaint is not about the mathematical content of the course but about prior assurances that A-level Maths is not necessary for the course. In many of the answers, students named modules that they were finding particularly hard, and these were usually quantitative modules such as statistics or econometrics. Many students reported difficulties adjusting to university life, mostly with independent working and time management. Another frequently mentioned difficulty was uncertainty about what was expected in essays: respondents felt that clearer guidelines would increase their motivation. However, several students pointed out that the hardest aspects of the degree were the most rewarding.

34
Question 31 What types of activities in seminars/tutorials have you found the most useful?
The majority of respondents had found tutorials most useful when they include group discussion, group presentations and problem-solving exercises. The team component of the activities was stressed as a useful one by many students. Among the themes that most often recurred in participants’ answers were active participation, group work, use of technology, the lecturer’s role, connection with real life, relation to other topics, developing skills, use of mathematical exercises, connection to exams and group size. There were also a few students who didn’t find seminars or tutorials useful at all, and there were those who mentioned problems connected with them (both of the groups being a very small minority).
Question 32 What types of activities in seminars/tutorials have you found the least useful?
In general, students find their seminars useful and prefer active class participation to passive ‘dictative learning’. In their responses they asked for more feedback, complaining of a ‘lack of genuine feedback as to how well I am doing’ and that ‘no grades or marks [are] given to identify what is a good piece of work and what sucks’. They also complained about tutors who cannot speak English well, lack of communication between lecturer and students (‘No communications between student and lecturer, simply being told the answer’), presentations that are not assessed (‘Non-assessed presentations, discussions’), computer problems (‘In tutorials, working with computer programs is least useful because during tutorial they crash down, as result learning nothing’) and bad teaching practice (‘Tutorials which seem more like an interrogation session have been the worst ones. Instead of encouraging discussion I felt that I only wanted to say the minimum and forcing students to answer unwillingly only leads to making you lose confidence, I think.’)
Question 33 If you know what career you intend to pursue, please identify it.
The majority of the students had already decided what kind of career they would like to pursue. As one of them wrote: ‘With an Economics degree, there is mainly the bank opportunity’, though some wanted to continue their economic education and do master’s degrees and PhDs. Among the odd ones career choices were ‘pet detective’, ‘rock musician’, ‘criminal psychologist’, ‘RAF pilot’ and ‘billionaire’. Word counts were used to identify commonly occurring words and well-correlated pairs of words. On the basis of this, a set of word searches was run on the raw results, which obtained the following percentages.
investment OR banking OR banker 23%
finance OR financial 17%
accountancy OR accountant 11%
civil service OR government 6%
consultancy OR consultant 6%
economist 6%
research OR graduate OR study 4%
teach OR teacher OR lecturer 3%

35
Note that these are not exclusive, so that an answer of ‘civil service or perhaps financial sector’ would appear in two of these categories.
The most popular future careers for Economics graduates are therefore in banking, finance, accountancy, the civil service and consultancy, with some of the graduates continuing their education through postgraduate studies.
See Appendix 3 for representative answers to the open-ended questions.
Factor scale analyses
It was mentioned earlier that the current survey was based upon the questions from the University of Sydney Student Course Experience Questionnaire (SCEQ). These questions have been shown to cluster together to form factor scales:
• Good Teaching Scale (GTS)
• Clear Goals and Standards Scale (CGSS)
• Appropriate Assessment Scale (AAS)
• Appropriate Workload Scale (AWS)
• Generic Skills Scale (GSS)
• Environment Scale (ES)
Other questions that were included in the Economics LTSN survey do not contribute to these scales, but are relevant to the Economics studies context: for example, ‘My degree course contains too much Maths and stats.’ In addition, the questions included in the scales have been altered slightly compared to the SCEQ scales, due to the fact that the survey was adapted by Economics LTSN. The relation of each question to a particular scale is indicated below.
• Good Teaching Scale (GTS), including questions 2, 7, 8, 12, 15, 17, 18, 19, 20 and 21. The GTS is characterised by practices such as providing students with helpful feedback on their work, explaining things, stimulating interest in the subject, actively engaging students in lectures and seminars, stimulating students intellectually, using Economics software effectively and understanding students’ problems. Higher scores on the GTS are associated with the perception that these practices are present. Lower scores reflect that these practices occur less often.
• Clear Goals and Standards Scale (CGSS), including questions 5, 6, 13 and 24. Although establishing clear goals and standards could be considered part of good teaching in a broader sense, it is important to see how this aspect of teaching is perceived. This is also linked with the first question regarding the overall expectations of the course.
• Appropriate Assessment Scale (AAS) – question 14r (r = item scoring reversed to allow for negative phrasing). Only one question was included from this scale, which concentrates on a particular aspect of assessment: the extent to which assessment

36
emphasised recall of what students had memorised, rather than higher-order thinking. The assumption behind this question is that assessment that does not focus on memorising concentrates on higher-order processes. This scale is not comprehensive in its measurement of assessment and questions regarding assessment should probably be added in future.
• Appropriate Workload Scale (AWS), including questions 3r and 16r (r = item scoring reversed to allow for negative phrasing). High scores on AWS indicate reasonable workloads. These are the students who disagree with the statements ‘My workload is too heavy’ and ‘The pace of my course is too fast’. As research on student learning has shown, heavy workloads and a fast-paced course encourage students to adopt surface learning, and they are unable to spend time reflecting on the material they are supposed to learn.
• Generic Skills Scale (GSS), including questions 4, 9, 10, 22 and 23. Aggregating data on skills is an attempt to take into account how Economics courses contribute to the development of the generic skills that graduates are expected to possess. Employers are now looking for graduates who are able to work in teams, can plan their work, have good communication skills and have developed analytical and problem-solving skills.
• Environment Scale (ES), including questions 25 and 26. We believe that environment plays an important role in the student’s perception of the degree course. Feeling part of a group of students and teachers committed to learning, and being in contact with active researchers, creates a better climate for learning.
Besides these, there are additional items concerning students’ expectations of the whole degree course (Q1), students’ ove rall satisfaction with the degree course (Q27), and adequate inclusion of Maths and statistics in the course (Q11r).
Summary statistics for the factor scales are presented in Table 28. The table also includes students’ expectation of the course (SE) and students’ satisfaction with the course (SS). It should be stressed that, although these results are interesting as they are, their main value lies in forming the base for comparison in future surveys. Their use as part of time-series data will enable changes and patterns in students’ perceptions over a period of time to be seen.
Table 28 Summary statistics for the factor scales
Scale N Mean Standard deviation
GTS 1689 3.34 0.648
CGSS 1694 3.50 0.724
AWS 1713 3.13 0.794
AAS 1716 3.47 1.075
GSS 1682 3.59 0.700
ES 1707 3.45 0.757
SE 1709 3.42 0.980
SS 1708 3.84 0.910

37
The data in Table 28 show that, although in general students are very satisfied with the whole degree course, they are less satisfied with different aspects of the course. This is consistent with the results from Australian universities, which have been using SCEQ for a long time. In the Appropriate Workload Scale and the Appropriate Assessment Scale, the data from agreement to disagreement were reversed due to the negative phrasing of the questions, and the results were recalculated.
The means presented in Table 28 for different scales cannot be compared directly. Just because the mean of GSS is 3.59 and the mean for GTS is 3.34, for example, one cannot conclude that the generic skills that the students are taught are of higher quality than the general quality of teaching. The means of the scales are an artefact of the wording of the items from which they are formed. Their significance is as time-series data for tracking possible future changes.
Comparisons of data between universities may also be misleading, as students differ in terms of personal, educational and family backgrounds, which may have a profound effect on their perceptions of learning. The main value of the survey results lies in forming the base for comparison in future surveys.
The Appropriate Workload Scale has the lowest score this time. Nearly half of the students were neutral while responding to the statement ‘My workload is too heavy’ and about a third were neutral on the statement ‘The pace of the course is too fast’. Also more than one in five students agreed with the statements, finding their workloads too heavy and the pace too fast, which is a worrying sign. The evidence from research on student learning is that heavy workloads require students to adopt an approach to learning which emphasises skimming across the surface of topics without being able to spend the time to truly engage and understand the material they are meant to be learning. At the same time, some students were not very pressed with this issue. As one of them put it: ‘I haven’t found my degree hard but that is not because the degree is easy, but because I have enjoyed it. It has stimulated my interest to a level that previous education has failed to.’ Perhaps the questions need to be reformulated in future surveys to produce more decisive responses. It could be that the negative phrasing of the statements was not very clear to the students and it needs additional stressing. Also additional questions concerning student assessment should be included in future surveys, as the single question used in this year’s survey is not enough to get the full picture of this important aspect of learning. This matter requires further investigation.
The other low score was for the Good Teaching Scale. Ten questions from it that were included in the survey cover different aspects of teaching. The answers to them varied from highly positive – 81.6% agreed with the statement ‘The degree course is intellectually stimulating’ and 66.1% agreed with ‘I feel that I am actively engaged in most seminars/tutorials’ – to more critical: only 32.8% agreed with ‘The use of Economics software in my course is effective in helping me to learn’ and 33.3% agreed with ‘I feel that I am actively engaged in most lectures.’ Figure 4 shows column charts arranged in order of mean response.
1
1.5
2
2.5
3
3.5
4
4.5
Q2 Q21 Q12 Q19 Q8 Q7 Q18 Q17 Q15 Q20
Figure 4 Mean responses to questions from the Good Teaching Scale

38
Box plots for the questions that are included in GTS show greater consistency for Q2, Q21, Q12, Q19, Q8, Q7 and Q18 and much greater variation in questions Q17, Q15 and Q20 (Figure 5). This means that there is much bigger variety in students’ responses to these questions, which may indicate possible problem areas and requires further investigation.
In students’ answers to open-ended questions, quality of teaching staff was the most frequently cited aspect of the course both in positive and in critical statements. Strongly representative is the student who gave ‘The quality of teaching provided by certain lecturers/seminar leaders’ as both the best and worst aspect of their course. The staff were praised for being good explainers, enthusiastic, receptive to student problems, approachable and knowledgeable. The most frequent point of criticism of lecturers was their inability to create enthusiasm for the subject. Students often contrasted the lecturers’ manifest knowledge of Economics with their difficulty in explaining it or bringing it alive. They appealed for more real-world illustrations of the concepts they are learning, and many of them suggested that lecturers should take courses to improve their presentation skills. Lack of co-ordination between lecturers, or between lecturers and seminar tutors, was another source of student frustration.
Figure 5 Box plots of responses to questions from the Good Teaching Scale
One particular recurring complaint was about teaching staff whose first language is not English. In some cases, students felt that these teachers’ difficulties with the language added an unnecessary layer of difficulty to seminars. The survey indicated that students are aware of the detriment to the quality of their education resulting from the enormous time pressures on staff. In the question about the best aspects of the course, many cited the opportunities to contribute actively in seminars and to get to know their tutor. On the topic of the least favourite aspects of the course, many answers were about the insufficiency of contact with lecturers.
The highest scores occurred on the Generic Skills Scale and Clear Goals and Standards Scale. But even within the scales there was a big difference between the mean responses. On CGSS students were very satisfied with the information provided about the course (mean 4.07), but were not sure about the standard of work expected from them (mean 3.01).

39
Figure 6 shows the mean responses in CGSS.
Figure 6 Mean responses to questions from the Clear Goals and Standards Scale
On the Generic Skills Scale there were also variations between the mean responses to different questions (Figure 7). Students were not happy with the way the course helped them to develop their ability to work in a team (mean 2.95), but were satisfied with the way their analytical, problem-solving skills and skills in writing communications were developed during the Economics course.
Figure 7 Mean responses to questions from the Generic Skills Scale
The Environment Scale consists of just two questions, which have similar mean responses. Unfortunately more than one in five students did not feel themselves part of a group of students and staff committed to learning. An important role in this is played by the fact that nearly 40% of students did not feel that the course had helped them to develop their ability to work as a team member (Q4). At the same time, more than 55% felt that contact with active researchers is beneficial to undergraduate students.
1
1.5
2
2.5
3
3.5
4
4.5
Q6 Q5 Q24 Q13
1
2
3
4
Q9 Q23 Q10 Q22 Q4

40
Correlation analysis
In analysing the scores on each scale, it is important to know how independent the factor scales are, and if they are not independent, what the correlation is between various scales.
Having tested the null hypothesis on the independence of scales, we have to reject it. The correlation coefficients are included in the matrix shown in Table 29.
Table 29 Correlation coefficients (all correlations significant at p < 0.05)
GTS CGSS GSS ES AWS AAS
GTS +1.000 +0.544 +0.637 +0.581 +0.138 +0.269
CGSS +0.544 +1.000 +0.402 +0.419 +0.259 +0.148
GSS +0.637 +0.402 +1.000 +0.497 +0.033 +0.172
ES +0.581 +0.419 +0.497 +1.000 +0.091 +0.220
AWS +0.138 +0.259 +0.033 +0.091 +1.000 +0.126
AAS +0.269 +0.148 +0.172 +0.220 +0.126 +1.000
Figure 8 A display of the relationship between variables with an absolute correlation coefficient greater than 0.3
Table 29 and Figure 8 indicate that some of the observed relationships were very strong. The strongest relationship was between the Good Teaching Scale and the Generic Skills Scale (r = 0.637), which could be interpreted to mean that if a student is satisfied with the teaching aspects of their course, they are more likely to be satisfied with the generic skills provided by the course. The Good Teaching Scale is also positively, but more moderately, correlated with
r = 0.637
r = 0.581 r = 0.497
r = 0.419
r = 0.544 r = 0.402
GTS GSS
CGSS
ES

41
the Environment Scale (r = 0.581) and Clear Goals and Standards Scale (r = 0.544), showing that if a student is satisfied with the teaching aspects of the course, they are likely to be satisfied with the environment of the course and have a clear understanding of the goals and standards of the course. The Generic Skills Scale is also moderately correlated with the Environment Scale (r = 0.497) and the Clear Goals and Standards Scale (r = 0.402), which indicates that if a student agrees with the positive statements regarding their acquisition of generic skills during the course, they are more likely to agree with the positive statements regarding the environment of the course and its clear goals and standards.
The relationship between Appropriate Workload Scale (reversed) and the Appropriate Assessment Scale (reversed) with the rest of the scales and between themselves is positive, but not very strong (correlation coefficients are less than 0.3). This requires further investigation.
It will be interesting to see what kinds of relationship exist between students’ answers to Q27 (‘Overall I am satisfied with the quality of this degree course’) and the various scales. Box plots of different scales by response to Q27may be supplied on request. Table 30 and Figure 9 illustrate the relation between the responses to Q27 and the Good Teaching Scale.
Table 30 The Good Teaching Scale by responses to Q27
Response to Q27 N Mean GTS Standard deviation GTS
Strongly disagree 34 2.00 0.58
Disagree 135 2.51 0.53
Neutral 231 2.85 0.47
Agree 944 3.40 0.45
Strongly agree 340 3.97 0.46
Figure 9 Box plots of the Good Teaching Scale by responses to Q27
As can be seen from Figure 9, there is a clear linear relationship between students’ satisfaction with the whole course and their agreement with the statements of the Good Teaching Scale. Although students are more categorical in their attitudes in general, they are more cautious when giving their opinions on specific questions. This type of relationship is
54321
5
4
3
2
1
Q27
GTS

42
characteristic of all the scales with the exception of the Appropriate Assessment Survey, where the relations are not so clear (this may be due to the fact that AAS in our survey consists of just one question, while the original SCEQ has three questions included from this scale). Perhaps additional questions regarding assessment should be included in future surveys.
Conclusions
The Economics LTSN student survey is an important step in information gathering about students’ learning experiences. More than 1700 students from 58 departments took part in an on- line survey. It was based on a student-centred model of learning and included 10 demographic questions, 27 quantitative questions regarding their perceptions of learning Economics and 6 open-ended qualitative questions. Standard statistical packages were used for the analyses of quantitative data. The data analysed in this report do not represent the opinions of all Economics students. At the same time, these data are an important source of information because they reflect the views of a large number of students who accepted our invitation to participate in the survey. The report examines the influence of personal characteristics on respondents’ opinions and uses the answers to the open-ended questions, grouped into themes, to illustrate the quantitative results. Using both types of data enables us to draw a better picture of students’ perceptions of learning Economics. All the acquired data are confidential, so only national results will be published. Reports will be sent to all participating institutions with more than 20 students’ responses. The main value of the survey lies in the possibility in the future of having time-series data for comparison, which could indicate changes and patterns over a period of time. The results of the survey were consistent with similar results from the Australian universities.
The report analyses students’ responses to individual questions, as well as their responses grouped into six scales: Good Teaching, Clear Goals and Standards, Appropriate Assessment, Appropriate Workload, Generic Skills and Environment. It also analyses students’ expectations of the course, students’ satisfaction with the course, and students’ perception of the amount of statistics and Mathematics included in the course.
In general, Economics students were satisfied with the way their courses were delivered (76.2% of them agreed with this). When asked more concrete questions about different aspects of the course, students expressed critical opinions on topics including pace and workload, use of Economics software in teaching, active engagement in lectures, adequate inclusion of Maths and statistics in the course and expected standard of work. Nearly half of the students were uncertain about whether or not their workload could be considered too heavy, and about one in four regarded it as too heavy. A third of all students were uncertain about the pace of the course and a fifth of them considered it too fast. More than a third of the students disagreed with the statement that it is easy to know the standard of work expected, while another third were not sure about that. A third of all respondents didn’t find the use of Economics software effective in their courses and another third were unsure about it. One in four students said they did not see staff making real efforts to understand difficulties students may be having with their work, while more than a third seemed undecided on this matter. The question of adequate inclusion of Maths and statistics in Economics courses also split the students with every third student considering that there is too much of it, 41.4% disagreeing with that and a quarter of students undecided. More than 40% of students did not feel they were actively engaged in most lectures and a quarter of them were undecided on this matter.

43
At the same time, only one in seven students felt they were not actively involved in seminars and tutorials.
With correlation analyses it was found that the scales were not independent and there was a strong positive relationship between the Good Teaching Scale and some other scales. A linear relationship was also discovered between students’ satisfaction with the course and the Good Teaching Scale, as well as other scales, with the exception of the Appropriate Assessment Scale.
The results of the survey will be used to provide the Economics community with useful information and to encourage further discussions on teaching and learning issues. Economics LTSN will be happy to provide workshops and advice to interested departments on the issues raised by the survey.

44
References
Ainley, J. and Johnson, T (2001) Course Experience Questionnaire 2000. An interim report prepared for the Graduate Careers Council of Australia. [on- line] Available from http://www.gradlink.edu.au/gradlink/gcca/index.htm
Barrie, S. (2001) Reflections on student evaluation of teaching: Alignment and congruence in a changing context. In Santhanam (Ed), Student feedback on teaching: Reflections and projections. Proceedings of the Forum on Teaching Evaluation, University of the Western Australia.
Long, M. and Johnson, T. (1997) Influences on the Course Experiences Questionnaire Scales. Australian Council for Educational Research
Ramsden, P. (1991) A performance indicator of teaching Quality in Higher Education: the Course Experience Questionnaire. Studies in Higher Education 16(2), 129-150.
Richardson, J.T. (1994) A British Evaluation of the Course Experience Questionnaire. Studies in Higher Education 19(1), 59-68.
Prosser, M. and Trigwell, K. (1999) Understanding Learning and Teaching: The experience in higher education. Buckingham: SRHE and Open University Press
Student Course Experience Questionnaire. [on- line] Available from http://www.itl.usyd.edu.au/sceq2002/
Students in Higher Education Institutions 2000/2001. [on- line] Available from
http://www.hesa.ac.uk/products/pubs/contents/cat_middle.htm
Wilson, K., Lizzio, A., and Ramsden, P. (1997) The Development, Validation and Application of the Course Experience Questionnaire. Studies in Higher Education 22(1), 33-53.

45
Appendix 1: Text of the Survey
Student Course Experience Questionnaire
A. About you
1. What university do you attend?: drop down box with the names of Universities 2. Please state whether you are Female ¡ or Male ¡ (please click) 3. What was your age on entry to your course? (18-21) (22-25) (26 and above) 4. Do you have A level Maths or equivalent? Yes ¡ No ¡
If yes, what grade? 5. Do you have A level Economics or equivalent? Yes ¡ No ¡
If yes, what grade? 6. Either: how many points did you achieve in your A and AS levels or Scottish
highers? (old system of calculation: only count AS grades if you did NOT proceed to A level in that subject)
(Leave blank if you did not take A or AS levels or Scottish Highers) Total points Or: how many points did you achieve using the new UCAS tariff system? (see http://www.ucas.ac.uk/higher/tariff/calc/) (Leave blank if you did not take any of the relevant qualifications) 7. From which of the following were you admitted to this course? (drop down box)
Comprehensive school, Grammar School, Independent school, City technology college, 6th form college, Further education college (A/AS level, Scottish highers), Further education college (VCE/GNVQ), Access or foundation level course, Other degree course, HND course, Overseas school/college, Other
8. Is English your first language? Yes ¡ No ¡ 9. Please name your Degree Programme and/or Award and year/level on the
programme: 10. When you were applying for university, was this degree your first choice? Yes ¡ No ¡
Year/level Degree
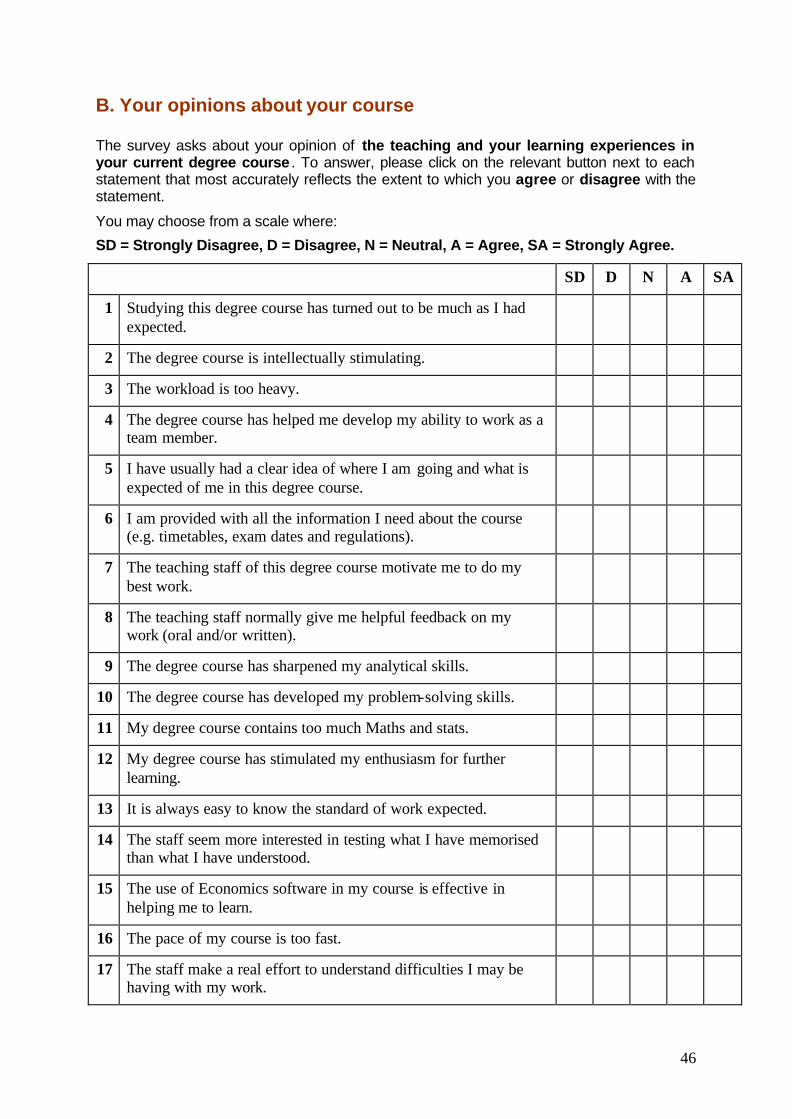
46
B. Your opinions about your course The survey asks about your opinion of the teaching and your learning experiences in your current degree course . To answer, please click on the relevant button next to each statement that most accurately reflects the extent to which you agree or disagree with the statement.
You may choose from a scale where:
SD = Strongly Disagree, D = Disagree, N = Neutral, A = Agree, SA = Strongly Agree.
SD D N A SA
1 Studying this degree course has turned out to be much as I had expected.
2 The degree course is intellectually stimulating.
3 The workload is too heavy.
4 The degree course has helped me develop my ability to work as a team member.
5 I have usually had a clear idea of where I am going and what is expected of me in this degree course.
6 I am provided with all the information I need about the course (e.g. timetables, exam dates and regulations).
7 The teaching staff of this degree course motivate me to do my best work.
8 The teaching staff normally give me helpful feedback on my work (oral and/or written).
9 The degree course has sharpened my analytical skills.
10 The degree course has developed my problem-solving skills.
11 My degree course contains too much Maths and stats.
12 My degree course has stimulated my enthusiasm for further learning.
13 It is always easy to know the standard of work expected.
14 The staff seem more interested in testing what I have memorised than what I have understood.
15 The use of Economics software in my course is effective in helping me to learn.
16 The pace of my course is too fast.
17 The staff make a real effort to understand difficulties I may be having with my work.

47
18 My lecturers are extremely good at explaining things.
19 The teaching staff stimulate my interest in their subjects.
20 I feel that I am actively engaged in most lectures.
21 I feel that I am actively involved in most seminars/tutorials.
22 The degree course has improved my skills in written communication.
23 My degree course has helped me to develop the ability to plan my own work.
24 It has been made clear to me right from the start of each module/unit what is expected of me.
25 I feel part of a group of students and staff committed to learning.
26 I feel that contact with active researchers is beneficial to undergraduate students.
27 Overall, I am satisfied with the quality of this degree course.
28 Identify the best one or two aspects of your degree course and say why.
29 Identify one or two aspects of your degree course that could be improved and say why.
30 What one or two aspects of your degree have you found the hardest?

48
31 What types of activities in seminars/tutorials have you found the most useful?
32 What types of activities in seminars/tutorials have you found the least useful?
33 If you know what career you intend to pursue, please identify it. (Otherwise leave blank.)
Thank you very much for taking part in our survey.

49
Appendix 2: Percentage Respondents to Questions 1 to 27
Responses N Mean Standard Deviation
1 2 3 4 5
Q1 2.3 19.8 19.4 51.1 7.4 1719 3.42 0.96
Q2 1.5 6.0 10.9 57.1 24.5 1718 3.97 0.85
Q3 3.3 26.3 45.6 18.7 6.1 1715 2.98 0.91
Q4 9.4 28.8 25.6 29.8 6.4 1712 2.95 1.10
Q5 3.7 13.4 19.4 52.6 10.9 1716 3.54 0.98
Q6 1.9 6.6 9.4 46.4 35.7 1715 4.07 0.94
Q7 4.3 17.8 30.3 37.1 10.5 1718 3.32 1.02
Q8 5.7 16.7 25.2 41.8 10.6 1716 3.35 1.05
Q9 1.0 8.9 16.9 51.9 21.3 1717 3.84 0.89
Q10 1.1 9.8 20.9 51.2 17.0 1711 3.73 0.89
Q11 10.0 31.4 25.5 17.9 15.2 1717 2.97 1.22
Q12 4.3 13.8 25.6 42.6 13.7 1716 3.48 1.03
Q13 5.7 29.5 27.8 32.3 4.7 1711 3.01 1.02
Q14 15.4 41.1 24.2 14.0 5.3 1716 2.53 1.08
Q15 10.0 22.3 34.9 26.6 6.2 1714 2.97 1.07
Q16 4.0 41.5 32.4 18.2 3.8 1717 2.76 0.92
Q17 4.3 20.8 36.4 33.7 4.8 1713 3.14 0.94
Q18 4.1 16.9 33.2 38.8 7.0 1712 3.27 0.96
Q19 3.4 14.8 30.2 43.7 7.9 1712 3.38 0.95
Q20 9.7 31.6 25.5 27.9 5.3 1711 2.87 1.09

50
Q21 3.4 12.3 18.2 48.9 17.2 1707 3.64 1.01
Q22 2.6 11.7 21.8 47.4 16.5 1704 3.63 0.98
Q23 1.7 7.2 19.5 52.3 19.3 1706 3.80 0.98
Q24 3.3 17.9 26.1 43.9 8.8 1708 3.37 0.98
Q25 4.2 16.5 31.7 38.9 8.7 1712 3.31 0.99
Q26 2.5 8.5 33.4 39.8 15.8 1708 3.58 0.94
Q27 2.1 8.1 13.6 56.0 20.2 1708 3.84 0.91

51
Appendix 3: Analysis and representative quotations from the Survey
The responses quoted here were chosen on the basis of being particularly articulate examples of themes that recurred in answers to a particular question. An “Outliers” section collects responses that are highly individual and unexpected. All mention of particular institutions, people or courses has been expunged. There has also been some typographical correction and a few responses that address multiple topics have been broken up, but otherwise these are raw answers as we received them from students.
Q28: “Identify the best one or two aspects of your degree course and say why”
The three themes came up most frequently were the quality of the teaching staff, the variety of modules in the degree, and the intrinsic interest of the subject.
Staff
The quality of the teaching staff was a strongly recurring theme. In particular, they were praised for being good explainers, enthusiastic, receptive to student problems, approachable and knowledgeable. Some students named members of staff that had particularly inspired them (although we have removed names here). Many responses indicated a gratitude for being taught by active researchers.
• “Feel pleased that I am mostly being taught by lecturers who have been valuably involved in Economics in the "real world" as opposed to straight academics/researchers.”
• “The level is high and likewise the workload, its a challenge but the teachers are EXTREMELY good and seem to love their job which is great. They are enthusiastic and I feel that that helps we to study much harder.”
• “Having a course taught by invited external speakers who covered various aspects of the topic because they had very detailed and balanced knowledge of the subject matter.”
• “Contactability of the staff. Most lecturers are keen to help you understand things during their own time.”
• “I am able to choose many of my modules and some of the staff are very easy to get along with. This allows me to get the best out of my course”
• “One lecturer (incredibly intelligent, fun and great at explaining things) has really made me enthusiastic about my course.”
• “[My institution] has very good finance teachers doing frontier research in the field.”
• “The staff make a real effort to understand difficulties I may be having with my work.”
• “It is good to learn from lecturers who are currently researching the subject and they teach with so much more enthusiasm when it’s their area of expertise.”
52
• “The majority of the teaching staff are fantastic, always willing to make time for you at any time of the day without an appointment.”
• “The quality of the lecturers, because they are skilled at explanation, and the content which is on the whole stimulating”
• “I have some particularly good lecturers who are funny and make lectures both enjoyable and interesting.”
• “Some excellent lecturers who are incredibly inspiring.”
• “Being taught by leading researchers in Economics is a real honour.”
• “The quality of the teaching in a number of subjects is extremely good and has helped me to understand some of the different courses I am on through the use of real world examples.”
• “The majority of my lecturers are excellent, their passion for the subject helps me work hard at something I would usually not be interested in.”
• “The level of teaching is excellent, both at the level of lectures and supervisions.”
• “Being taught by people who are engaged in research makes the things taught in lectures seem much more practical and relevant”
• “Teaching staff are always willing to help when encountering a difficulty and this is much appreciated.”
• “My teacher is very enthusiastic about the subject which encourages me to learn and listen in his classes - he is also very good at explaining things and makes sure that you understand before he moves onto something more complicated.”
• “Being taught by extremely intelligent people in the field of Economics and gaining a wider appreciation of the subject as a whole.”
• “Applied examples to real life often using lecturer's own research”
• “Some very very good lecturers and tutors who really do care and are interested in both the subject and how you are doing in it.”
• “The willingness of staff to help with any difficulties with work in general or pieces of coursework. Whenever I have had a problem and been to see someone it has always been solved.”
• “Presence of 'well known' lecturers in their field - very interesting to understand their views”
• “Listening to lecturers talk about their research, as it helps understanding of the topic and they are so enthusiastic about it, it is motivational.”
• “Some top quality lecturers who are extremely enthusiastic about the subject and make it interesting.”
• “Enthusiasm shown by lecturers is infectious, I certainly am inspired by the enthusiasm shown by lecturers for their individual subjects. It's extremely motivating.”
• “The good lecturers. It is a joy to be taught by them. Their obvious command of the subject and their enthusiasm combine with their ability to teach, making their lectures worthwhile and interesting.”

53
Variety
“Variety” here refers to the variety of modules in the degree, or of skills developed. Some of the remarks on variety came from students on joint degrees, who fe lt that their subjects were working well together.
• “I enjoyed the fact that students were free to choose, from a fairly wide selection, which units to take for over half of the course; and thus able to decide which areas of Economics they wished to study.”
• “The best aspect is the ability to study a range of different modules that include management, marketing, Economics, finance and accounting. This means that the degree course is not too monotonous”
• “A great deal of choice in modules and the flexibility of changing between the various Economics degrees. Because it means that you are able to do what you want.”
• “I have a wide choice of modules in both management and Economics which is good for the business world.”
• “Diversity in course module options - Allows course to be more interesting.”
• “Compulsory modules in 1st Year - Enabled me to fully understand where I wanted to go and where my weaknesses lay.”
• “The course has allowed me to tailor my learning to suit my likes and dislikes through the options we are given as to which modules we can take.”
• “Freedom to choose options from a relatively diverse range, compulsory units are minimal. The ability to take units in other disciplines.”
• “The fact that I can choose so many of my own options to study so that I can be blamed if I can't do them!”
• “There are a large variety of elective modules to choose from, which allowed me to tailor my degree to my tastes.”
• “Best aspect of my degree course is the range of material that I have covered ranging from pure economic theory to history to banking, etc. I like the variety.”
• “The variety of modules is also fantastic. I believe I have a wide understanding of organisations now from economic, accounting, marketing, managerial and behavioural perspectives.”
• “In the first two years you do courses outside Economics, giving you a broader learning experience and allowing you to change your mind about your degree course if you have real problems with your original choice.”
Interest in the subject
Economics itself came in for strong praise, although the specific target of praise varied. Students cited it as a best aspect of the course sometimes for being challenging, sometimes for being easy, sometimes for having real-world application and sometimes for giving new interest and meaning to Mathematics.
• “We are being trained to be Economists, not just to absorb and repeat information in exams.”

54
• “After disliking Maths at GCSE level (e.g. Algebra) econometrics has helped me see that there is a point to algebra for example. The module has improved my understanding of certain aspects of Maths and it is actually enjoyable, and it seems a practical use of Economics. It makes a change from just reading text books about theories.”
• “an in-depth understanding of Economics and the ability to analyse changes in the economy”
• “Learning about the economy and then being able to apply it to real life”
• “intellectual challenge and responsibility for my own work. These are the 2 main reasons I came to uni”
• “gaining knowledge about the business world and understanding how economic analysis has a huge impact on the world”
• “Certain modules I am currently studying have made me realize there is much more to Economics than I previously thought, and so I am now more interested in finding out how I can apply my knowledge of Economics to a wider range of activities, etc.”
• “The best aspect of my degree course is that the things I learn have real bearing on world events. I can look at the news, and my economic training allows me better to interpret it.”
• “Having done Maths A level, I can now see how what I learnt has a real world interpretation, e.g. what you can do with calculus.”
• “The interrelatedness of the course, that we have been encouraged to understand Economics from first principles through to its practical application.”
• “The Economics material has been very interesting. Also, I have enjoyed the Maths part of the course (differentiation etc) because I had little experience of Maths before starting the course, and so have found it challenging.”
• “The course is interesting, and stimulating. It has given me a different perspective of the world in economic terms, helping me to formulate my own opinion on issues such as the Euro.”
• “A good overview of how modern Economics is really done: the models we study are generally less than 20 years old -- sometimes much less. The course is designed to show how to approach economic problems and solve them.”
• “It has given me a wider understanding of what is going on in the world as a whole.”
• “The best aspect of my degree course is the deeper understanding of how the economy works and how people react to economic decisions.”
Other
Other recurring topics included the use of real-world examples in teaching, the relevance of Economics to other subjects and to everyday life, the administration of the course, or the social and cultural environment of the university, seminar or tutor group.
• “The close working relationship that has developed and been encouraged between the students. It makes the learning process more enjoyable.”

55
• The best aspect of the course is the strong involvement students get with one another in seminars.”
• “Very clearly structured and deadlines are made clear. Staff are very willing to help with any problems.”
• “Involvement of current affairs. When working with recently published & debated figures, the degree seems all the more relevant to everyday life.”
• “That students are given a lot of freedom and are encouraged to read and research independently.”
• “The best aspect of my degree course is that I learnt to challenge authorities. I form and defend my own views and opinions instead of merely absorbing information. I feel I am more confident in presenting my ideas to others.”
• “When the interplay between politics and Economics departments works it is particularly stimulating - assessment of the foundations of economic thought, 'ideology' of political economy/consumer freedom etc.”
Outliers
• “The last year, because it destroys all the theories previously learnt and explains how the real world really functions”
• “I like my lecturers, especially Economics, because they show humanity.”
• “solving problems more logical because making my brain properly” [sic]
Q29: “Identify one or two aspects of your degree course that could be improved and say why.”
Just as the quality of the teaching staff was the most frequently cited positive aspect of the course, it was also the aspect most discussed in response to this question. The responses directly relating to teaching staff come under three headings:
1. Quality of teaching, mainly that lectures are insufficiently “live” and engaging.
2. English language issues for international teaching assistants and lecturers.
3. Access to staff, including both the amount of teaching time and pastoral issues.
Lack of feedback on assessment was another area where many students want improvement. Many more had specific comments about course content. Maths was another frequently occurring topic in these responses, usually in complaints of the subject being too mathematical, or in complaints that there was insufficient help for those without A level Maths.
Quality of Teaching

56
Those who did criticise lecturers usually emphasised that only a few of them were below standard. Strongly representative is the student who gave “The quality of teaching provided by certain lecturers/seminar leaders” as both the best and worst aspect of their course.
The most frequent point of criticism of lecturers was inability to create enthusiasm for the subject. Students often contrasted the lecturers’ manifest knowledge of Economics with their difficulty explaining it or bringing it alive. They appealed for more real-world illustrations of the concepts they are learning, and many of them suggested that lecturers should take courses to improve presentation skills. Lack of co-ordination between lecturers, or between lecturers and seminar tutors, was another source of frustration.
• “It is very obvious when a lecturer does not enjoy teaching, which affects our learning of the subject. It may be possible for some lecturers to try and improve their teaching skills to make the whole thing more enjoyable for both them and the students.”
• “One or two lecturers only read out their overheads. This is boring and makes people go to sleep.”
• “Very importantly, some lecturers should not be lecturing if they clearly do not want to be there. It doesn't help any student and it's a waste of time and money.”
• “Some form of teaching quality control. Some tutors are superb, but some are dire. Some don't understand the language they're teaching in properly, and the uni ignores its own feedback questionnaires.”
• “Some lecturers could be more encouraging, explanatory and less dictatorial.”
• “Maybe it would be an idea if other lecturers sat in on each others' lectures and passed on information on how to make them better.”
• “I often feel that if the lecturers were marked on their lectures the same way we are on our coursework presentations they would fail (not on content but on presentation skills).”
• “The linkage between lectures and supervisions could be improved. Under the present system the two don't tie in particularly well.”
• “Teaching skills – Could be better if handouts are provided so we can concentrate on what the lecturers say rather than copying pages of notes. Seminar Teachers – Crucial to our learning but unfortunately some of the PhD students are not up to the standard they don't really teach with "HEART". Also I recommend that we should have more seminars because discussions in seminar are much, much more productive”
• “Some lecturers could learn to be better public speakers. it is annoying when someone who quite obviously knows a lot on a subject cannot convey their thoughts and explanations in a manner which is easily understandable by most.”
English language issues
One particular recurring complaint was about teaching staff whose first language is not English. In some cases, it was felt, their difficulties with the language added an unnecessary layer of difficulty to seminars.
• “The foreign researchers that act as tutors for the tutorial groups vary widely in ability, experience and grasp of the English language. Some are very good while

57
others lack the knowledge to explain economic concepts or don't have the ability to speak English properly and are hard to understand.”
• “Having lecturers that speak English clearly enough for us to understand them – a couple of them have been impossible to understand, for core modules. Just because they are good researchers doesn't mean they should be given modules to teach.”
• “The difficulties that some tutors have with the English language can prevent them from giving a fully satisfactory explanation.”
• “Are new lecturers given 'teacher training'? Nothing against foreign lecturers, but when the topic is complicated already, it seems a little silly to make it harder to understand due to language difficulties.”
Access to Staff
Our survey indicated that students are aware of the detriment to their quality of their education resulting from the enormous time pressures on staff. In the question about the best aspects of the course, many had cited the opportunities to actively contribute in seminars and to get to know their tutor. Here where the topic is the least favourite aspects of the course, many answers were about the insufficiency of contact with lecturers.
• “There is not enough communication between lecturers and tutors outside the theatres. Even in the tutorials you can go unnoticed and unchallenged for a whole term.”
• “An improvement in student / teacher communication could be made, more one-on-one time especially, in order to identify and solve individual problems that students may be unwilling to disclose in a more public environment.”
• “Need smaller tutorial groups [to] ensure and develop an understanding of the work, create a better sense of a relationship between staff and students and amongst students themselves.”
• “More time spent in tutorials on going over particularly difficult components of the course”
• “There are too many students on the course, therefore contact time with lecturers is too short. Tutorials contain too many people to be of real value & they happen too infrequently (once every two weeks per module).”
• “Tutorials and seminars are impersonal and do not challenge. There is a clear lack of communication within tutorials and there is no building of relationships with students and tutors.”
• “Staff student relationship should be more comprehensive. I feel that if I knew the staff better I would be more confident in gaining benefit from their assistance.”
• “I doubt there is more than one member of staff who knows my name.”
Emphasis of the Course
• “I would like to see more empirical evidence used in lectures to support or maybe contradict the economic models. This would help relate what came be some very abstract ideas to the real world. The few times this has happened I have found it very interesting.”

58
• “The course is too orientated around examinations, and not around the ability and intellect of students – merely their ability to remember facts for exams.”
• “Eliminating the pointless subsidiary courses we have to take. These take up too much time that I would rather invest in Economics.”
• “Make the subject more interesting and relevant as it was for A level. At A level I could watch the news and understand parts of it better because of my Economics course. Degree Economics seems so removed from reality.”
• “The basic problem is that the vast majority of Economics in [the course] is orthodox/mainstream. Students aren't offered alternative approaches developed by Post-Keynesians, institutionalists, and Marxists. But the problem seems to be the same elsewhere: 95 percent of the Economics taught in higher education institutions is mainstream.”
• “More of historical account of the development ideas I believe would be beneficial to understanding why we believe the ideas we do today, what was wrong (why they failed/are no longer used) with ideas of yesterday e.g. going from the Gold Standard to Keynesianism to Thatcherism to today.”
Maths
Many students reported disappointment that their Economics degree is so mathematical; those without A level Maths reporting particular difficulty. Several other students complained that their course was not mathematical enough.
• “I think that it should be pointed out to students more clearly how much Maths is involved in the course before they start it.”
• “I think more emphasis should be made on the Economics of the Maths that we are doing.”
• “Personally what I liked about Economics at A level was the critical analysis and discussion of theories and issues. It seems all I do here is work out formulas and assess data,”
• “I think that the Maths aspect needs to be cut down. There's two compulsory modules and I think there should only be one. It prevents the study of modules which students will find interesting and therefore work harder at.”
• “Too little Maths!! Should be in touch with it throughout the entire degree”
• “The amount of Maths involved is ridiculous when you only have a GCSE Maths qualification.”
• “The degree of support offered to those with a less developed Maths background is scant.”
• “Not enough mathematical content (drawback when applying for postgraduate courses which demand high level of numeracy)”
Assessment
Responses that related to assessment were often complaining that feedback on assessment was not sufficient to enable students to progress, or complaining of a lack of guidance as to what was expected in essays.

59
• “Need more regular but smaller pieces of assessed work to get an understanding of how well you are progressing through the course e.g. One 400 word question each week per subject. At the moment can slack off, do nothing except 2 essays a term and then end up not knowing anything before the exam.”
• “More assessment during term time to let you know where you are at in your understanding of the subject more often than one of twice a term.”
• “Multiple-choice tests encourage the students to learn the material by heart instead of trying to understand the matter”
• “More analysis and essay style course work would help improve understanding especially in macroEconomics”
• “I would like more feedback on work submitted in order to gauge the standard and style of work expected in the examinations.”
• “More mathematical/objective marking, because subjective marking leaves a wide scope for losing marks solely because of a poorly specified and explained subject.”
• “I don't feel we are asked to submit enough written work (e.g. essays). I feel this doesn't prepare me well for exams where essays are compulsory.“
• “Should also space out exam timetable to give 3 day break between each exam. That would raise every student’s result by a grade guaranteed.”
• “More written feedback on unassessed course assignments. These exercises are futile if all you receive is a mark without any description of how it could be improved.”
• “No guidelines were ever given as to exactly how to approach exam questions and essays.”
• “More feedback would be good- also, i feel that having 100% exams is not a good test of a students ability- continuing evaluation I believe gives a better measure- makes students keep up with their work and a chance to improve performance.”
• “Too much emphasis on coursework: in this day and age with external pressures and the Internet, proving the authenticity of coursework is much harder. I know for a fact some people just re-do a project their friend did the previous year. And why the hell should I bust my guts on my dissertation when some folk buy them of the Internet or get first drafts off their mates? Should be more exam based so everyone is on a level playing field.”
Other
Other complaints included insufficient advance information about courses, disappointment that learning had not been more social, and some disagreements with course content. Several students said that nothing about their course could be improved.
• “More interactive learning would definitely be useful and smaller group projects should be introduced with outside firms/groups involved.”
• “I can't understand the emphasis on group projects - in most cases two people are doing the work for the rest of the group – not really fair”
• “A better explanation of what is required at the start of the degree would have helped me, in terms of essays and general work standard.”

60
• "Work ethics" of many students needs improvement!”
• “Some lecturers are as indoctrinated as their right-wing counterparts.”
• “Some of the current textbooks use the words which are really difficult for international students to understand.”
• “It is still not clear to me what economists in the real world actually do. This could have been better incorporated into some of the courses in some way.”
• “The department should arrange more debates and seminars outside the course.”
• “More information or a sample lecture before choosing the modules for the next year to make sure you are making the right choices.”
• “There is a huge need to put Economics theory into the historical context of social sciences (sociology, political theory, philosophy as well).”
• “Access to finance tools such as Bloomberg and Reuters”
• “More teamwork or communication, because I believe many graduates finish an Economics degree with NO communication skills.”
Outliers
• “Provide more grants to economic students for writing essays on certain aspects. For intellectual and financial reasons.”
• “A small percentage of the lecturers could be shot”
• “Personal Hygiene”
Q30: “What one or two aspects of your degree have you found the hardest?”
Most answers to this question either mentioned specific aspects of the course content (usually mathematical aspects) or the problem of adjusting to work in a university environment. Several students pointed out that the hardest aspects of the degree were most rewarding.
Maths and Statistics
By far the most common response was the mathematical and statistical elements of the course were hardest. Often the complaint is not about the mathematical content of the course but about prior assurances that A level Maths is not necessary for the course. In many of the answers, students named modules that they were finding particularly hard, and these were usually quantitative modules such as statistics or econometrics.
• “The mathematical and quantitative aspects. Practical examples make theory and notation easier to understand, but could be used more.”
• “Understanding the Maths although there was ample help available from tutors and the Maths department.”
• “Studying Maths & stats for Economics in my 3rd year. It should have started at an earlier level.”
• “Use of degree level Mathematics with minimal teaching of concepts involved”

61
• “There is too much compulsory difficult Maths given that A-level Maths was not required. The Maths teachers seem to think that everyone will understand, when really those without Maths A-level struggle”
• “There is a great deal of statistics, some of which seems unnecessary because we never use it in any other of our modules. The numeracy modules could be more focused to aiding our learning and understanding in our other modules.”
• “Learning statistical methods as my Mathematics 'A' level did not include this area.”
• “The heavy duty mathematical parts where there are just pages of equations and no one knows whether we are supposed to know them all or whether it is just for intellectual curiosity”
Adjusting to University Life
Many of the reported difficulties were with independent working and time management. Specific time management issues mentioned included doing background reading, balancing work for different subjects and balancing work with other activities.
• “Organising my work for myself rather than having teachers to organise it for me.”
• “Self motivation. I find it hard after coming home to try and sit down and work solidly for a period of time and doing enough independent study.”
• “Time management. No one telling you off when you miss lectures/tutorials/essay deadlines.”
• “Managing my time, it's a big jump from being at school as you are left to your own devices all the time at Uni.”
• “Compared to studying for A-Levels the hardest aspects have been self motivation. Although I attend the lectures I find it hard to do all the additional and background reading which has affected my overall understanding.”
Essays and Assessment
Another frequently mentioned difficulty was uncertainty about what was expected in essays: respondents felt that clearer guidelines would increase their motivation. For some students with science A-level backgrounds, the main difficulty was getting into the habit of essay writing.
• “Studying alone for tests and exams and trying to anticipate the right level of work to do. Exams questions were much harder than tutorial ones.”
• The difference between the format of the information as it is given to us, and the way in which it is presented on the tests.
• “The exams have been difficult because it’s difficult to decide what is important enough to write in 45 mins and what isn't.”
• “Writing the essays- as a foreign student I was unfamiliar with the expectations regarding the essays.”
• “Knowing exactly what criteria essays are graded on.”
• “The fact that all the exams for a whole year are concentrated within two weeks in June.”

62
Other
Topics that came up several times but which were not dominating themes include resource issues (whether books are available; whether there is support for computer usage) and uneven distribution of work (including deadline clashes between subjects). Many students insisted that they do not think of their course as hard. Students being students, “waking up for 9 o’clock” featured a number of times as the most difficult part of the degree.
• The limited number of course books available to us in the library has made research and extra reading difficult at times.
• They wide variety of material that needs to be learnt - for example statistics, Maths and essay based modules.
• I haven't found my degree hard but that is not because the degree is easy but because I have enjoyed it. It has stimulated my interest to a level that previous education has failed to.
• “At the moment I am not having any difficulties (Hopefully I’ll feel the same during the exam period.)”
• “Competition - It is unusual to have such a large number of intelligent people around - results in a highly competitive atmosphere that can be stressful”
Outliers
• “Avoiding getting distracted when 'researching' on the web can be hard, especially when work avoiding activities (such as this) are readily available.”
• “The more I study Economics, the more I realise the general incomprehension of the economic system. Anything can be true in Economics, as there will always be a sustainable counter argument. Everything is too closely related, and no economist seems able to explain how to fight unemployment or the increasing economic, social and political disparities across countries.”
Q31: Activities at seminars/tutorials, which participants found most useful
The majority of the students had found tutorials most useful, when they include group discussion, group presentations and problem solving exercises. The team component of the activities was stressed as a useful one by many students. Among the themes, that most often recurred in participants answers were active participation, group work, use of technology, lecturers role, connection with real life, relation to other topics, developing skills, use of mathematical exercises, exams related, group size. There were a few students who didn’t find seminars/tutorials useful at all, and there were those who mentioned problems, connected with them (both of the groups being a very small minority).
Active participation
• THE ACTIVE PARTICIPATION OF ALL THE STUDENTS IN THE SEMINAR(TEAM WORK)
• discussions within the subject

63
• Being able to bounce ideas around other people allows points to be developed and encourages other people to join in.
• The group situations and presenting the results to the rest of the course
• Group exercises and the ability to discuss properly with the lecturer what is being taught.
• The case studies being examined in modules because they reflect the theory
• Actively working through problems as a class.
• When we discuss different questions and argue about how things really work, and not just state answers to homework questions
• Problem Solving
• Debating issues between two teams
• The seminars and tutorials are in general the best part of the course. You get to explore what you have learnt and get instant feedback. It feels easier to ask questions after the lecture when you have digested new material.
• Group activities such as problem solving
• Interactive work, where you work with the tutor i.e. going up and answering questions, doing presentations. Group work, where you get to pool all your ideas together.
• interactive tutorials force people to talk unlike tutorials where they only give the answers and 'bye bye'
• The small business management game was very good at teaching me what is needed to run your own business.
• The most useful activities are ones where student participation is required usually in the form of question answering, this gives everyone a chance to learn by doing but also to hear other peoples points of view.
• group discussions
• Going through questions and getting everyone involved.
• Interactive lectures, where lecturers invite the students to participate but nevertheless lecturers lead the discussion and contribute most in order to clarify the topic.
• Much rather, open question sessions are useful, if there is enough time for everyone to ask their questions (I remember tutorial groups of 4, which were very conducive to such debate, whereas groups of over 12 just aren't)
• Students solving the problems themselves, it encourages independent thought. Although it is good to have the tutor input.
• Discussing other people's essays
• The group discussions have helped round my knowledge of Economics. Being encouraged to solve problems on the board has helped those who have difficulties with public speaking; I thought this was particularly useful for application within the business world.
• Experimental economic approaches to our microeconomic tutorials re-enforced ideas.

64
• group investigative projects, material can be discussed with others and gives a chance to research and stimulates interest in subject
• Re-iterating the general points of lectures in detail is good and helps my understanding. The knowledge is in the textbook but a lot of understanding is gained from my tutorials.
• actively involving us, so you have had to prepare work before hand
• The group working together has been very helpful.
• Class debates.
• Problem based
• Experiments
• role playing
• Case Studies
• Interactive debates encourage critical thinking, and help understanding the subject
• Discussions of case studies or economic problems/questions.
• Basic discussion of the points made in the lectures. It is very important to get other peoples viewpoint in all aspects of Economics.
Group work
• group discussions, discussing problems students have with tutorial exercises
• Group work makes the learning more enjoyable
• Working in groups and solving problems together by using the ideas of members in the group
• When we as a tutorial group have to work through a problem together with help from the tutor but without them dominating the session.
Group discussions, where we are encouraged to do exercises and have to discuss the solutions.
• Group work as you learn lots from your peers
• I think debates are more useful than presentations and they get everyone involved and often i learn a lot more from this as they are more interesting.
Technology
• terminal sessions in computing/prog to help put into practise what we have learnt
• Being able to ask questions and receive any info from email
• computer software tutorials
• reading reports that are put on the internet for all to use
• Computer classes.
Running through specific technical questions in more depth than was covered in lectures.
65
• The use of econometric software in the teaching, rather than just the complicated theory
• question and answer sessions
• Working in computer labs to gain real experience of software.
• Worked applicable examples.
Using econometric software to see how we can apply what we are learning
• I had no knowledge in computer analysis before I started this degree, I think that this skill has enhanced my analytical capabilities may prove to be most useful.
• video case studies and own presentations
• Visual aids such as OHP slides or PowerPoint presentations and handouts.
• Computer stuff cos i haven't got a clue but am getting there, feel that there should be more support though
Learning extra…
• Where expositions of course material was far beyond that of the lectures, especially where Mathematics was applied.
• Seminars that add details to lectures.
• seminars from external researchers
• The extra Quantitative Economics tutorials for non A level Maths students
• When the lecturer will go beyond the lecture teaching and introduce new concepts.
• The possibility to see what researchers of this and other universities are working on
• I find it useful when tutors direct the tutorials towards anything that we feel was not properly explained/ understood in lectures
Relating to other topics
• relating what we should have learnt from one individua l question to a wider topic, thus enabling us to understand it better
• Discussions about the economic models that we've studied and their interaction with what’s happening in the world.
• Activities and discussions that draw all of Economics together- its nice to see the whole picture and realise that micro and macro aren't separate-my macro tutor is very good at this
Developing skills
• These have been very very limited but one to mention is presentation skills
• Having to explain theory to the class because it forces you to understand too.
• found group debate quite stimulating and presentations that I need to make to group the fairly good at developing my oral technique and skills. Being taught basic skills, such as refreshing Maths, has made the harder stuff easie r

66
• group discussions, presenting your own tutorial thoughts and solutions has enriched my oral and presentational skills greatly
• I have found doing presentations useful in furthering my communication skills.
• Groupwork and presentation as I had hardly done these before coming to uni and I feel it is a useful skill to have in the workplace.
• Presentations have allowed me to improve my "transferable skills" in that area and have increased my confidence in public speaking.
• Improved my confidence when i found out going to board wasn't actually that bad.
Connection with real life
• Application of ideas from lectures to real situations
• general explanations of ideas and real- life examples, rather than just Maths questions
• Group work that applies theories to contemporary industries in a commercial environment
• discussion of points that are relative to real life situations, not just the theoretical summation of economic theory
• Tutorials that are closely linked to exam based questions with points highlighted by real world examples. Too much emphasis on case studies can deter from the theory.
• Current economic problems tutorials. They allow me to apply what I have learnt to the real world
• I enjoy discovering why real companies and countries are having difficulties or success
• Real life applications plus mathematical exercises
• real- life examples/problems
• Practical projects. for instance, we have just completed a trading game in futures which has been going all term. The practical things help you to know how to put the theory into practice.
• Study into real life situations e.g. the EU, British economy. Topics that require research into a given area.
• Discussing real issues in terms of Economics
Nothing…
• nothing unless copying from the board is considered to be useful.
• Nothing because i sit basically scared stiff throughout out the whole thing incase i have to speak out loud. They are very intimidating. I feel i would get on a whole lot better if i was left just to attend lectures and basically remain anonymous.
• I don’t find tutorials useful at all
• none - seminars are generally a waste of time as people rarely contribute and if they do, one or two people tend to dominate

67
• Cancelled ones.
Numerical exercises
• Numerical exercises.
• Maths problems in first year
• I believe, that drawing curves is the most useful as you can understand the rest without too much difficulties
• the Maths and stats problem classes tend to clear up problems and doing presentations has been useful
• Going through practice techniques and mathematical derivations of economic methods/models.
• In Maths we had to get up and explain a question to the rest of the class, which gave you an incentive to complete the tutorial work and be prepared.
• The Maths classes are quite helpful as they give detailed explanations to problems. Tutorials (supervisions) have been excellent in Maths too..I think this reflects the ability of the supervisor though. He is extremely thorough and good at adequate explanations
Oral presentations
• Oral presentations have been extremely useful to make you have a good understanding of the subject in order to explain it to others
• Although nobody likes it, and it most people do it badly (me included), giving presentations is a very useful skill. It also forces you to have a more complete understanding of the topic.
• Students being asked to present a paper and then having a group discussion on it. Only works with certain groups though! ie. if few will speak then this method can be very tedious.
• Giving individual presentations as makes you read, question and analyse material thoroughly.
• Presentations. We need more of these and they should be graded (as coursework) in order for everyone to make the maximum amount of effort. This is definitely a weak point of the course.
• Group presentations- good practice for future life helps you get use to working as a team.
• Oral presentations are the most useful way of (effectively) forcing you to understand the subject better - whilst hard to do, it does help you when it comes to exams.
Group size
• Ones with smaller groups and time available to go through individual areas of concern.

68
• Practical application of theory learnt in lectures and the opportunity to ask questions in a small, more intimate group.
• discussions in small groups that have then been discussed as a whole group
• being able to put forward ideas of my own in SMALL tutorial/seminar groups (less than ~8 people) when otherwise larger groups would have put me off contributing.
Exams connected
• Questions which refer to the essentials of the course - it helps immensely at revis ion.
• More analytical type questions could be useful especially for exam practise.
• Going through examples of examinable material
• Tutorials related to aspects of the final exams
• when the tutor goes through and explains the answers to exercises, mock exam questions and essays and highlights possible exam questions that might come up.
• Revision tutorials in the lead-up to exams to go over the bits of the course that I do not fully understand.
Lecturer’s role
• A friendly tutor makes us comfortable and so we discuss topics which makes sure that i know what i am talking about and easily clears up any problems.
• The teacher-student interaction is really helpful.
• Contact with the tutor, particularly if it is the course co-ordinator/examiner as this gives a valuable insight into the objectives of the course.
• Having tutors going through questions in detail rather than just skipping through questions that are assumed to be easy
• Just having a chance to talk back/ask questions in more detail of the lecturers like you could in schools!
• Being able to discuss any difficulties with the course with members of staff other than your lecturer and other students is extremely beneficial..
• Simply going through problem questions with the tutor that we have previously attempted on our own. Trial and error is a very good strategy for learning because you can see where you've gone wrong so you don't make the same mistakes again
• When tutor is interested in your opinions, not just memorised facts. This encourages us to think and makes tutorial preparation more appealing
• asking questions and being told where I need to improve. (although that hasn't happened enough - most supervisors tend to talk at you rather than with you)
• I find it useful when tutors direct the tutorials towards anything that we feel was not properly explained/ understood in lectures
• the most useful tutorials i have found are the ones where the tutor is more relaxed and is willing to discuss subjects outside of the question bank

69
• I like how my tutor asks us questions we have not already encountered in lectures. I may never know the answers, but at least they get me to start to think "beyond the box"..
• I like tutorials that are run properly and with discipline, e.g. being forced to do the work and having it marked- how else are we meant to know how well we are achieving.
Problems with the tutorials
• Problem sets to be completed between classes. Although when you are the only one in the class to have completed the work there is little or no discussion. This could be said to be a student problem rather than a fault of the Department. However the lecturers seem to accept this as the norm, which is wrong.
• Our tutorials are the same as lectures really no one talks.
• I don't really find tutorials useful in the way that most tutors just pick on people to answer questions. This can be both incredibly slow, and incredibly painful.
• Group projects inevitably mean that some people do more work than others yet receive the same credit, therefore it seems sensible to do individual presentations then work as a group to assess how we found each of them.
• We tend not to do activities in tutorials and only go through questions as a group
• The problem with a lot of university work is that you need it explained by someone who knows the work, so the idea that 'team' exercises are very useful isn't true.
• All I do is write essays so as long as I get positive feedback that suits me.
• i would have found practice questions properly marked useful but we didn’t have any
• discussions
• For some 'genius' idea they have decided to remove tutorials from our timetables, meaning we never discuss Economics, never form our own opinion let alone express it, meaning lecturers become preachers, and we become more and more frustrated at our efforts of a higher education!!
Q32: Activities in seminars/tutorials, which students found less useful.
In general students finds their seminars useful. They prefer active class participation to passive “dictative learning”, they ask for more feedback (lack of genuine feedback as to how well i am doing, no grades or marks given to identify what is a good piece of work and what sucks), they complain about tutors, who can’t speak English well (Those with foreign tutors who cant speak English very well), lack of communication between lecturer and students (No communications between student and lecturer, simply being told the answer), they don’t like not assessed presentations(Non assessed presentations, discussions) and bad working technology(In tutorials, working with computer programs is least useful because during tutorial they crash down, as result learning nothing) and bad teaching practice (Tutorials which seem more like an interrogation session have been the worst ones. Instead of encouraging discussion i felt that i only wanted to say the minimum and forcing students to answer unwillingly only leads to making you lose confidence i think.)

70
Staff
• Those with foreign tutors who cant speak English very well
• Copying from the board and the lack of communication once the class has started.
• Watching the lecturer do stuff on the board without involving anyone else or probing for feedback.
• A lot of lecturers just seem to carry on lecturing when they are supposed to be holding a tutorial.
• When seminar leader picks on each student, wait for set answer and moves on without further discussion or explanation of question
• i do not find it worthwhile when the tutor goes straight through the work without tasking the students for input.
• Dictative learning.
• Tutorials which seem more like an interrogation session have been the worst ones. Instead of encouraging discussion i felt that i only wanted to say the minimum and forcing students to answer unwillingly only leads to making you lose confidence i think.
• When she goes through something and nobody understands but she assumes we do understand
• when the lecturer gives you a few sheets of printed notes and then effectively reads them out to you for an hour not giving any other real information. I do not need someone who's paid £40,000 a year to read PowerPoint slides to me, I can do that for myself
• No communications between student and lecturer, simply being told the answer
• being ridiculed by the tutor for having given the incorrect answer. Although all these people know Economics, I get the impression that a lot of them are not suited for the kind of "classroom" work you get in tutorials. They often fail to understand why a student has trouble grasping a particular concept and respond by explaining even more complex ideas thus confusing them further
• Some of the tutors are foreign and so although they can speak English the can not necessarily be able to explain things in more ways than one.
• Tutors just say "discuss" and sit back saying "it's your class". 'If it were "my class" I'd be teaching it you fool'
• Lecture talking constantly for two hours
• Being taught old-fashioned style.
• the lecturer talks too much about one topic but never turn up in the exam
• The boredom of going over what you've already done in the lectures, and when you do a presentation nobody including the tutor is listening to what you're saying
• Some tutors just copied out the answers but not explain them properly.

71
• We don't seem to get any feedback on marked work and there does not seem to be much consistency in marking, it would help if there was a general mark scheme like at A-level.
• Multiple-choice practice papers. We prepare our answers, then turn up just to be given the correct answers without explanation of the key issues, as the tutor does not know the equations involved. I actually had to show the rest of my group how to arrive at the right answer(!)
• lecturers who do not provide handouts and lecturers who simply read a handout and provide no enthusiasm, additional information or understanding
• Some tutors seem less interested in teaching, and so I feel as if I am wasting my time at such seminars
• When the lecturer fails to activate interest
• Listening to tutors ramble on about irrelevant material.
2) Having a research student tutor who clearly does not know what they are talking about and has to rely on the more able students to correct basic mistakes being made.
• Just going over lecture notes without actually actively testing the students on their knowledge and understanding
• The lecturer doing rows and rows of growth expansions when we were still stuck on the first line.
• PowerPoint presentations (unless done very well) are extremely tedious and often tend to be reproductions of what cane be read in a textbook anyway. Good teaching needs to go beyond the textbook.
• I could do with more feedback.
• someone standing there preaching the answers in a way that didn’t actually communicate anything with the class, i found these type of lectures pointless
• Tutors who repeat what has been said in lectures for those who have failed to attend them are frustrating. Tutors who fail to encourage students to outline what they don't understand from their reading don't grasp the purpose of seminars - some tutors prefer individuals confident in their knowledge to tell all of the other students what they know, rather than attempting to foster an atmosphere of finding out what people don't understand and tackling their questions
Activities
• One's where the class isn't involved (if they haven't done the work!)
• Listening to lectures
• Least useful is when the tutor asks you to discuss your answers amongst ourselves. I feel this wastes time, as most people do not have answers to discuss, or cannot discuss them as they do not understand the subject. The tutor will go over the answer anyway. SO I feel it is pointless.
• Where you just go over what is written in the main text book rather than exploring other avenues of learning

72
• Blatantly easy role playing bargaining games.
• Just going through the preparation, as if the tutor was an answer book
• those where its been like a mini lecture
• Most of the staff you have to learn by heart.
• Copying from the board and the lack of communication once the class has started.
• Anything that tries to get me to improve 'communication' or other unnecessary 'soft skills'. This is a degree not training for the anti social.
• Going through essays as having a model answer to read through is much more useful than having an essay title explained in class.
• Watching the lecturer do stuff on the board without involving anyone else or probing for feedback.
• Those where students have not actively participated
• Going through answers without explaining why they are right.
• Having to read out a prepared answer to a written exam question, as 'practice'.
• Non assessed presentations, discussions
• the one with a lack of participation of students
• Teamwork exercises" - probably useful, but I don't like them.
• presentations
• In some seminars there have been pointless exercises as they have little to do with the course and nothing to do with the exams. (for example games in the class to demonstrate game theory
• Playing games which are not relevant to the exam
• The least useful activities are learning about things that are not going to come up in the exam. They tend to be a waste of time.
Technology
• Following directions for basic computer programs such as Microsoft Word
• Tasks set out on sheets, to be completed on the computer, as no explanation is given for each task by seminar leader.
• Pure verbal communication without any visual aid.
• In tutorials, working with computer programs is least useful because during tutorial they crash down, as result learning nothing.
• Using econometrics computer programmes to try and teach us the subject before we'd established the appropriate theory.
• Computing statistical tutorials(I think the tutorial could be more personal as not all students have the same computing background).
• Computer workshops where not given sufficient instruction. Not useful at all.

73
Presentation
• Group presentation - as you rely on other members of you course to explain a model well to increase your knowledge
• Making students do group presentations week after week. In a way, it discourages students from turning up to seminars.
• Tutors give feedback on the content of presentations but never on the presentation skills themselves, which is what employers look fo r.
• Individual presentations - end up working alone - unlike the real world!
• Student presentations - it is useful when you do your own, but when others do theirs they may not be very good, and as a result may confuse you even more. Also, this means different seminar groups will receive different levels of understanding depending on how well the presentations are performed.
• group presentations - too much time is spent planning the presentation and not enough on the theory of what we actually studying
• Presentations that are not marked. They take up a lot of time for no reward and take time away from more pressing course work.
• group presentations of questions as student concentrates on their particular question and little or none of the others being presented
• group presentations particularly in the third year where everyone has other priorities so presentations are simply reading out a load of information we already know and don't hold your attention.
• Generally presentations, as there is no incentive to learn the material other groups prepare presentations on. However, they do obviously help develop the key skill of presentation.
None
• None, all are useful, we just don't have enough seminars / tutorials despite having tuition fees increased each year
• None, I believe seminars are extremely useful and that we should have more contact hours.
• I haven't found any activities not to be useful. The only thing that doesn't help is when the tutor doesn't discuss the questions which were set for the class.
• All. None was well explained or useful
• I don't feel that there is anything in my tutorial that is not of some use to me.
• none - tutorials are perfect, there just aren't enough of them
• They are always useful (honest!).
Maths
• The Maths class which are supposed to help us with our class, i think they are a bit too casual.

74
• going through set questions
• Long-winded Maths drawn on the board with steps missed to save time. When I go back to my notes I cannot then see where things have come from.
• Going through math questions which everyone understands and has correct anyway
• Too much time is spent going over mathematical problems. Students with difficulties in this area have the opportunity of a Maths workshop which is specifically for their use.
• going over mathematical proofs that I could not follow
Problems
• video tapes in French
• Being forced to stand in front of the board being patronised by an arrogant lecturer demanding to know what grades I got at A-level and GCSE in order to have ended up so out of my depth. Sorry, this was an incident in front of many other students that I feel rather strongly about...!
• Lack of preparation by peers.
• The seminars. Because the guy is doing exercises in his head, and it's hard to know sometimes, what he's talking about. Should be more direct: Page 3, ex 5, b)... The formula to calculate this is: So, we use the new tax, and them bla,bla,bla.
• Having 5-10 minutes to prepare a short presentation that you don't really understand because you haven't had enough time to prepare it. Also trying to scribble down what everybody else has just said and trying to understand what they have just said when they didn't really understand what they have just presented to you because they have only had 5-10 minutes to prepare!
• Most seminars/tutorials are just "copy from the board" exercises, prepared by tutors who are flummoxed by questions from the group, and normally brush them aside.
• Boring lecturers are the worst - they can make the most interesting topics appear incredibly dull which is frustrating - they should receive some basic training on lecturing!
• The division of the students in sub-groups is really a good idea, but it has turned out to be completely useless...no interaction at all; everyone does is homework and that's it. But it is not clearly up to the staff.
• lack of genuine feedback as to how well i am doing, no grades or marks given to identify what is a good piece of work and what sucks.
• There are two types, the seminars that review the basic analytical skills, although they are important for the grasping of basic concepts, I was expecting seminars to be more the place for interesting problem solving or active topical debate on controversial issues.
• going through mathematical problems in a large group of people without a blackboard!

75
Q33: Careers that students intended to pursue
The majority of the students already decided what kind of career they would like to pursue. As one of them wrote:” With an Economics degree, there is mainly the bank opportunity”, though some wanted to continue their economic education and do masters and PhD “I strongly wish to go on studying Economics”, some prefer financial management and consultancy “although I am not entirely certain of a specific job, I am certain that I want to work in the financial sector, possibly the investment part in particular”, accountancy “accountancy, banking, finance”, linked to it could be job in the City “A career in the City, preferably related to equities and other financials”, in international trade “I would like to work in international trade”, in government and international Economics organisations “economist at the world Bank ( God be with me)”, or just being an economist “Hopefully an economist! “. Some of the students wanted to work in education “Teaching (Economics) “, in the army “Army Officer “, or in their own business “I would like to have my own company, generally in based around computing. “. Some of them still haven’t decided: “I have absolutely NO IDEA!!!”. Among the outliners one could mention “Ski Instructor for a season then helicopter pilot in the army. (Originally wanted to go into the city, but have now decided that I can think of nothing more boring and depressing than being stuck in an office for years on end!)”, “Actress!”, “Possible film producer”, “Nursing/healthcare. (Nothing to do with Economics)”, “£30k+, anything with this salary”, “Pet Detective”, “Rock musician”, “Criminal Psychologist”, “Pilot RAF”.
But there is also someone, who wrote” I would like to return home and contribute to the further development of my country. I hope to one day be the voice of my nation.”
We used word counts to identify commonly occurring words and well-correlated pairs of words. On the basis of this, we ran a set of word searches on the raw results to obtain the following percentages.
Note that these are not exclusive, so that an answer of "civil service or perhaps financial sector" would appear in two of these categories.
Investment OR banking OR banker 23%
Finance OR financial 17%
Accountancy OR accountant 11%
Civil service OR government 6%
Consultancy OR consultant 6%
Economist 6%
Research OR graduate OR study 4%
Teach OR teacher OR lecturer 3%
Banking
• INVESTMENT BANKER OR ECONOMIC ANALYST PREFERABLY WORKING IN AN INTERNATIONAL NGO I.E U.N

76
• Not sure yet, but maybe working in a bank
• In banking system.
• Merchant banking- probably mergers and inter-country deals while dealing with bodies such as EU etc
• Banking, preferable central. I hope to get involved with macro analysis
• Bank or stock
Academic Economics research
• Current intention is to go into academic Economics research
• I wanted to do a PhD in Economics -- now I'm not so sure as Economics is very, very hard (though it's still great)
• Journalist or academic or other research
• Academia
• Study further, graduate study..
• I strongly wish to go on studying Economics. After my third year in…, my degree offer me the possibility to have equivalence in Germany.
I wonder if I will then start a PHD in England, or if I will try to enter either the European university of Economics of Berlin, or the political and Economics French school of Science-po in Paris. As you can see, the university of Kent provides me with very important skills for my career. But who knows, as I am good in Italian here, I might love to study in Italy in the future. Let me dream... :-)
• I would like to study for a PhD in Economics with either a future career as a research/teaching economist in academia or work at the IFS (if they'll have me) or other social/public policy bodies
• Empirical researcher.
• PhD in Economics and the environment
International trade
• I would like to work in international trade
• Purchasing for motor industry
• I am intending to pursue a career in buying.
Economist
• Economist
• Further qualifications (i.e. MSc) then being a professiona l economist
• Professional economist
• I would ideally like to work in a field where I get to specialise in labour Economics such as working within the job centre on the new deal.

77
• Hopefully an economist!
Financial management and consultancy
• Management Consultancy with Accenture (start date September 2003)
• Management/Executive level in Finance or Business
• Any career in financial services
• Although I am not entirely certain of a specific job, I am certain that I want to work in the financial sector, possibly the investment part in particular
• I have the offer of a job as a Business Analyst with Scottish Equitable. I plan to undertake Financial planning certificate and advanced financial planning certificate over the next few years and perhaps progress into consultancy
• Either one of three options seem attractive:
1. Management consultancy;
2. Working as a professional economist in business or business-related government; or
3. Working for an international organisation in the field of development Economics.
• I thoroughly enjoyed recently gaining some work experience with Merril Lynch stockbrokers. this is an industry/career in which I wish to pursue
Education
• Being a teacher
• Teaching
• A career in primary teaching.
• Teaching (Economics)
• Teacher! So that I can see where it has all gone wrong in uni and make sure it doesn't happen in schools! (Although I do appreciate that there is a much larger student/teacher ratio in uni - I’m not moaning at you honest!)
• Teaching - Economics/Business studies possibly with Maths to aid employability. Place on PGCE course at Worcester for 2002/3
Accountancy
• Accountancy, banking, finance
• I enjoy the idea of becoming chartered accountant but I am not entirely sure and am still considering all the options that are open to me once I finish the degree.
Government economic service
• Government Economic Service (GES)
• Civil service.
• Working for the ministry of Economics in my country.

78
• Government Economic Service at the Department of Trade & Industry
• Diplomatic, governmental. So that I can find a solution for Brazil. Such a big country with a good mismanaged economy, and a lot more problems. Someone has got to try.
Didn’t Know
• No I don’t know
• I have absolutely NO IDEA!!!
• With an Economics degree, there is mainly the bank opportunity. But counting money all day isn't appealing to me.
I'm 21, opportunities are to be discovered
City
• A career in the City, preferably related to equities and other financials.
• City analyst
• Anything but something in the city with the rest of my course
International bodies
• Probably a career within international organisations and trade, such as WTO, EU, UN.
• Economist at the world Bank (God be with me)
• Career in the UN
Run own business
• I would like to have my own company, generally in based around computing.
• Setting up an Internet company with a friend to sell discount golf balls online. While I do agency work P/T
• I intend to do a masters and then takeover my family’s' business and expand it
• Family business
• INTEND TO BE INVOLVED IN STARTING MY OWN ENTERTAINMENT COMPANY BASED ON SKILLS THAT I HAVE ACCUMULATED.
• I plan to take my company forward selling computers and laptops, which I started to help fund myself through this course.
Outliers
• Ski Instructor for a season then helicopter pilot in the army. (Originally wanted to go into the city, but have now decided that I can think of nothing more boring and depressing than being stuck in an office for years on end!)
• Army Officer
• Actress!

79
• CURRENTLY SPONSORED BY ROYAL MARINES AND AM COMMITTED TO JOINING THEM AFTER UNIVERSITY
• Not an Economics related career. Possible film producer.
• Nursing/healthcare. (Nothing to do with Economics)
• £30k+, anything with this salary.
• Pet Detective
• Rock musician
• Criminal Psychologist
• Comedy, both writing and performing.
• I would like to return home and contribute to the further development of my country. I hope to one day be the voice of my nation.
• I would like to work in an ethical field, currently i am considering looking into working for a local government or an NGO within social policy, or teaching.
• Hmmmm, I would love to be a textile buyer!!
• Police force
• Commercial Airline Pilot
• teaching, or, fireman
• I want to work for the English football association