students in tennessee instructed by consecutive
TRANSCRIPT

Students in Tennessee instructed by consecutive ineffective teachers
Kristina PodestaLegislative Research Analyst
March 2019
Office of Research and Education Accountability
Justin P. Wilson, ComPtroller

2
Introduction
Background
Section 1: How many students had consecutive ineffective teachers?MethodologyResultsStatewide resultsResults by subject and gradeResults by district
Section 2: The academic impact of two consecutive ineffective teachersMethodologyResults: EnglishEffect on academic outcomes, by baseline proficiencyEffect on academic outcomes, by student subgroupsResults: Math
Policy Options
Endnotes
Appendix A
3
3
5588
1013
141415161718
20
23
24
Table of Contents

3
IntroductionIn May 2018, Senator Gresham requested that the Comptroller’s Office of Research and Education Accountability (OREA) complete a study about student placement and teacher effectiveness. The request specifically asked OREA to determine the number of students in Tennessee who were instructed for two consecutive years by teachers with low evaluation scores and how those two years affected student academic outcomes. To complete the request, OREA analyzed data from the Tennessee Department of Education (TDOE) and reviewed national and Tennessee-specific research about student placement and teacher effectiveness.
BackgroundNational research has shown that access to effective teachers increases student achievement, yet not every student has equitable access to effective teachers.1 A report by the Education Trust-West found that in one California district an average student taught by a top tier (highly effective) English language arts teacher gained half a year more learning than a student placed with a bottom tier (ineffective) teacher.2 In math, the difference was about four months. Tennessee-specific studies found similar trends; studies by the Tennessee Department of Education and the University of Tennessee have also found that effective teachers have a measurable positive impact on student achievement.3 The department’s report also concluded that highly effective teachers are concentrated in select districts and schools, resulting in inequitable access to highly effective teachers across the state. Low-performing students, for example, often have lower access to effective teachers than the highest-performing students.
Research on the effects of and access to effective teachers has used many measures to determine teacher effectiveness. In Tennessee, researchers and policy makers use either student growth scores or teacher evaluation scores to measure effectiveness. Tennessee’s measure of student growth is called TVAAS (Tennessee Value-Added Assessment System). Lower TVAAS scores indicate that a teacher’s students did not meet expected growth, while higher scores mean that students met or exceeded expected growth. TVAAS is distinct from other measures of academic achievement (e.g., scores on state assessments, the ACT, or other approved tests) because it measures growth instead of proficiency. For example, students could have scored poorly on state assessments, but improved more than expected, resulting in low achievement scores and a high TVAAS score.
TVAAS and academic achievement scores are two of the measures used in Tennessee’s teacher evaluation system. Since its inception in 2011, teachers have been evaluated based on multiple measures: observation scores, TVAAS scores, student academic achievement, and, in some districts, student surveys. Observation scores are given by certified evaluators, usually principals in the teacher’s school, based on the TEAM (Tennessee Educator Acceleration Model) rubric, which outlines expectations for planning lessons, creating a positive classroom environment, and providing quality instruction.A
A teacher’s TVAAS and evaluation scores are useful to school and district leaders to measure teacher effectiveness and inform decisions. Recent research conducted in Tennessee has used TVAAS alone to measure the effectiveness of teachers. To complement that research and fulfill the original request from Senator Gresham, this study uses teachers’ evaluation levels (also known as overall level of effectiveness scores or LOEs), of which TVAAS is one component.
Each component (observation scores, TVAAS, student achievement, etc.) makes up a portion of a teacher’s evaluation score, and teachers are placed into one of five levels of overall effectiveness based on those scores. The levels range from “significantly below expectations” through “significantly above expectations.” Each level corresponds with a number, with higher numbers representing higher performing teachers and lower numbers representing lower performing teachers. (See Exhibit 1.)
A A small number of districts use an alternate observation model approved by the State Board of Education. Whether districts use the TEAM rubric or an alternative, all districts must evaluate teachers based on multiple measures.

4
For this study, teachers in the bottom two levels of overall effectiveness (levels 1 and 2) are considered ineffective.
Exhibit 1: Descriptors for each of the five levels of overall educator effectivenessEducator Effectiveness Descriptors
1
Significantly Below Expectations: A teacher at this level has limited knowledge of the instructional skills, knowledge, and responsibilities described in the rubric and struggles to implement them. He/she makes little attempt to use data to set and reach appropriate teaching and learning goals and has little to no impact on student achievement.
2
Below Expectations: A teacher at this level demonstrates some knowledge of the instructional skills, knowledge, and responsibilities described in the rubric but implements them inconsistently. He/she may struggle to use data to set and reach appropriate teaching and learning goals. His/her impact on student achievement is less than expected.
3At Expectations: A teacher at this level understands and implements most of the instructional skills, knowledge, and responsibilities described in the rubric. He/she uses data to set and reach teaching and learning goals and makes the expected impact on student achievement.
4Above Expectations: A teacher at this level comprehends the instructional skills, knowledge, and responsibilities described in the rubric and implements them consistently. He/she is skilled at using data to set and reach appropriate teaching and learning goals and makes a strong impact on student achievement.
5
Significantly Above Expectations: A teacher at this level exemplifies the instructional skills, knowledge, and responsibilities described in the rubric and implements them without fail. He/she is adept at using data to set and reach ambitious teaching and learning goals. He/she makes a significant impact on student achievement and should be considered a model of exemplary teaching.
Source: Tennessee Department of Education, Team Educator Acceleration Model, Evaluation Guidance, https://team-tn.org/evaluation/evaluation-guidance/#loescale.
Teacher evaluations are used primarily to help teachers and school leaders identify what is working well and seek professional development in areas of greatest need. Evaluation scores can also be used to make personnel decisions. Tennessee law requires evaluations to be considered in tenure decisions and districts are permitted, but not required, to use them during dismissal decisions. For example, when teachers must be released due to a reduction in the number of teaching positions, Tennessee law encourages school boards to take evaluations into account in determining which teachers to release.
Although Tennessee law and TDOE policies encourage the use of evaluation scores for professional development and personnel decisions, teacher evaluation scores do not have to be considered when pairing students with teachers, i.e. assigning students to particular teachers’ classrooms. This means there are no safeguards in state law or department policy to prevent a student from having an ineffective teacher two years in a row.
As recent research has found, when students do not have effective teachers, student academic outcomes often show negative effects. Those effects can fade over time if students are taught by effective teachers in the years after having an ineffective teacher.4 When a student has two ineffective teachers in a row, the problem can be compounded, greatly increasing the likelihood of that student falling and staying behind.
This report contains two sections. The first discusses how many students in Tennessee had consecutive ineffective teachers and the methodology OREA used to make that determination. The second considers the academic impact for students having two consecutive ineffective teachers.

5
Section 1: How many students had consecutive ineffective teachers?
Methodology
Key Points: Which students are included in this analysis?
• OREA quantified the number of students who had ineffective teachers in both the 2013-14 and 2014-15 school years.
• Teachers were considered ineffective if they were in the lowest two performance levels based on their previous year’s evaluation scores.
• Only student-teacher pairings in which the teacher taught the student for 50 percent or more of the year were included.
• Students were included only if they were enrolled in a Tennessee public school in 2013-14 and 2014-15, and were in tested grades and subjects in both of those years (grades 3-11 in English and grades 3-10 in math).
OREA was asked to quantify the number of students who had teachers in two consecutive years with evaluation performance levels of “below expectations” or “significantly below expectations.” OREA determined the number of students who had ineffective teachers using the 2013-14 and 2014-15 school years. Those school years are the most recent consecutive years in which the TNReady assessments were fully executed for all tested grades and subjects in all Tennessee districts; these assessment results are the basis for both student performance and teacher effectiveness data.B
To determine the level of effectiveness for each teacher in the 2013-14 and 2014-15 school years, OREA used evaluation scores from the previous year. Teachers in the lowest two performance levels based on 2012-13 evaluation scores were considered ineffective in the 2013-14 school year, and those in the lowest performance levels based on 2013-14 scores were considered ineffective in the 2014-15 school year. Teachers who did not have evaluation scores from the previous year were not considered either effective or ineffective. (See Exhibit 2.)
Over the course of a year, a student might have multiple teachers. For those students, OREA chose to include only student-teacher pairings in which the teacher taught the student for 50 percent or more of the year.C Therefore, a student is considered as having an ineffective teacher in the 2013-14 academic year only if he or she had an ineffective teacher for half of the school year or more. The next step was to track those students’ records through the 2014-15 school year to determine how many had another teacher with a performance level of “below expectations” or lower (a score of 1 or 2) for at least half the year, in the same subject.
B TNReady is a part of the Tennessee Comprehensive Assessment Program (TCAP), and all students in grades 3-8 take the assessments in math and English language arts. High School students in grades 9-12 take TNReady assessments at the end of some math and English language arts courses.C A student could have two teachers for 50 percent of the year each. That student is considered as having an ineffective teacher if either teacher was ineffective.

6
Exhibit 2: Description of how evaluation scores were used to determine which teachers were ineffective in the 2013-14 and 2014-15 school years
2012-13 2013-14 2014-15
A teacher’s 2012-13 evaluation score was 1 or 2
The teacher was considered ineffective in 2013-14
A teacher’s 2012-13 evaluation score was 3-5
The teacher was considered effective in 2013-14
A teacher did not teach or receive evaluation scores
The teacher was not given a level of effectiveness
A teacher’s 2013-14 evaluation score was 1 or 2
The teacher was considered ineffective in 2014-15
A teacher’s 2013-14 evaluation score was 3–5
The teacher was considered effective in 2014-15
A teacher did not teach or receive evaluation scores
The teacher was not given a level of effectiveness
The OREA analysis used student-teacher pairings only for subjects that are tested. Evaluation scores for teachers in tested grades and subjects include TVAAS growth scores based on their students’ performance in the classes they taught. In non-tested grades and subjects, teachers do not generate growth scores for the subjects they teach. Although all teachers must choose a measure of student achievement as a part of their evaluation – including, for example, schoolwide test scores or high school graduation rates – observation scores make up a larger portion of the evaluation scores for teachers in non-tested grades and subjects. In general, observation scores tend to be higher than scores based on student academic growth. (See Exhibit 3.) This means that in non-tested grades and subjects, fewer teachers are in the lowest two teacher evaluation performance levels.
Exhibit 3: A comparison of teacher observation scores to TVAAS growth scores, by percent of teachers receiving scores 1-5, 2013-14
2013-14 Percent receiving 1 or 2 Percent receiving 3 Percent receiving 4 or 5Observation scores 3% 22% 75%
Growth scores 29% 24% 47%Note: Teachers receive observation scores from trained evaluators, generally the principals in the teachers’ schools, after evaluators observe them during instruction and grade them based on a rubric. TVAAS measures teachers’ growth based on their students’ academic improvement gains on assessments. Source: Tennessee Department of Education, Teacher and Administrator Evaluation in Tennessee: a report on Year 3 Implementation, April 2015.
This analysis also considered whether students took tested courses sequentially, which required some adjustments, largely for students in Algebra. Students often took Geometry in the school year between Algebra I and Algebra II, but Geometry was not a tested subject during the 2013-14 and 2014-15 academic years. This means that students who took Algebra I and then Geometry before taking Algebra II could not be included because those students were not tested in consecutive years. Nearly 12,000 students (17 percent of Algebra I students in the 2013-14 school year) did, however, take Algebra I and Algebra II in consecutive years, the majority of which were in grades 9 and 10, and are included in this analysis.D (See Exhibit 4.)
D Of the students who took Algebra I and Algebra II in consecutive years, very few were in grade 10 in 2013-14 and then grade 11 in 2014-15. Algebra students who were in grade 10 and then 11 are not included in this analysis because too few of them took Algebra I and Algebra II consecutively in those grades.

7
Legend Were tested Were not tested Were not enrolled Were in tested subjects
Students were tested in math each year from grade 3 to grade 8. Therefore, all math students who were in grades 3 through 7 in 2013-14, and then grades 4 through 8 in the next year, were included because all of those students took state assessments in consecutive years. Students in grades 8 and 9 in 2013-14 were included only if they took Algebra I or II the following year.
During the 2013-14 and 2014-15 school years, assessments were given in English I, English II, and English III, which students typically take consecutively in grades 9, 10, and 11. Since tests are taken in English language arts each year, from grade 3 through grade 8, and then English I, II, and III in grades 9, 10, and 11, students who were in grades 3 through 10 in 2013-14 and then in grades 4 through 11 in the next year, 2014-15, were all included.
Based on this methodology, 508,034 students were included in OREA’s analysis for English language arts. Students were included only if they were enrolled in a Tennessee public school in the 2013-14 and 2014-15 school years, were in tested grades each of those years, and had an English teacher for at least 50 percent of the school year each of those years. There were 390,582 students who satisfied the same criteria in math. In total 517,772 students were included in this analysis for English, math, or both subjects. (See Exhibit 5.)
Exhibit 5: Number of students included in this study, by grade in 2013-2014
2013-2014 English language arts Math
Grades K-2 0 0
Grade 3 66,124 66,755
Grade 4 65,666 66,366
Grade 5 63,841 64,898
Grade 6 64,228 65,364
Grade 7 64,670 65,661
Grade 8 63,799 50,800
Grade 9 66,106 10,738
Grade 10 53,600 0
Grades 11-12 0 0
Total included for each subject 508,034 390,582
Total included for ELA, math, or both: 517,772
Note: Students who did not have any one teacher for 50 percent or more of the year were not included (e.g., a student who had three teachers for a third of the year each). The analysis includes only students who were enrolled in a Tennessee public school in the 2013-14 and 2014-15 school years and were in tested grades and subjects both years.
Exhibit 4: Students were included only if they were in tested grades in both the 2013-14 and 2014-15 academic years
Year Grades included for English2013-14 K 1 2 3 4 5 6 7 8 9 10 11 122014-15 K 1 2 3 4 5 6 7 8 9 10 11 12
Year Grades included for math2013-14 K 1 2 3 4 5 6 7 8 9 10 11 122014-15 K 1 2 3 4 5 6 7 8 9 10 11 12
8
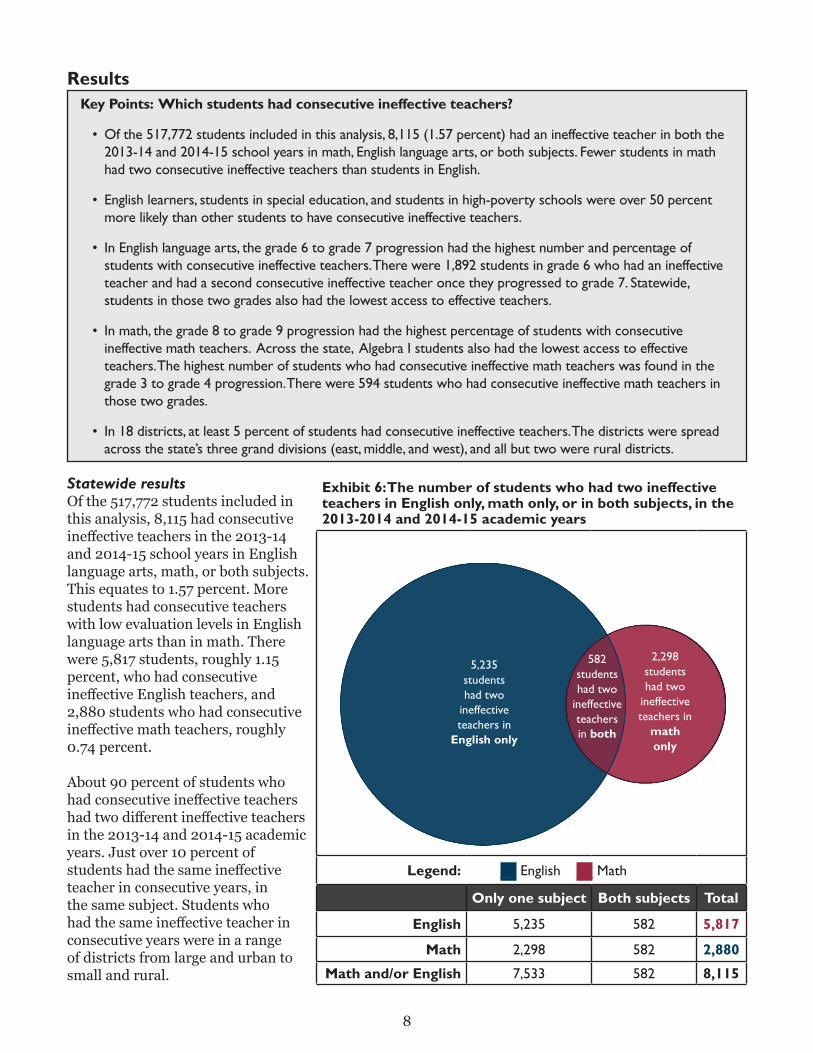
Statewide resultsOf the 517,772 students included in this analysis, 8,115 had consecutive ineffective teachers in the 2013-14 and 2014-15 school years in English language arts, math, or both subjects. This equates to 1.57 percent. More students had consecutive teachers with low evaluation levels in English language arts than in math. There were 5,817 students, roughly 1.15 percent, who had consecutive ineffective English teachers, and 2,880 students who had consecutive ineffective math teachers, roughly 0.74 percent.
About 90 percent of students who had consecutive ineffective teachers had two different ineffective teachers in the 2013-14 and 2014-15 academic years. Just over 10 percent of students had the same ineffective teacher in consecutive years, in the same subject. Students who had the same ineffective teacher in consecutive years were in a range of districts from large and urban to small and rural.
Key Points: Which students had consecutive ineffective teachers?
• Of the 517,772 students included in this analysis, 8,115 (1.57 percent) had an ineffective teacher in both the 2013-14 and 2014-15 school years in math, English language arts, or both subjects. Fewer students in math had two consecutive ineffective teachers than students in English.
• English learners, students in special education, and students in high-poverty schools were over 50 percent more likely than other students to have consecutive ineffective teachers.
• In English language arts, the grade 6 to grade 7 progression had the highest number and percentage of students with consecutive ineffective teachers. There were 1,892 students in grade 6 who had an ineffective teacher and had a second consecutive ineffective teacher once they progressed to grade 7. Statewide, students in those two grades also had the lowest access to effective teachers.
• In math, the grade 8 to grade 9 progression had the highest percentage of students with consecutive ineffective math teachers. Across the state, Algebra I students also had the lowest access to effective teachers. The highest number of students who had consecutive ineffective math teachers was found in the grade 3 to grade 4 progression. There were 594 students who had consecutive ineffective math teachers in those two grades.
• In 18 districts, at least 5 percent of students had consecutive ineffective teachers. The districts were spread across the state’s three grand divisions (east, middle, and west), and all but two were rural districts.
Results
Exhibit 6: The number of students who had two ineffective teachers in English only, math only, or in both subjects, in the 2013-2014 and 2014-15 academic years
Legend: __ English __ Math
Only one subject Both subjects Total
English 5,235 582 5,817
Math 2,298 582 2,880
Math and/or English 7,533 582 8,115
2,298 students had two
ineffective teachers in
math only
5,235 students had two
ineffective teachers in
English only
582 students had two
ineffective teachers in both

9
Of the 8,115 students who had consecutive ineffective teachers, 582 students had ineffective teachers in both math and English during the 2013-14 and 2014-15 academic years. The majority (74 percent) of students who had two ineffective teachers in both subjects were in grades 3 and 4 in 2013-14 and grades 4 and 5 in 2014-15. This may be due to the fact that teachers in grades 3 and 4 often teach both math and English to their students. The majority of students who had consecutive ineffective teachers for both English and math, had the same ineffective teacher for both subjects in at least one year.
OREA found that students from several subgroups were more likely to have consecutive ineffective teachers than their peers. As outlined in Tennessee’s ESSA plan, there are four accountability subgroups: Black, Hispanic, and Native American students (aggregated as one subgroup); economically disadvantaged students; English learners; and students with disabilities. OREA was not able to attain student-level economically disadvantaged numbers, and instead used a school-level poverty indicator to identify students in high-poverty schools. The percent of students who had consecutive ineffective teachers from each of those four subgroups, along with low-performing students, was higher than the percent of students in the overall population.
Exhibit 7: Percent of students who had two consecutive teachers with low evaluation scores by student subgroup (2013-14 through 2014-15)
Notes: (1) Because students in grade 3 did not have previous years’ test scores to determine academic performance, none were included in the analysis of low-performing students. (2) Schools were considered high-poverty if over 75 percent of students attending the school were considered economically disadvantaged. Students could be in different schools in 2013-14 and 2014-15, but students were considered enrolled in a high-poverty school depending on the status of the school they were enrolled in when placed with their second ineffective teacher in the 2014-15 school year. (3) The “students in special education” and “English learners” categories include only students who were in those categories in both the 2013-14 and 2014-15 academic years.
In English, students in special education and students from high-poverty schools were over 50 percent more likely to have two low-performing English teachers, while English learners were 80 percent more likely to have consecutive ineffective teachers. In math, students in special education, English learners, and students in high-poverty schools were over 50 percent more likely to be taught by two ineffective teachers.
145
666
1,765
618
1,927
5,817
92
332
1,091
384
1,059
2,880
2.07%
1.82%
1.74%
1.53%
1.25%
1.15%
1.21%
1.11%
1.15%
0.98%
0.88%
0.74%
English learners
Students in special education (3)
Students from high-poverty schools (2)
Low-performing students (1)
Black, Hispanic, and Native American students
Overall Math ELA

10
While there is not a shortage of teachers in Tennessee overall, a shortage does exist in certain districts and subject areas.5 In an annual report to the U.S. Department of Education, Tennessee identified a teacher shortage at all grade levels for English as a Second Language (i.e., the curriculum for English learners) and special education.E English learners and students in special education are more likely to have two consecutive ineffective teachers, but with teacher shortages in both the field of English as a Second Language and special education, districts may struggle to find and retain effective teachers in these two fields.
In addition to teacher shortages in the areas of special education and English as a Second Language, the clustering of ineffective teachers in high-poverty schools is likely another reason that some subgroups are taught by consecutive ineffective teachers at higher rates than their peers. Schools were considered high-poverty if over 75 percent of students attending the school were classified as economically disadvantaged.
As shown in Exhibit 8, 22 percent of students who attended high-poverty schools in both the 2013-14 and 2014-15 academic years were taught by at least one ineffective English teacher, while 14 percent of students who did not attend high-poverty schools were taught by at least one ineffective teacher. During those same years, 45 percent of students in high-poverty schools had two effective English teachers, which was 21 percentage points lower than students not attending high-poverty schools. In math, students in high-poverty schools were also more likely to have been taught by at least one ineffective teacher. Low-performing students, English learners, and minority students attend high-poverty schools at higher rates than students in other groups, increasing the likelihood that they will be taught by an ineffective teacher.
Results by subject and gradeStudents in grades 6 and 7 were more likely than students in other grades to have at least one ineffective English teacher in the 2014-15 academic year.F In those years, over 18 percent of students in grade 6and almost 13 percent in grade 7 had an ineffective teacher. Those two grades also had the lowest percentage of students taught by an effective teacher. During the 2014-15 academic year, about 70 percent of students in grades 6 and 7 had a teacher with a previous years’ evaluation score indicating effective teaching, which was at least 7 percentage points lower than any other grade or subject. This means students in grades 6 and 7 were less likely than students in other grades to have been taught by an effective English teacher.
E The other subject in which there was a teacher shortage at all grades levels was World Languages, but the effectiveness of world language teachers is not included in this analysis.F The 2014-15 school year was the first year in which the intra-year growth standard was used in the TVAAS calculations for grades 4-8. The intra-year growth standard tends to produce a more balanced distribution of TVAAS measures across different grades. LOE scores used in this analysis, however, are from the 2012-13 and 2013-14 academic years.
Exhibit 8: Percent of students during the 2013-14 and 2014-15 academic years that had at least one ineffective teacher (levels 1 and 2), or only effective teachers (levels 3-5), by subject and attendance at a high-poverty school
English Not high-poverty schools High-poverty schoolsPercent that had at least one ineffective teacher 14% 22%
Percent that had only effective teachers 66% 45% Math Not high-poverty schools High-poverty schools
Percent that had at least one ineffective teacher 13% 17%Percent that had only effective teachers 68% 50%
Notes: (1) Students could have attended two different schools in the 2013-14 and 2014-15 academic years. Only students who did not attend high-poverty schools in both years or who attended high-poverty schools in both years were included. (2) Percentages do not add up to 100 percent because some students had teachers with no evaluation scores.

11
Exhibit 9: Percent of English students during 2014-15 academic year that had an ineffective teacher (levels 1 and 2), effective teacher (levels 3-5), and teacher with no score by grade or subject
Grade or subject Percent that had an ineffective teacher
Percent that had an effective teacher
Percent that had a teacher with no evaluation score
3rd Grade English language arts 9.9% 75.2% 14.9%
4th Grade English language arts 7.5% 78.1% 14.3%
5th Grade English language arts 11.7% 73.1% 15.2%
6th Grade English language arts 18.8% 65.0% 16.2%
7th Grade English language arts 12.9% 69.4% 17.6%
8th Grade English language arts 8.2% 77.3% 14.5%
English I 5.3% 78.6% 16.1%
English II 4.3% 77.5% 18.3%
English III 5.3% 78.2% 16.5%
Exhibit 10: Number of students who had an ineffective English language arts teacher in consecutive years, by grade 2013-14 through 2014-15
Grade in 2014-15
4 5 6 7 8 9 10 11 Total %
Gra
de in
201
3-14
3 744 1 745 1.13%
4 0 417 2 419 0.64%
5 9 846 0 855 1.34%
6 15 1,892 4 1,911 2.98%
7 8 778 2 788 1.22%
8 2 291 0 293 0.46%
9 12 376 6 394 0.60%
10 6 406 412 0.77%
Total 744 427 863 1,900 784 305 382 412 Total: 5,817
% 1.12% 0.65% 1.35% 2.96% 1.22% 0.47% 0.59% 0.77% Total: 1.15%
___ Normal grade progression ___ Repeated a grade ___ Skipped a grade
As shown in Exhibit 10, 5,817 students had two ineffective English teachers in a row. They represent 1.15 percent of the 508,034 English students included in this analysis. Due to the high percentage of ineffective teachers in grades 6 and 7, students who began in grade 6 in 2013-14 and entered grade 7 in 2014-15 were the most likely to have been taught by two consecutive ineffective English teachers. There were nearly 1,900 students in the grade 6 to grade 7 progression, representing almost 3 percent of their respective grades, who had consecutive ineffective teachers. These students made up about one-third of all English students who had consecutive ineffective teachers out of all the grades considered.

12
Exhibit 11: Percent of math students during 2014-15 academic year that had an ineffective teacher (levels 1 and 2), effective teacher (levels 3 – 5), and teacher with no score by subject
Grade or subject Percent that had an ineffective teacher
Percent that had an effective teacher
Percent that had a teacher with no evaluation score
3rd grade math 9.1% 77.4% 13.5%4th grade math 6.4% 81.3% 12.3%5th grade math 8.3% 78.5% 13.2%6th grade math 9.8% 75.7% 14.5%7th grade math 8.8% 73.7% 17.5%8th grade math 10.2% 72.3% 17.5%
Algebra I 11.6% 70.5% 18.0%Algebra II 10.0% 74.1% 15.9%
Exhibit 12: Number of students who had an ineffective math teacher in consecutive years, by grade 2013-14 through 2014-15
Grade in 2014-154 5 6 7 8 9 10 Total %
Gr
ade
in 2
013-
14
3 594 1 595 0.9%4 4 301 1 306 0.5%5 1 362 0 363 0.6%6 3 432 2 437 0.7%7 5 375 0 380 0.6%8 3 582 0 585 1.2%9 10 204 214 2.0%
Total 598 303 366 437 380 592 204 Total: 2,880% 0.9% 0.5% 0.6% 0.7% 0.6% 1.2% 2.0% Total: 0.74%
Normal grade progression Repeated a grade Skipped a gradeNote: Students who took Algebra I and Algebra II in grades 11 and 12 were not included in this analysis. Students who took Algebra1and Algebra II in consecutive years were the only Algebra students included in this analysis.
As shown in Exhibit 11, students in Algebra I, often taken in high school, were more likely than students in other grades or subjects to be taught by at least one ineffective teacher in the 2014-15 academic year. When looking at all Algebra students, regardless of grade and course order, the percent of students who had an ineffective teacher was higher, at about 12 percent, than any other grade or subject. In the 2014-15 academic year, students in Algebra I, Algebra II, and grade 8 were the least likely to have teachers with a previous year’s score indicating effective teaching. This means that students in the highest three levels of tested math courses were less likely than students in other grades to have a teacher with a record of effective teaching.
In the 2013-14 and 2014-15 academic years, 2,880 students had two consecutive ineffective math teachers, representing 0.74 percent of the 390,823 math students included in this analysis. Due to the high percentage of students who had at least one ineffective teacher in Algebra I or Algebra II, students who took Algebra I in grade 9 and Algebra II in grade 10 were the most likely to have been taught by two consecutive ineffective math teachers; these students represented almost 2 percent of examined students in grade 9 in 2013-14 and then grade 10 in 2014-15.

13
Although the grade 9 to 10 progression had the highest percent of students with consecutive ineffective teachers, the highest numbers were found for students who were in grade 3 in 2013-14 and then entered grade 4 in 2014-15. There were 594 students who had consecutive ineffective math teachers in the grade 3to grade 4 progression, which represented less than 1 percent of the students in those grades. Overall, both the number and percent of students who had two ineffective math teachers was lower than the number and percent in English.
Results by districtOf the 146 districts in the 2013-14 academic year, 63 (43 percent) had at least 20 students or more who had ineffective teachers in consecutive years (2013-14 and 2014-15). There were enough students in these 63 districts to make up at least one entire classroom of such students. These districts are spread across the state and include both rural and urban districts. (See Exhibit 13.) Although each of the 63 districts had at least 20 such students, there was wide variation in the percent of these students in each district. Larger school districts, like Shelby County Schools, had over 450 such students, which was less than 0.80 percent of all students in the district. Smaller districts had fewer of these students, but they made up a larger percentage of the district’s total student population, up to 14.7 percent. As the map shows, the variation in urban areas ranged from 3.6 percent to 0.8 percent. There was even more variation among nonurban districts, ranging from 14.7 percent to 0.19 percent.
Exhibit 13: Map of the 63 districts with at least 20 students who had consecutive ineffective teachers (other districts shown in white) and percent of such students per district, 2013-14 and 2014-15
Notes: (1) Students could be in different districts in the 2013-14 and 2014-15 academic years, but this map shows where students were enrolled in the 2014-15 academic year, which was the year they were placed with their second ineffective teacher. (2) Achievement School District, Alvin C. York Institute, Tennessee School for the Deaf, Tennessee School For Blind, West Tennessee School for the Deaf, and the Youth Development Centers are not included on this map. Each had fewer than 20 students with consecutive ineffective teachers.
As Exhibit 13 shows, there are two districts in which 10 percent or more of the students had two consecutive ineffective teachers: Decatur County and Johnson County. (See Appendix A for a larger view of the map.) There are 16 districts where students who had consecutive ineffective teachers represented between 5 and 10 percent of the student population. In total, 18 districts had at least 5 percent of students with consecutive ineffective teachers. These districts were spread across the state’s three grand divisions (east, middle, and west). Of these districts, all but two qualify for the federal Rural and Low-Income Schools program, indicating that they are rural districts.
The district with the highest number of students with two ineffective teachers was Metro Nashville Public Schools with 1,055 students, or 2.78 percent of the district’s students. Hamilton County Schools had the next highest number at 784, which represented 3.60 percent of its students.

14
Key Points: Which students are included in this analysis?
• Students were included only if they had assessment scores from academic years 2012-13, 2013-14, and 2014-15.
• Students were included only if they attended a school in the 2014-15 school year in which at least 10 students had consecutive ineffective teachers in the 2013-14 and 2014-15 school years.
• OREA accounted for previous academic achievement by comparing students taught by two consecutive ineffective teachers to other students with the same assessment scores from the 2012-13 school year.
• OREA examined which student subgroups experienced the negative effects of having ineffective teachers by comparing the outcomes of students with similar characteristics.
Section 2: The academic impact of two consecutive ineffective teachers
Methodology
The second part of the research request asked OREA to determine the academic impact of having ineffective teachers in consecutive years. To determine this impact, a baseline measure of academic experience was necessary: test scores from the 2012-13 school year were used as a baseline.
Students were included in OREA’s analysis of the academic impact if they were in tested subjects in all three years examined (2012-13, 2013-14, and 2014-15). In English, students took state assessments in grades 3-11, so students who were in grade 3 in 2012-13, who typically would have been in grade 5 in 2014-15, were the earliest grade included. English III is the last state assessment in English taken by students, making grade 11 the last grade included for English. Therefore, students who began in 2012-13 in grades 3-9 and then ended in 2014-15 in grades 5-11 were included for English.
Exhibit 14: Students were included only if they were in tested grades in 2012-13 through 2014-15
Year Grades included for English
2012-13 K 1 2 3 4 5 6 7 8 9 10 11 122013-14 K 1 2 3 4 5 6 7 8 9 10 11 122014-15 K 1 2 3 4 5 6 7 8 9 10 11 12
Year Grades included for math2012-13 K 1 2 3 4 5 6 7 8 9 10 11 122013-14 K 1 2 3 4 5 6 7 8 9 10 11 12 2014-15 K 1 2 3 4 5 6 7 8 9 10 11 12
Legend: _ Were tested Were not tested Were not enrolled Were in tested subjects
In math, all students take state assessments in grades 3-8. As in English, students who were in grade 3 in 2012-13, who typically would have been in grade 5 in 2014-15, were the earliest grade included. Algebra I and Algebra II are not always taken in consecutive years, but when taken consecutively, they are most often taken in grades 9 and 10, making grade 10 the last grade included for math. Students in 2014-15, who were in Algebra II, taken in grade 10, had been in grade 8 in 2012-13. Therefore, students who began in 2012-13 in grades 3-8 and then ended in 2014-15 in grades 5-10 were included for math. (See Exhibit 14.)
Students were included only if they attended a school in which at least 10 students had two ineffective teachers. This ensures that students who had two ineffective teachers were compared to other students who would have experienced many of the same building-level factors.

15
There are other factors, outside of teacher effectiveness, that could affect the academic outcomes of students. To account for this, OREA analyzed groups of students with common characteristics and compared students within those groups who had two ineffective teachers to those who did not. One factor considered was previous academic achievement. Assessment scores from 2012-13 were used to account for the academic achievement of students before the 2013-14 and 2014-15 school years. Research has shown that minority students, students who experience poverty, and students with disabilities face unique barriers to academic success. OREA analyzed groups of students with these characteristics and determined whether the students in these groups experienced measurable negative effects.
Results: English
Key Points: What was the academic impact of consecutive ineffective English teachers?
• On average, after having consecutive ineffective teachers, students were less likely to be proficient oradvanced than their peers who did not have consecutive ineffective English teachers. OREA found that themagnitude of this effect differs depending on students’ previous academic achievement and inclusion inidentified subgroups.
• After being taught for two consecutive years by ineffective English teachers:◊ Students who started as “below basic” were 18 percent more likely to stay at “below basic” than their
peers who did not have consecutive ineffective teachers.◊ Students who began at “basic” were 8 percent more likely to stay at “basic” or drop to “below basic.”◊ Students who began at “proficient” were 11 percent less likely to stay at “proficient” or improve their
proficiency level. ◊ Students who began at “advanced” were 15 percent less likely to stay “advanced.”
• Students in special education were less likely to exhibit measurable negative effects of having twoconsecutive ineffective English teachers, but a measurable negative effect was found for other student groups(i.e., minority students, students in high-poverty schools, and students not in an identified subgroup).
Exhibit 15: Of students who had two ineffective English teachers, the percent that were proficientor advanced, compared to other students who did not have consecutive ineffective teachers
Students who did not have consecutive ineffective teachers (used as a baseline)Students who had consecutive ineffective English teachers
-4%-6%
2012-13 2013-14 2014-15
2012-13 2013-14 2014-15Students who did not have consecutive ineffective teachers (used as a baseline)Students who had consecutive ineffective English teachers
Exhibit 15: Of students who had two ineffective English teachers, the percent that were proficientor advanced, compared to other students who did not have consecutive ineffective teachers
Students who did not have consecutive ineffective teachers (used as a baseline) Students who had consecutive ineffective English teachers
-4%-6%
2012-13 2013-14 2014-15
Each student’s score on the state assessment is translated into a proficiency level. There are four levels, ranging from below basic (1) to advanced (4). Of the students who were taught in consecutive years by ineffective English teachers, 42 percent were proficient or advanced after the second year with an ineffective teacher. In the same year, 48 percent of students who did not have consecutive ineffective English teachers were proficient or advanced, a difference of six percentage points.
Exhibit 15: Of students who had two ineffective English teachers, the percent that were proficient or advanced, compared to other students who did not have consecutive ineffective teachers
Note: The top line, representing the academic outcomes of students who did not have consecutive ineffective teachers, is straight because it is used as a baseline. The blue line, representing the academic outcomes of students who had consecutive ineffective teachers, was graphed to show the difference between the two.

16
Moved to a lower level Stayed at the same level Moved to a higher level
Those who had two ineffective teachers were 18% more likely to stay at “below basic”
Those who had two ineffective teachers were 8% more likely to stay at “basic” or drop to “below basic”
Those who had two ineffective teachers were 11% less likely to stay at “proficient” or improve
Those who had two ineffective teachers were 15% less likely to stay “advanced”Note: English Learners and students in special education were not included in this comprisson because they are overrepresented in the group of students who had consecutive ineffective teachers and would affect the comparison.
Did not have consecutive ineffective teachersHad two consecutive ineffective teachers
Students who started as "below basic" in 2012-13
Did not have consecutive ineffective teachersHad two consecutive ineffective teachers
Students who started as "basic" in 2012-13
Did not have consecutive ineffective teachersHad two consecutive ineffective teachers
Students who started as "proficient" in 2012-13
Did not have consecutive ineffective teachers
Had two consecutive ineffective teachers
Students who started as "advanced" in 2012-13
Moved to a lower level Stayed at the same level Moved to a higher level
Students who started as “below basic” in 2012-13
Students who started as “basic” in 2012-13
Students who started as “proficient” in 2012-13
Students who started as “advanced” in 2012-13
Those who had two ineffective teachers were 18% more likely to stay at “below basic”
Those who had two ineffective teachers were 8% more likely to stay at “basic” or drop to “below basic”
Those who had two ineffective teachers were 11% less likely to stay at “proficient” or improve
Those who had two ineffective teachers were 15% less likely to stay “advanced”
Had two consecutive ineffective teachersDid not have consecutive ineffective teachers
Had two consecutive ineffective teachersDid not have consecutive ineffective teachers
Had two consecutive ineffective teachersDid not have consecutive ineffective teachers
Had two consecutive ineffective teachersDid not have consecutive ineffective teachers
Note: English learners and students in special education were not included in this comparison because they are overrepresented in the group of students who had consecutive ineffective teachers and would affect the comparison.
Effect on academic outcomes, by baseline proficiencyAs shown in Exhibit 15, students in English language arts who had two ineffective teachers, on average, were similar to their peers in past academic performance before they were taught for two consecutive years by ineffective teachers, after which their academic performance dropped below their peers. The magnitude of the effect of having ineffective teachers in consecutive years was dependent on several factors, including students’ previous academic achievement, as measured by their 2012-13 test scores.
For example, there were over 28,000 English language arts students included in this analysis who entered the 2013-14 academic year with a previous assessment score of “below basic” or “basic” from the 2012-13 assessment. These students are considered behind academically. Of the students who had previous scores of “below basic,” those who had two ineffective teachers were 18 percent more likely to stay at “below basic” when compared with their peers. This means that the students with the lowest previous achievement stayed at the lowest proficiency level at higher rates when they were taught by two consecutive ineffective teachers. For students who began at “basic,” the second lowest proficiency level, those who had two ineffective teachers were 8 percent more likely to stay at “basic” or drop to “below basic.” Overall, students in the lowest two proficiency levels who had consecutive ineffective teachers were less likely to move up to “proficient” than their peers.
Exhibit 16: Student performance on state English language arts assessments, by baseline proficiency level (2012-13 score) and whether or not a student had two consecutive ineffective teachers after two years (2013-14 and 2014-15)

17
Students in special education who are not English learners (ELL)High-poverty school Not high-poverty school
2012-13 Score of “below basic” Too few students to analyze Effect not measurable2012-13 Score of “basic” Effect not measurable Measurable negative effect
2012-13 Score of “proficient” Too few students to analyze Effect not measurableMinority Students who are not in special education and are not ELL students
High-poverty school Not high-poverty school2012-13 Score of “below basic” Measurable negative effect Too few students to analyze
2012-13 Score of “basic” Measurable negative effect Measurable negative effect2012-13 Score of “proficient” Measurable negative effect Effect not measurable
All other students who are not minority or ELL students and are not in special educationHigh-poverty school Not high-poverty school
2012-13 Score of “below basic” Too few students to analyze Measurable negative effect2012-13 Score of “basic” Effect not measurable Measurable negative effect
2012-13 Score of “proficient” Measurable negative effect Measurable negative effectNote: There were too few students who scored advanced on the 2012-13 assessment to break into subgroups and provide a full analysis. There were also too few English learners to complete this analysis.
In 2013-14, over 26,000 students began the school year with English scores of “proficient” or “advanced.” These students were meeting or exceeding the English standards in their grade, but having ineffective teachers made them less likely to continue meeting or exceeding academic expectations. Those who had two ineffective teachers and began at “proficient” were 11 percent less likely to stay at “proficient” or improve, and those who had two ineffective teachers and began at “advanced” were 15 percent less likely to stay “advanced.”
Effect on academic outcomes by student subgroupsThere were notable differences in the outcomes of students who had consecutive ineffective teachers when accounting only for previous assessment scores, but other factors could also affect the academic outcomes of students. For example, research has shown that minority students, students who experience poverty, and students with disabilities face unique barriers to academic success. To account for these factors, OREA looked at groups of students who shared these characteristics and compared students within the groups who had two ineffective teachers to those who did not.
Some analyses within the student subgroups were not conducted because of the small numbers of students at some performance levels. The group of students who had 2012-13 scores of “advanced” were too small to allow for a sound comparison between students in various subgroups. The same was true for English learners. Therefore, OREA looked primarily at students who started with assessment scores of “below basic,” “basic,” and “proficient,” and were not English learners.
OREA analyzed student subgroups to determine if the negative effect of ineffective teachers was experienced evenly by all students and found that not all groups experienced a measurable effect of having two ineffective teachers. This result does not definitively mean those students were not academically affected by their ineffective teachers, but simply suggests that the effect was not measurable. Explanations for this result may include other factors had stronger effects on academic outcomes of students than having ineffective teachers, too much variety within the groups to determine how much of the differences were due to chance or due to having ineffective teachers, or the academic effect of having ineffective teachers on those students was too small to measure.
Exhibit 17: Whether or not having two ineffective English teachers had a measurable effect on certain subgroups of students

18
Key Points: What was the academic impact of consecutive ineffective math teachers?
• Students who had ineffective math teachers in the 2013-14 and 2014-15 academic years were already less likely to be proficient or advanced before having consecutive ineffective teachers. After two years with ineffective teachers, those students became even less likely to be proficient or advanced, with the gap widening from 3 percentage points behind their peers to 8 percentage points.
• OREA found that, on average, ineffective teachers had a negative effect on student outcomes, but was unable to fully determine the magnitude of the effect.
◊ This was due to the small number of students who had consecutive ineffective math teachers. With so few students, it was not possible to conduct an analysis that accounts for factors that could affect student outcomes (e.g., previous academic achievement, race, enrollment in special education, or attendance at a high-poverty school).
• In this study, only students who took Algebra I and Algebra II in consecutive years were included, but most high school students take Geometry between Algebra I and Algebra II. As of the 2018-19 academic year, Geometry is now a tested subject. Future analysis could include all students who took Algebra I, Geometry, and Algebra II, regardless of the order in which students take the courses. This would result in a more complete analysis.
In English language arts, the majority of student groups showed measurable negative effects as a result of having ineffective teachers.G Students in special education were the exception. For students in special education who had two consecutive ineffective teachers, the majority did not show a measurable negative effect. Students who are not English learners and are not in special education generally showed a measurable negative effect, regardless of race, baseline academic achievement, and attendance at a high-poverty school, with few exceptions. (See Exhibit 17.)
In English, students in special education were less likely to experience a measurable negative effect from having two consecutive ineffective English teachers. It is important to note that many of these students required support from more teachers than just their general education teacher of record. For example, students in special education could be in a general education course, in which they were supported by a special education teacher. Both teachers would have been responsible for the student’s learning, but if the general education teacher of record was ineffective and the special education teacher was effective, a measurable negative effect on the student’s academic performance may not be found. It is unclear whether such scenarios are the primary reason that students in special education were less likely to experience a measurable negative effect.
Results: Math
The group of students who had ineffective math teachers in the 2013-14 and 2014-15 academic years were already less likely to be proficient or advanced in the baseline year, 2012-13. This means that even before having consecutive ineffective teachers, those students were, on average, behind other students in their schools who did not go on to have ineffective teachers. After two years with ineffective teachers, those students became even less likely to be proficient or advanced with the gap widening from 3 percentage points behind their peers to 8 percentage points. (See Exhibit 18.)
The largest gap between students who had consecutive ineffective math teachers and those who did not was found in the 2013-14 academic year, the first year those students were taught by an ineffective teacher. Of the students taught by consecutive ineffective teachers, 34 percent were proficient or advanced after the first year with an ineffective teacher, which was 13 percentage points lower than their peers. The gap closed slightly in the second year, but had widened from 3 percentage points to 8 percentage points over the two years.G There were too few students who scored advanced on the 2012-13 assessment to break into subgroups and provide a full analysis. There were also too few English learners to complete this analysis.

19
Exhibit 18: Of students who had two ineffective math teachers, the percent that were proficientor advanced, compared to other students who did not have consecutive ineffective teachers
Students who did not have consecutive ineffective teachers (used as a baseline)Students who had consecutive ineffective math teachers
Notes: The top line, representing the academic outcomes of students who did not have consecutive ineffective teachers, is straight because it is used as a baseline. The red line, representing the academic outcomes of students who had consecutiveineffective teachers, was graphed to show the difference between the two.
-3%
-13%-8%
2012-13 2013-14 2014-15
Exhibit 18: Of students who had two ineffective math teachers, the percent that were proficient or advanced, compared to other students who did not have consecutive ineffective teachers
2012-13 2013-14 2014-15
Students who did not have consecutive ineffective teachers (used as a baseline)Students who had consecutive ineffective math teachers
Exhibit 15: Of students who had two ineffective English teachers, the percent that were proficientor advanced, compared to other students who did not have consecutive ineffective teachers
Students who did not have consecutive ineffective teachers (used as a baseline) Students who had consecutive ineffective English teachers
-4%-6%
2012-13 2013-14 2014-15
Note: The top line, representing the academic outcomes of students who did not have consecutive ineffective teachers, is straight because it is used as a baseline. The red line, representing the academic outcomes of students who had consecutive ineffective teachers, was graphed to show the difference between the two.
As shown in Exhibit 18, the academic achievement of students who had consecutive ineffective teachers, on average, dropped further below the academic achievement of their peers after being taught by two ineffective teachers. The magnitude of this effect likely differs by student type, and a sound comparison of student subgroups would control for factors such as previous academic achievement, attendance at a high-poverty school, and demographics (e.g., race, enrollment in special education, English language proficiency). Such a comparison was not possible, however, because the number of students who had consecutive ineffective math teachers, after being split into subgroups, was too small to perform a sound analysis.
Part of the reason there were fewer students included for math was that only students who took Algebra I and Algebra II in consecutive years were included, but most high school students take Geometry between Algebra I and Algebra II. When looking at all Algebra I and Algebra II students, regardless of grade and course order, the percent of students who had an ineffective teacher was higher, at about 10 percent, than any other grade or subject. Only about 17 percent of those students were included in this analysis. This suggests that if the other 83 percent were included, there would be more students who had consecutive ineffective teachers in high school math than are currently accounted for.
As of the 2018-19 academic year, Geometry is now a tested subject and future analysis could include all students who took Algebra I, Geometry, and Algebra II, regardless of the order students take those courses. This would allow for more students to be included and would result in a more complete analysis.
20
Policy OptionsThe following policy options address the placement of students with consecutive ineffective teachers, but a comprehensive approach to this issue would involve a concert of efforts. Such efforts might include engaging with educator preparation programs to certify and effectively train more teachers, targeting professional development to assist ineffective teachers, changing teacher compensation practices to attract and retain effective teachers in areas of highest need, and dismissing individuals who are repeatedly found to be ineffective teachers.
In order to address the placement of students with consecutive ineffective teachers, the General Assembly may wish to consider the following policy options.
(1) The General Assembly could require the Tennessee Department of Education to annually calculate and report the number of students who had consecutive ineffective teachers. Senate Bill 1843 (2018) included language requiring the department to calculate and report the number of students who had consecutive ineffective teachers. When the bill was introduced it was unclear how many, if any, students had consecutive ineffective teachers and whether an annual study would be worthwhile. Although the bill did not pass, it resulted in a formal request to OREA for this study.
OREA found 8,115 students who had consecutive ineffective teachers during the 2013-14 and 2014-15 school years. In two districts, students who had consecutive ineffective teachers made up over 10 percent of the examined student population. An annual report would provide district and school leaders with regularly updated data to use for staffing and placement decisions.
If the General Assembly were to require an annual report from the department, or if the department chooses to complete such a report, OREA has identified opportunities for further analysis. For example, scale scores could be used in addition to proficiency levels to detect smaller measurable effects of having ineffective teachers. Scale scores are used to place students into proficiency levels, but the ranges used to place students are different each year and for each grade and test. If the scale scores and ranges were used, a more detailed analysis could be produced and then compared to OREA’s analysis for further insights.
The department might also analyze years in which Geometry was tested by the state to provide a fuller analysis for high school math students. Over 80 percent of Algebra I students were not included in OREA’s analysis because Geometry was not tested by the state in 2013-14 and 2014-15. Had Algebra I students who then took Geometry as a state-tested subject been included, it is likely OREA would have found more students who were taught by consecutive ineffective teachers because a higher percent of Algebra I and Algebra II students had an ineffective teacher than students in any other math course. In the 2015-16 academic year, the state began testing Geometry and an analysis of the years since then would likely capture more students who are taught by consecutive ineffective teachers.
The department is in the process of providing district leaders with district-level reports that provide an analysis of student access to highly effective teachers. The report will inform district leaders if students who are at risk of being in the lowest performance level were assigned to highly effective teachers at a lower rate than students who are not at risk. As planned, the report will not include the number of students who had consecutive ineffective teachers in that district.
(2) The General Assembly could amend state law to urge or require district and school leaders to follow certain criteria on how to increase equitable access effective teachers.OREA found that effective teachers are not evenly distributed within all districts, schools, and academic areas. Within a district, one school could have a higher percentage of effective teachers than another school. Within schools, not every student has the same access to effective teachers.

21
The General Assembly could choose from the following options:
(a) Urge or require directors of schools to assign effective teachers more evenly across schools within a district.A 2016 Florida law requires districts to ensure that high-priority schools, which are deemed in need of improvement, do not have a higher percentage of ineffective teachers than the district-wide average. In Tennessee, effective teachers could similarly be more equitably distributed, specifically among schools that are high-poverty and those that are not. During the 2013-14 and 2014-15 school years, students in high-poverty schools were more likely to be taught by at least one ineffective teacher than their peers attending schools that were not high-poverty. Increasing access to effective teachers in high-poverty schools would also likely have a positive academic impact on low-performing students, English learners, and minority students, all of whom attend high-poverty schools at higher rates than the overall student population.
(b) Urge or require district or school leaders to assign effective teachers to grades and academic areas evenly within schools.Tennessee law urges or requires district and school leaders to use certain criteria when making decisions about, for example, tenure for teachers and dismissal of teachers. A similar list could be created to guide school and district leaders when giving teaching assignments to teachers within their certification area.
The General Assembly might urge or require leaders to, when possible, assign effective teachers to grades and academic areas evenly within schools. OREA identified several academic areas, including Algebra I, Algebra II, special education, English as a Second Language, grade 6 English, and grade 7 English, in which a high percentage of students were taught by ineffective teachers.
In some of these grades and subjects, however, there is a known teacher shortage, which may complicate efforts to assign effective teachers to certain grades and subjects. Multiple efforts, therefore, may need to be taken in concert with any changes regarding the assignment of effective teachers. Such efforts might include engaging with educator preparation programs to certify and effectively train more teachers in the identified grades and subjects, targeting professional development in the identified grades and subjects to reduce the number of ineffective teachers, changing teacher compensation practices to attract and retain effective teachers, and dismissing individuals who are repeatedly found to be ineffective teachers.
(c) Urge or require school leaders to consider the evaluation scores of a student’s previous teacher when placing the student with their next teacher.The criteria could also urge or require that school leaders pair students in certain subgroups (e.g., low-performing students, minority students, economically disadvantaged students) with effective teachers at the same rate as the other students in their school. OREA found that low-performing students, for example, were more likely than the overall population to have been taught by consecutive ineffective teachers and the department’s 2016 report found that low-performing students had lower access to highly effective teachers than the highest performing students.6
(3) The General Assembly could require schools to ensure that no student has ineffective teachers in consecutive years.In at least two states, Florida and Indiana, state law prohibits students from being taught by ineffective teachers in consecutive years, although both states allow for exceptions in specific circumstances. In Indiana, if a school district cannot avoid placing students with a second consecutive ineffective teacher, parents must first be notified. In Florida, students can be placed with a second consecutive ineffective teacher only if a parent requests the teacher, in which case the school must provide the parent with information about the negative effects of ineffective teachers.

22
For Tennessee students, OREA found a measurable negative effect of having consecutive ineffective teachers in both English and math. In English, for example, low-performing students who had consecutive ineffective teachers were 18 percent less likely than their peers to move up from the lowest performance level, and the highest performing students were 15 percent less likely to stay at the highest performance level.
As noted above, there are grades and academic areas in which there is a statewide teacher shortage. Some districts and schools have a more severe shortage than others and may struggle with a requirement that no student be placed with an ineffective teacher in consecutive years. Multiple efforts, therefore, may need to be taken in concert with such a requirement. Such efforts might include engaging with educator preparation programs to certify and effectively train more teachers in the identified grades and subjects, targeting professional development in the identified grades and subjects to reduce the number of ineffective teachers, changing teacher compensation practices to attract and retain effective teachers, and dismissing individuals who are repeatedly found to be an ineffective teacher.

23
Endnotes1 Spyros Konstantopoulos and Vicki Chung, “The Persistence of Teacher Effects in Elementary Grades,” American Educational Research Journal, Vol. 48, No. 2, pp. 361-386, April 2011.
William L. Sanders and Sandra P. Horn, Research Findings from the Tennessee Value-Added Assessment System (TVAAS) Database: Implications for Educational Evaluation and Research, University of Tennessee, Value-Added Research and Assessment Center, 1998.
Aaronson, Daniel, Lisa Barrow, and William Sander, “Teachers and Student Achievement in the Chicago Public High Schools,” Journal of Labor Economics, Vol. 25, No. 1, pp. 95-135, 2017.
2 The Education Trust–West, Learning Denied: The Case for Equitable Access to Effective Teaching in California’s Largest School District, Jan. 2012, https://1k9gl1yevnfp2lpq1dhrqe17-wpengine.netdna-ssl.com/wp-content/uploads/2013/10/Learning-Denied-Exec-Summary-English.pdf (accessed Feb. 14, 2019).
3 Tennessee Department of Education, Division of Data and Research, Equitable Access to Highly Effective Teachers for Tennessee Students, March 2016, https://www.tn.gov/content/dam/tn/education/reports/equitable_access_web.pdf (accessed Feb. 13, 2019).
William L. Sanders and June C. Rivers, Cumulative and Residual Effects of Teachers on Future Student Academic Achievement, University of Tennessee, Value-Added Research and Assessment Center, Nov. 1996.
4 Thomas J. Kane and Douglas O. Staiger, “Estimating Teacher Impacts on Student Achievement: An Experimental Evaluation,” National Bureau of Economic Research, Working Paper 14607, 2008.
5 Freddie Cross, Teacher Shortage Areas Nationwide Listing 1990-1991 through 2017-2018, U.S. Department of Education Office of Postsecondary Education, May 2017, p. 165, https://www2.ed.gov/about/offices/list/ope/pol/tsa.pdf (accessed Feb. 12,2019).
6 Tennessee Department of Education, Division of Data and Research, Equitable Access to Highly Effective Teachers for Tennessee Students, March 2016, https://www.tn.gov/content/dam/tn/education/reports/equitable_access_web.pdf (accessed Feb. 13, 2019).

Appendix A
Map of the 63 districts that had at least 20 students who had consecutive ineffective teachers (other districts shown in white) and percent of such students per district in 2013-14 and 2014-15 (larger view)
Notes: (1) Students could be in different districts in 2013-14 and 2014-15, but this map shows where students were enrolled in the 2013-14 academic year. (2) Achievement School District, Alvin C York Institute, Tennessee School for the Deaf, Tennessee School For Blind, West Tennessee School for the deaf, and the Youth Development Centers are not included on this map. They each had less than 20 students who had ineffective teachers.
24

Russell Moore, Director425 Fifth Avenue North
Nashville, Tennessee 37243615.401.7866
www.comptroller.tn.gov/OREA/
Office of Research and Education Accountability