students in high school algebra build pharmacokine c
TRANSCRIPT

Innovations in Collaborative Modeling Conference, MSU 2016
Diana Fisher, Ph.D.System Science
Portland State [email protected]
Students in High School AlgebraBuild Pharmacokinetic Models
Using System Dynamics
A system is a set of things - people, cells, molecules, or whatever - interconnected in such a way that they produce their own pattern of behavior over time.
A system must consist of three kinds of things: elements, interconnections, and a function or purpose.
Donella Meadows
Definition of a System

The purpose of most system dynamics studies is insight. The overarching goal is insight into the connections between system structure and system behavior captured in graphs of dynamic patterns over time.
George Richardson

www.ccmodelingsystems.com
The Software: STELLA
4
Stock
Flow
Converter
Connector

www.ccmodelingsystems.com
Example of Simple Model
5

www.ccmodelingsystems.com
Linear Growth Model
6
Constant inflow

www.ccmodelingsystems.com
Exponential Growth Model
7
Inflow is proportional to current amount of the stock value

Drug Model 1

www.ccmodelingsystems.com
You are a medical resident (doctor) working in the emergency room and a patient comes in who needs immediate medical attention.
From your analysis you decide to connect this patient to an IV drip that will supply 1 g of therapeutic drug per minute.
This person, you estimate will metabolize the drug at about 0.55% per minute. What is the pattern of drug level in the body over 24 hours?
Emergency Room Problem

www.ccmodelingsystems.com
Predicting the Behavior

Drug Model 2

www.ccmodelingsystems.com
You are a still working in the emergency room.
A second patient arrives and you decide to give this patient a shot containing 500 mg of a therapeutic drug every 4 hours. This person, you estimate will metabolize the drug at about 0.5% per minute. What is the pattern of drug level in the body over 24 hours?
Emergency Room Problem

www.ccmodelingsystems.com
The Stock/Flow Diagram

www.ccmodelingsystems.com
The Simulation Results

Drug Model 3

www.ccmodelingsystems.com
It is a busy night in the emergency room.
A third patient arrives and you decide to give this patient 2 pills of 375 mg (each) of a therapeutic drug and tell them to continue taking 2 more every 4 hours. This person, you estimate will absorb the drug from the stomach to the bloodstream at about 4.5% and metabolize the drug at about 0.55% per minute.
What is the pattern of drug level in the body over 24 hours?
Emergency Room Problem

www.ccmodelingsystems.com
The Stock/Flow Diagram

Drug Model 4
www.ccmodelingsystems.com
We will consider the level of blood alcohol concentration in an adult male of about 150 pounds who has consumed six 12 ounce beers in two hours.
We will then use this model to experiment with other scenarios: • different body weights • different types of alcohol • whether the drinker has food in his stomach • male versus female drinker • social drinker versus an alcoholic
The Situation

www.ccmodelingsystems.com
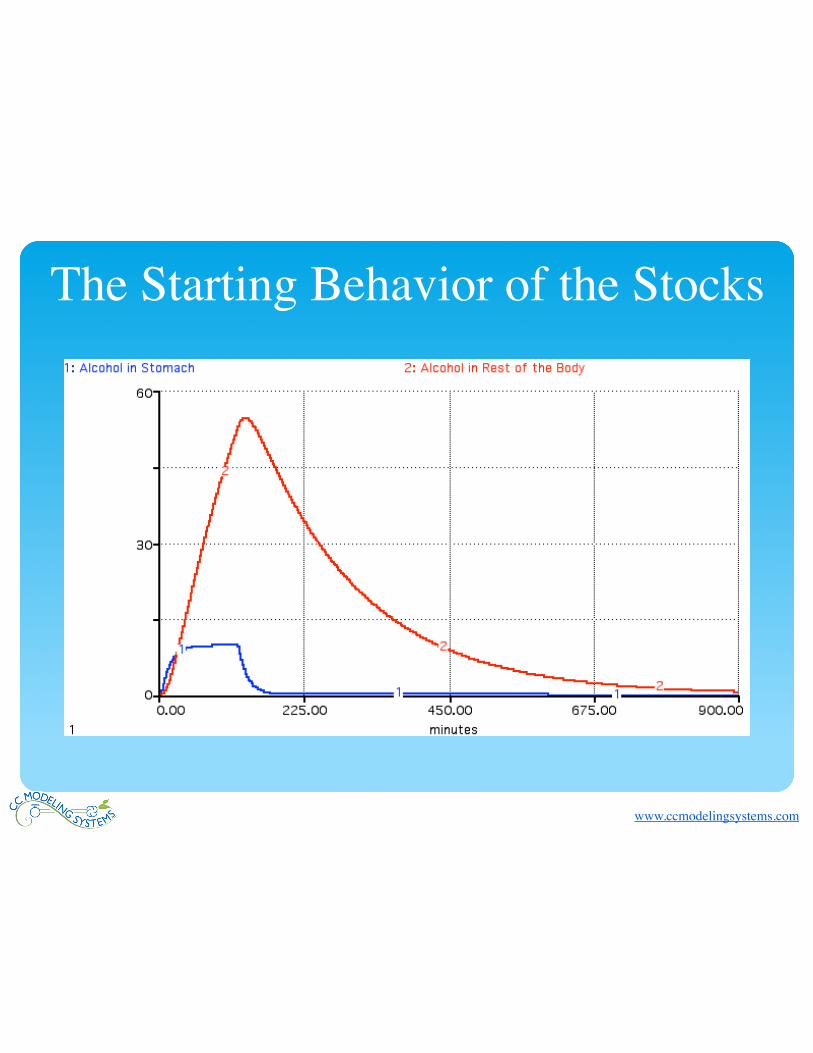
Since the alcohol will enter the stomach and then be absorbed into the bloodstream, we will use the basic two compartment structure of drug model 3 as our starting point. We will assume the person who is consuming the alcohol will be sipping the alcohol at a slow steady pace for two hours, so the inflow will be constant, and turned off after two hours. The normal absorption rate will be about 7% per minute. The normal elimination rate will be 0.6% per minute.
More Details

www.ccmodelingsystems.com
The Starting Stock/Flow Diagram
www.ccmodelingsystems.com
The Starting Behavior of the Stocks

www.ccmodelingsystems.com
More Accurate Model Produces Much More Accurate Behavior

Resources 1. Online Courses in STELLA Modeling www.ccmodelingsystems.com
2. STELLA Software www.iseesystems.com Books of Lessons: www.iseesystems.com/store/k12.aspx 3. Creative Learning Exchange www.clexchange.org 4. Contact: Diana Fisher

www.ccmodelingsystems.com
Thank You

www.ccmodelingsystems.com
Extra

www.ccmodelingsystems.com
A Year-Long System Dynamics Modeling Course
for Students Grades 9 - 12Prepare students to identify and analyze problems in the world from which they can gain understanding by building and analyzing System Dynamics models.
Develop skill in model building, in analyzing model design and output/feedback, and in explaining what they learn.
(Course taught for 20 years to students grades 9-12.)

www.ccmodelingsystems.com
A Few of the Original SD Models Produced
by High School Students

www.ccmodelingsystems.com
Hybrid Inventory Active Hybrid Vehicles
Order Fulfillment Becoming ObsoleteActual Production
Hybrid DemandBacklog
Average LIfespan of Car
New Demand
Perceived Backlog
of Hybirds
Fulfilling Demand
Desired Shipment Rate
Target Delivery
Time
Gap Between Inventory and Order Fulfillment
Unmet Demand
Change in Perception
Real and Perceived Availability Gap
~Effect of Price on Demand
Normal Customer Order Rate
Actual Customer Order Rate
Delay in Availability Perception
Price of Oil
Changing Oil Price
~Effect of Oil
Price on Demand
Normal Oil Price
Price of Hybrid
Normal Price of Hybrid
~Effect of Backlog on PriceRatio of Actual to Normal Price
~Effect of Perceived Backlog on Demand
Production Capacity
Constructed Capital
Constructing Startup
Normal Backlog
Closing
Time to Construct
Actual Lifespan of Factory
Time to Startup
Ratio of Desired Production to Capacity
~Effect of Capacity Availability
on Construction Starts
~Effect of Capcity
Availability on Closures
~Effect of Ratio of Actual Production
to Capacity on Factory Life
Normal LIfespan of Factory
Normal Hybrid Inventory
~Effect of Inventory Ratio
on Desired Production
Shipping Time
Supplying
Desired Production Hybrid Production
Desired Production
~Effect of Price on Desired Production
Normal Rate of Construction
Ideal Utilization
Ideal Utilization
Change
Hybrid Carsage18

www.ccmodelingsystems.com
Hybrid Inventory Active Hybrid Vehicles
Order Fulfillment Becoming ObsoleteActual Production
Hybrid DemandBacklog
Average LIfespan of Car
New Demand
Perceived Backlog
of Hybirds
Fulfilling Demand
Desired Shipment Rate
Target Delivery
Time
Gap Between Inventory and Order Fulfillment
Unmet Demand
Change in Perception
Real and Perceived Availability Gap
~Effect of Price on Demand
Normal Customer Order Rate
Actual Customer Order Rate
Delay in Availability Perception
Price of Oil
Changing Oil Price
~Effect of Oil
Price on Demand
Normal Oil Price
Price of Hybrid
Normal Price of Hybrid
~Effect of Backlog on PriceRatio of Actual to Normal Price
~Effect of Perceived Backlog on Demand
Production Capacity
Constructed Capital
Constructing Startup
Normal Backlog
Closing
Time to Construct
Actual Lifespan of Factory
Time to Startup
Ratio of Desired Production to Capacity
~Effect of Capacity Availability
on Construction Starts
~Effect of Capcity
Availability on Closures
~Effect of Ratio of Actual Production
to Capacity on Factory Life
Normal LIfespan of Factory
Normal Hybrid Inventory
~Effect of Inventory Ratio
on Desired Production
Shipping Time
Supplying
Desired Production Hybrid Production
Desired Production
~Effect of Price on Desired Production
Normal Rate of Construction
Ideal Utilization
Ideal Utilization
Change
Hybrid Cars!Hybrid Carsage18
Factory Capacity! Backlog and!
Perceived!Backlog!

www.ccmodelingsystems.com
Workforce Pressure
age 18
employeeshiring
and firing
employeegap
employees
desiredemployeestime between
staff adjustments
workload
normalproductivity
perceivedsatisfaction
wage
normalwagechange in
wage
wagegap
desiredwage
time betweenwage changes
managementevaluation
time
change insatisfaction
satisfaction gap
actualsatisfaction
time forperspectives
to change
normalsatisfaction
stressratio
work
new work
amountof new work
workcompletion
actual workerproductivity completed
work
expectedwage
~effect of
work ratio onproductivity
expectedworkload
productivity
~effect of
stress ratioon productivity
workratio
workratio
effect ofwork ratio
on satisfaction
~effect of
work ratio onexpected wage
wageratio
~
effect ofwage ratio
on satisfaction
total effecton productivity
managementevaluation
time
work neededper week
employeesafety net
~effect of
overwork onsatisfaction~
effect ofunderwork onsatisfaction
information!delay!
information!delay!
material delay

www.ccmodelingsystems.com
Cervical Cancer
ages 16 PersistentHPV Infected
Females
Females Developing
Persistant HPV
Total US Female Population
Females RecoveringFrom CancerSexually Active
Uninfected Female
Dwell Time to be Considered
Persistent
Death Rate HPV Persistant
Females
Developmentfrom HPV to
Cancer
Years to Recover from HPV
Cervical CancerDeath Rate
Non SexuallyActive Females
Females Becoming Sexually Active
Dwell Time
Births
Cervical Cancer Infected
Deaths with Cervical Cancer
Deaths of HPV Persistant Females
Percent Recovering From HPV
Normal Deaths
Female Birth Rate
Time to Contract Cervical Cancer
Females Recovering from HPV
HPV Infected Females
Females Contracting HPV
Normal Female Death Rate
Percent Females Contracting HPV anually
Percent Recovering From Cancer
Percent That Develop Cancer without Pap Test and Treatment
Contracting Cervical Cancer not from HPV
Contraction Ratefor Cervical Cancer
not from HPV
Percent Females developing
Persistent HPV
Percent Receiving Pap Tests
Deaths of HPV Infected Females
HPV Infected Death Rate

www.ccmodelingsystems.com
Tay-Sachs Genetic Screening
Newborns
Carriers
Screened Carriers
Nonafflicted Afflicted
Nonafflicted Births
Carrier Births
Screening
Afflicted Births
Pregnancies
Birth Rate
∑
Total Population Minus Afflicted
Nonafflicted Nonafflicted
∑
Total Population Minus Afflicted
Nonafflicted Deaths
Carrier DeathsScreened Carrier Deaths
Afflicted Deaths
Afflicted Death Rate
Death Rate
Death Rate
Rate of Screening
Chance of Screening a Carrier
Carrier Carrier
New Carrier Mutations
∑
Non Nonafflicted Births
Nonafflicted CarrierCarrier Carrier Result
Nonafflicted Carrier Result
∑
Total Population
∑
Screened Population
Carrier Carrier
∑
Nonafflicted Population
∑
Total Carrier Population
Screened Nonafflicted
Non Screening
Proportion Carriers
New Afflicted Mutations
Scr Non Death
Rate of Screening
Chance of Screening a Carrier
How Does Genetic Screening Affect a Closed Community Afflicted with the Tay-Sachs Disease? !
by Charles Runckel and Ben Zimmerman �ages 16

www.ccmodelingsystems.com
Portland Traffic
ages 15
Metro Population
Busses
East Side Light Rail Riders
Change in Riders
Percent that ride light rail
Init Percent ride light rail
Average Car Commuting Time
~Effect of Average Commuting Time
on Percent that ride Light Rail
Change in Metro Population
Metro Initial Growth Rate
~Effect of Metro Density on Metro Growth Rate
Metro Growth Rate
Number of Commuters
Land in Metro Growth Boundry
Initial Density
Current Density
Current Vs Initial Density
Bus RidersChange in Bus Riders
Percent Bus Riders
Drive Alone
Change in Drivers
Percent that drive alone
Car Poolers
Change in Car Poolers
Percent Car Poolers
Lane Miles in the Metro Area
Cars per Lane Mile
BussesRiders
per bus
Cars
Cars used for car pooling
People per car pool
Init vehicles per lane mile
Current Vs Init Traffic
Init Percent Drive Alone
Average Car Commuting Time
Average Car Commuting Time
Init Car Commute time
Current Vs Init Traffic
~Effect of Commuting time on Percent that ride the bus
Init Percent Bus Riders
Average Car Commuting Time
~Effect of Commuting time on percent that drive alone
INIT Car Poolers Percent
Average Car Commuting Time
~Effect of Average Commuting time on Percent that car pool
Percent Commuters
Current Density
Cars
Cars used for car pooling

www.ccmodelingsystems.com
Resources Some Student Work Model Diagrams, Papers, Some Video Presentations
http://www.ccmodelingsystems.com/student-projects-highlights.html
http://www.ccmodelingsystems.com/student-projects-videos.html
http://www.ccmodelingsystems.com/student-projects-other.html