studentlife predictive modeling hongyu chen jing li mubing li cs69/169 mobile health march 2015
TRANSCRIPT

STUDENTLIFEPREDICTIVE MODELINGHongyu Chen
Jing Li
Mubing Li
CS69/169 Mobile Health
March 2015
Motivation• Let’s go further than StudentLife 1.0!
• Standardized, normalized data set• Proof of concept• Scientific finding to our question:
Can we predict depression from a two week window
of StudentLife data collection?
• Study Design• Data cleaning/parsing• Feature selection• Class determination• Predictive classifiers through supervised machine learning
methods• Validation• Case study

StudentLife Dataset
PHQ9 Threshold
Non-depressed whole time
Depressed whole time
Depresstion status changed
EMA: SleepMoodStressSocialExercise, etc.
Sensor:AudioConversationActivityDark,etc.
Feature
Class
SVM, etc.
Prediction
N-fold CV
Result analysis
Accruacy F statisticsPrecision/ RecallSensitivity/Specificity
Data Preprocessing & Interpolation:• Linear • Nearest
Neighbour • Concatenation
Case Study
PCA
Data separation by week
Project Design/Workflow
Feature Selection
Class Determination via Thresholding• Why?
• Keeps it a classification problem, not a regression problem• Depression presents in many different ways• Small sample size
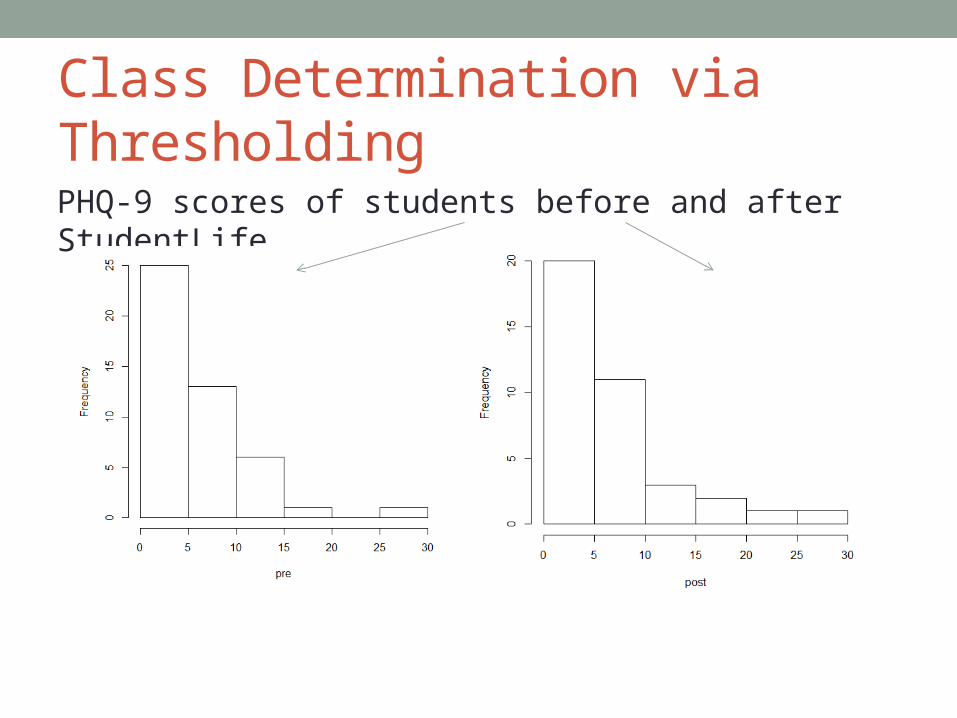
Class Determination via Thresholding
PHQ-9 scores of students before and after StudentLife

Class Determination via Thresholding• Threshold determined by visual inspection on strip plot
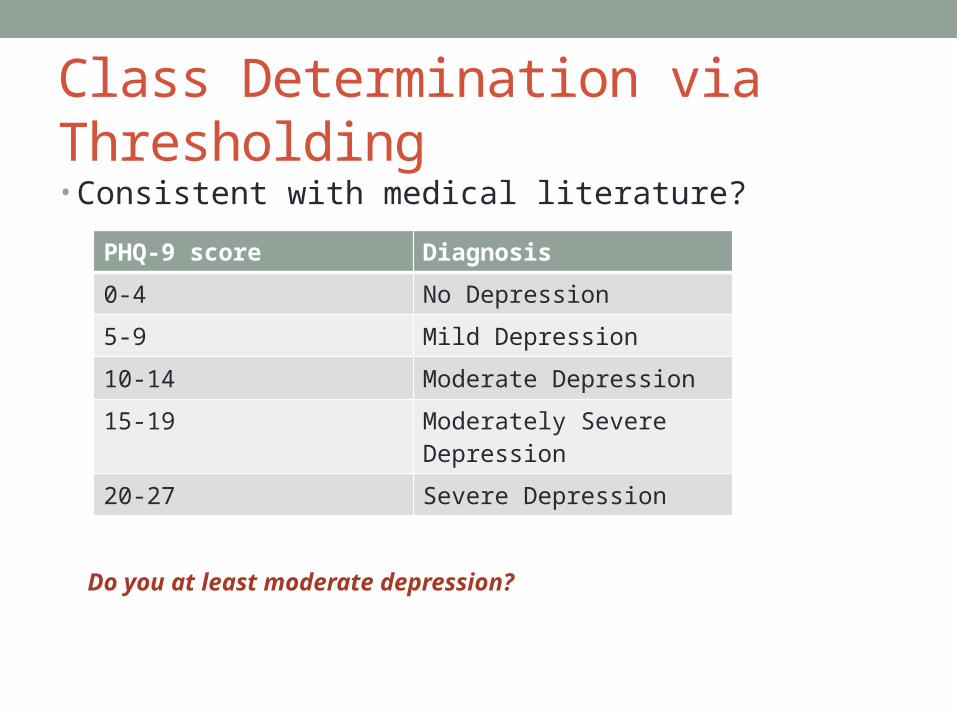
Class Determination via Thresholding• Consistent with medical literature?
PHQ-9 score Diagnosis
0-4 No Depression
5-9 Mild Depression
10-14 Moderate Depression
15-19 Moderately Severe Depression
20-27 Severe Depression
Do you at least moderate depression?
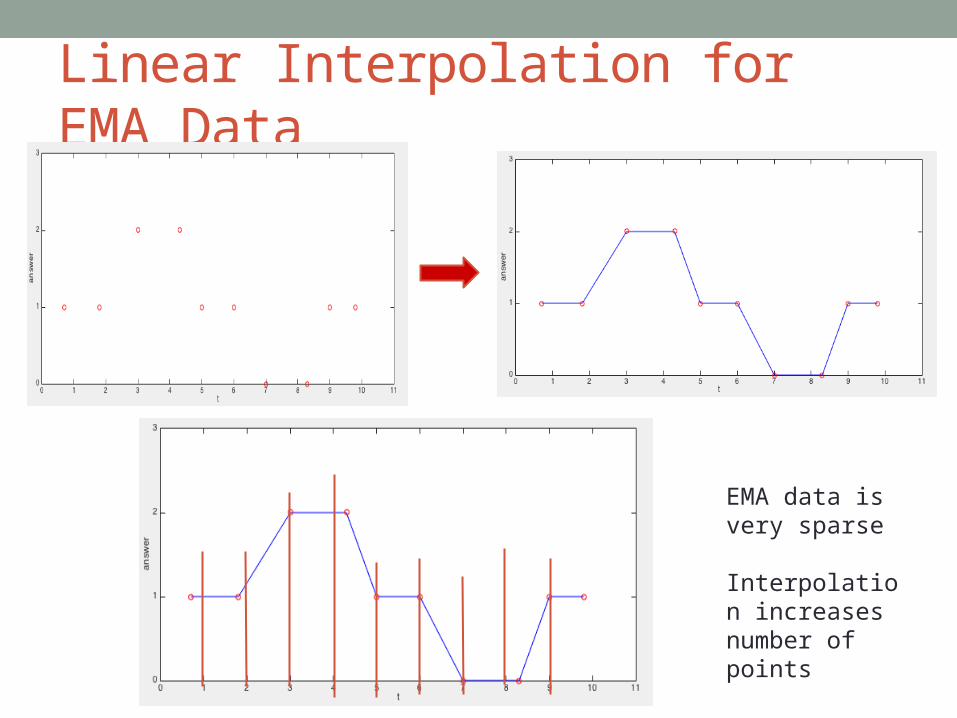
Linear Interpolation for EMA Data
EMA data is very sparse
Interpolation increases number of points
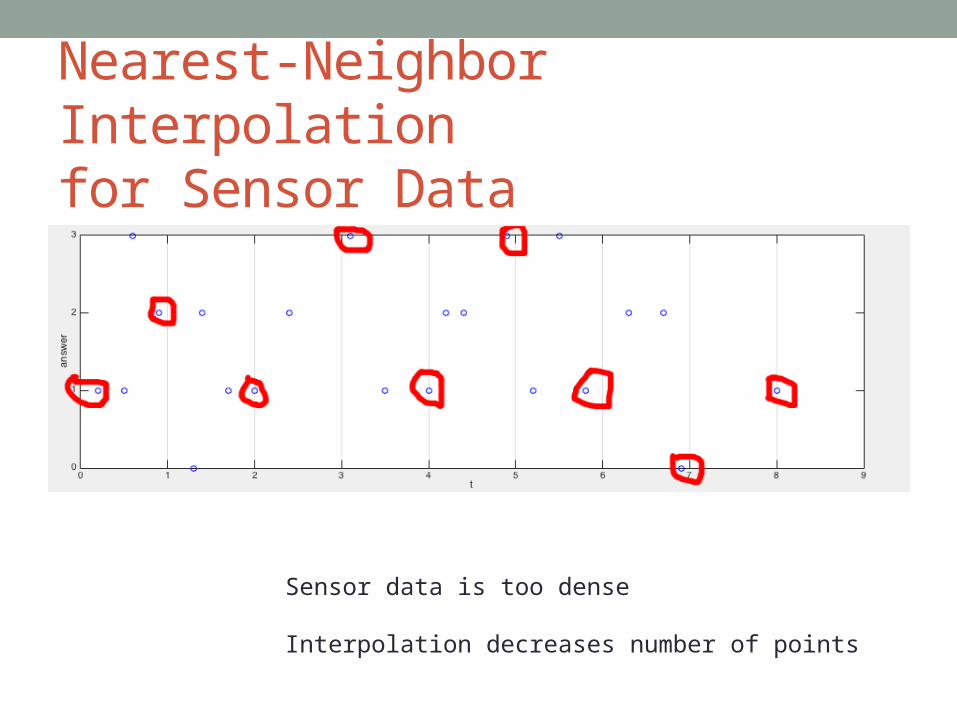
Nearest-Neighbor Interpolation for Sensor Data
Sensor data is too dense
Interpolation decreases number of points
Standardized Data Set?• In the first iteration of StudentLife:
• Every data collection modality had• Different scaling• Different periodicity• Different quality
• Now:• All 15 depression-related modalities have
• One value per 24-hour period• Comparable scaling• A guarantee of good quality (279 samples removed)
Feature Selection• Step 1:
• Decide sliding window time frame• Two weeks
• Balance of enough time to make diagnosis, but short enough to have enough time points for testing
• Step 2:• Feature aggregation
• Step 3:• Dimensionality Reduction• We cannot use 105 dimensions to classify only a couple hundred
cases!
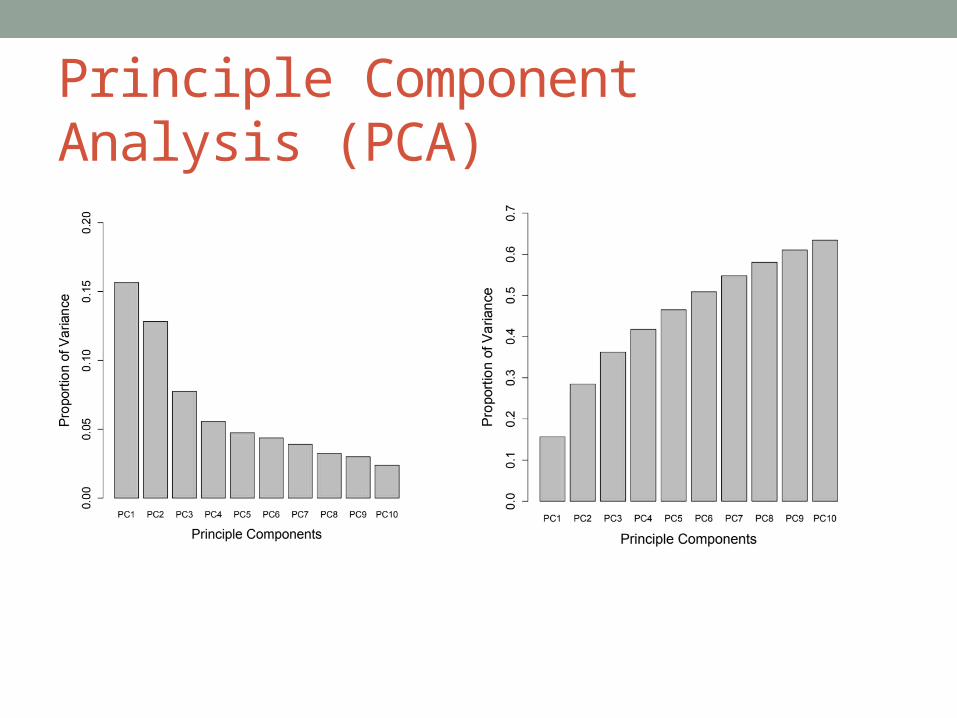
Principle Component Analysis (PCA)
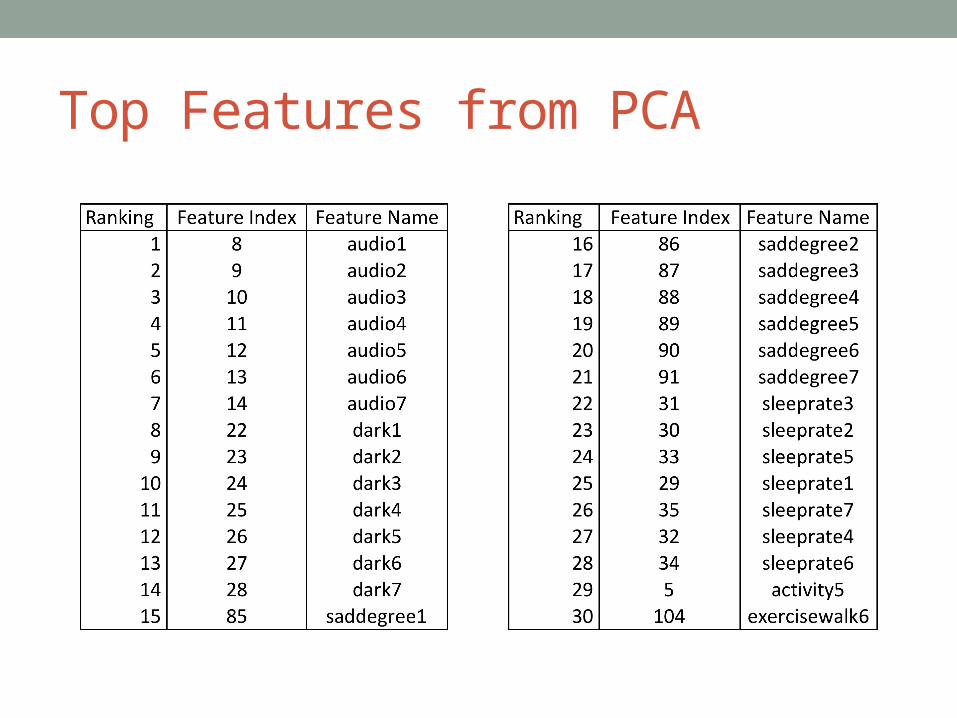
Top Features from PCA
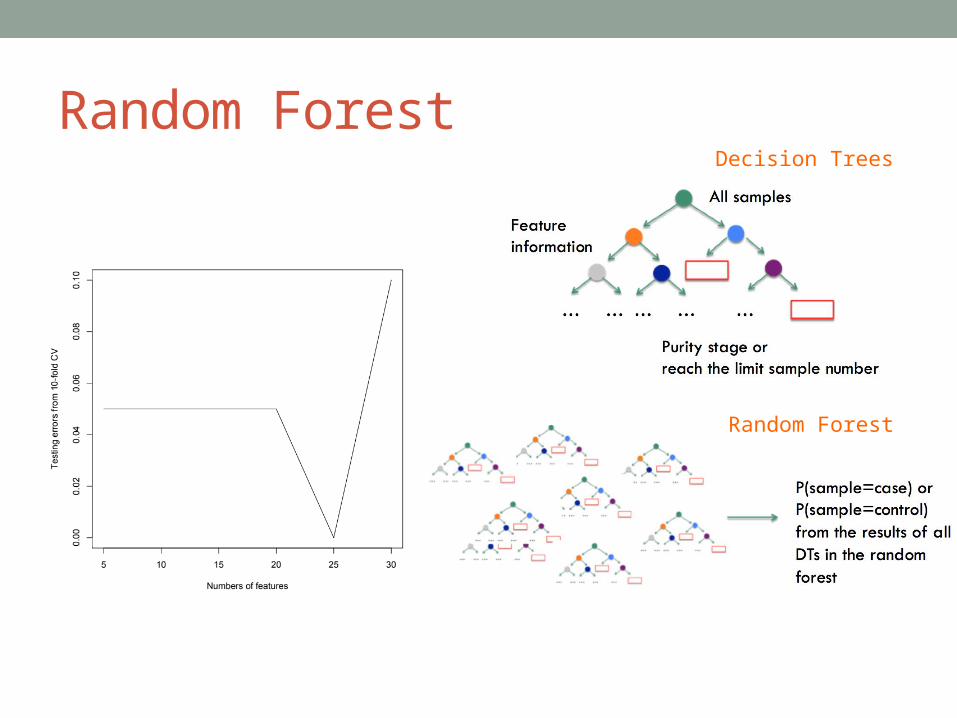
Random Forest
Random Forest
Decision Trees
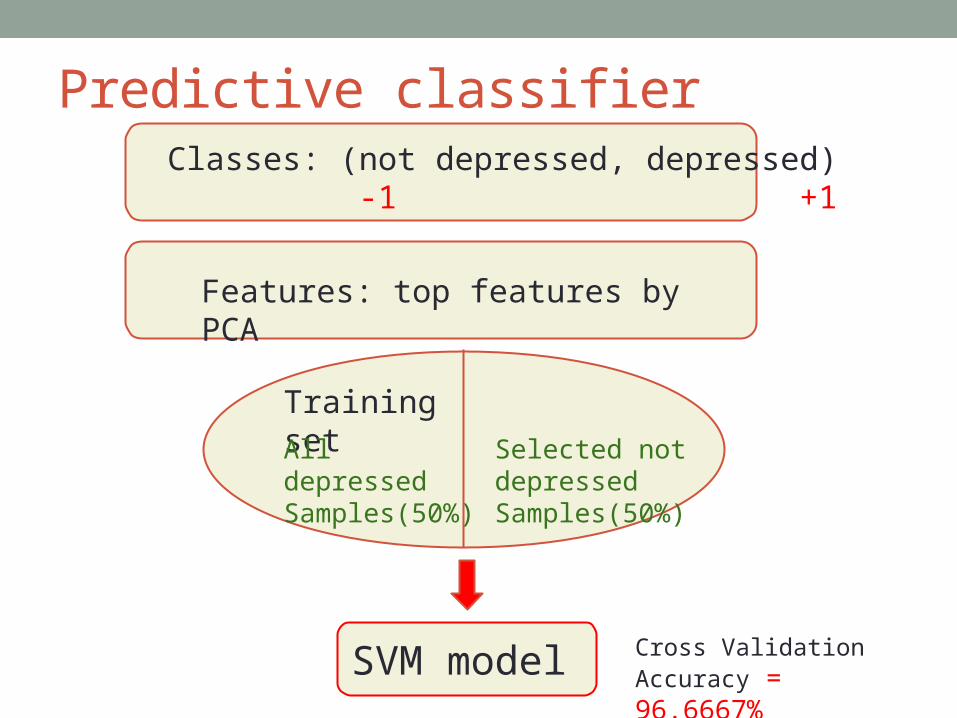
Predictive classifier Classes: (not depressed, depressed)
-1 +1
Features: top features by PCA
Training set
All depressedSamples(50%)
Selected not depressedSamples(50%)
SVM model Cross Validation Accuracy = 96.6667%
Case study
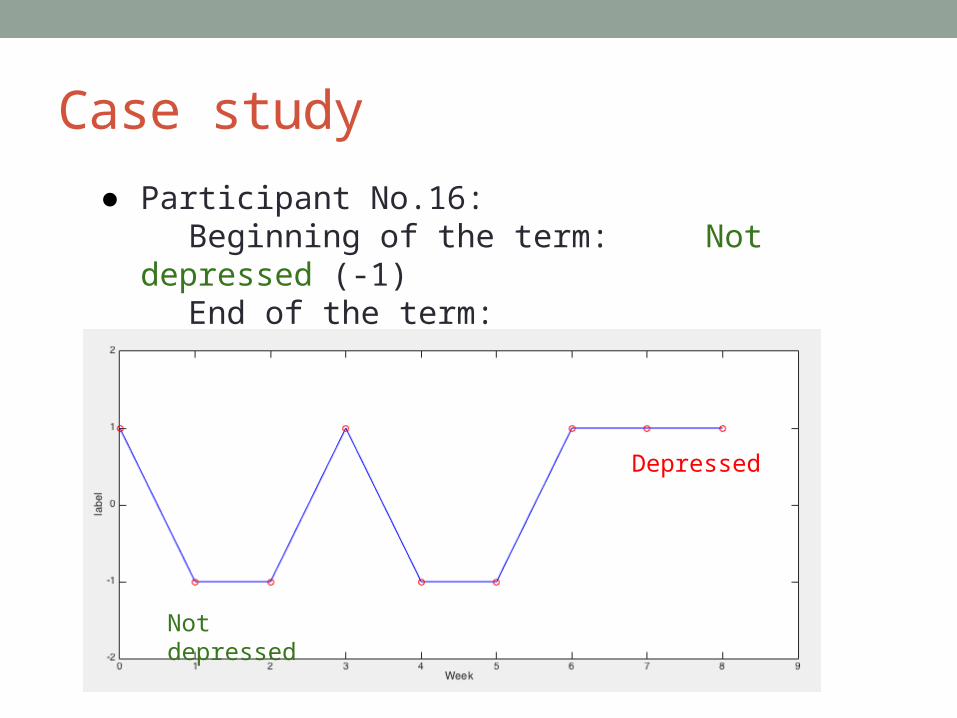
● Participant No.16:Beginning of the term: Not depressed (-1)
End of the term: Depressed (+1)
Not depressed
Depressed
Future Directions• Why is this important?
1. Contributes (marginally) to existing medical literature about depression
2. Proof of concept for possible interventionsImagine app that tells you when you could be depressed
Connects you with resources to help
3. Standardized data set availableOpens door to future analyses
Not only on depression
Small taste of the beginnings of…
StudentLife2.0?