student support through extended programmes at … support through extended programmes at south ......
TRANSCRIPT

Student Support through Extended
Programmes at South African Universities
Prof AJM(Maritz) SnydersDirector: Centre for Extended
Studies
23rd First-year experience conference Hawaii
23rd First-year experience conference Hawaii

Presentation outline
South AfricaSouth African Higher Education SystemPort ElizabethNelson Mandela Metropolitan UniversityAlternative Access programmes at NMMU
•Foundation Programmes•Extended Programmes
Evaluation of programmesConclusion


South Africa
Population of SA about 50 million in 200980% African, divided in 8 major indigenous groups with Xhosa and Zulu the largest
10% White9 Provinces11 Official languages – only 17% English home language
Capital Pretoria Parliament in Cape TownFirst Democratic election in 1994; ANC; President Nelson Mandela; Jacob Zuma

South African Higher Education
39 Universities and Technikons before 1994Historically divided on racial grounds Access to all opened after 1994Reduced though mergers in 2004/5 to 23, divided in 3
categories (political rather than educational reasons):
• Traditional universities offering general formative and professional degrees up to Doctoral level
• Universities of Technologies offering diplomas and certificates with a strong vocational focus
• Comprehensive universities offering both degrees and diplomas

South African Higher Education
Typical Diploma structure: 3-year qualification including:- 2 years academic and practical work on campus- 1 year experiential learning in a workplace situation
Typical degree structure:• 3-year undergraduate formative Bachelors• 1-year specialized Honours • Or 4-year professional Bachelors eg Pharmacy,
Engineering• Masters and Doctors
Current debates around extending the formal undergraduate time by 1 year by including foundational support to improve retention and graduation rates

Problems in SA HE
Unequal schooling system with learners from township and rural schools unprepared for Higher Education studies
Low participation rate of certain population groups – pressure on universities to increase access
High drop-out ratesLow retention and graduation ratesSkewed level of performance between different population groups

NATIONAL PARTICIPATION RATE IN HIGHER EDUCATION
Gross participation rate: All HE participants as % of 20-24 age-groupNational HE participation rate was 17% in 2008

Graduation in regulation time
If we omit distance education students, only a minority of the intake (about a third or fewer) graduate in 4 years, even though most programmes are formally 3 years or less.
All Programmes (incl dist)
22%
Universities (excl dist) 36%
Technikons (excl dist) 26%

Graduation within 5 years (excl distance)
General academic first B-degrees (3-year programmes) Field of study Overall White Black
Business/Management
50% 72% 33%
Life & Physical Sciences 47% 63% 31%
Mathematical Sciences 51% 63% 35%
Social Sciences 53% 68% 34%
Languages 47% 68% 32%

Attempted solutions
Variety of support programmes outside the curriculum since mid 1990’s, but no special financial support from government
Alternative access programmesEarmarked foundational provision funding since 2004 in 3 year cycles for:•One-year Foundation Programmes (only until 2006), and
•Extended Curriculum programmesDebates about increasing minimum time of first qualifications

Port Elizabeth, South Africa

Port Elizabeth
Port Elizabeth the largest city in Eastern Cape About R1.2m peopleMajor automotive industryPart of larger Nelson Mandela Bay Metropolitan area
Host city for FIFA 2010 Soccer World CupKnown as “Die Baai – The Bay”, “The Windy City” or “The Friendly City”
Only one university in the Metropolitan area, the Nelson Mandela Metropolitan University (NMMU), also known as the No More Money University

Nelson Mandela Metropolitan University

Nelson Mandela Metropolitan University
Comprehensive university formed in 2005 through the merger of:
• University of Port Elizabeth
• Port Elizabeth Technikon (University of Technology)
• Port Elizabeth campus of Vista University 22 000 students – 56% Black, 27% White, 52% Female5 campuses in Port Elizabeth and 1 in George English used as Language of Teaching & LearningAbout 26% with English as home language – 40% Xhosa;
15% Afrikaans – more than 30 diff home languagesEastern Cape worst school performance of all provinces

GEOGRAPHIC SPREAD OF ALL 2009 NMMU ENROLLED STUDENTS

NMMU
7 Faculties (Colleges or Schools):
• Sciences, Health Sciences, Arts, Business & Economic Sciences, Law and Engineering, the Built Environment and Information Technology
Higher Education Access and Development Services (HEADS)
• Centre for Extended Studies (CES)
• Centre for Teaching, Learning and Media
• Student Counselling
• Centre for Admission Assessment and Research

Alternative Access Programmes
Pre-merger:
• One year foundation programmes at UPE (since 1999) & PET (since 1997)
• 4-yr Science degree at UV (since 2001)Post merger
• One-year Foundation Programmes until end of 2006
• Replaced from 2007 by series of extended degree, diploma and certificate programmes
Decision to changed due to financial reasons and not educational reasons
Current debates about ownership and management

NMMU Foundation and extended ‘04 to ‘10
Merger in 2005, but started to cooperate in this area in 20042004 to 2006:
• Foundation for degrees in Science, Commerce, Pharmacy, Nursing, Liberal Arts and Law
• Foundation for diplomas in Science, Engineering, Commerce, Art and Health
2007 onwards:
• 4-yr degrees in Science, Commerce, Liberal Arts
• 5-yr degrees in Pharmacy, Law, Nursing
• 4-yr diplomas in Chemistry, Accountancy, Art, Engineering, Management

Foundation vs Extended
FOUNDATION EXTENDED
Additional year between school and university – also called bridging year
Extending standard period of study by 1 year by spreading first year over 2 years
Non-credit bearing and not funded by government
Credit-bearing and funded by government (earmarked)
Foundational and preparatory content
First year content with additional foundational provision
Outcome to prepare for entry into first year courses
Outcome similar to that of first year courses
Intensive support over 1 year Less intensive support spread over 2 years

Foundation vs Extended
FOUNDATION EXTENDED
Lower admission requirements – focus on access
Stricter admission requirements – focus on throughput & retention
Strict rules for continuation to mainstream
Less strict promotion criteria
Offered by AD specialists and teachers
Offered by AD specialists and faculty
Managed from a centralized unit
Matrix management between central unit and faculties
Better integration between different components
Better integration with mainstream

Special support given in Found & Ext progs
Holistic approach• Academic and Life management programme
• Language development• Career guidance• Mentoring – individual and group
Integration• Skills and content• Vertical between Foundational and mainstream
• Horizontal between different componentsDedicated staff – teachers rather than lecturersSmall groups (25 to 30) & out of classroom consultations

Success of foundation and extended
Ultimate measure of success is the number of students obtaining a qualification
Formative impact on the lives of student, even if they do not qualify can unfortunately not be measured
Can only trace the performance of students staying at own university – often looses best students to other places, and are reflected as drop-outs
Too early to determine graduation rates of extended programme students as first intake of students in 2007 – first graduants end of 2010
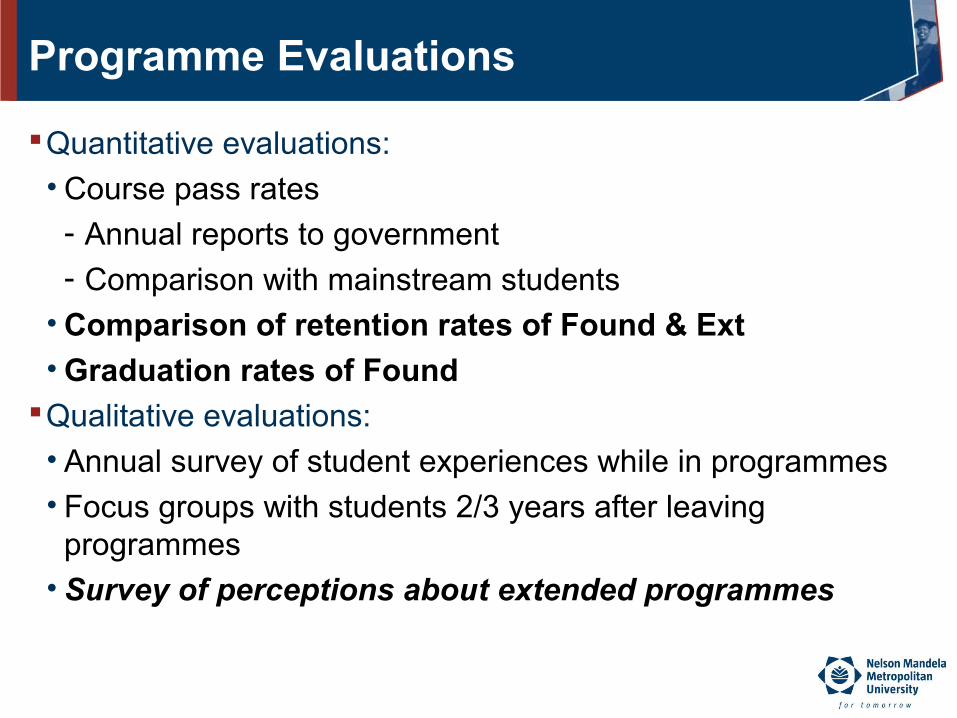
Programme Evaluations
Quantitative evaluations:• Course pass rates
- Annual reports to government- Comparison with mainstream students
• Comparison of retention rates of Found & Ext• Graduation rates of Found
Qualitative evaluations:• Annual survey of student experiences while in programmes• Focus groups with students 2/3 years after leaving
programmes• Survey of perceptions about extended programmes

Access and retention rates degrees
UFP ‘04 to ‘06 Ext deg ‘07 to ‘09
Start in yr n 1207 916 (3 cohorts)yr n+1 889 819 (3 cohorts)% of start in yr n+1 74% 89% (3 cohorts)yr n+2 770 516 (2 cohorts)% of start in yr n+2 64% 78% (2 cohorts)% of yr n+1 in yr n+2 87% 88% (2 cohorts)yr n+3 692 207 (1 cohort)% of start in yr n+3 57% 67% (1 cohort)
% yr of yr n+1 in yr n+3 78% 77% (1 cohort)

Access and retention rates diplomas
FP ‘04 to ‘06 Ext Dip ‘07 to ‘09
First reg (yr n) 854 634 (3 cohorts)
yr n+1 564 495 (3 cohorts)
% of start in yr n+1 66% 78% (3 cohorts)
yr n+2 484 313 (2 cohorts)
% of start in yr n+2 57% 70% (2 cohorts)
% of yr n+1 in yr n+2 86% 89% (2 cohorts)
yr n+3 404 132 (1 cohort)
% of start in yr n+3 47% 55% (1 cohort)
% yr of yr n+1 in yr n+3 72% 67% (1 cohort)

Conclusion about access and retention
Include students continuing in same programme and change to other qualifications
Greater levels of access provided through Foundation (2061) than through Extended (1550)
Drop out much higher at end of first year in Foundation than in Extended
Retention as a percentage of those who “survived” first year similar in two types, although slightly higher for Foundation
Slightly larger numbers expected to graduate from Foundation than from Extended

Retention & graduation rates Foundation
3-yr degrees Foundation ’04 to ’06 Mainstream ’02, ‘03
% return for 2nd yr 87% 82%
% return for 3rd yr 80% 51%
Graduate 30% 48%
Still studying 35%
Diplomas
% return for 2nd yr 86% 72%
% return for 3rd yr 72% 63%
Graduate 25% 44%
Still studying 30%

Deductions from tables
Comparing apples with pears: group of high risk and underprepared learners is compared with a group including top performers
Retention rates in foundation programmes higher A total of 1191 entered degrees and diplomas after doing
foundation in 2004, 2005 and 2006:• 373 obtained degrees or diplomas • 495 still busy with 1st qualification• 20 also obtained post-graduate qualifications• 85 currently registered for post-graduate qualifications
Many individual success stories/anecdotes of top performance in academics and leadership

Perceptions and practices in Ext progs
Survey done in 2009 to:
• To determine practices followed by SA Universities and to compare these with what NMMU is doing
• To determine the perceptions of various stakeholders about extended programmes
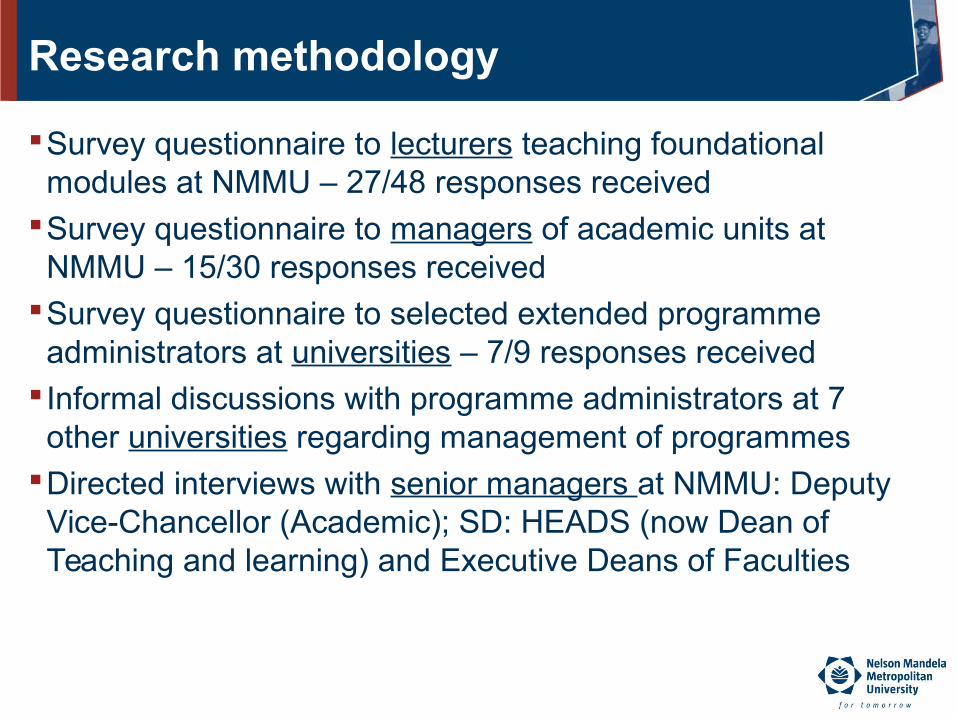
Research methodology
Survey questionnaire to lecturers teaching foundational modules at NMMU – 27/48 responses received
Survey questionnaire to managers of academic units at NMMU – 15/30 responses received
Survey questionnaire to selected extended programme administrators at universities – 7/9 responses received
Informal discussions with programme administrators at 7 other universities regarding management of programmes
Directed interviews with senior managers at NMMU: Deputy Vice-Chancellor (Academic); SD: HEADS (now Dean of Teaching and learning) and Executive Deans of Faculties

Why offer Extended Programmes
100% agree that there is a need for extended programmes
Lecturers and managers: Social responsibility to address inequalities and need to improve throughput rates chosen as most important
Senior managers: Provision of access and increased throughput rates
Universities: Social responsibility towards learners and increased pass rates

Structure of programmes
Is there still a place for one year foundation programmes and should it be funded:
40% of lecturers and 47% of managers have no opinionMost of remaining lecturers and managers believe there
should be FP’s in addition to ext programmes4 of 7 universities believe FP’s should be funded and 3 notAll senior manager believe FP’s has a place along ext progs
and should be fundedReasons given:
• For FP’s: One year foundation programmes are seen to target a different group of students
• Against FP’s: Should be on FET level, not HE
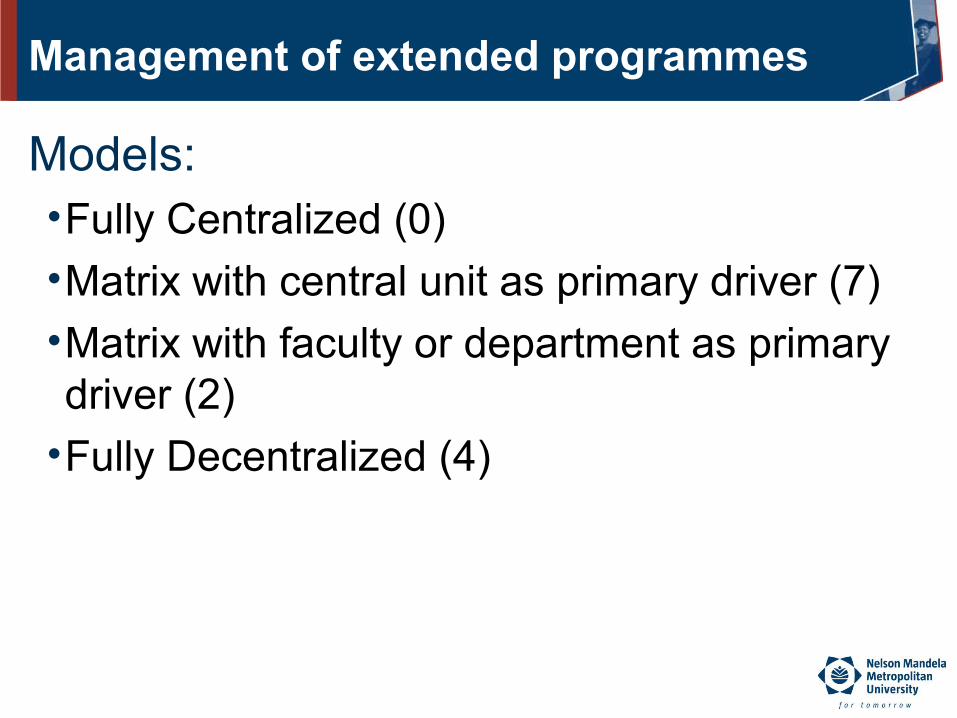
Management of extended programmes
Models:•Fully Centralized (0)
•Matrix with central unit as primary driver (7)
•Matrix with faculty or department as primary driver (2)
•Fully Decentralized (4)

Conclusion
Extended Programmes can both make a contribution towards address issues of access, retention and graduation rates.
More inter-institutional cooperation is neededA lot more research is neededCurrent practices is probably too diverse to draw clear conclusions about best practices
All eyes on the national debate regarding the minimum period of undergraduate studies, to see if the extended format may become the norm

References
Scott, I et al. “A Case for Improving Teaching and Learning in Higher Education”, in the Higher Education Monitor of the CHE, 2007.
Sheppard, Charles. Presentation to NMMU management on cohort throughput, retention and graduation rates, May 2008
Snyders, Maritz. Research report: Extended programmes: Practices and Perceptions, August 2009
