student projections - klein independent school district · student projections 5...
TRANSCRIPT

������ Student Projections 5 �Enrollment�trends�in�Klein�I.S.D.�has�fluctuated�annually�over�the�past�5�years,�with�each�year�between�2008�09�and�2011�12,�with�this�Fall�seeing�the�lowest�increase�of�just�over�350�students.��Between�the�Fall,�2007,�and�the�Fall,�2011,�a�five�year�period,�Klein�I.S.D.�gained�5,394�students�–�with�the�highest�growth�in�the�2010�11�school�year.����PASA’s�approach�to�developing�student�enrollment�projections�takes�into�consideration�past�rates�of�growth,�but�relies�primarily�on�forward�looking�analyses,�including:���
projected�new�housing�trends;��
regeneration,�and�also�decline,�in�older�neighborhoods;���
economic�and�employment�trends�in�the�local�area�and�nationally;���
the�changing�distribution�of�students�geographically�throughout�the�District;�and���
the�effect�of�aging�the�student�population�by�subdivision�and�apartment�complex,�as�well�as�by�Planning�Unit�–�by�grade�and�by�grade�group.�
�
Potential Effects of Employment Trends on K.I.S.D. �Houston�job�growth�has�been�touted�as�the�best�in�the�State�(from�August,�2010�to�August,�2011.��Not�surprisingly,�the�oil�and�gas�industry�is�the�leading�cause�of�this�job�growth.��But,�as�noted�in�Chapter�2,�it�is�important�to�keep�in�mind�the�impacts�of�unemployment�in�keeping�the�growth�rates�for�Klein�I.S.D.�fairly�slow.��The�latest�figures�indicate�no�change�in�unemployment�(which�was�8.6%�in�both�August,�2011�and�in�August,�2010).��But,�from�July,�2011�when�unemployment�was�8.9%,�there�has�been�a�slight�downturn�in�unemployment�levels.����Some�economists�warn�that�jobs�lost�in�the�recession�may�never�return�to�the�lowest�unemployment�levels�–�with�a�new�normal�of�higher�joblessness�and�lower�standards�of�living�for�also,�many.��The�rationale�is�that�(1)�construction�and�manufacturing�may�never�return�to�previous�levels;�and,�also,�(2)�many�small�and�midsize�business�may�struggle�a�long�time�to�obtain�bank�loans�to�expand.��Finally,�(3)�upper�socioeconomic��households�are�spending�less�because�of�losses�on�their�homes,�to�retirement�plans�and�other�investments,�and�lower�income�households�are�cutting�back�because�they�cannot�borrow�like�they�once�did.���
Population and Survey Analysts - October, 2011 Klein I.S.D. - Page 238
Projected Student Enrollment Districtwide �A. Klein�I.S.D.�is�unique�in�several�ways�that�ultimately�will�lead�to�a�unique�configuration�of�student�
growth�among�Texas�districts�of�20,000�plus�enrollment:��
1. The�District�has�the�15th�lowest�percent�of�free/reduced�lunch�students�of�any�large�district�–�0ut�of�64�such�districts.��
�2. The�District�has�a�high�median�educational�level�–�an�important�socio�economic�characteristic.��
�3. The�District�has�the�6th�highest�TAKS�passage�rate�of�any�large�district�in�the�Houston�area.�
�4. The�District�has�an�average�proportion�in�KN�but�7%�fewer�1st�graders�than�5th�graders�(as�of�last�
Spring,�2011)�–�only�Fort�Bend�and�Mesquite�had�a�smaller�a�greater�loss�of�1st�relative�to�5th�graders�–�out�of�58�districts�of�20,000�plus�enrollment.�
�5. Also�there�is�some�grade�“heaping”�in�the�5th�and�8th�grades�–�and�this�has�occurred�for�two�years�
in�a�row.��The�presumption�is�that�this�is�a�programmatic�or�policy�oriented�characteristic,�and�not�demographic.��It�has�not�been�continued�in�the�projections,�other�than�including�the�grade�level�bulges�that�are�already�existent.�
��B. Klein�I.S.D.�has�other�characteristics�that�will�also�aid�in�determining�the�number�of�added�
students�per�school�year�for�the�next�ten�years:��
1. The�District�is�remaining�stable�in�the�percent�of�housing�that�is�multi�family�(~20%)�and�the�percent�that�is�single�family�(~80%)—making�this�a�very�unique�district,�in�that�almost�all�districts�are�projected�to�increase�the�proportion�of�multi�family�units�out�of�all�housing�stock.�
�2. The�District�is�being�significantly�affected�by�The�Woodlands�employment�hub�and�will�be�
impacted�by�the�future�Exxon/Mobile�complex,�thus�attracting�a�significant�proportion�of�new�jobs�to�the�area�–�which�will�continue�over�the�next�ten�years.�
�3. The�District�has�higher�educational�levels�than�many�other�districts�in�the�HOUSTON�
Consolidated�Metro�Area�(64�districts),�so�that�unemployment�rates�will�remain�lower�than�average,�and�job�stability�will�remain�higher�than�average�–�thus�pulling�proportionately�more�jobs�into�the�District.�
�4. The�District�is�losing�students�per�occupied�home�–�down�to�0.63�as�the�ratio,�or�an�average�of�
about�2/3rd�student�per�home.��But,�oddly,�59%�of�the�subdivisions�had�ratios�that�went�up�and�41%�had�ratios�that�went�down�–�for�occupied�homes.��This�last�year’s�overall�ratio�was�0.7�while�the�year�before�was�0.62;�thus,�students�are�becoming�more��”dense”�in�already�built�out�neighborhoods.�
�
Population and Survey Analysts - October, 2011 Klein I.S.D. - Page 239
5. Based�on�this�Fall,�2011,�the�District�grew�in�two�types�of�housing:�(1)�increased�students�in�new�or�active�neighborhoods;�and�(2)�the�increasing�densities�of�apartments.���
�6. The�District�has�350�single�family�plats�that�were�filed�between�September,�2010�and�
September,�2011.��This�equates�to�2.8%�of�the�plats�filed�in�the�City�of�Houston�during�the�time.��
7. The�District’s�chief�predictor�of�younger�students�moving�into�K.I.S.D.�is�the�availability�of�loans�for�single�family�housing.���Based�on�the�small�growth�in�Kindergarten�students�this�Fall,�the�availability�of�these�loans�is�obviously�very�low�for�the�price�points�of�housing�attracting�entry�level�homebuyers�within�Klein�I.S.D.��
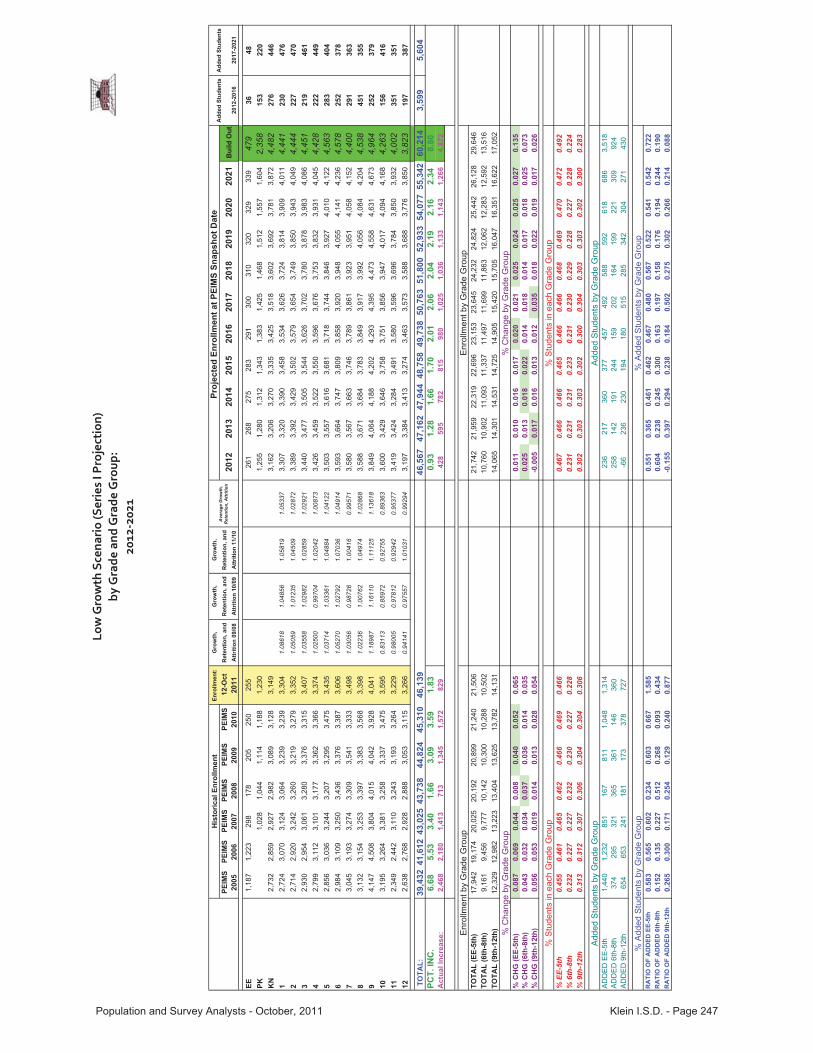
�For�the�Houston�area,�housing�starts�bottomed�out�at�70%�from�their�peak�in�early�2007.��This�sector�of�the�economy�is�still�stagnating,�and�it�will�take�at�least�4�years�to�return�to�a�much�subdued�“new�normal.”��The�“new�normal”�refers�to�a�much�slower�growth�pattern�for�new�housing,�and�for�additional�population�–�as�well�as�for�student�growth.���Between�2002�and�2007,�much�of�the�suburban�growth�in�the�Houston�region�was�due�to�two�factors:��(1)�easily�available�(typically�subprime)�mortgages,�and�(2)�accelerated�housing�demand�from�immigrant�populations�pushing�growth�outward�to�suburban�districts.��Neither�of�these�factors�is�currently�present,�nor�will�be�present,�in�the�“new�normal”�economy.���Three�scenarios�of�growth�have�been�developed�for�Klein�I.S.D.��These�scenarios�are�termed�the�“Low�Growth,”�the�“Most�Likely”�and�the�“High�Growth”�scenarios.��The�“Most�Likely”�scenario�assumes�little�change�in�the�lower�Kindergarten�growth�patterns�and�also�assumes�little�development�in�the�large,�as�yet�undeveloped�parcels�in�the�District.��The�bulk�of�the�continued�growth�in�the�“Most�Likely”�scenario�is�based�purely�on�the�new�single�family�housing�and�somewhat�on�added�apartments�(including�projected�in�fill�of�undeveloped�parcels).��The�scenarios�of�growth�developed�for�Klein�I.S.D.,�have�the�following�sets�of�assumptions.��Low�Growth�Scenario�–�It�is�critical�to�consider�the�lowest�projection�scenario�in�making�fiscal�planning�decisions,�given�the�unprecedented�economic�crisis�currently�experienced�by�Texas�school�districts�and�the�nation�as�a�whole.��Under�the�Low�Growth�Scenario,�the�District�would�add�3,599�students�in�the�first�five�years,�and�would�add�5,604�students�in�the�last�five�years�of�this�projection�period.��Therefore,�under�the�Low�Growth�Scenario,�by�the�Fall,�2016,�Klein�I.S.D.�could�have�49,738�students,�and�by�the�Fall,�2021,�55,342�students�could�be�enrolled�under�this�Low�Growth�Scenario.��Annual�growth�rates�could�range�between�around�.93%�and�2.34%�over�the�projection�period.����A�Low�Growth�Scenario�would�assume�the�following:����
The�perception�of�the�School�District�does�not�change,�and�younger,�elementary�aged�students�continue�to�move�to�suburban�districts;�
�New�apartments�will�decline�in�number�within�four�years,�down�to�perhaps�one�such�complex�per�year�oriented�to�students,�over�the�ten�year�projection�period;��
�
Population and Survey Analysts - October, 2011 Klein I.S.D. - Page 240
The�slower�growth�of�new�housing�(due�to�a�continued�slow�recovery�and�job�instability),�as�well�the�dampened�sales�of�existing,�older�home�sales�in�Klein�I.S.D�will�cause�the�K.I.S.D.�student�population�to�increase�very�slowly;�
�The�unemployment�rate�remains�at�7.7%�in�the�Houston�area,�and�does�not�return�to�4.5%�or�5%�unemployment;�
�Stock�prices�again�start�dropping�–�down�or�stationery����in�the�next�3�years;�
�Consumer�confidence�also�remains�stationary�����with�a�possible�renewed�recession;�
�Increased�terrorist�activity�within�the�U.S.; and�long�term�Iranian,�Afghan,�Iraqi,�North�Korean,�or�other�geo�political�war�effort.�
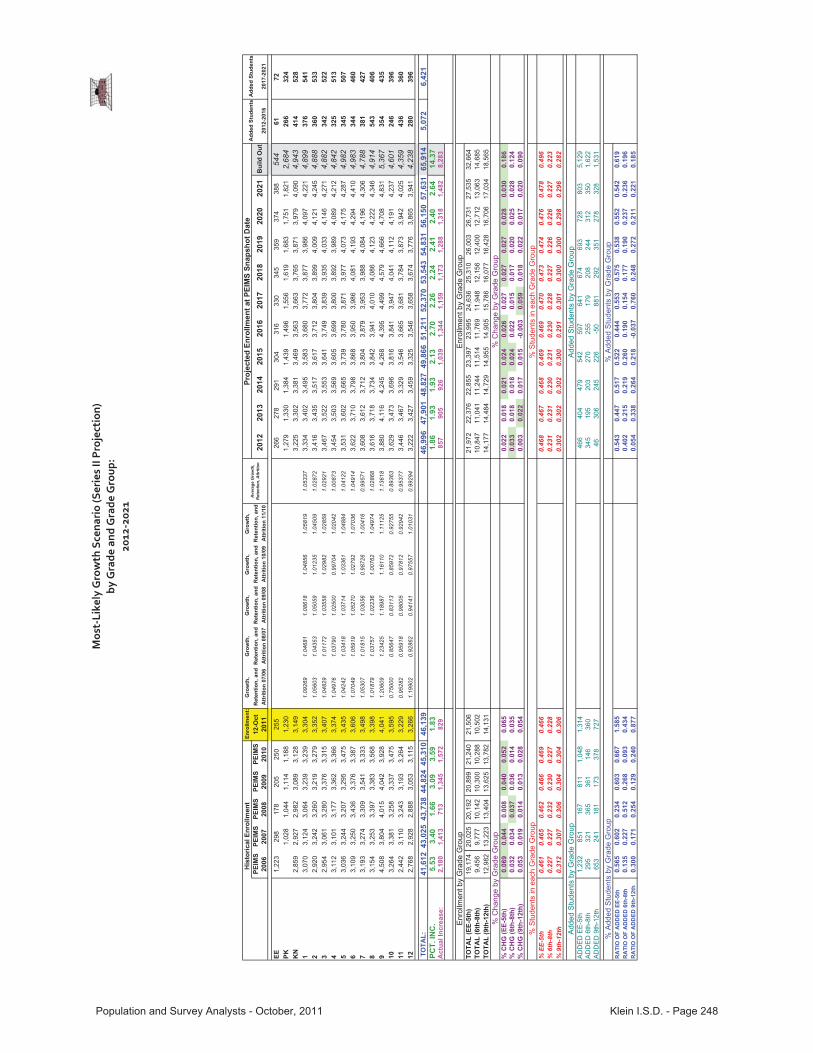
�Most�Likely�Growth�Scenario�–�The�Most�Likely�Growth�projections�series�shows�a�projected�annual�increase�5,072�students�over�the�next�five�years,�with�an�added�6,420�in�the�last�five�years�of�the�projection�period.��Therefore,�by�Fall�2016,�Klein�I.S.D.�could�have�a�projected�enrollment�of�51,211�students�and�by�Fall�2021�a�total�of�57,631�students.��Annual�growth�rates�could�range�from�1.86%�to�2.70%.������This�is�a�conservative�scenario,�and�does�not�assume�widespread�development�of�the�large,�still�undeveloped�parcels�in�the�District.���Also,�it�is�likely�that�all�multi�family�units�are�not�accounted�for�in�the�projections�of�new�housing�units�,�causing�the�student�projections�to�be�more�conservative,�because�these�developments�can�emerge�rapidly�and�in�unpredictable�locations.��For�example,�tracts�currently�planned,�and�even�platted,�for�commercial�uses�can�easily�flip�to�become�multi�family�oriented.���The�Most�Likely�Growth�Scenario�assumes�the�following:��
The�perception�of�the�School�District�remains�the�same�relative�to�other�surrounding�districts;��
A�greater�proportion�of��young�students�move�to�the�District�–�as�availability�of�mortgages�improve;�
�TDHCA�and�other�“for�market”�apartments�will�increase�by�about�two�complexes�per�year,�and�net�increases,�rather�than�declines,�of�students�in�all�existing�apartments�will�occur�during�the�ten�year�projection�period;��
�The��growth�of�new�housing�(due�to�a�continued�slow�economic�recovery)�will�continue�to�spawn�student�population�growth,�but�at�a�reduced�rate�later�in�the�decade�–�due�to�gradual�build�out;�
�Unemployment�rates�remain�at�7.4%�in�the�Houston�region�over�the�next�year,�but�slowly�return�to�5%�over�the�next�4�5�years;�
�
Population and Survey Analysts - October, 2011 Klein I.S.D. - Page 241

The�slight�increase�in�immigrants�entering�the�Houston�region�will�remain�stable�(similar�to�2010�11�rates;�
�Interest�rates�do�not�increase�by�more�than�2%�over�current�levels�for�the�next�five�years;�and�
�Iranian,�Afghan,�Iraqi,�and�other�global�concerns�do�not�accelerate.�
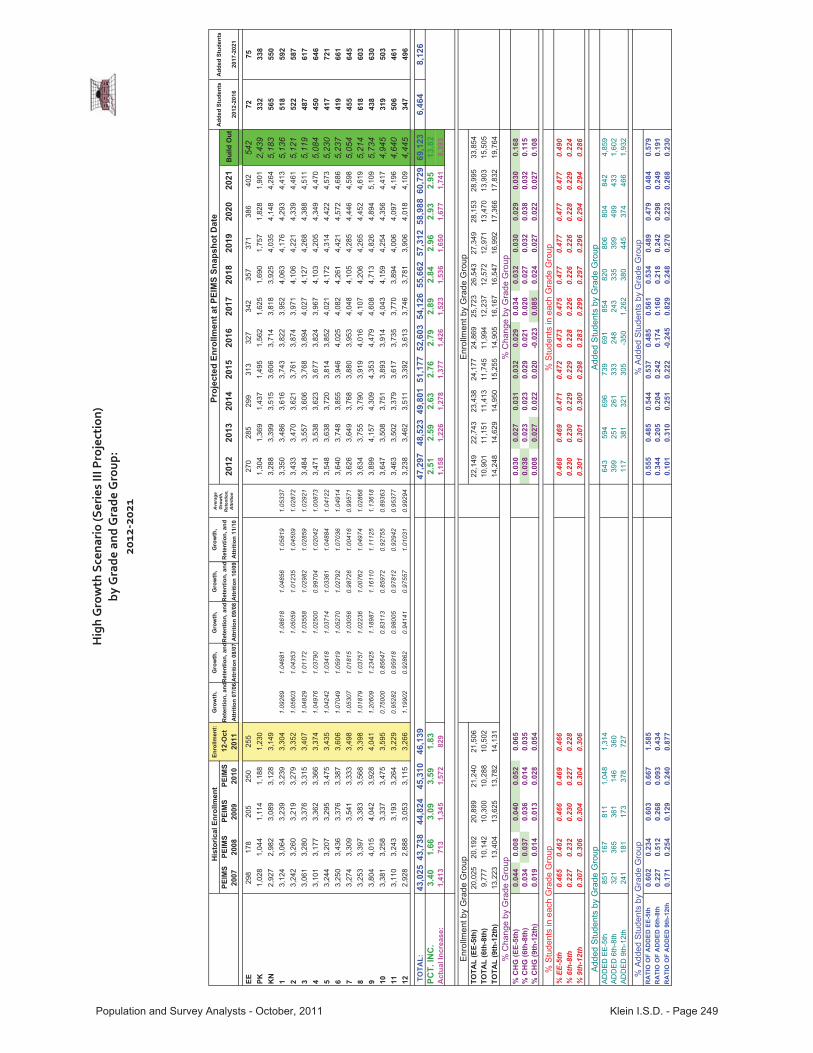
��High�Growth�Scenario�–�Under�the�High�Growth�Scenario,�the�District�could�gain�6,464�students�in�the�first�five�years,�and�an�additional�8,126�students�would�be�expected�in�the�last�five�years�of�the�projection�period.��Thus,�under�these�high�growth�assumptions,�Klein�I.S.D.�could�contain�52,603�students�by�2016�and�60,729�students�by�2021.��The�High�Growth�Scenario�assumes�the�following:��
Student�population�continues�to�increase�at�a�higher�rate�due�to�demand�for�both�existing,�older�homes�and�for�existing�apartments;�
�The�demand�for�new�housing�in�K.I.S.D.�will�accelerate�–�due�to�better�availability�of�mortgages;�
�Houston�area�unemployment�rates�begin�to�retreat�annually�–�starting�this�year�(2011)�–�and�will�return�to��5%�within�2�3�years;�
�Immigration�rates�will�again�rise�significantly,�further�encouraging�further�out�migration�to�suburban�districts�like�Klein�I.S.D.;�
�Interest�rates�do�not�rise�more�than�2%�in�the�next�5�years;�
�The�U.S.�has�short�term�deployment�in�Iraq�and�Afghanistan�and�no�other�global�wars,�and�no�increase�in�terrorist�activity�within�the�country.�
��
Build-Out �The�Klein�School�District�is�not�typical�in�that�some�multi�generational�parcels�may�still�remain�undeveloped�over�the�long�term.���If�some�subset�of�these�agricultural�tracts�do�not�develop�this�decade,�then�there�will�be�a�disjuncture�between�the�demand�for�new�homes�and�the�availability�of�lots.��If�these�parcels�do�not�develop�over�the�long�term,�then�the�District�could�fall�out�of�favor�with�new�homebuyers�by�the�time�that�these�landowners�actually�do�develop�their�tracts.��It�must�be�kept�in�mind�that�young�parents�often�want�new�infrastructure�in�a�newly�planned�suburban�environment.���So,�as�infrastructure�continues�to�age�in�the�cities�that�comprise�the�Klein�School�District,�then�new�homeowners,�as�well�as�developers,�will�be�less�interested�in�the�locations�of�these�large�undeveloped�parcels.����
Population and Survey Analysts - October, 2011 Klein I.S.D. - Page 242
Maps�are�included�in�the�second�chapter�that�detail�the�developable�land�and�the�density�of�students�in�the�previously�developed�portions�of�the�District.��As�noted�in�Chapter�2,�there�are�presently�approximately�30.4�square�miles�in�the�District�that�are�undeveloped�–�but�these�parcels�include�flood�plain�and�also�tracts�that�will�become�commercial�in�use.��As�of�2011,�there�are�740�students�per�square�mile,�including�existing�and�actively�building�out�subdivisions�and�apartments,�as�well�as�parks.���Also�shown�are�those�portions�of�the�District�that�have�some�factor�(waterway,�park,�flood�plain)�that�will�inhibit�development.��As�of�September,�2011,�there�are�30.4�square�miles�undeveloped�(although�6.9�square�miles�is�already�in�active�development�and�another�3�square�miles�is�planned�for�development�–�out�of�this�total).�����Students�Projected�at�Build�Out����Approach�One:��The�density�map�in�the�second�chapter�indicates�that�there�are�740�students�per�square�mile�in�the�built�out�area�(which�is�52.4�square�miles).��It�is�likely�that�this�will�become�about�855�students�per�square�mile�in�that�a�part�of�this�built�out�area�has�very�low�density,�such�as�one�home�on�four�acres.��So,�approximately�44,802�students�may�ultimately�reside�in�these�52.4�square�miles.����Then,�of�the�remaining�parcels�two�thirds�of�the�undeveloped�tracts�will�become�residential,�or�28.1�times�0.67�equals�18.83�square�miles�times�855,�or�16,097�students.��Thus,�summing�16,097�and�44,802�equals�60,899����or�about�61,000�students�at�build�out.���Students�Projected�at�Build�Out)����Approach�Two:��Another�way�of�looking�at�these�build�out�projections�is�by�appending�the�total�students�this�Fall�to�students�projected�via�the�estimated�number�of�added�housing�units�expected�of�the�future,�plus�expected�student�gains�and�losses�per�current�subdivision�and�apartment.����At�the�PEIMS�snapshot�data�at�the�end�of�October,�there�should�be�about�46,139�students�in�K.I.S.D.�schools.��Using�a�ratio�of�0.68�for�SF�and�0.40�for�MF,�then�there�will�be�approximately�5,651��added�students�in�new�single�family�homes�and�387��more�students�in�new�apartments�for�the�Klein�School�District�over�the�next�ten�years.��And,�there�will�also�be�added�students�due�to�increasing�densities�of�existing�housing�units,�including�existing�apartments�–�of�approximately�3,459�added�students.��Adding�the�four�subsets�of�students�above�suggests�55,636�students�by�the�Fall,�2021.�Then,�by�using�these�same�ratios�of�students�per�single�family�home�and�per�apartment,�and�including�the�projected�new�housing�expected�after�2021�until�build�out,�there�should�be�approximately�65,914�total�projected�Klein�I.S.D.�students�at�build�out.��������
Countervailing Trends in K.I.S.D. Relative to Houston Area��Characteristics�of�the�Texas�population�were�the�drivers�of�high�growth�in�the�suburban�Klein�School�District�between�2002�and�through�early�2007:���
A�large�proportion�of�the�acceleration�in�growth�was�due�to�high�immigration�–�propelling�existing�residents�outward�from�the�mature,�urban�core�of�metro�areas;�and�
�
Population and Survey Analysts - October, 2011 Klein I.S.D. - Page 243
Another�significant�factor�in�the�accelerated�growth�was�due�to�readily�available�mortgages����with�zero�down�and�low�collateral;�
�A�higher�quality�of�life�in�suburban�districts�with�new�infrastructure�and�new�land�uses,�including�new�schools�–�measured�by�median�household�income,�the�percent�of�disadvantaged�students,�and�other�factors�was�pulling�residents�to�Klein�I.S.D.;�
�Finally,�the�new�suburban�growth�wave�was�allowable�due�to�the�availability�of�large��undeveloped�parcels�for�subdivisions.�
�Most�of�these�drivers�of�growth�are�no�longer�predictive�reference�points,�or�they�are�highly�diluted�–�with�the�exception�of�large�tracts�of�undeveloped�land�that�remains.�����The�Slowing�of�Immigration��Immigration�affected�Klein�I.S.D�to�the�extent�that�it�allowed�for�relocation�out�of�“the�Loops”����since�there�was�a�new�demand�for�inner�core�housing,�which�allowed�for�outward�relocation�for�the�previous�inner�core�residents.��Also,�immigrants�provided�a�strong�construction�work�force�during�that�2002�2006�period.����Although�about�1�in�10�native�born�Mexicans�have�already�migrated�to�the�U.S.,�this�migration�has�slowed�by�60%�since�2006,�with�about�half�of�all�Mexican�immigrants�now�in�the�U.S.�legally,�as�of�2010.���Ten�years�ago,�1.6�million�illegal�immigrants�were�stopped�from�crossing�U.S.�borders,�but�in�2010�just�460,000�were�stopped.��Even�with�this�slowing,�about�58%�of�the�nationwide�population�increase�has�been�due�to�Hispanic�births.��And,�in�the�past�decade,�68%�of�Mexican�American�population�increases�are�due�to�births�(Houston�Chronicle,�July�15,�2011).���Thus,�the�slowdown�in�immigration�will�slow�potential�enrollment�increases�for�Klein�I.S.D.,�mainly�in�that�the�domino�effect�is�over�–�at�least�for�the�short�term.�����The�Proportion�of�Students�Who�Are�Disadvantaged��The�District�has�38%�free�and�reduced�lunch�student�population,�which�is�a�strong�factor�in�new�developers’�considering�the�potential�for�utilization�of�undeveloped�parcels�within�K.I.S.D.��since�it�is�so�highly�correlated�with�median�household�income�and�other�related�variables.��While�increasing�steadily,�this�proportion�is�still�lower�than�many�“closer�in”�districts,�making�Klein�desirable�to�new�residents.���Commercial�brokers�who�sell�large�parcels,�and�also�developers�and�builders,�are�very�interested�in�two�parameters�when�considering�residential�development�potential:��(1)�TAKS�test�scores�and�passage�rates;�and,�also�(2)�the�percent�of�free/reduced�lunch�students—which�both�act�as�surrogate�measures�of�“quality�of�life”�within�any�school�district.��Both�of�these�indicators�are�correlated�highly�with�the�median�income,�median�educational�level,�and�other�socioeconomic�parameters�of�a�school�district.����
Population and Survey Analysts - October, 2011 Klein I.S.D. - Page 244
�Home�Financing��Almost�all�suburban�districts�are�experiencing�a�lack�of�home�financing�that�has�caused�a�higher�number�of�young�students�to�reside�in�rental�units�–�and�to�actually�bring�these�younger�renters�back�into�“urban�core”�locations�in�mature�cities,�because�of�the�availability�of�rental�units�in�these�central�cities.��Mature�school�districts�in�the�State�are�seeing�a�contra�flow�of�students�–�especially�young�students����moving�back�into�the�districts�losing�enrollment�between�2002�and�2007����due�to�availability�of�rental�units.��Klein�I.S.D.�itself�has�seen�a�higher�rental�unit�population,�with�an�increase�in�multi�family�ratios.��Keep�in�mind�that,�in�several�years,�mortgages�may�be�more�readily�available�again,�and�Klein�I.S.D.�may�again�have�accelerated�growth.��As�unemployment�rates�lower�and�when�foreclosures�are�finally�over,�then�the�movement�by�young�families�to�suburban�districts�should�begin�to�rise�again.����
Model for Developing Student Projections �The�student�projections�developed�in�this�study�are�based�on�a�model�that�incorporates�a�number�of�factors�discussed�throughout�this�Report.����New�housing�construction�is�a�contributor�to�new�student�growth�in�this�model,�based�on�studies�of�student�gains�by�subdivision�and�by�apartment�in�K.I.S.D.�for�the�next�10�years�(see�Chapter�2).��Short�term�new�housing�is�projected�based�on�preliminary�and�final�plats,�developers’�plans,�and�recent�septic�and�City�new�home�permits�issued.��Based�on�development�known�with�a�greater�than�50%�probability,�there�should�be�16,965�new�housing�units�added�within�Klein�I.S.D.�boundaries,�of�which�2,592�units�will�be�multi�family�and�14,373�will�be�single�family.��But,�once�the�ratios�of�students�per�unit�are�estimated,�then�there�will�be�from�606�to�1,371�students�added�per�year�–�based�on�new�housing,�or�a�total�of�9,597�added�students.����Student�gains�and�losses�in�existing�homes�and�in�existing�multi�family�developments�are�also��incorporated�into�this�model�for�the�first�several�years.��The�growing�trend�of�new�students�moving�into�existing�homes�for�sale�–�as�well�as�the�“aging�out”�of�older�students�in�the�older�subdivisions�that�are�becoming�empty�nest�locations�–�are�important�to�measure.��The�tables�and�maps�in�Chapter�4�titled,�“Student�Trends�by�Development”�outline�in�depth�the�trends�that�occurred�over�the�past�2�years�with�regard�to�the�type�of�housing�attracting�new�students.�����
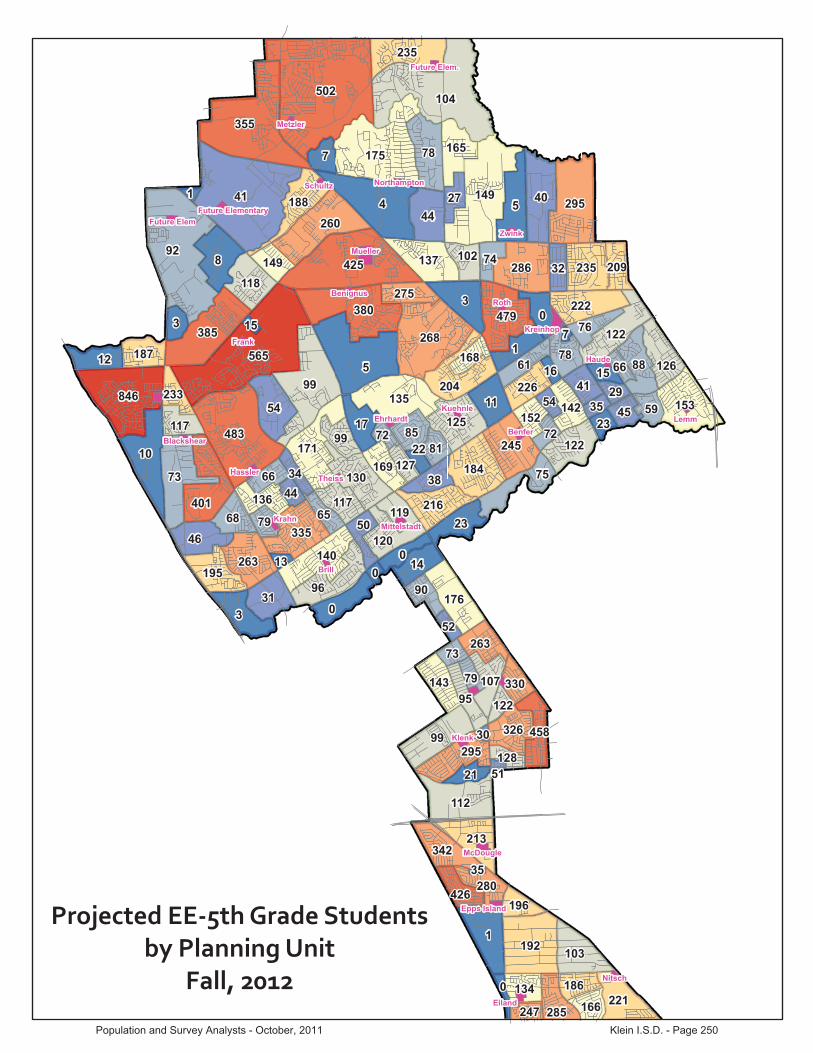
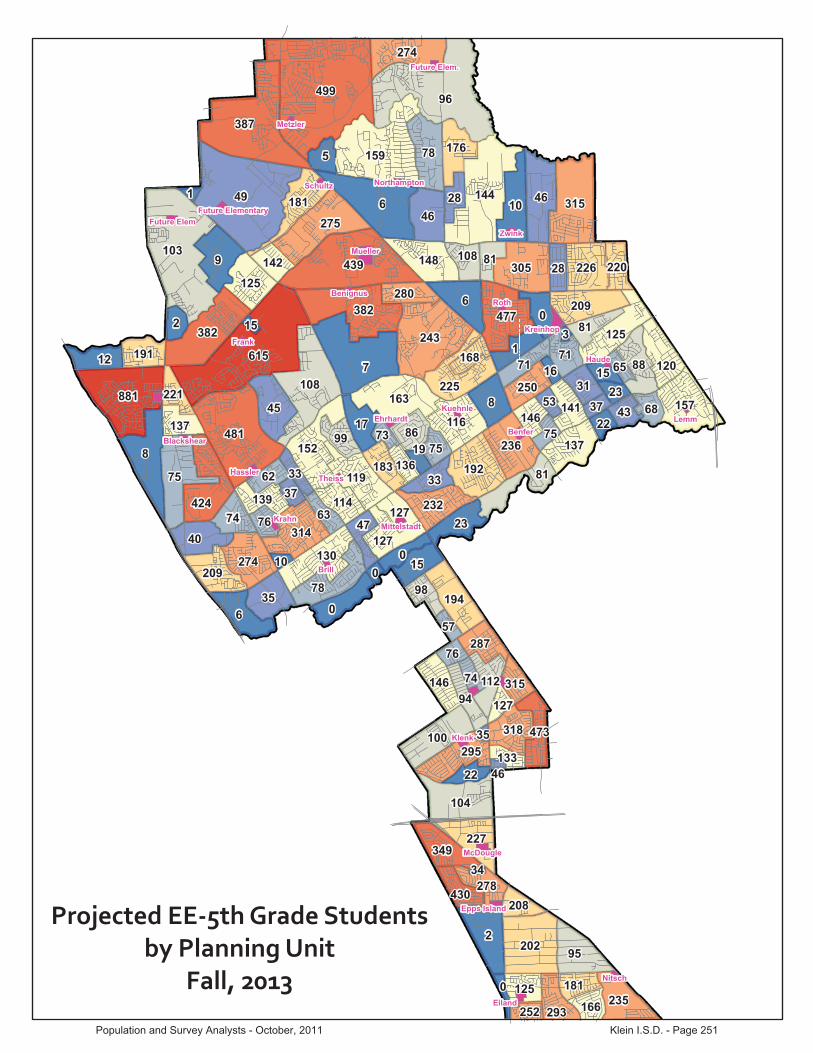
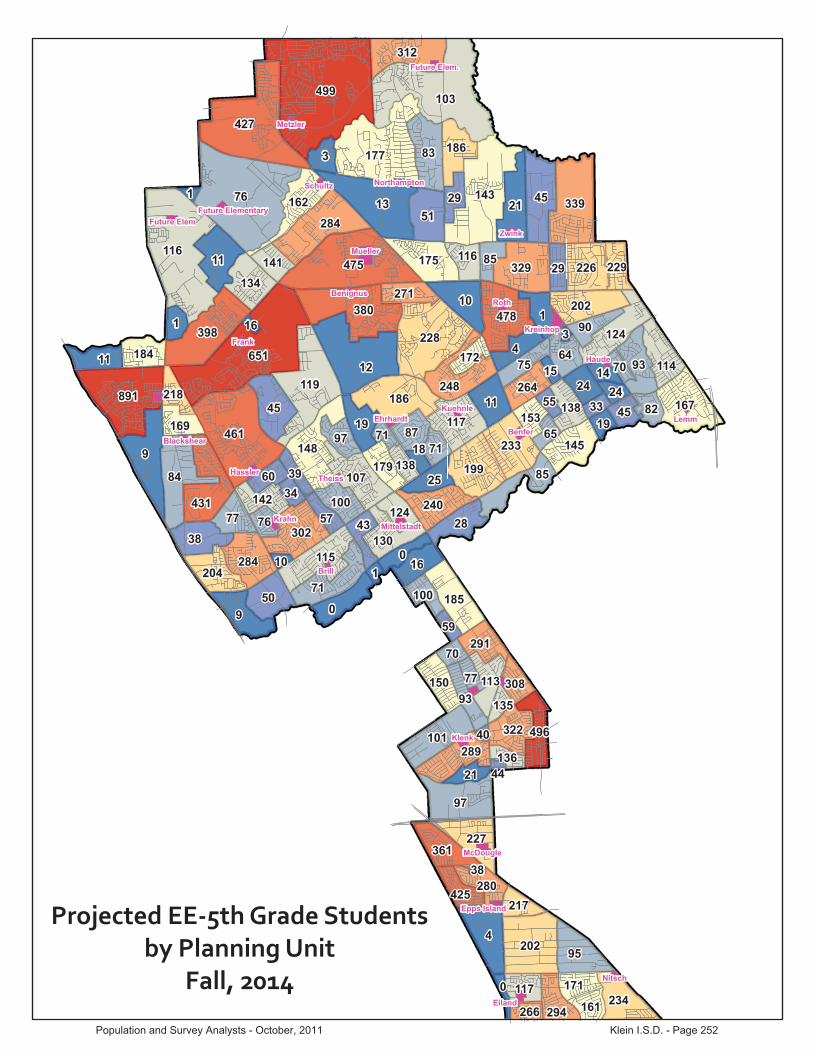
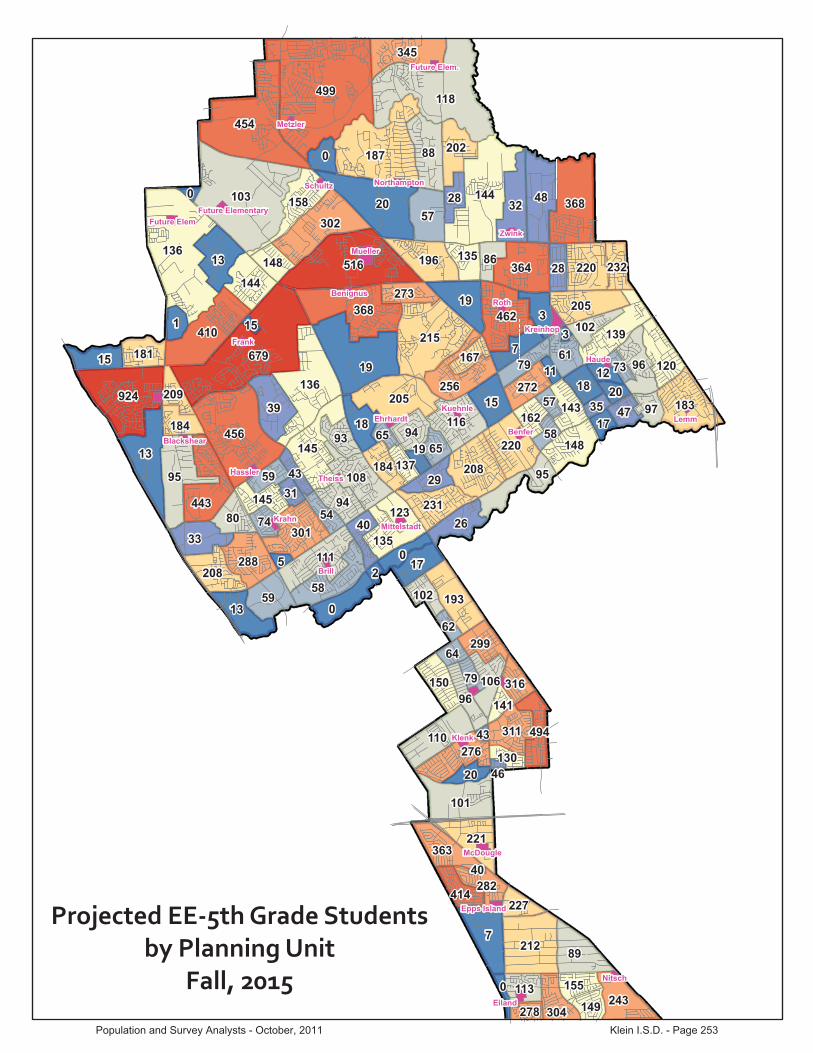
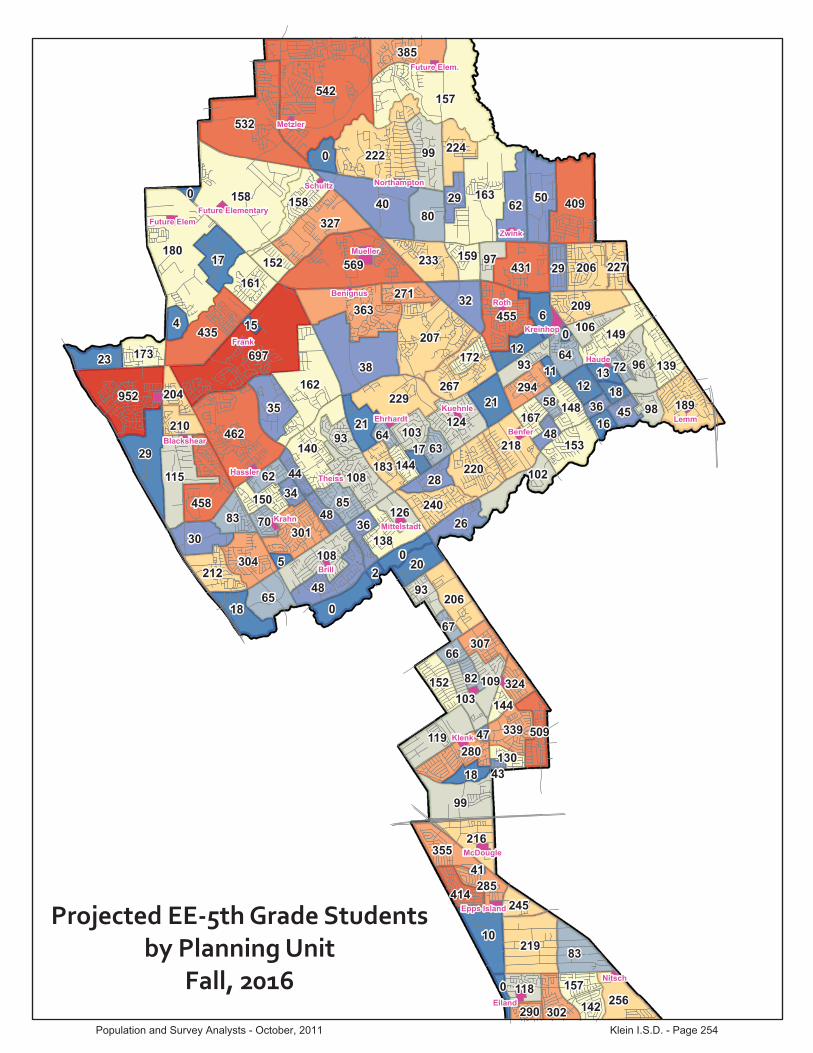
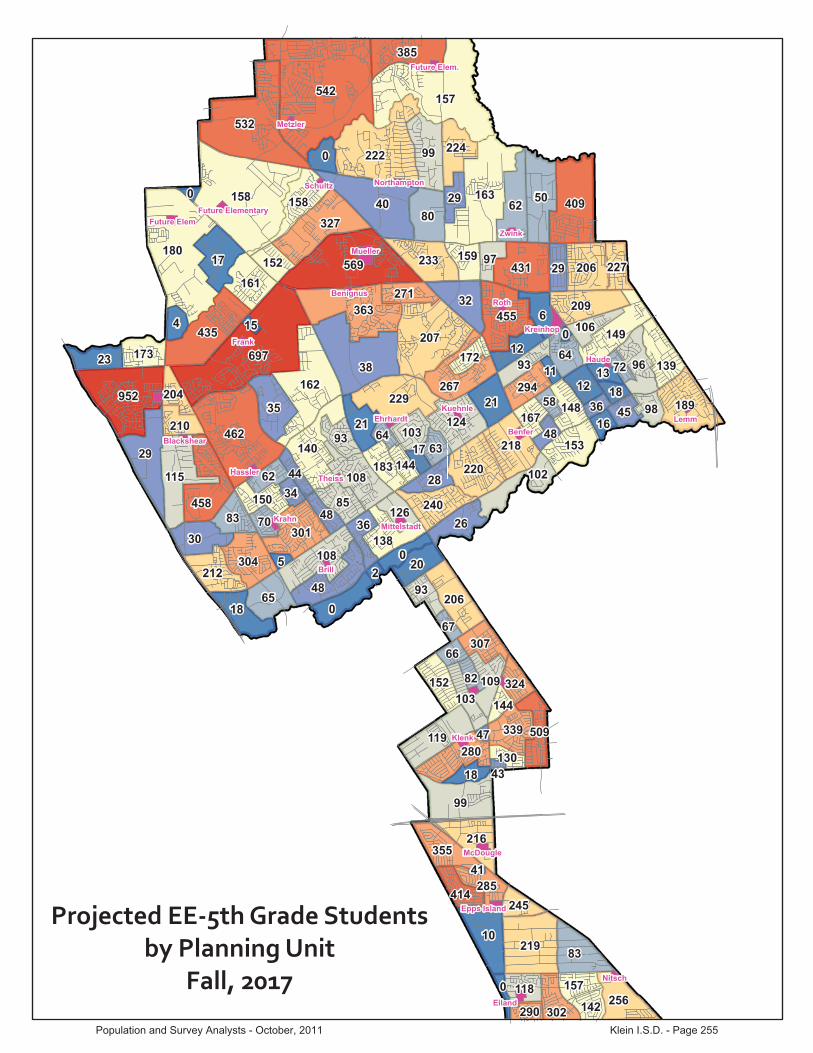
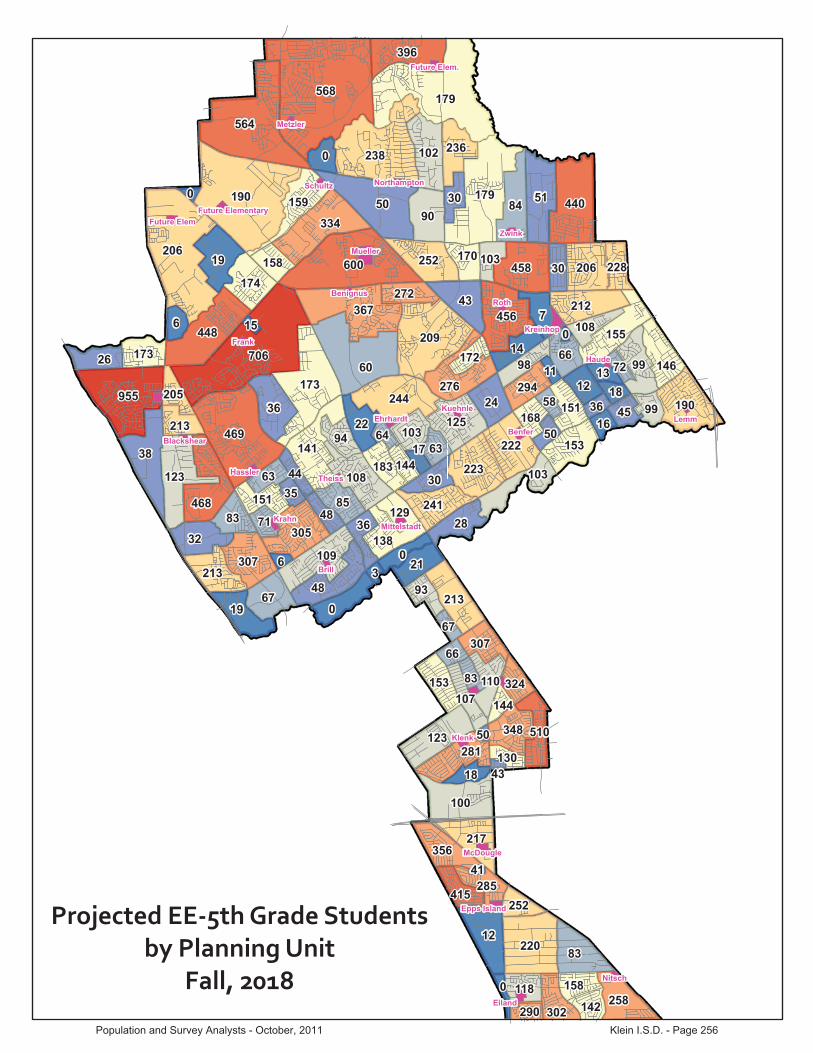
Projected Resident Students by Planning Unit �Presented�in�this�chapter�are�the�number�of�students�projected�to�live�in�each�Planning�Unit�each�year,�under�both�the�Most�Likely�Growth�Scenario�and�the�High�Growth�Scenario.��These�charts�and�maps�can�be�utilized�by�the�District�in�assessing�and�making�decisions�about�future�utilization�of�each�
Population and Survey Analysts - October, 2011 Klein I.S.D. - Page 245

campus.��The�Most�Likely�Scenario�is�most�useful�for�shorter�term�decisions�such�as�staffing,�placement�of�special�programs,�and�transfer�policies.��Both�the�Low�Growth�Scenario�and�the�High�Growth�Scenario�should�be�considered�as�a�plausible�possibility�and�could�be�referenced�when�making�decisions�about�long�term�facility�utilization�and�the�possibility�of�needing�an�additional�campus.����The�Importance�of�Transfers��It�is�important�to�remember�that�these�student�projections�include�only�the�projected�resident�students,�exclusive�of�inter��and�intra�District�transfers.��All�transfers�would�also�need�to�be�analyzed�when�assessing�facility�utilization�(refer�to�Chapter�6)�including�both�voluntary�transfers�for�personal�reasons,�as�well�as�transfers�for�special�programs.��Transfers�will�change�from�year�to�year,�and�are�thus�useful�for�analysis�for�only�a�short�period.���
Population and Survey Analysts - October, 2011 Klein I.S.D. - Page 246
Low�Growth
�Sce
nario�(Series�I�P
rojection)
by�Grade
�and
�Grade
�Group
:20
12�202
1
His
toric
al E
nrol
lmen
tEn
rollm
ent:
Gro
wth
,G
row
th,
Gro
wth
,
PEIM
SPE
IMS
PEIM
SPE
IMS
PEIM
SPE
IMS
12-O
ctR
eten
tion,
and
Ret
entio
n, a
ndR
eten
tion,
and
2005
2006
2007
2008
2009
2010
2011
Attr
ition
09/
08A
ttriti
on 1
0/09
Attr
ition
11/
1020
12-2
016
2017
-202
1
EE1,
187
1,22
329
817
820
525
025
526
126
827
528
329
130
031
032
032
933
9479
3648
PK1,
028
1,04
41,
114
1,18
81,
230
1,25
51,
280
1,31
21,
343
1,38
31,
425
1,46
81,
512
1,55
71,
604
2,358
153
220
KN
2,73
22,
859
2,92
72,
982
3,08
93,
128
3,14
93,
162
3,20
63,
270
3,33
53,
425
3,51
83,
602
3,69
23,
781
3,87
24,482
276
446
12,
724
3,07
03,
124
3,06
43,
239
3,23
93,
304
1.08618
1.04856
1.05819
1.05337
3,30
73,
320
3,39
03,
458
3,53
43,
626
3,72
43,
814
3,90
94,
011
4,441
230
476
22,
714
2,92
03,
242
3,26
03,
219
3,27
93,
352
1.05059
1.01235
1.04509
1.02872
3,38
93,
392
3,42
93,
502
3,57
93,
654
3,74
93,
850
3,94
34,
049
4,444
227
470
32,
930
2,95
43,
061
3,28
03,
376
3,31
53,
407
1.03558
1.02982
1.02859
1.02921
3,44
03,
477
3,50
53,
544
3,62
63,
702
3,78
03,
878
3,98
34,
086
4,451
219
461
42,
799
3,11
23,
101
3,17
73,
362
3,36
63,
374
1.02500
0.99704
1.02042
1.00873
3,42
63,
459
3,52
23,
550
3,59
63,
676
3,75
33,
832
3,93
14,
045
4,428
222
449
52,
856
3,03
63,
244
3,20
73,
295
3,47
53,
435
1.03714
1.03361
1.04884
1.04122
3,50
33,
557
3,61
63,
681
3,71
83,
744
3,84
63,
927
4,01
04,
122
4,563
283
404
62,
984
3,10
93,
250
3,43
63,
376
3,38
73,
606
1.05270
1.02792
1.07036
1.04914
3,59
33,
664
3,74
73,
809
3,85
83,
920
3,94
84,
055
4,14
14,
236
4,578
252
378
73,
045
3,19
33,
274
3,30
93,
541
3,33
33,
498
1.03056
0.98726
1.00416
0.99571
3,58
03,
567
3,66
33,
746
3,78
93,
861
3,92
33,
951
4,05
84,
152
4,400
291
363
83,
132
3,15
43,
253
3,39
73,
383
3,56
83,
398
1.02236
1.00762
1.04974
1.02868
3,58
83,
671
3,68
43,
783
3,84
93,
917
3,99
24,
056
4,08
44,
204
4,538
451
355
94,
147
4,50
83,
804
4,01
54,
042
3,92
84,
041
1.18987
1.16110
1.11125
1.13618
3,84
94,
064
4,18
84,
202
4,29
34,
395
4,47
34,
558
4,63
14,
673
4,964
252
379
103,
195
3,26
43,
381
3,25
83,
337
3,47
53,
595
0.83113
0.85972
0.92755
0.89363
3,60
03,
429
3,64
63,
758
3,75
13,
856
3,94
74,
017
4,09
44,
168
4,263
156
416
112,
349
2,44
23,
110
3,24
33,
193
3,26
43,
229
0.98005
0.97812
0.92942
0.95377
3,41
93,
424
3,28
43,
491
3,58
03,
596
3,69
63,
784
3,85
03,
932
4,002
351
351
122,
638
2,76
82,
928
2,88
83,
053
3,11
53,
266
0.94141
0.97557
1.01031
0.99294
3,19
73,
384
3,41
33,
274
3,46
33,
573
3,58
83,
688
3,77
63,
850
3,823
197
387
TOTA
L:39
,432
41,6
1243
,025
43,7
3844
,824
45,3
1046
,139
46,5
6747
,162
47,9
4448
,758
49,7
3850
,763
51,8
0052
,933
54,0
7755
,342
60,2
143,
599
5,60
4PC
T. IN
C.
6.68
5.53
3.40
1.66
3.09
3.59
1.83
0.93
1.28
1.66
1.70
2.01
2.06
2.04
2.19
2.16
2.34
8.80
Act
ual I
ncre
ase:
2,46
82,
180
1,41
371
31,
345
1,57
282
942
859
578
281
598
01,
025
1,03
61,
133
1,14
31,
266
4,87
2
TOTA
L (E
E-5t
h)17
,942
19,1
7420
,025
20,1
9220
,899
21,2
4021
,506
21,7
4221
,959
22,3
1922
,696
23,1
5323
,645
24,2
3224
,824
25,4
4226
,128
29,6
46TO
TAL
(6th
-8th
)9,
161
9,45
69,
777
10,1
4210
,300
10,2
8810
,502
10,7
6010
,902
11,0
9311
,337
11,4
9711
,699
11,8
6312
,062
12,2
8312
,592
13,5
16TO
TAL
(9th
-12t
h)12
,329
12,9
8213
,223
13,4
0413
,625
13,7
8214
,131
14,0
6514
,301
14,5
3114
,725
14,9
0515
,420
15,7
0516
,047
16,3
5116
,622
17,0
52
% C
HG
(EE-
5th)
0.08
70.
069
0.04
40.
008
0.04
00.
052
0.06
50.
011
0.01
00.
016
0.01
70.
020
0.02
10.
025
0.02
40.
025
0.02
70.
135
% C
HG
(6th
-8th
)0.
043
0.03
20.
034
0.03
70.
036
0.01
40.
035
0.02
50.
013
0.01
80.
022
0.01
40.
018
0.01
40.
017
0.01
80.
025
0.07
3%
CH
G (9
th-1
2th)
0.05
60.
053
0.01
90.
014
0.01
30.
028
0.05
4-0
.005
0.01
70.
016
0.01
30.
012
0.03
50.
018
0.02
20.
019
0.01
70.
026
% E
E-5t
h0.
455
0.46
10.
465
0.46
20.
466
0.46
90.
466
0.46
70.
466
0.46
60.
465
0.46
60.
466
0.46
80.
469
0.47
00.
472
0.49
2%
6th
-8th
0.23
20.
227
0.22
70.
232
0.23
00.
227
0.22
80.
231
0.23
10.
231
0.23
30.
231
0.23
00.
229
0.22
80.
227
0.22
80.
224
% 9
th-1
2th
0.31
30.
312
0.30
70.
306
0.30
40.
304
0.30
60.
302
0.30
30.
303
0.30
20.
300
0.30
40.
303
0.30
30.
302
0.30
00.
283
AD
DE
D E
E-5
th1,
440
1,23
285
116
781
11,
048
1,31
423
621
736
037
745
749
258
859
261
868
63,
518
AD
DE
D 6
th-8
th37
429
532
136
536
114
636
025
814
219
124
415
920
216
419
922
130
992
4A
DD
ED
9th
-12t
h65
465
324
118
117
337
872
7-6
623
623
019
418
051
528
534
230
427
143
0
RA
TIO
OF
AD
DED
EE-
5th
0.58
30.
565
0.60
20.
234
0.60
30.
667
1.58
50.
551
0.36
50.
461
0.46
20.
467
0.48
00.
567
0.52
20.
541
0.54
20.
722
RA
TIO
OF
AD
DED
6th
-8th
0.15
20.
135
0.22
70.
512
0.26
80.
093
0.43
40.
604
0.23
80.
245
0.30
00.
163
0.19
70.
158
0.17
60.
194
0.24
40.
190
RA
TIO
OF
AD
DED
9th
-12t
h0.
265
0.30
00.
171
0.25
40.
129
0.24
00.
877
-0.1
550.
397
0.29
40.
238
0.18
40.
502
0.27
50.
302
0.26
60.
214
0.08
8
Enr
ollm
ent b
y G
rade
Gro
up
2012
2021
2020
2019
2018
% A
dded
Stu
dent
s by
Gra
de G
roup
Add
ed S
tude
nts
by G
rade
Gro
up
% S
tude
nts
in e
ach
Gra
de G
roup
% C
hang
e by
Gra
de G
roup
2014
% A
dded
Stu
dent
s by
Gra
de G
roup
Add
ed S
tude
nts
by G
rade
Gro
up
% S
tude
nts
in e
ach
Gra
de G
roup
% C
hang
e by
Gra
de G
roup
2013
Enr
ollm
ent b
y G
rade
Gro
up
Add
ed S
tude
nts
Ave
rage
Gro
wth
, R
eten
tion,
Attr
ition
Add
ed S
tude
nts
Bui
ld O
ut
Proj
ecte
d En
rollm
ent a
t PEI
MS
Snap
shot
Dat
e
2017
2016
2015
Population and Survey Analysts - October, 2011 Klein I.S.D. - Page 247
Mos
t�Like
ly�Growth
�Sce
nario�(Series�II�Projection)
by�Grade
�and
�Grade
�Group
:20
12�202
1
Enro
llmen
t:G
row
th,
Gro
wth
,G
row
th,
Gro
wth
,G
row
th,
PEIM
SPE
IMS
PEIM
SPE
IMS
PEIM
S12
-Oct
Ret
entio
n, a
ndR
eten
tion,
and
Ret
entio
n, a
ndR
eten
tion,
and
Ret
entio
n, a
nd20
0620
0720
0820
0920
1020
11A
ttriti
on 0
7/06
Attr
ition
08/
07A
ttriti
on 0
9/08
Attr
ition
10/
09A
ttriti
on 1
1/10
2012
-201
620
17-2
021
EE1,
223
298
178
205
250
255
266
278
291
304
316
330
345
359
374
388
544
6172
PK1,
028
1,04
41,
114
1,18
81,
230
1,27
91,
330
1,38
41,
439
1,49
61,
556
1,61
91,
683
1,75
11,
821
2,684
266
324
KN
2,85
92,
927
2,98
23,
089
3,12
83,
149
3,22
53,
302
3,38
13,
469
3,56
33,
663
3,76
53,
871
3,97
94,
090
4,943
414
528
13,
070
3,12
43,
064
3,23
93,
239
3,30
41.09269
1.04681
1.08618
1.04856
1.05819
1.05337
3,33
43,
402
3,49
53,
583
3,68
03,
772
3,87
73,
986
4,09
74,
221
4,899
376
541
22,
920
3,24
23,
260
3,21
93,
279
3,35
21.05603
1.04353
1.05059
1.01235
1.04509
1.02872
3,41
63,
435
3,51
73,
617
3,71
23,
804
3,89
94,
009
4,12
14,
245
4,888
360
533
32,
954
3,06
13,
280
3,37
63,
315
3,40
71.04829
1.01172
1.03558
1.02982
1.02859
1.02921
3,46
73,
522
3,55
33,
641
3,74
93,
839
3,93
54,
033
4,14
64,
271
4,882
342
522
43,
112
3,10
13,
177
3,36
23,
366
3,37
41.04976
1.03790
1.02500
0.99704
1.02042
1.00873
3,45
43,
503
3,56
93,
605
3,69
93,
800
3,89
23,
989
4,08
94,
212
4,842
325
513
53,
036
3,24
43,
207
3,29
53,
475
3,43
51.04242
1.03418
1.03714
1.03361
1.04884
1.04122
3,53
13,
602
3,66
53,
739
3,78
03,
871
3,97
74,
073
4,17
54,
287
4,982
345
507
63,
109
3,25
03,
436
3,37
63,
387
3,60
61.07049
1.05919
1.05270
1.02792
1.07036
1.04914
3,62
23,
710
3,79
83,
868
3,95
03,
986
4,08
14,
193
4,29
44,
410
4,983
344
460
73,
193
3,27
43,
309
3,54
13,
333
3,49
81.05307
1.01815
1.03056
0.98726
1.00416
0.99571
3,60
83,
612
3,71
23,
804
3,87
93,
953
3,98
84,
084
4,19
64,
306
4,788
381
427
83,
154
3,25
33,
397
3,38
33,
568
3,39
81.01879
1.03757
1.02236
1.00762
1.04974
1.02868
3,61
63,
718
3,73
43,
842
3,94
14,
010
4,08
64,
123
4,22
24,
346
4,914
543
406
94,
508
3,80
44,
015
4,04
23,
928
4,04
11.20609
1.23425
1.18987
1.16110
1.11125
1.13618
3,88
04,
116
4,24
54,
268
4,39
54,
499
4,57
94,
666
4,70
84,
831
5,367
354
435
103,
264
3,38
13,
258
3,33
73,
475
3,59
50.75000
0.85647
0.83113
0.85972
0.92755
0.89363
3,62
93,
473
3,69
63,
816
3,84
13,
947
4,04
14,
112
4,19
14,
237
4,601
246
396
112,
442
3,11
03,
243
3,19
33,
264
3,22
90.95282
0.95918
0.98005
0.97812
0.92942
0.95377
3,44
63,
467
3,32
93,
546
3,66
53,
681
3,78
43,
873
3,94
24,
025
4,359
436
360
122,
768
2,92
82,
888
3,05
33,
115
3,26
61.19902
0.92862
0.94141
0.97557
1.01031
0.99294
3,22
23,
427
3,45
93,
325
3,54
63,
658
3,67
43,
776
3,86
53,
941
4,238
280
396
TOTA
L:41
,612
43,0
2543
,738
44,8
2445
,310
46,1
3946
,996
47,9
0148
,827
49,8
6651
,211
52,3
7053
,543
54,8
3156
,150
57,6
3165
,914
5,07
26,
421
PCT.
INC
.5.
533.
401.
663.
093.
591.
831.
861.
931.
932.
132.
702.
262.
242.
412.
402.
6414
.37
Act
ual I
ncre
ase:
2,18
01,
413
713
1,34
51,
572
829
857
905
926
1,03
91,
344
1,15
91,
173
1,28
81,
318
1,48
28,
283
TOTA
L (E
E-5t
h)19
,174
20,0
2520
,192
20,8
9921
,240
21,5
0621
,972
22,3
7622
,855
23,3
9723
,995
24,6
3625
,310
26,0
0326
,731
27,5
3532
,664
TOTA
L (6
th-8
th)
9,45
69,
777
10,1
4210
,300
10,2
8810
,502
10,8
4711
,041
11,2
4411
,514
11,7
6911
,948
12,1
5612
,400
12,7
1213
,063
14,6
85TO
TAL
(9th
-12t
h)12
,982
13,2
2313
,404
13,6
2513
,782
14,1
3114
,177
14,4
8414
,729
14,9
5514
,905
15,7
8616
,077
16,4
2816
,706
17,0
3418
,565
% C
HG
(EE-
5th)
0.06
90.
044
0.00
80.
040
0.05
20.
065
0.02
20.
018
0.02
10.
024
0.02
60.
027
0.02
70.
027
0.02
80.
030
0.18
6%
CH
G (6
th-8
th)
0.03
20.
034
0.03
70.
036
0.01
40.
035
0.03
30.
018
0.01
80.
024
0.02
20.
015
0.01
70.
020
0.02
50.
028
0.12
4%
CH
G (9
th-1
2th)
0.05
30.
019
0.01
40.
013
0.02
80.
054
0.00
30.
022
0.01
70.
015
-0.0
030.
059
0.01
80.
022
0.01
70.
020
0.09
0
% E
E-5t
h0.
461
0.46
50.
462
0.46
60.
469
0.46
60.
468
0.46
70.
468
0.46
90.
469
0.47
00.
473
0.47
40.
476
0.47
80.
496
% 6
th-8
th0.
227
0.22
70.
232
0.23
00.
227
0.22
80.
231
0.23
10.
230
0.23
10.
230
0.22
80.
227
0.22
60.
226
0.22
70.
223
% 9
th-1
2th
0.31
20.
307
0.30
60.
304
0.30
40.
306
0.30
20.
302
0.30
20.
300
0.29
10.
301
0.30
00.
300
0.29
80.
296
0.28
2
AD
DE
D E
E-5
th1,
232
851
167
811
1,04
81,
314
466
404
479
542
597
641
674
693
728
803
5,12
9A
DD
ED
6th
-8th
295
321
365
361
146
360
345
195
203
270
255
179
208
244
312
350
1,62
2A
DD
ED
9th
-12t
h65
324
118
117
337
872
746
306
245
226
-50
881
292
351
278
328
1,53
1
RA
TIO
OF
AD
DED
EE-
5th
0.56
50.
602
0.23
40.
603
0.66
71.
585
0.54
30.
447
0.51
70.
522
0.44
40.
553
0.57
50.
538
0.55
20.
542
0.61
9R
ATI
O O
F A
DD
ED 6
th-8
th0.
135
0.22
70.
512
0.26
80.
093
0.43
40.
402
0.21
50.
219
0.26
00.
190
0.15
40.
177
0.19
00.
237
0.23
60.
196
RA
TIO
OF
AD
DED
9th
-12t
h0.
300
0.17
10.
254
0.12
90.
240
0.87
70.
054
0.33
80.
264
0.21
8-0
.037
0.76
00.
248
0.27
20.
211
0.22
10.
185
Enr
ollm
ent b
y G
rade
Gro
up
Add
ed S
tude
nts
Ave
rage
Gro
wth
, R
eten
tion,
Attr
ition
Add
ed S
tude
nts
Bui
ld O
ut
Proj
ecte
d En
rollm
ent a
t PEI
MS
Snap
shot
Dat
e20
1720
1620
1520
14
% A
dded
Stu
dent
s by
Gra
de G
roup
Add
ed S
tude
nts
by G
rade
Gro
up
% S
tude
nts
in e
ach
Gra
de G
roup
% C
hang
e by
Gra
de G
roup
2013
% A
dded
Stu
dent
s by
Gra
de G
roup
Add
ed S
tude
nts
by G
rade
Gro
up
% S
tude
nts
in e
ach
Gra
de G
roup
% C
hang
e by
Gra
de G
roup
His
toric
al E
nrol
lmen
t
Enr
ollm
ent b
y G
rade
Gro
up
2012
2021
2020
2019
2018
Population and Survey Analysts - October, 2011 Klein I.S.D. - Page 248
High�Growth
�Sce
nario�(Series�III�Projection)
by�Grade
�and
�Grade
�Group
:20
12�202
1
His
toric
al E
nrol
lmen
tEn
rollm
ent:
Gro
wth
,G
row
th,
Gro
wth
,G
row
th,
Gro
wth
,
PEIM
SPE
IMS
PEIM
SPE
IMS
12-O
ctR
eten
tion,
and
Ret
entio
n, a
ndR
eten
tion,
and
Ret
entio
n, a
ndR
eten
tion,
and
2007
2008
2009
2010
2011
Attr
ition
07/
06A
ttriti
on 0
8/07
Attr
ition
09/
08A
ttriti
on 1
0/09
Attr
ition
11/
1020
12-2
016
2017
-202
1
EE29
817
820
525
025
527
028
529
931
332
734
235
737
138
640
2542
7275
PK1,
028
1,04
41,
114
1,18
81,
230
1,30
41,
369
1,43
71,
495
1,56
21,
625
1,69
01,
757
1,82
81,
901
2,439
332
338
KN
2,92
72,
982
3,08
93,
128
3,14
93,
288
3,39
93,
515
3,60
63,
714
3,81
83,
925
4,03
54,
148
4,26
45,183
565
550
13,
124
3,06
43,
239
3,23
93,
304
1.09269
1.04681
1.08618
1.04856
1.05819
1.05337
3,35
03,
486
3,61
63,
743
3,82
23,
952
4,06
34,
176
4,29
34,
413
5,136
518
592
23,
242
3,26
03,
219
3,27
93,
352
1.05603
1.04353
1.05059
1.01235
1.04509
1.02872
3,43
33,
470
3,62
13,
761
3,87
43,
971
4,10
64,
221
4,33
94,
461
5,121
522
587
33,
061
3,28
03,
376
3,31
53,
407
1.04829
1.01172
1.03558
1.02982
1.02859
1.02921
3,48
43,
557
3,60
63,
768
3,89
44,
027
4,12
74,
268
4,38
84,
511
5,119
487
617
43,
101
3,17
73,
362
3,36
63,
374
1.04976
1.03790
1.02500
0.99704
1.02042
1.00873
3,47
13,
538
3,62
33,
677
3,82
43,
967
4,10
34,
205
4,34
94,
470
5,084
450
646
53,
244
3,20
73,
295
3,47
53,
435
1.04242
1.03418
1.03714
1.03361
1.04884
1.04122
3,54
83,
638
3,72
03,
814
3,85
24,
021
4,17
24,
314
4,42
24,
573
5,230
417
721
63,
250
3,43
63,
376
3,38
73,
606
1.07049
1.05919
1.05270
1.02792
1.07036
1.04914
3,64
03,
748
3,85
53,
946
4,02
54,
082
4,26
14,
421
4,57
24,
686
5,237
419
661
73,
274
3,30
93,
541
3,33
33,
498
1.05307
1.01815
1.03056
0.98726
1.00416
0.99571
3,62
63,
649
3,76
83,
880
3,95
34,
048
4,10
54,
285
4,44
64,
598
5,054
455
645
83,
253
3,39
73,
383
3,56
83,
398
1.01879
1.03757
1.02236
1.00762
1.04974
1.02868
3,63
43,
755
3,79
03,
919
4,01
64,
107
4,20
64,
265
4,45
24,
619
5,214
618
603
93,
804
4,01
54,
042
3,92
84,
041
1.20609
1.23425
1.18987
1.16110
1.11125
1.13618
3,89
94,
157
4,30
94,
353
4,47
94,
608
4,71
34,
826
4,89
45,
109
5,734
438
630
103,
381
3,25
83,
337
3,47
53,
595
0.75000
0.85647
0.83113
0.85972
0.92755
0.89363
3,64
73,
508
3,75
13,
893
3,91
44,
043
4,15
94,
254
4,35
64,
417
4,945
319
503
113,
110
3,24
33,
193
3,26
43,
229
0.95282
0.95918
0.98005
0.97812
0.92942
0.95377
3,46
33,
502
3,37
93,
617
3,73
53,
770
3,89
44,
006
4,09
74,
196
4,640
506
461
122,
928
2,88
83,
053
3,11
53,
266
1.19902
0.92862
0.94141
0.97557
1.01031
0.99294
3,23
83,
462
3,51
13,
392
3,61
33,
746
3,78
13,
906
4,01
84,
109
4,445
347
496
TOTA
L:43
,025
43,7
3844
,824
45,3
1046
,139
47,2
9748
,523
49,8
0151
,177
52,6
0354
,126
55,6
6257
,312
58,9
8860
,729
69,1
236,
464
8,12
6PC
T. IN
C.
3.40
1.66
3.09
3.59
1.83
2.51
2.59
2.63
2.76
2.79
2.89
2.84
2.96
2.93
2.95
13.8
2A
ctua
l Inc
reas
e:1,
413
713
1,34
51,
572
829
1,15
81,
226
1,27
81,
377
1,42
61,
523
1,53
61,
650
1,67
71,
741
8,39
3
TOTA
L (E
E-5t
h)20
,025
20,1
9220
,899
21,2
4021
,506
22,1
4922
,743
23,4
3824
,177
24,8
6925
,723
26,5
4327
,349
28,1
5328
,995
33,8
54TO
TAL
(6th
-8th
)9,
777
10,1
4210
,300
10,2
8810
,502
10,9
0111
,151
11,4
1311
,745
11,9
9412
,237
12,5
7212
,971
13,4
7013
,903
15,5
05TO
TAL
(9th
-12t
h)13
,223
13,4
0413
,625
13,7
8214
,131
14,2
4814
,629
14,9
5015
,255
14,9
0516
,167
16,5
4716
,992
17,3
6617
,832
19,7
64
% C
HG
(EE-
5th)
0.04
40.
008
0.04
00.
052
0.06
50.
030
0.02
70.
031
0.03
20.
029
0.03
40.
032
0.03
00.
029
0.03
00.
168
% C
HG
(6th
-8th
)0.
034
0.03
70.
036
0.01
40.
035
0.03
80.
023
0.02
30.
029
0.02
10.
020
0.02
70.
032
0.03
80.
032
0.11
5%
CH
G (9
th-1
2th)
0.01
90.
014
0.01
30.
028
0.05
40.
008
0.02
70.
022
0.02
0-0
.023
0.08
50.
024
0.02
70.
022
0.02
70.
108
% E
E-5t
h0.
465
0.46
20.
466
0.46
90.
466
0.46
80.
469
0.47
10.
472
0.47
30.
475
0.47
70.
477
0.47
70.
477
0.49
0%
6th
-8th
0.22
70.
232
0.23
00.
227
0.22
80.
230
0.23
00.
229
0.22
90.
228
0.22
60.
226
0.22
60.
228
0.22
90.
224
% 9
th-1
2th
0.30
70.
306
0.30
40.
304
0.30
60.
301
0.30
10.
300
0.29
80.
283
0.29
90.
297
0.29
60.
294
0.29
40.
286
AD
DE
D E
E-5
th85
116
781
11,
048
1,31
464
359
469
673
969
185
482
080
680
484
24,
859
AD
DE
D 6
th-8
th32
136
536
114
636
039
925
126
133
324
824
333
539
949
943
31,
602
AD
DE
D 9
th-1
2th
241
181
173
378
727
117
381
321
305
-350
1,26
238
044
537
446
61,
932
RA
TIO
OF
AD
DED
EE-
5th
0.60
20.
234
0.60
30.
667
1.58
50.
555
0.48
50.
544
0.53
70.
485
0.56
10.
534
0.48
90.
479
0.48
40.
579
RA
TIO
OF
AD
DED
6th
-8th
0.22
70.
512
0.26
80.
093
0.43
40.
344
0.20
50.
204
0.24
20.
174
0.16
00.
218
0.24
20.
298
0.24
90.
191
RA
TIO
OF
AD
DED
9th
-12t
h0.
171
0.25
40.
129
0.24
00.
877
0.10
10.
310
0.25
10.
222
-0.2
450.
829
0.24
80.
270
0.22
30.
268
0.23
0
Enr
ollm
ent b
y G
rade
Gro
up
Add
ed S
tude
nts
Ave
rage
Gro
wth
,R
eten
tion,
Attr
ition
Add
ed S
tude
nts
Bui
ld O
ut
Proj
ecte
d En
rollm
ent a
t PEI
MS
Snap
shot
Dat
e
2017
2016
2015
2013
% A
dded
Stu
dent
s by
Gra
de G
roup
Add
ed S
tude
nts
by G
rade
Gro
up
% S
tude
nts
in e
ach
Gra
de G
roup
% C
hang
e by
Gra
de G
roup
% A
dded
Stu
dent
s by
Gra
de G
roup
Add
ed S
tude
nts
by G
rade
Gro
up
% S
tude
nts
in e
ach
Gra
de G
roup
% C
hang
e by
Gra
de G
roup
Enr
ollm
ent b
y G
rade
Gro
up
2012
2021
2020
2019
2018
2014
Population and Survey Analysts - October, 2011 Klein I.S.D. - Page 249
41
5
502
92
4
565
104
355
425
99
483
175
1
5149
8
268
846
3380
73
3
10
29540
385
192
0
260
99
78
135
0
96
479
401
112
54
1
286
171
153
44
184
235
335
88
140
245
75
46
31
204
125
137
130
11
263
235
176
222
7
295
23
103
213
188
221
216
17
118
122
14195
342
68
12612
326
3
165
78
85
120
38
99
41
285
32
263
187
117
90
27
275
81
59
134
102
45117
79
186
166247
122
0
458
95
61
143
50
107
226
76
142
280
66
426
136
74
169
209
65
330
119
21
149
34
196
233
152
0
15
72
79
73
168
23
44
2954
72
127
66
52
35
0
22
128
122
1
16
13
715
30
51
35
Mueller
Kreinhop
Hassler
Benfer
Eiland
Brill
Klenk
Roth
Zwink
Frank
Metzler
McDougle
Schultz
Nitsch
LemmEhrhardt
Krahn
Kuehnle
Mittelstadt
Future Elem
Blackshear
Benignus
Future Elem.
Haude
Theiss
Epps Island
Future Elementary
Northampton
Projected�EE�5th�Grade�Studentsby�Planning�Unit
Fall,�2012
Population and Survey Analysts - October, 2011 Klein I.S.D. - Page 250
49
7
499 96
6
615
103
8
387
439
481
159
2
144
9
243
881
6
108
382
75
6
31546
8
382
202
0
275
78
163
10
0
78
477
424
45
95
104
1
305
152
157
46
192
274
314
88
130
236
81
40
116
35
225
100
119
148
274
226
194
209
5
295
23
227
181
235
232
17
137
125
15209
349
74
12012
318
2
176
71
86
127
33
99
31
293
28
287
191
114
98
28
280
75
68
125
108
43137
76
181
166252
125
0
473
94
71
146 112
47
250
81
141
278
62
430
139
81
183
220
63
315
22
127
142
33
208
221
146
0
15
75
74
76
168
22
37
2353
73
136
65
57
37
0
19
133
127
1
16
10
315
35
46
34
Mueller
Kreinhop
Hassler
Benfer
Eiland
Brill
Klenk
Roth
Zwink
Frank
Metzler
McDougle
Schultz
Nitsch
LemmEhrhardt
Krahn
Kuehnle
Mittelstadt
Future Elem
Blackshear
Benignus
Future Elem.
Haude
Theiss
Epps Island
Future Elementary
Northampton
Projected�EE�5th�Grade�Studentsby�Planning�Unit
Fall,�2013
Population and Survey Analysts - October, 2011 Klein I.S.D. - Page 251
76
499
651
103
116
9
427
12
475
461
13
177
4
143
228
891119
380
84
97
9
33945
398
202
0
284
83
186
21
11
1
71
478
431
45
95
4
329
148
167
51
199
10
115
312
302
93
233
85
38
117
50
248
101
175
107
11
284
226
185
202
3
289
28
227
162
234
240
19
145
11
134
114
16204
361
77
322
1
186
64
87
130
25
97
24
294
29
291
184
29
271
117
116
71
8245169
76
171
161266
124
0
496
93
75
150 113
43
264
90
100
138
280
60
425
142
85
179
229
57
308
21
124
141
39
100
217
218
153
0
14
65
77
70
172
19
34
2455
71
138
70
59
33
1
18
136
135
1
15
10
316
40
44
38
Mueller
Kreinhop
Hassler
Benfer
Eiland
Brill
Klenk
Roth
Zwink
Frank
Metzler
McDougle
Schultz
Nitsch
LemmEhrhardt
Krahn
Kuehnle
Mittelstadt
Future Elem
Blackshear
Benignus
Future Elem.
Haude
Theiss
Epps Island
Future Elementary
Northampton
Projected�EE�5th�Grade�Studentsby�Planning�Unit
Fall,�2014
Population and Survey Analysts - October, 2011 Klein I.S.D. - Page 252
499
679
103
118
136
454
19
516
456
20
187
7
144
215
924136
368
95
13
36848
410
212
0
302
88
205
32
3
58
13
462
443
39
89
101
7
364
145
183
57
208
19
111
345
301
96
220
95
33
110
116
5913
256
196
108
288
220
193
205
0
15
276
26
221
158
243
231
18
148
144
17208
311
94
363
80
12015
1
202
61
94
135
29
93
18
304
28
299
181
28
273
113
65
97
135
47184
74
155
149278
139
0
494
96
79
150
40
106
272143
282
59
414
145
86
184
232
54
316
20
123
148
102
43
102
227
209
162
0
12
58
79
64
167
17
31
2057
65
137
5
73
62
35
2
19
130
141
0
11
315
43
46
40
Mueller
Kreinhop
Hassler
Benfer
Eiland
Brill
Klenk
Roth
Zwink
Frank
Metzler
McDougle
Schultz
Nitsch
LemmEhrhardt
Krahn
Kuehnle
Mittelstadt
Future Elem
Blackshear
Benignus
Future Elem.
Haude
Theiss
Epps Island
Future Elementary
Northampton
Projected�EE�5th�Grade�Studentsby�Planning�Unit
Fall,�2015
Population and Survey Analysts - October, 2011 Klein I.S.D. - Page 253
542
697
158
157
180
532
38
569
462
40
222
163
207
952162
363
99
29
40950
435
219
0
327
99
10
229
62
6
48
17
455
115
458
35
83
431
140
189
80
220
32
385
301
96
108
218
30
119
6518
267
124
233
108
304
206
206
209
0
21
280
26
216
158
256
240
21
153
161
20212
85
355
83
13923
339
4
224
64
138
28
93
12
302
29
307
173
93
29
271
103
118
63
98
159
45210
70
157
142290
149
0
102
12
509
93
152
36
109
294148
285
62
414
150
97
183
227
48
103324
18
126
152
106
44
245
204
167
0
13
48
82
66
172
16
34
1858
64
144
5
72
67
36
2
17
130
144
0
11
015
47
43
41
Mueller
Kreinhop
Hassler
Benfer
Eiland
Brill
Klenk
Roth
Zwink
Frank
Metzler
McDougle
Schultz
Nitsch
LemmEhrhardt
Krahn
Kuehnle
Mittelstadt
Future Elem
Blackshear
Benignus
Future Elem.
Haude
Theiss
Epps Island
Future Elementary
Northampton
Projected�EE�5th�Grade�Studentsby�Planning�Unit
Fall,�2016
Population and Survey Analysts - October, 2011 Klein I.S.D. - Page 254
542
697
158
157
180
532
38
569
462
40
222
163
207
952162
363
99
29
40950
435
219
0
327
99
10
229
62
6
48
17
455
115
458
35
83
431
140
189
80
220
32
385
301
96
108
218
30
119
6518
267
124
233
108
304
206
206
209
0
21
280
26
216
158
256
240
21
153
161
20212
85
355
83
13923
339
4
224
64
138
28
93
12
302
29
307
173
93
29
271
103
118
63
98
159
45210
70
157
142290
149
0
102
12
509
93
152
36
109
294148
285
62
414
150
97
183
227
48
103324
18
126
152
106
44
245
204
167
0
13
48
82
66
172
16
34
1858
64
144
5
72
67
36
2
17
130
144
0
11
015
47
43
41
Mueller
Kreinhop
Hassler
Benfer
Eiland
Brill
Klenk
Roth
Zwink
Frank
Metzler
McDougle
Schultz
Nitsch
LemmEhrhardt
Krahn
Kuehnle
Mittelstadt
Future Elem
Blackshear
Benignus
Future Elem.
Haude
Theiss
Epps Island
Future Elementary
Northampton
Projected�EE�5th�Grade�Studentsby�Planning�Unit
Fall,�2017
Population and Survey Analysts - October, 2011 Klein I.S.D. - Page 255
568
706
190
179
206
564
60
600
469
50
238
179
209
955173
367
38
44051
448
220
0
334
12
244
84
7
48
19
456
468
36
83
123
100
458
141
190
90
223
43
396
305
99
109
222
32
6719
276
123
125
102
252
108
307
206
213
212
0
24
281
28
217
159
258
241
22
153
174
21213
85
356
83
14626
348
6
236
66
138
30
94
12
302
30
307
173
93
30
272
103
118
63
99
170
45213
71
158
142290
155
0
103
14
510
98
153 110
36
294151
285
63
415
151
183
228
48
107324
18
129
158
108
44
252
205
168
0
13
50
83
103
66
172
16
35
1858
64
144
6
72
67
36
3
17
130
144
0
11
015
50
43
41
Mueller
Kreinhop
Hassler
Benfer
Eiland
Brill
Klenk
Roth
Zwink
Frank
Metzler
McDougle
Schultz
Nitsch
LemmEhrhardt
Krahn
Kuehnle
Mittelstadt
Future Elem
Blackshear
Benignus
Future Elem.
Haude
Theiss
Epps Island
Future Elementary
Northampton
Projected�EE�5th�Grade�Studentsby�Planning�Unit
Fall,�2018
Population and Survey Analysts - October, 2011 Klein I.S.D. - Page 256

594
715
226
202
235
597
90
634
476
64
256
197
212
958184
375
47
47052
461
222
0
342
13
260
8
50
21
457
478
37
84
131
102
482
142
191
225
53
110
407
308
225
34
7019
284
128
126
105
266
109
109
310
207
221
214
0
28
281
30
218
159
260
243
101
24
154
187
21215
85
357
84
15530
359
8
250
68
139
32
94
13
302
30
308
174
93
30
272
103
119
63
177
46214
71
158
142290
160
0
102
103
17
510
111153
36
295151
286
63
415
152
184
230
110
48
103
325
18
131
163
109
44
258
207
168
0
13
53
83
109
100
66
172
16
35
1858
64
144
6
73
67
36
3
17
130
145
0
11
016
53
43
41
Mueller
Kreinhop
Hassler
Benfer
Eiland
Brill
Klenk
Roth
Zwink
Frank
Metzler
McDougle
Schultz
Nitsch
LemmEhrhardt
Krahn
Kuehnle
Mittelstadt
Future Elem
Blackshear
Benignus
Future Elem.
Haude
Theiss
Epps Island
Future Elementary
Northampton
Projected�EE�5th�Grade�Studentsby�Planning�Unit
Fall,�2019
Population and Survey Analysts - October, 2011 Klein I.S.D. - Page 257

616
725
266
218
265
628
670
483
80
277
217
214
962
131197
384
58
50152
476
223
0
350
14
277
51
23
458
491
38
84
141
104
499
143
193
226
62
112
419
310
229
36
7320
289
133
126
108
277
109
140
312
207
229
216
0
33
281
32
219
160
262
113
244
25
154
203
22216
10
86
359
84
16434
371
265
69
139
511
35
94
14
303
30
308
175
93
30
272
103
119
63
181
46
11
215
71
159
142290
167
0
105
104
20
111153
36
295152
286
63
415
152
184
236
112
48
108
325
18
111
135
170
44
265
208
169
117
0
13
56
83
100
66
172
16
35
1858
64
144
6
73
67
36
3
17
130
145
0
11
016
56
43
41
Mueller
Kreinhop
Hassler
Benfer
Eiland
Brill
Klenk
Roth
Zwink
Frank
Metzler
McDougle
Schultz
Nitsch
LemmEhrhardt
Krahn
Kuehnle
Mittelstadt
Future Elem
Blackshear
Benignus
Future Elem.
Haude
Theiss
Epps Island
Future Elementary
Northampton
Projected�EE�5th�Grade�Studentsby�Planning�Unit
Fall,�2020
Population and Survey Analysts - October, 2011 Klein I.S.D. - Page 258
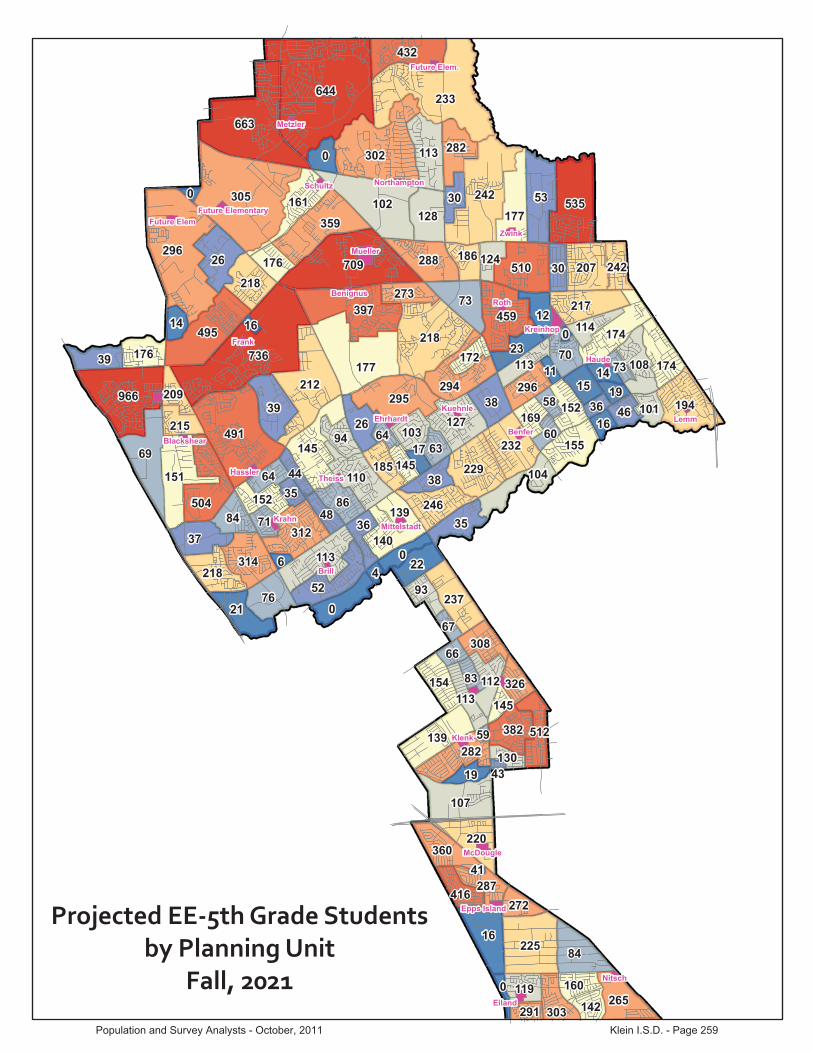
644
736
305
233
296
663
709
491
302
242
218
966
177212
397
102
69
53553
495
225
0
359
16
295
52
26
459
504
39
84
151
107
510
145
194
229
73
113
432
312
232
37
76
113
21
294
139
110
127
288
177
314
207
237
217
0
38
282
35
220
161
265
246
128
26
155
218
22218
12
86
360
84
17439
382
282
70
140
38
94
15
303
30
308
176
93
30
273
103
119
63
186
46215
71
14
160
142291
174
0
108
104
23
512
154 112
36
296152
287
64
416
152
185
242
113
48
113
326
19
139
176
114
44
272
209
169
0
14
60
83
124
101
66
172
16
35
1958
64
145
6
73
67
36
4
17
130
145
0
11
016
59
43
41
Mueller
Kreinhop
Hassler
Benfer
Eiland
Brill
Klenk
Roth
Zwink
Frank
Metzler
McDougle
Schultz
Nitsch
LemmEhrhardt
Krahn
Kuehnle
Mittelstadt
Future Elem
Blackshear
Benignus
Future Elem.
Haude
Theiss
Epps Island
Future Elementary
Northampton
Projected�EE�5th�Grade�Studentsby�Planning�Unit
Fall,�2021
Population and Survey Analysts - October, 2011 Klein I.S.D. - Page 259
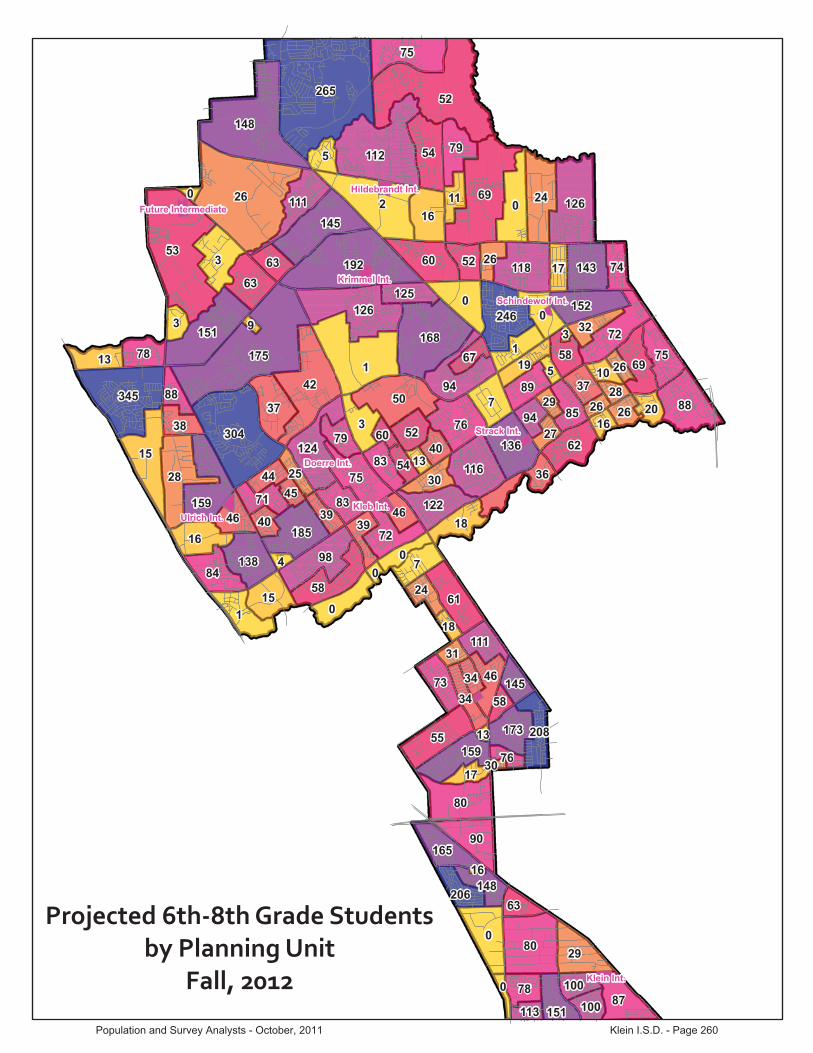
26
1
265 52
53
2
175
69
148
192
42
304
112
0
0
3
80
168
345
0
50
126
28
80
1
15
88
12624
7
151
75
0
98
145
94
55
3 76
54
72
60
75
7
0
5861
246
159
37
29
118
90
87
1
116124
16
62
63
84
185
7569
136
36
16
79
15
72
138
143
152
5
159
111
18
73
122
46
89
78
83
165
46
13
173
85
3
58
52
83
78
7452
30
7938
111
37
46
63
151
17
11
24
63
88
94
125
40
2026
40
100
100113
0
71
208
34
19
39
32
148
44
206
26
67
39
145
17
5425
0
10
27
5
34
76
31
58
16
45
2829
60
4
26
18
26
0
13
0
93
13
30
16
Krimmel Int.
Doerre Int.
Klein Int.
Ulrich Int.Kleb Int.
Hildebrandt Int.
Future Intermediate
Strack Int.
Schindewolf Int.
Projected�6th�8th�Grade�Studentsby�Planning�Unit
Fall,�2012
Population and Survey Analysts - October, 2011 Klein I.S.D. - Page 260

31
1
275 62
58
2
185
70
171
220
41
275
119
1
2
3
80
164
359
1
59
146
34
77
2
12
83
13019
7
168
0
84
120
57
5 73
52
71
71
84
7
0
6362
228
171
40
35
114
87
94
1
135
115
20
57
70
80
106
201
7250
134
37
21
77
17
104
60
135
138
146
7
147
17113
73
105
48
90
78
73
174
37
12
177
80
3
43
50
83
80
8656
27
6050
930
91
51
69
114
159
22
11
29
83
87
99
125
45
3024
45
127
0
73
195
43
10
36
36
160
39
197
23
82
41
153
14
5626
100
0
35
7
45
66
30
55
12
44
2930
56
4
29
26
26
0
18
0
75
17
31
17
Krimmel Int.
Doerre Int.
Klein Int.
Ulrich Int.Kleb Int.
Hildebrandt Int.
Future Intermediate
Strack Int.
Schindewolf Int.
Projected�6th�8th�Grade�Studentsby�Planning�Unit
Fall,�2013
Population and Survey Analysts - October, 2011 Klein I.S.D. - Page 261

42
4
291 59
66
3
219
84
179
249
44
272
118
2
9
4
92
148
385
4
85
166
40
73
4
10
74
14824
5
163
0
88
129
58
6 72
44
73
82
88
8
1
5579
215
191
34
39
85
2
160
104
25
106
55
72
85
135
190
7340
126
37
22
71
25
105
60
118
139
133
6
135
10
114
62
108
105
47
95
73
156
35
12
180
94
2
46
45
88
86
8266
26
5554
932
95
57
74
117
146
17
11
34
93
80
87
134
44
3225
47
118
0
66
181
54
14
33
103
32
146
40
189
25
80
40
11
163
6217
113
0
40
8
41
64
35
49
13
37
1828
44
4
31
28
26
0
14
0
74
17
27
15
Krimmel Int.
Doerre Int.
Klein Int.
Ulrich Int.Kleb Int.
Hildebrandt Int.
Future Intermediate
Strack Int.
Schindewolf Int.
Projected�6th�8th�Grade�Studentsby�Planning�Unit
Fall,�2014
Population and Survey Analysts - October, 2011 Klein I.S.D. - Page 262
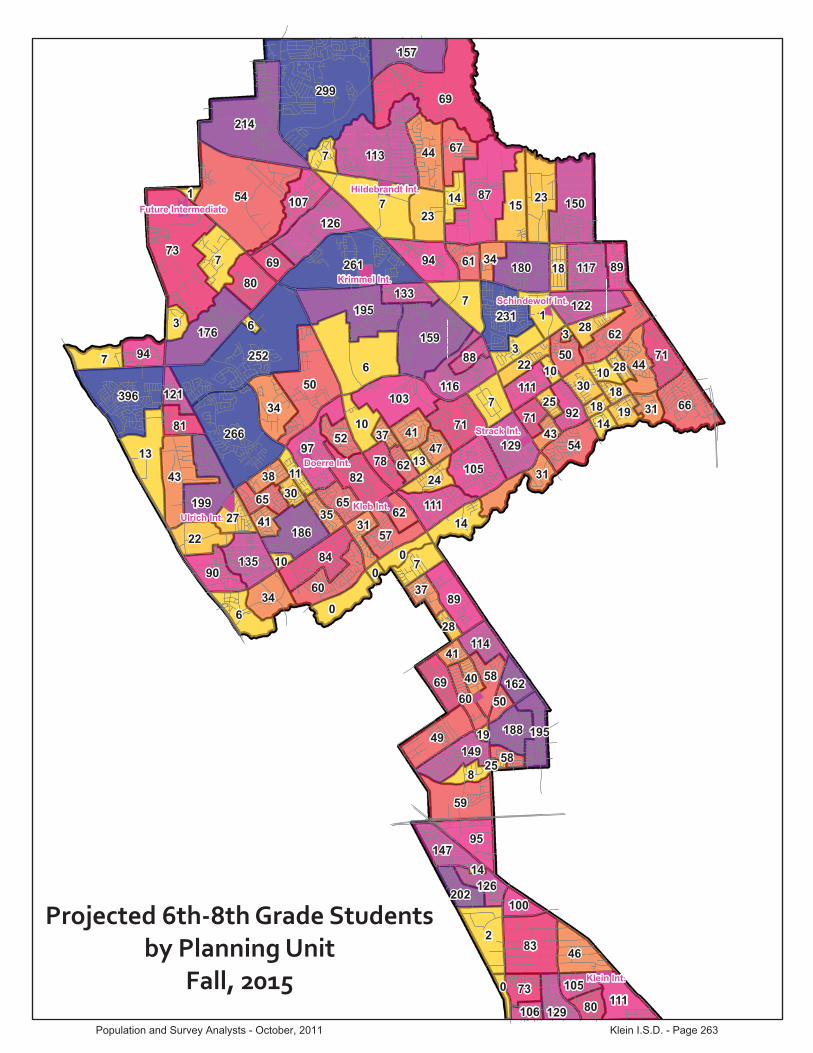
54
6
299 69
73
7
252
87
214
261
50
266
113
2
7
83
159
396
7195
43
59
6
13 97
66
15023
7
176
0
84
126
49
71
44
62
94
82
103
15
7
1
6089
7
231
199
34
46
95
3
180
23
105
54
80
90
157
186
7144
129
31
22
116
67
34
57
117
135
122
7
149
111
11114
69
107
10
58
94
65
147
27
188
92
3
50
41
78
73
8961
24
5281
30
62
69
114
129
18
37
80
71
14
133
47
3119
41
105
106
0
8
65
195
60
22
111
31
28
126
38
202
34
88
35
162
6211
100
121
0
10
43
40
58
41
50
14
30
1825
37
28
28
18
0
13
1
10
6
10
3
19
25
14
Krimmel Int.
Doerre Int.
Klein Int.
Ulrich Int.Kleb Int.
Hildebrandt Int.
Future Intermediate
Strack Int.
Schindewolf Int.
Projected�6th�8th�Grade�Studentsby�Planning�Unit
Fall,�2015
Population and Survey Analysts - October, 2011 Klein I.S.D. - Page 263

64
306 76
85
309
96
225
10
275
56
279
13
104
3
8
91
152
397
207
43
58
7
14 89
67
17230
8
170
0
81
135
50
60
43
118
64
71
22
7
2
55
8
240
213
32
47
5
183
21
105
60
1086
98
119
174
175
7152
31
24
73
35
133
59
100
134
112
121
103
5
147
17110
11
66
108
101
106
56
72
162
29
166
87
3
44
34
85
62
62
24
5385
31
62
71
118
130
12
107
49
92
88
61
13
136
45
3622
41
100
93
0
65
196
60
27
30
108
29
121
33
208
41
79
105
37
142
12
6012
117
0
10
49
9
31
62
39
55
15
22
1424
40
8
29
22
11
19
1
1
64
22
24
13
Krimmel Int.
Doerre Int.
Klein Int.
Ulrich Int.Kleb Int.
Hildebrandt Int.
Future Intermediate
Strack Int.
Schindewolf Int.
Projected�6th�8th�Grade�Studentsby�Planning�Unit
Fall,�2016
Population and Survey Analysts - October, 2011 Klein I.S.D. - Page 264

74
314 84
93
313
236
14
286
59
280
110
16
3
101
9
90
151
395
207
46
58
8
17 89
67
18031
9
172
0
81
137
51
59
44
65
71
123
30
7
2
55
239
216
32
46
6
194
24
105
59
1290
98
119
180
175
7453
30
25
77
36
137
58
108
134
112
121
106
5
146
17
66
108
101
106
109
12
56
72
161
29
10
169
88
4
45
34
85
62
66
25
5388
31
63
72
117
129
12
107
48
94
88
60
13
135
45
3622
41
100
93
0
65
195
62
29
30
108
29
121
33
207
43
79
106
37
142
12
6012
117
0
10
49
9
31
62
39
55
15
22
1424
40
8
29
22
11
19
1
1
64
23
24
13
Krimmel Int.
Doerre Int.
Klein Int.
Ulrich Int.Kleb Int.
Hildebrandt Int.
Future Intermediate
Strack Int.
Schindewolf Int.
Projected�6th�8th�Grade�Studentsby�Planning�Unit
Fall,�2017
Population and Survey Analysts - October, 2011 Klein I.S.D. - Page 265

86
323 93
314
103
248
23
297
62
281
116
19
3
107
9
90
151
394
207
49
58
8
20 89
66
19231
176
0
81
139
52
59
45
67
71
128
39
7
3
55
238
219
32
46
7
206
28
106
59
1695
99
184
176
7854
120
30
26
82
36
141
58
116
135
112
120
109
5
10
146
18
66
108
100
106
109
12
56
11
71
161
29
172
89
4
45
34
85
62
71
26
5389
31
99
63
75
117
129
12
107
48
97
88
60
13
135
45
3622
41
92
0
65
194
63
31
30
107
30
120
33
207
46
78
106
37
141
12
6012
117
0
10
50
9
31
62
39
54
15
22
1424
40
8
29
22
11
19
1
1
64
24
24
13
Krimmel Int.
Doerre Int.
Klein Int.
Ulrich Int.Kleb Int.
Hildebrandt Int.
Future Intermediate
Strack Int.
Schindewolf Int.
Projected�6th�8th�Grade�Studentsby�Planning�Unit
Fall,�2018
Population and Survey Analysts - October, 2011 Klein I.S.D. - Page 266
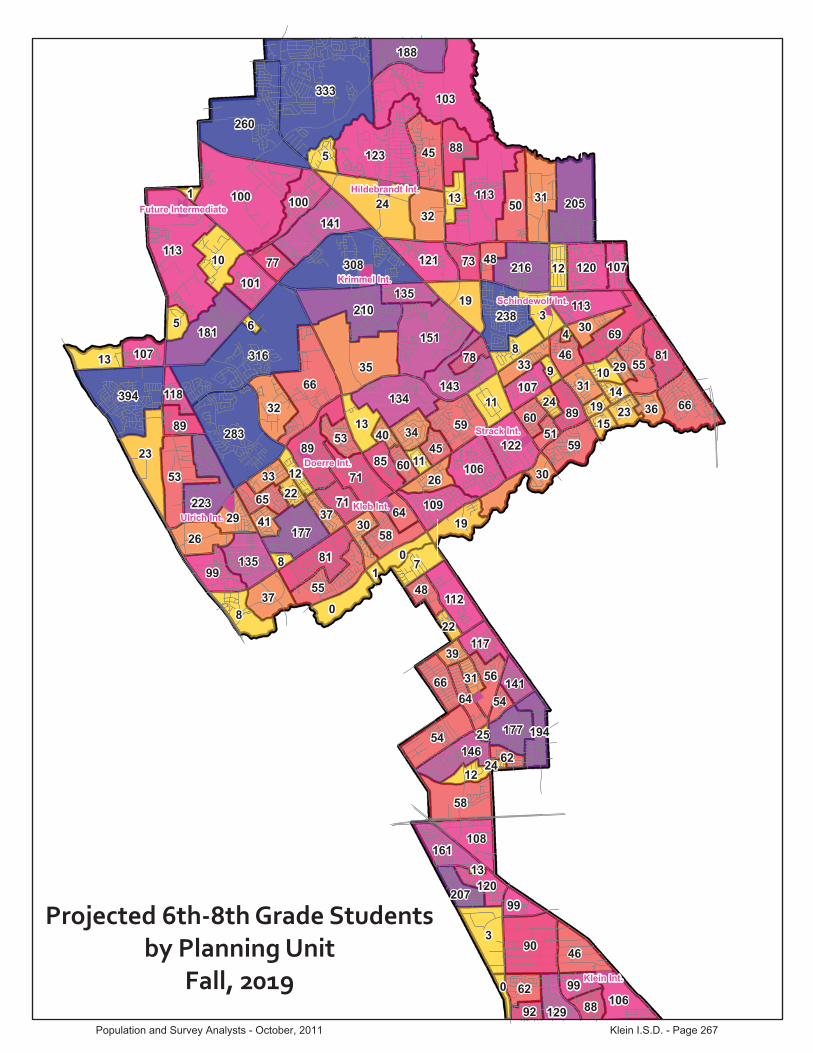
333
316
100
103
113
260
35
308
66
283
24
123
3
113
90
151
394
210
53
58
8
23 89
66
20531
181
0
81
141
54
59
45
69
71
134
50
7
3
55
10
238
223
32
46
8
216
32
106
59
19
99
188
177
8155
122
30
26
88
37
143
58
121
112
11
135
113
120
5
146
19
66
108
100
106
109
13
56
101
71
161
29
13
177
89
5
46
34
85
62
73
26
5389
31
99
64
77
117
129
12
107
48
99
88
60
13
135
45
3623
41
92
0
65
194
64
33
30
107
30
120
33
207
48
78
107
37
141
12
6012
118
0
10
51
9
31
62
39
54
15
22
1424
40
8
29
22
11
19
1
1
64
25
24
13
Krimmel Int.
Doerre Int.
Klein Int.
Ulrich Int.Kleb Int.
Hildebrandt Int.
Future Intermediate
Strack Int.
Schindewolf Int.
Projected�6th�8th�Grade�Studentsby�Planning�Unit
Fall,�2019
Population and Survey Analysts - October, 2011 Klein I.S.D. - Page 267
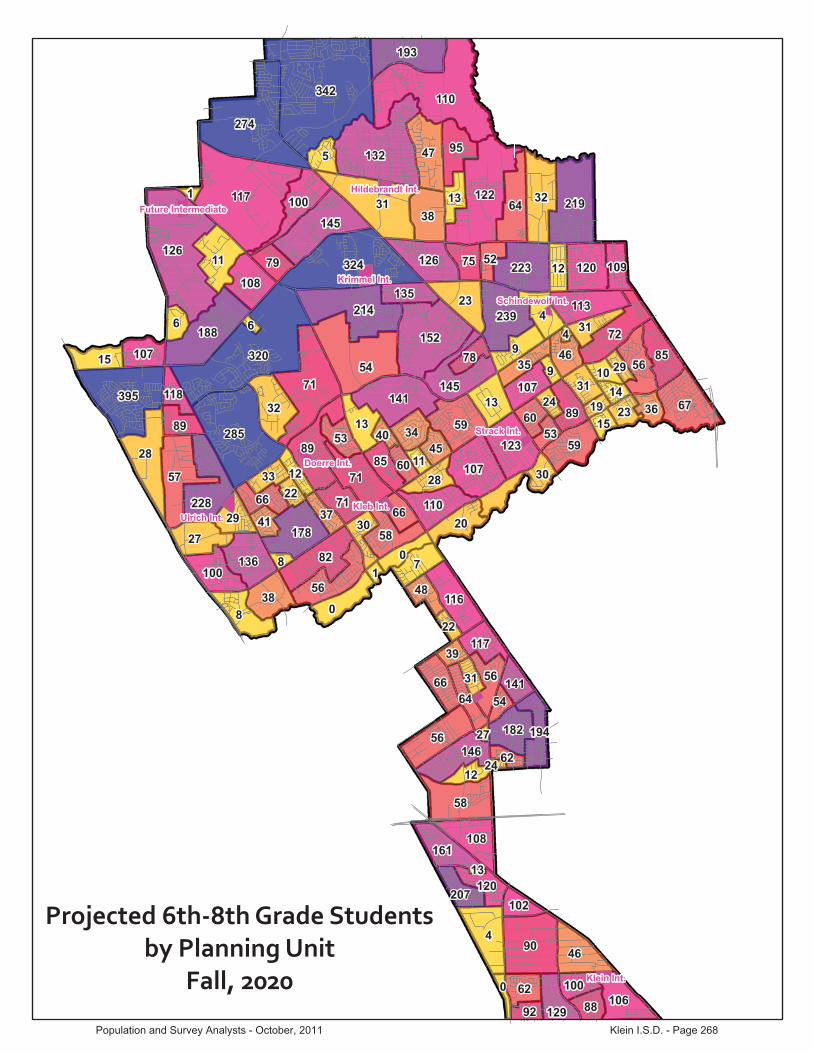
342
320
117
110
126
274
54
324
71
285
31
132
4
122
90
152
395
214
57
58
8
28 89
67
21932
188
0
82
145
56
59
47
72
71
141
64
7
11
4
56
239
228
32
46
9
223
38
107
59
23
193
178
8556
123
30
27
95
38
145
58
126
116
136
113
120
5
13
146
20110
66
108
100
106
13
56
108
100
71
161
29
15
182
89
6
46
34
85
62
75
28
5389
31
66
79
117
129
12
107
48
88
60
13
135
45
3623
41
100
92
0
66
194
64
35
30
107
31
120
33
207
52
78
109
37
141
12
6012
118
102
0
10
53
9
31
62
39
54
15
22
1424
40
8
29
22
11
19
1
1
64
27
24
13
Krimmel Int.
Doerre Int.
Klein Int.
Ulrich Int.Kleb Int.
Hildebrandt Int.
Future Intermediate
Strack Int.
Schindewolf Int.
Projected�6th�8th�Grade�Studentsby�Planning�Unit
Fall,�2020
Population and Survey Analysts - October, 2011 Klein I.S.D. - Page 268
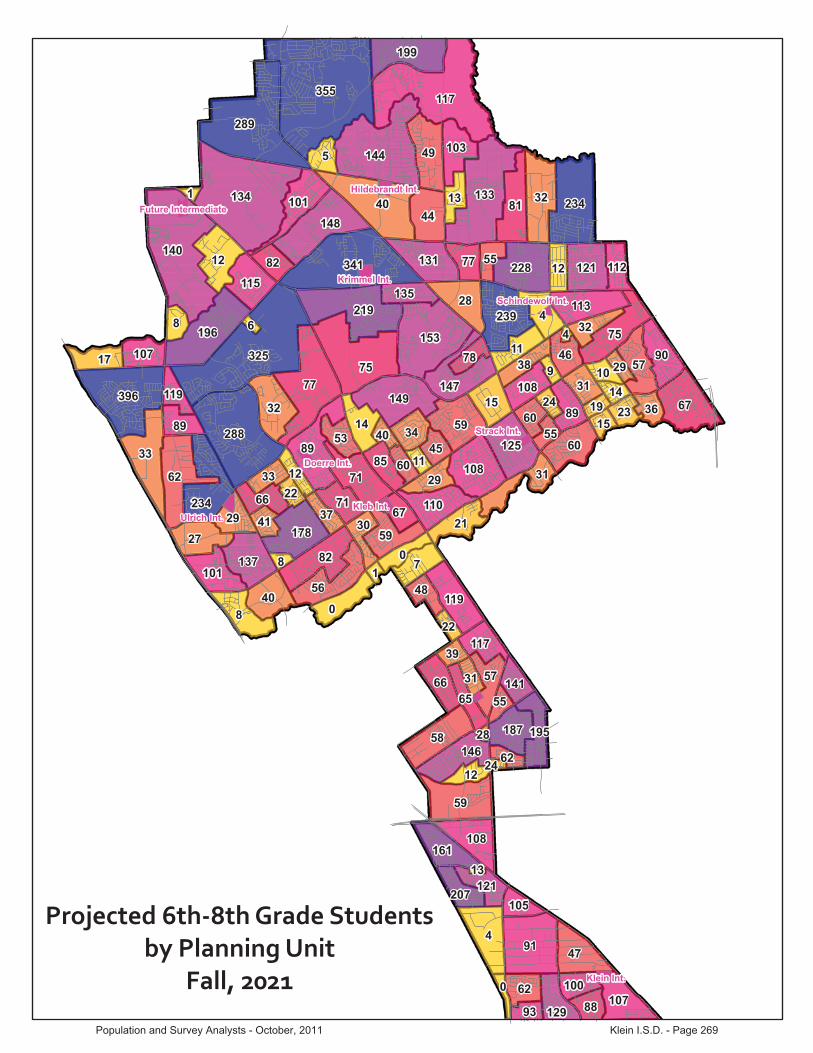
355
325
134
117
140
289
75
341
77
288
40
144
4
133
91
153
396
219
62
59
8
33 89
67
23432
196
0
82
148
58
59
49
75
71
149
81
7
4
56
12
239
234
32
47
228
44
108
60
28
199
178
9057
125
31
27
40
147
59
131
119
137
113
121
5
15
146
21110
66
108
101
107
14
57
115
101
71
161
29
17
187
89
8
103
46
34
85
62
77
29
5389
31
67
82
117
129
12
107
48
88
60
13
135
45
3623
41
100
93
0
11
66
195
65
38
30
108
32
121
33
207
55 112
78
37
141
12
6012
119
105
0
10
55
9
31
62
39
55
15
22
1424
40
8
29
22
11
19
1
1
64
28
24
13
Krimmel Int.
Doerre Int.
Klein Int.
Ulrich Int.Kleb Int.
Hildebrandt Int.
Future Intermediate
Strack Int.
Schindewolf Int.
Projected�6th�8th�Grade�Studentsby�Planning�Unit
Fall,�2021
Population and Survey Analysts - October, 2011 Klein I.S.D. - Page 269
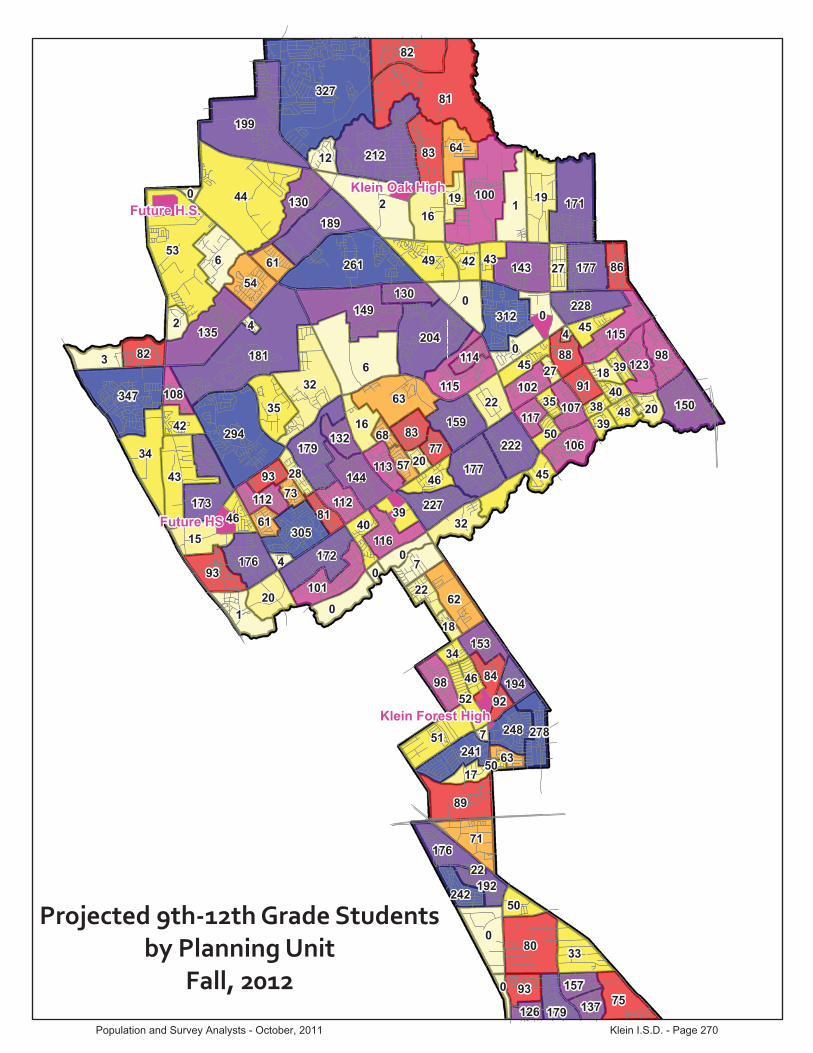
44
6
327 81
53
2
181
199
261
32
294
212
0
1100
6
80
204
347
0
63
149
43
89
1
34
17119
135
82
0
189
51
83
49
7
0
62
3
312
173
35
33
71
75
0
143
179
150
16
177
54
93
305
98
172
222
45
15
115
64
20
159
144
176
177
228
22
241
32
98
130
227
16
84
82
106
176
46
248
2
116
88
83
93
8642
46
42
91
39
61
179
27
153
112
22
50
12
19
130
77
2048
61
157
137126
115
101
0
123
278
52
45
40
102
45
107
112
192
93
242
113
43
132
81
194
17
5728
117
108
0
18
50
46
114
63
34
92
39
73
4035
68
4
39
18
38
0
20
0
27
4
7
4
50
22
Future HS
Future H.S.
Klein Oak High
Klein Forest High
Projected�9th�12th�Grade�Studentsby�Planning�Unit
Fall,�2012
Population and Survey Analysts - October, 2011 Klein I.S.D. - Page 270

50
6
335 83
59
2
187
214
278
34
294
211
0
3100
7
80
203
354
0
78
150
45
89
2
34
17720
136
0
190
52
84
57
7
0
67
3
312
181
35
32
75
79
0
154
178
151
16
182
61
96
101
305
98
172
224
45
15
64
23
127
158
146
180
178
228
22
241
33
130
233
16
86
84
109
178
46
252
2
118
88
83
92
8747
46
52
90
44
61
184
27
158
112
24
57
12
19
132
77
2448
61
157
137128
117
101
0
123
279
55
45
100
42
106
46
112
113
193
93
242
117
43
132
82
194
17
5827
117
109
0
18
53
47
116
64
36
92
39
72
4035
68
4
39
21
38
0
21
0
27
44
10
50
22
Future HS
Future H.S.
Klein Oak High
Klein Forest High
Projected�9th�12th�Grade�Studentsby�Planning�Unit
Fall,�2013
Population and Survey Analysts - October, 2011 Klein I.S.D. - Page 271
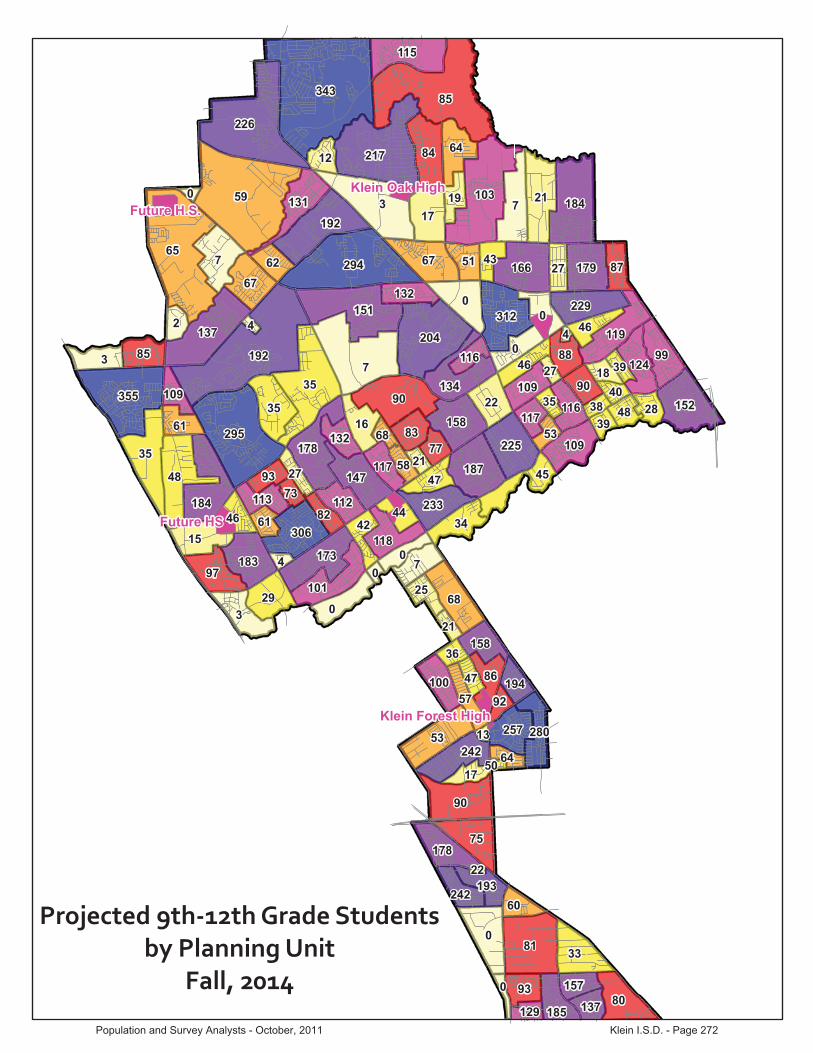
59
7
343 85
65
3
192
226
294
35
295
217
0
7103
7
81
204
355
0
90
151
48
90
3
35
18421
137
0
192
53
84
67
7
0
68
3
312
184
35
33
75
80
0
166
178
152
17
187
115
67
97
306
99
173
225
45
15
64
29
134
158
147
183
179
229
22
242
34
131
233
16
86
85
109
178
46
257
2
118
88
83
93
8751
47
61
90
44
62
185
27
158
112
25
60
12
19
132
77
2848
61
157
137129
119
101
0
124
280
57
46
100
42
109
46
116
113
193
93
242
117
43
132
82
194
17
5827
117
109
0
18
53
47
116
64
36
92
39
73
4035
68
4
39
21
38
0
21
0
27
44
13
50
22
Future HS
Future H.S.
Klein Oak High
Klein Forest High
Projected�9th�12th�Grade�Studentsby�Planning�Unit
Fall,�2014
Population and Survey Analysts - October, 2011 Klein I.S.D. - Page 272

68
7
350 92
71
4
196
238
310
38
298
223
0
105
8
81
204
355
3
97
151
51
90
4
36
19123
139
0
194
53
11
86
75
7
0
71
4
313
185
35
33
76
80
3
179
178
152
17
190
73
98
128
308
173
225
45
15
67
34
140
158
148
185
179
229
23
242
35
131
234
17
86
86
109
178
46
101
260
2
118
88
83
93
8855
47
69
90
44
64
185
27
159
112
25
63
12
19
133
77
3148
61
157
137129
121
101
0
125
280
59
46
100
110
42
46
119
113
193
93
243
117
44
132
82
194
17
5827
117
109
0
18
53
47
116
64
36
92
39
73
4035
68
4
39
21
38
0
21
0
27
44
14
50
22
Future HS
Future H.S.
Klein Oak High
Klein Forest High
Projected�9th�12th�Grade�Studentsby�Planning�Unit
Fall,�2015
Population and Survey Analysts - October, 2011 Klein I.S.D. - Page 273
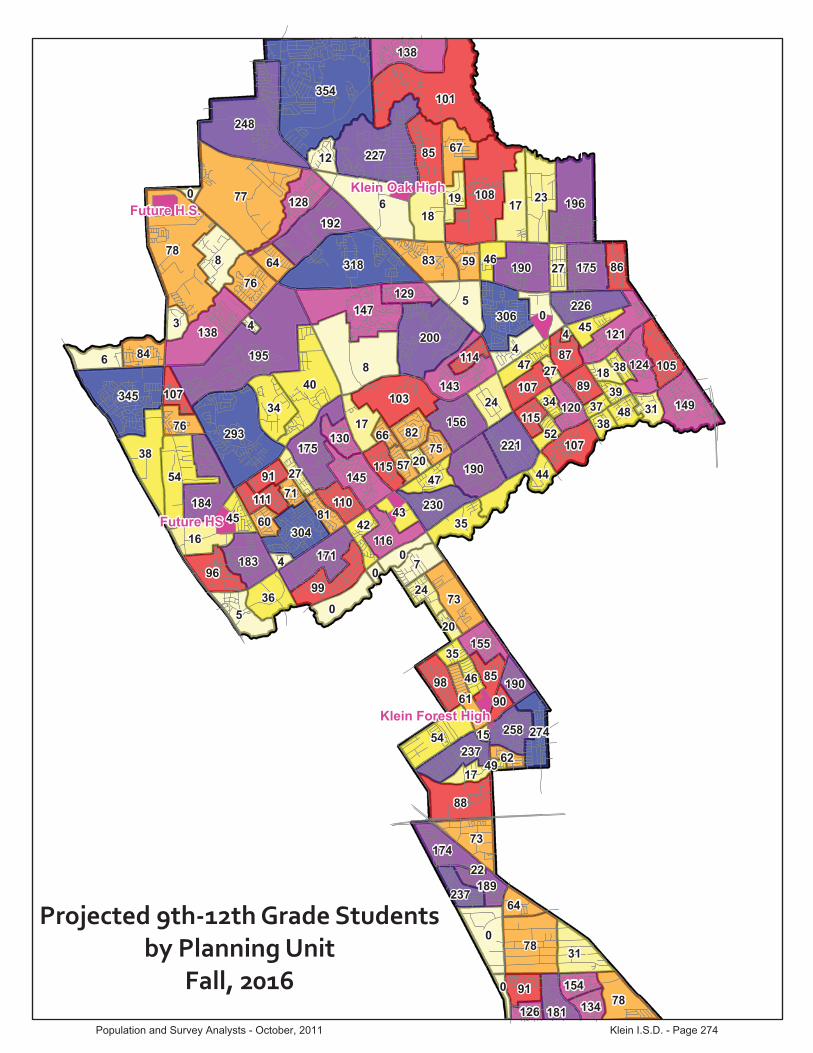
77
8
354
78
6
195
101
248
318
40
293
227
0
108
8
78
200
345
5147
54
88
5
38
19623
138
0
192
54
85
83
103
17
7
0
9973
6
306
184
34
31
73
78
4
190
175
149
18
190
76
96
138
304
171
221
44
16
67
36
143
156
145
183
175
226
24
237
35
98
128
230
17
85
84
107
174
45
105
258
3
116
87
82
91
8659
47
76
89
43
64
181
27
155
110
24
64
12
19
129
75
3148
60
154
134126
121
0
124
274
61
47
42
107
45
111
120
189
91
237
115
46
130
81
190
17
5727
115
107
0
18
52
46
114
62
35
90
38
71
3934
66
4
38
20
37
0
20
0
27
44
15
49
22
Future HS
Future H.S.
Klein Oak High
Klein Forest High
Projected�9th�12th�Grade�Studentsby�Planning�Unit
Fall,�2016
Population and Survey Analysts - October, 2011 Klein I.S.D. - Page 274
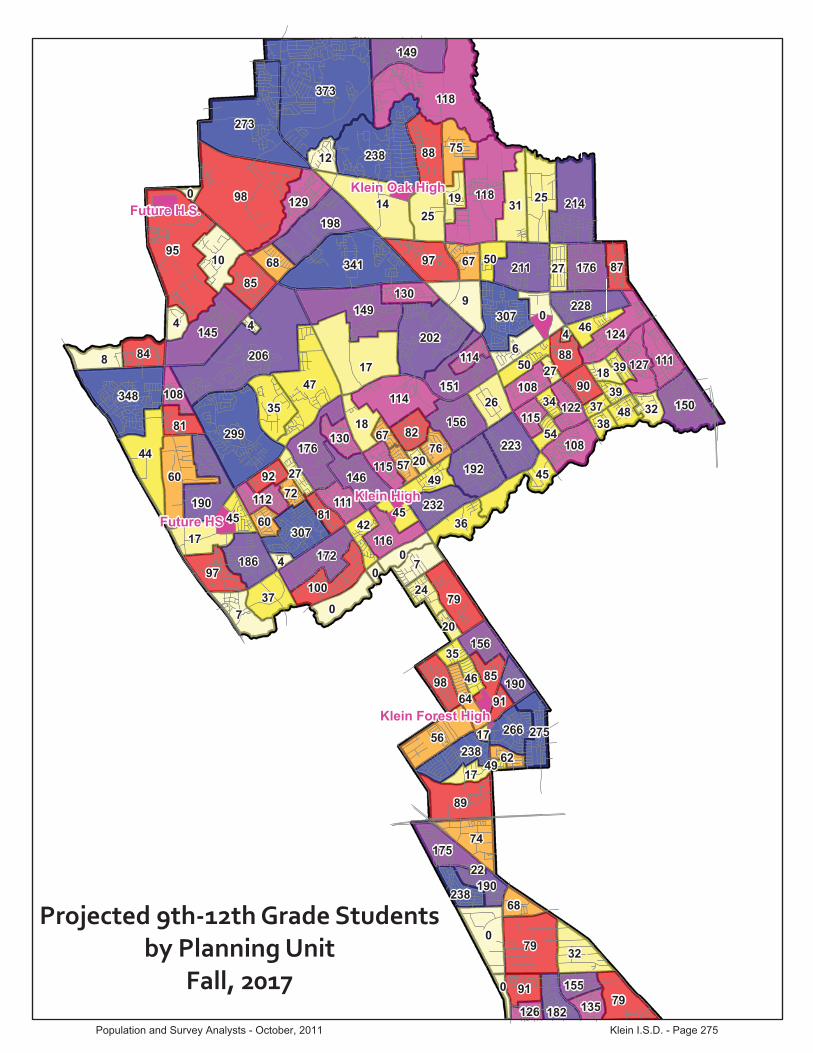
98
373
95
206
118
273
17
341
47
299
14
238
0
118
79
202
348
9149
60
89
7
44
21425
145
0
198
56
88
114
97
31
7
0
79
8
10
307
190
35
32
211
74
79
6
176
150
25
192
85
97
149
307
172
223
45
17
75
37
151
156
146
186
176
228
26
238
36
98
129
232
18
85
11184
108
175
45
266
4
116
88
82
91
8767
49
81
90
45
68
182
27
111
156
24
68
12
19
130
76
3248
60
155
135126
124
100
0
127
275
64
50
42
108
46
122
112
190
92
238
115
50
130
81
190
17
5727
115
108
0
18
54
46
114
62
35
91
38
72
3934
67
4
39
20
37
0
20
0
27
44
17
49
22
Future HS
Future H.S.
Klein High
Klein Oak High
Klein Forest High
Projected�9th�12th�Grade�Studentsby�Planning�Unit
Fall,�2017
Population and Survey Analysts - October, 2011 Klein I.S.D. - Page 275
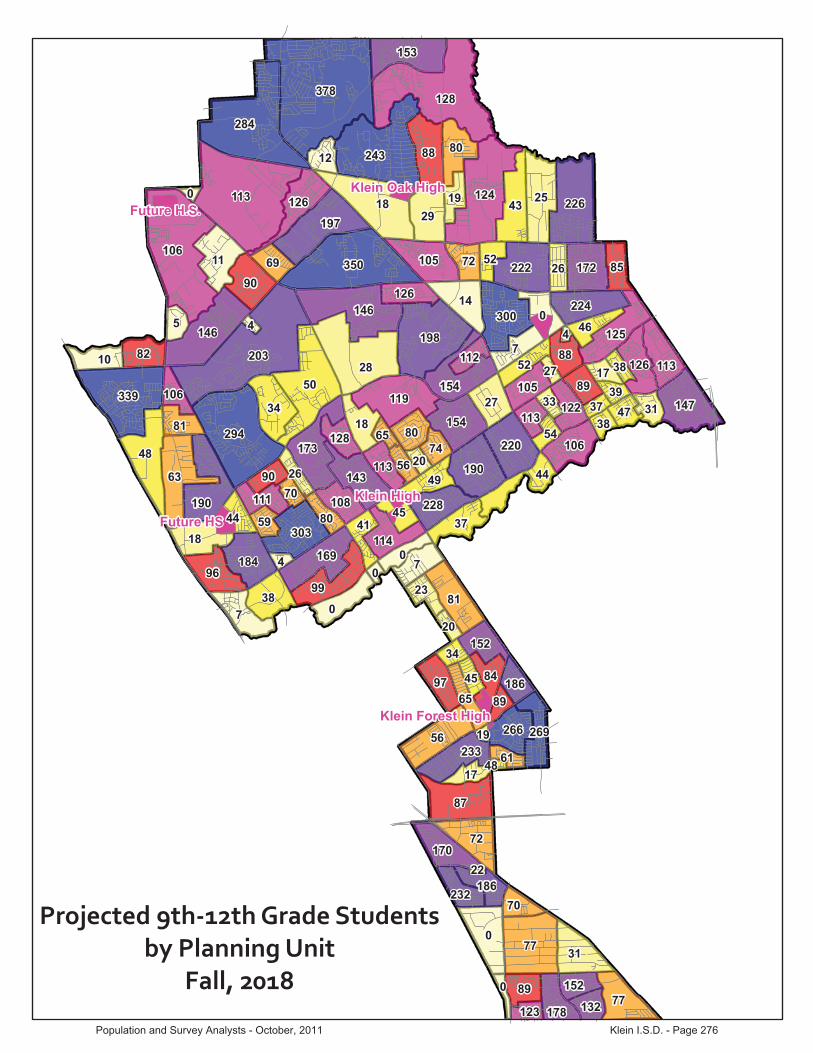
378
203
113
128
106
284
28
350
50
294
18
243
0
124
77
198
339
146
63
87
7
48
22625
146
0
197
56
88
119
43
7
11
0
9981
300
190
34
31
72
77
7
222
173
147
29
190
1490
96
153
303
169
220
44
18
80
38
154
154
105
143
184
172
224
27
233
37
97
126
228
18
84
82
106
113
170
44
10
266
5
114
88
80
89
8572
49
81
89
45
69
178
26
152
23
70
12
19
126
74
3147
59
152
132123
125
0
126
269
65
52
41
105
46
108111
122
186
90
232
113
52
128
80
186
17
5626
113
106
0
17
54
45
112
61
34
89
38
70
3933
65
4
38
20
37
0
20
0
27
44
19
48
22
Future HS
Future H.S.
Klein High
Klein Oak High
Klein Forest High
Projected�9th�12th�Grade�Studentsby�Planning�Unit
Fall,�2018
Population and Survey Analysts - October, 2011 Klein I.S.D. - Page 276
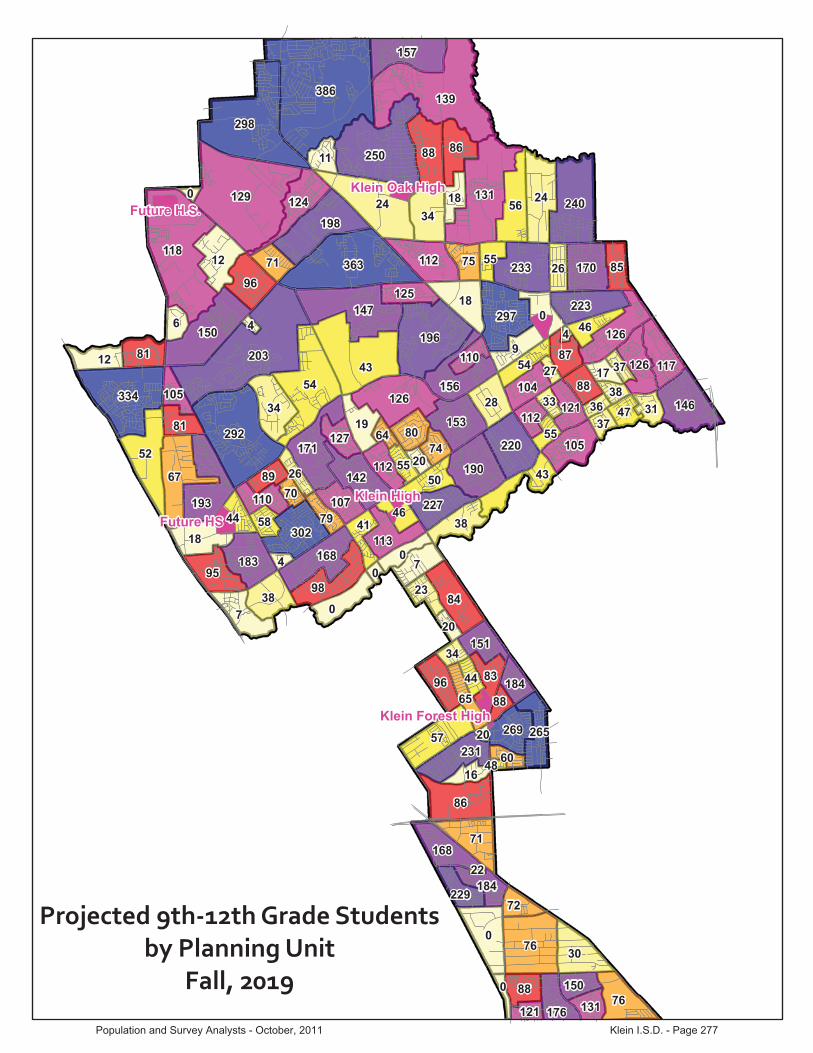
386
203
129
139
118
298
43
363
54
292
24
250
0
131
76
196
334
147
67
86
7
52
24024
150
0
198
57
88
126
56
7
0
9884
12
297
193
34
30
71
76
9
233
171
146
34
190
1896
95
157
302
168
220
43
18
86
38
156
112
153
142
183
170
223
28
231
38
96
124
227
19
83
81
105
117
168
44
12
269
6
113
87
80
88
8575
50
81
88
46
71
176
26
151
11
23
72
18
125
74
3147
58
150
131121
126
0
126
265
65
54
41
104
46
107
121
110
184
89
229
112
55
127
79
184
16
5526
112
105
0
17
55
44
110
60
34
88
37
70
3833
64
4
37
20
36
0
20
0
27
44
20
48
22
Future HS
Future H.S.
Klein High
Klein Oak High
Klein Forest High
Projected�9th�12th�Grade�Studentsby�Planning�Unit
Fall,�2019
Population and Survey Analysts - October, 2011 Klein I.S.D. - Page 277
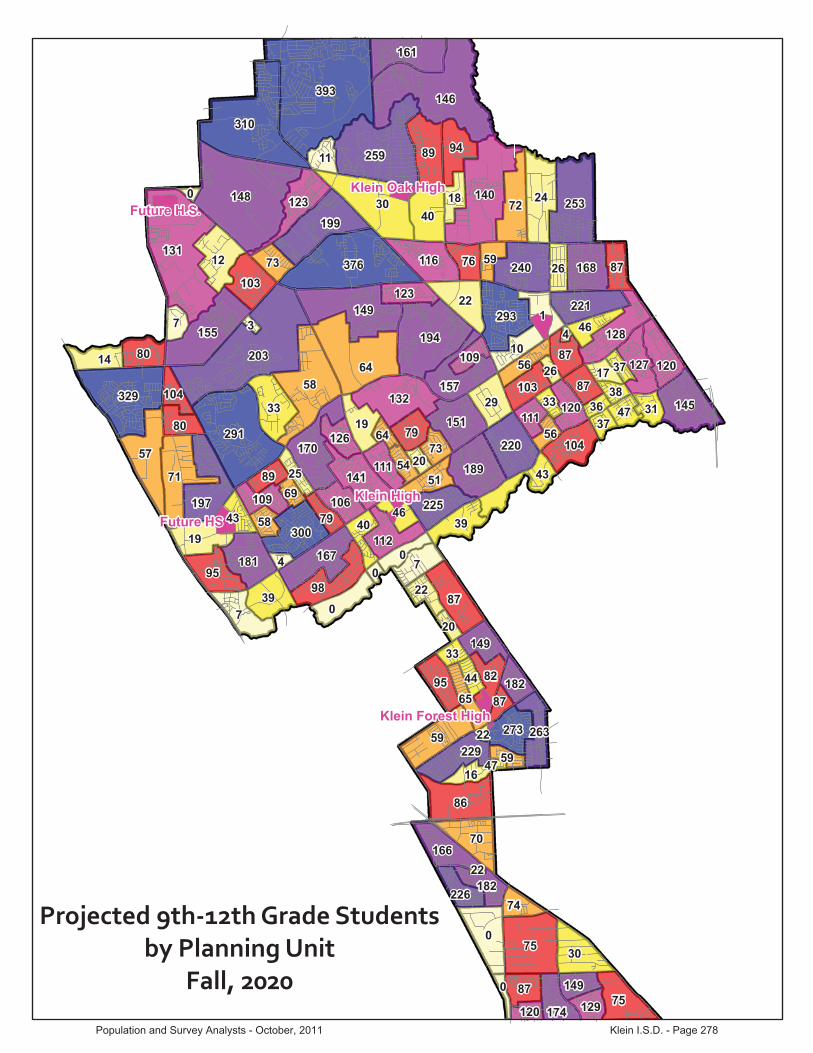
393
203
148
146
131
310
64
376
58
291
30
259
0
140
75
194
329
149
71
86
7
57
25324
155
0
199
59
89
132
72
7
1
9887
12
293
197
33
30
70
75
240
170
145
40
189
22
95
161
300
167
220
43
19
94
39
157
116
151
141
181
168
221
29
229
39
95
123
225
19
82
80
104
103
166
43
12014
273
7
112
87
79
87
8776
51
80
87
46
73
174
26
149
11
22
74
18
123
73
3147
58
149
129120
128
0
12710
263
65
56
40
103
46
106
120
111
182
89
226
109
59
126
79
182
16
54
111
25
104
0
17
56
44
59
33
109
87
37
69
3833
64
4
37
20
36
0
20
0
26
34
22
47
22
Future HS
Future H.S.
Klein High
Klein Oak High
Klein Forest High
Projected�9th�12th�Grade�Studentsby�Planning�Unit
Fall,�2020
Population and Survey Analysts - October, 2011 Klein I.S.D. - Page 278
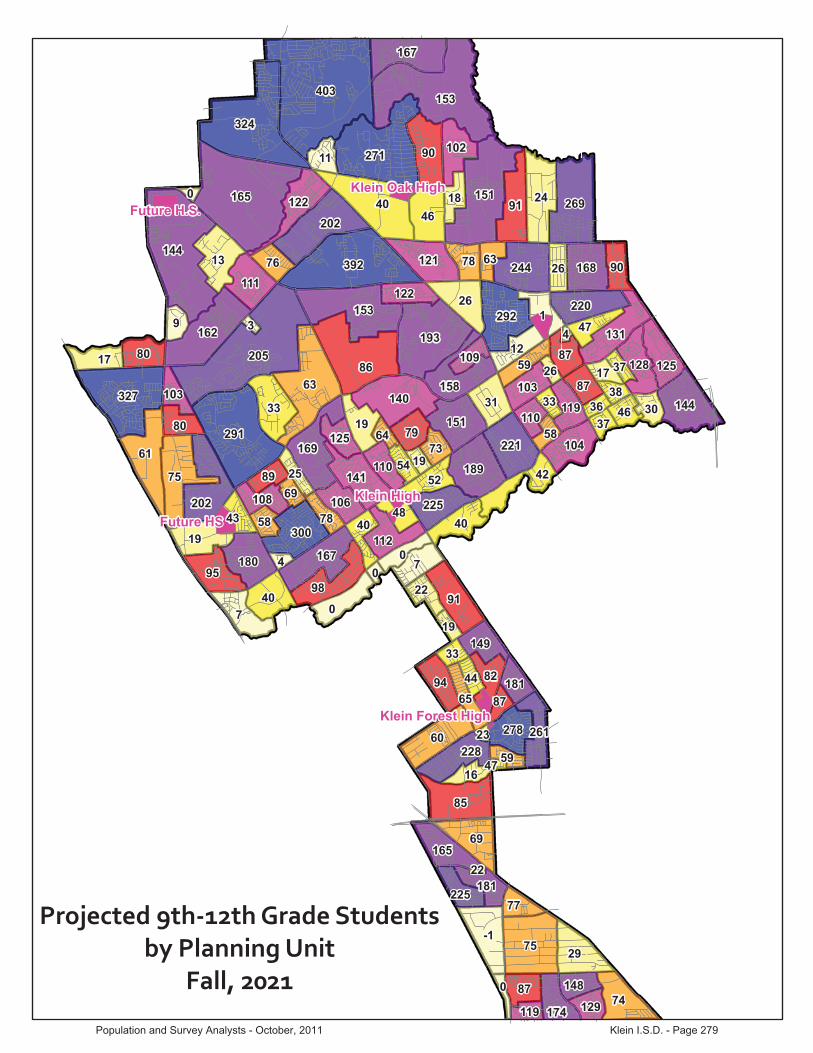
403
205
165
153
144
324
86
392
63
291
40
271
151
75
193
327
153
75
85
7
61
269
-1
24
162
0
202
60
90
140
91
7
1
9891
13
292
202
33
29
69
74
244
169
144
46
189
26
95
167
300
167
221
42
19
40
158
151
121
141
180
168
220
31
228
40
94
122
225
111
19
82
80
104
165
43
12517
278
9
112
102
87
79
87
9078
52
80
87
48
76
174
26
149
11
22
77
18
122
73
3046
58
148
129119
131
0
12812
261
65
59
40
103
47
106
119
181
89
225
108
110
63
125
78
181
16
5425
110
103
0
17
58
44
59
33
109
87
37
69
3833
64
4
37
19
36
0
19
0
26
34
23
47
22
Future HS
Future H.S.
Klein High
Klein Oak High
Klein Forest High
Projected�9th�12th�Grade�Studentsby�Planning�Unit
Fall,�2021
Population and Survey Analysts - October, 2011 Klein I.S.D. - Page 279
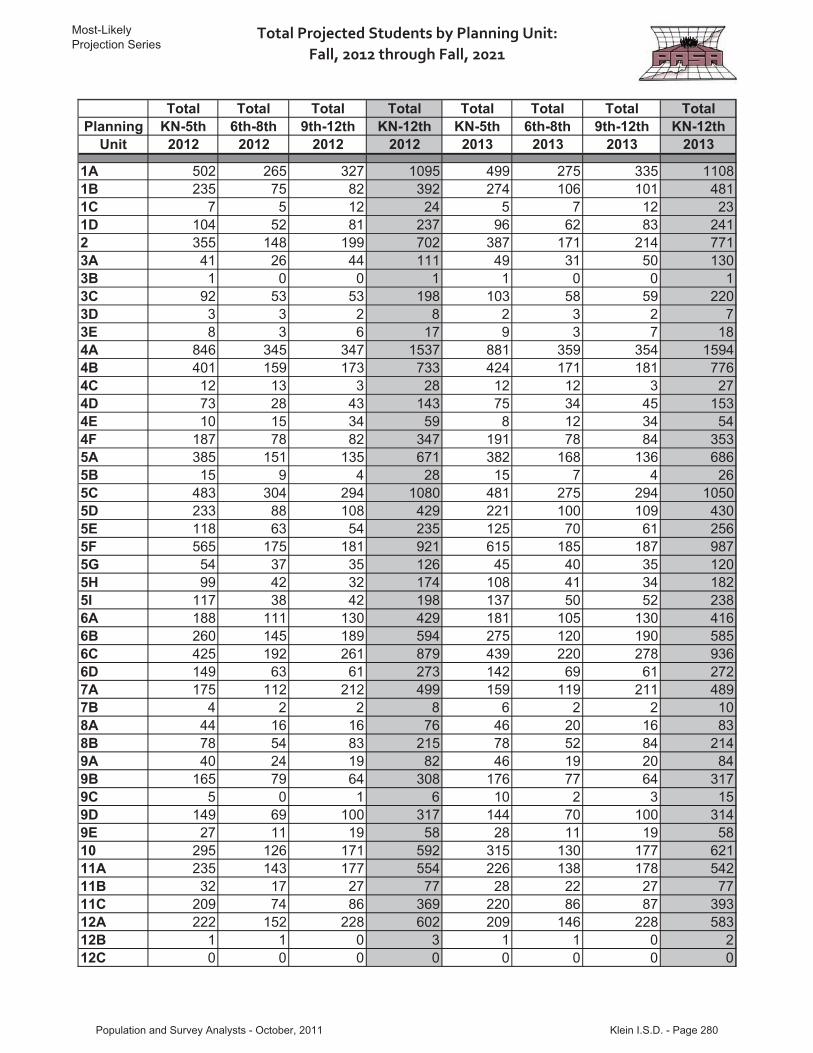
Most-LikelyProjection Series
Total�Projected�Students�by�Planning�Unit:��Fall,�2012�through�Fall,�2021
Total Total Total Total Total Total Total TotalPlanning KN-5th 6th-8th 9th-12th KN-12th KN-5th 6th-8th 9th-12th KN-12th
Unit 2012 2012 2012 2012 2013 2013 2013 2013
1A 502 265 327 1095 499 275 335 11081B 235 75 82 392 274 106 101 4811C 7 5 12 24 5 7 12 231D 104 52 81 237 96 62 83 2412 355 148 199 702 387 171 214 7713A 41 26 44 111 49 31 50 1303B 1 0 0 1 1 0 0 13C 92 53 53 198 103 58 59 2203D 3 3 2 8 2 3 2 73E 8 3 6 17 9 3 7 184A 846 345 347 1537 881 359 354 15944B 401 159 173 733 424 171 181 7764C 12 13 3 28 12 12 3 274D 73 28 43 143 75 34 45 1534E 10 15 34 59 8 12 34 544F 187 78 82 347 191 78 84 3535A 385 151 135 671 382 168 136 6865B 15 9 4 28 15 7 4 265C 483 304 294 1080 481 275 294 10505D 233 88 108 429 221 100 109 4305E 118 63 54 235 125 70 61 2565F 565 175 181 921 615 185 187 9875G 54 37 35 126 45 40 35 1205H 99 42 32 174 108 41 34 1825I 117 38 42 198 137 50 52 2386A 188 111 130 429 181 105 130 4166B 260 145 189 594 275 120 190 5856C 425 192 261 879 439 220 278 9366D 149 63 61 273 142 69 61 2727A 175 112 212 499 159 119 211 4897B 4 2 2 8 6 2 2 108A 44 16 16 76 46 20 16 838B 78 54 83 215 78 52 84 2149A 40 24 19 82 46 19 20 849B 165 79 64 308 176 77 64 3179C 5 0 1 6 10 2 3 159D 149 69 100 317 144 70 100 3149E 27 11 19 58 28 11 19 5810 295 126 171 592 315 130 177 62111A 235 143 177 554 226 138 178 54211B 32 17 27 77 28 22 27 7711C 209 74 86 369 220 86 87 39312A 222 152 228 602 209 146 228 58312B 1 1 0 3 1 1 0 212C 0 0 0 0 0 0 0 0
Population and Survey Analysts - October, 2011 Klein I.S.D. - Page 280

Most-LikelyProjection Series
Total�Projected�Students�by�Planning�Unit:��Fall,�2012�through�Fall,�2021
Total Total Total Total Total Total Total TotalPlanning KN-5th 6th-8th 9th-12th KN-12th KN-5th 6th-8th 9th-12th KN-12th
Unit 2012 2012 2012 2012 2013 2013 2013 2013
13A 74 26 43 142 81 23 43 14713B 286 118 143 547 305 135 154 59314 479 246 312 1037 477 228 312 101715A 137 60 49 246 148 71 57 27615B 3 0 0 3 6 1 0 615C 380 126 149 655 382 146 150 67815D 275 125 130 530 280 125 132 53715E 168 67 114 349 168 82 116 36515F 204 94 115 412 225 104 127 45515G 5 1 6 12 7 1 6 1515H 102 52 42 197 108 56 47 21115I 268 168 204 639 243 164 203 61116 17 3 16 36 17 5 16 3817 99 79 132 310 99 60 132 29118A 171 124 179 473 152 114 178 44418B 34 25 28 87 33 26 27 8619A 66 44 93 203 62 39 93 19419B 136 71 112 320 139 73 113 32519C 44 45 73 162 37 44 72 15420A 68 46 46 159 74 37 46 15720B 263 138 176 578 274 135 180 58920C 31 15 20 66 35 17 23 7521A 46 16 15 77 40 21 15 7621B 195 84 93 373 209 80 96 38621C 3 1 1 5 6 2 2 1022 140 98 172 411 130 84 172 38723A 79 40 61 181 76 45 61 18123B 335 185 305 825 314 201 305 82023C 13 4 4 20 10 4 4 1824A 117 83 112 311 114 73 112 29924B 65 39 81 185 63 41 82 18525 130 75 144 349 119 84 146 34826 169 83 113 366 183 83 117 38327A 72 60 68 200 73 56 68 19727B 85 52 83 221 86 50 83 22028A 127 54 57 238 136 56 58 25028B 22 13 20 55 19 18 21 5829 81 40 77 198 75 45 77 19730A 135 50 63 247 163 59 78 30030B 11 7 22 39 8 7 22 3730C 125 76 159 359 116 73 158 34731A 226 89 102 417 250 90 106 44631B 15 10 18 43 15 9 18 4131C 41 37 91 169 31 30 90 15231D 61 19 45 125 71 10 45 127
Population and Survey Analysts - October, 2011 Klein I.S.D. - Page 281

Most-LikelyProjection Series
Total�Projected�Students�by�Planning�Unit:��Fall,�2012�through�Fall,�2021
Total Total Total Total Total Total Total TotalPlanning KN-5th 6th-8th 9th-12th KN-12th KN-5th 6th-8th 9th-12th KN-12th
Unit 2012 2012 2012 2012 2013 2013 2013 2013
31E 78 58 88 223 71 43 88 20131F 16 5 27 47 16 7 27 5031G 7 3 4 13 3 5 4 1232A 122 72 115 309 125 71 117 31232B 88 69 123 281 88 50 123 26032C 126 75 98 299 120 72 98 29032D 76 32 45 153 81 36 46 16232E 66 26 39 131 65 29 39 13433A 153 88 150 391 157 83 151 39133B 59 20 20 99 68 30 24 12334A 29 28 40 97 23 29 40 9134B 35 26 38 99 37 26 38 10034C 45 26 48 118 43 24 48 11534D 23 16 39 78 22 12 39 7335A 142 85 107 334 141 80 112 33335B 54 29 35 118 53 30 35 11836 122 62 106 289 137 57 109 30337A 152 94 117 363 146 99 117 36237B 72 27 50 150 75 35 53 16338A 245 136 222 603 236 134 224 59538B 75 36 45 157 81 37 45 16239 184 116 177 476 192 115 182 48940 38 30 46 114 33 27 46 10641A 216 122 227 566 232 113 233 57841B 23 18 32 74 23 17 33 7442 119 46 39 204 127 51 44 22143A 120 72 116 308 127 60 118 30543B 50 39 40 129 47 36 42 12543C 0 0 0 0 0 0 0 043D 0 0 0 0 0 0 0 044A 96 58 101 255 78 63 101 24244B 0 0 0 0 0 0 0 045 14 7 7 28 15 7 7 2846 90 24 22 136 98 29 24 15147 176 61 62 298 194 62 67 32348 52 18 18 88 57 26 21 10449 143 73 98 314 146 73 100 31950 73 31 34 138 76 30 36 14151 263 111 153 527 287 114 158 55952A 330 145 194 669 315 153 194 66252B 122 58 92 273 127 55 92 27353 107 46 84 237 112 48 86 24554A 79 34 46 159 74 45 47 16654B 95 34 52 181 94 43 55 19155A 295 159 241 695 295 147 241 683
Population and Survey Analysts - October, 2011 Klein I.S.D. - Page 282
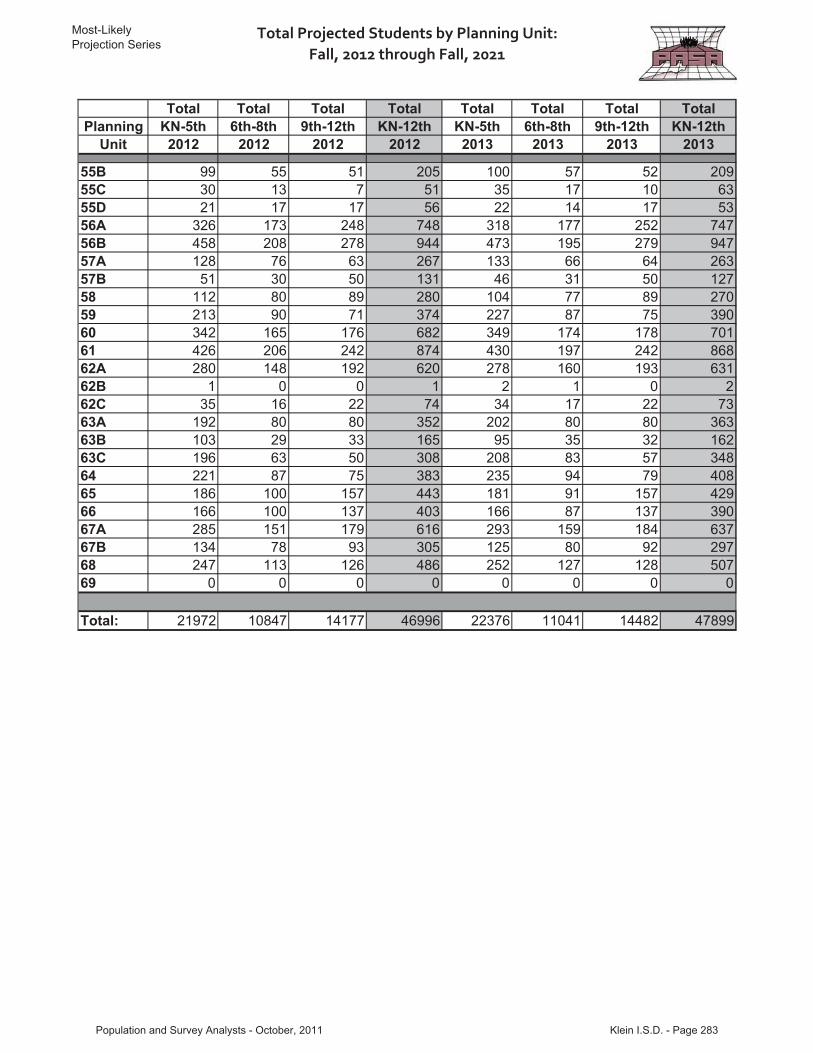
Most-LikelyProjection Series
Total�Projected�Students�by�Planning�Unit:��Fall,�2012�through�Fall,�2021
Total Total Total Total Total Total Total TotalPlanning KN-5th 6th-8th 9th-12th KN-12th KN-5th 6th-8th 9th-12th KN-12th
Unit 2012 2012 2012 2012 2013 2013 2013 2013
55B 99 55 51 205 100 57 52 20955C 30 13 7 51 35 17 10 6355D 21 17 17 56 22 14 17 5356A 326 173 248 748 318 177 252 74756B 458 208 278 944 473 195 279 94757A 128 76 63 267 133 66 64 26357B 51 30 50 131 46 31 50 12758 112 80 89 280 104 77 89 27059 213 90 71 374 227 87 75 39060 342 165 176 682 349 174 178 70161 426 206 242 874 430 197 242 86862A 280 148 192 620 278 160 193 63162B 1 0 0 1 2 1 0 262C 35 16 22 74 34 17 22 7363A 192 80 80 352 202 80 80 36363B 103 29 33 165 95 35 32 16263C 196 63 50 308 208 83 57 34864 221 87 75 383 235 94 79 40865 186 100 157 443 181 91 157 42966 166 100 137 403 166 87 137 39067A 285 151 179 616 293 159 184 63767B 134 78 93 305 125 80 92 29768 247 113 126 486 252 127 128 50769 0 0 0 0 0 0 0 0
Total: 21972 10847 14177 46996 22376 11041 14482 47899
Population and Survey Analysts - October, 2011 Klein I.S.D. - Page 283

Most-LikelyProjection Series
Total�Projected�Students�by�Planning�Unit:��Fall,�2012�through�Fall,�2021
PlanningUnit
1A1B1C1D23A3B3C3D3E4A4B4C4D4E4F5A5B5C5D5E5F5G5H5I6A6B6C6D7A7B8A8B9A9B9C9D9E1011A11B11C12A12B12C
Total Total Total Total Total Total Total TotalKN-5th 6th-8th 9th-12th KN-12th KN-5th 6th-8th 9th-12th KN-12th2014 2014 2014 2014 2015 2015 2015 2015
499 291 343 1133 499 299 350 1148312 135 115 562 345 157 128 629
3 6 12 20 0 7 12 19103 59 85 248 118 69 92 280427 179 226 833 454 214 238 90676 42 59 177 103 54 68 2251 0 0 1 0 1 0 1
116 66 65 248 136 73 71 2801 2 2 5 1 3 2 6
11 4 7 23 13 7 8 27891 385 355 1631 924 396 355 1674431 191 184 806 443 199 185 82711 12 3 26 15 7 4 2684 40 48 172 95 43 51 1899 10 35 54 13 13 36 62
184 95 85 365 181 94 86 361398 163 137 699 410 176 139 72516 7 4 28 15 6 4 26
461 272 295 1029 456 266 298 1019218 113 109 440 209 121 109 440134 72 67 274 144 80 73 297651 219 192 1062 679 252 196 112745 34 35 114 39 34 35 109
119 44 35 198 136 50 38 223169 54 61 284 184 81 69 335162 114 131 407 158 107 131 396284 129 192 605 302 126 194 621475 249 294 1019 516 261 310 1086141 74 62 277 148 69 64 281177 118 217 513 187 113 223 52413 3 3 19 20 7 4 3151 25 17 93 57 23 17 9783 44 84 211 88 44 86 21745 24 21 90 48 23 23 94
186 71 64 321 202 67 67 33621 9 7 37 32 15 11 58
143 84 103 329 144 87 105 33629 11 19 59 28 14 19 61
339 148 184 672 368 150 191 709226 118 179 523 220 117 179 51629 17 27 73 28 18 27 73
229 82 87 399 232 89 88 409202 133 229 563 205 122 229 556
4 2 0 5 7 3 3 121 1 0 2 3 1 0 4
Population and Survey Analysts - October, 2011 Klein I.S.D. - Page 284
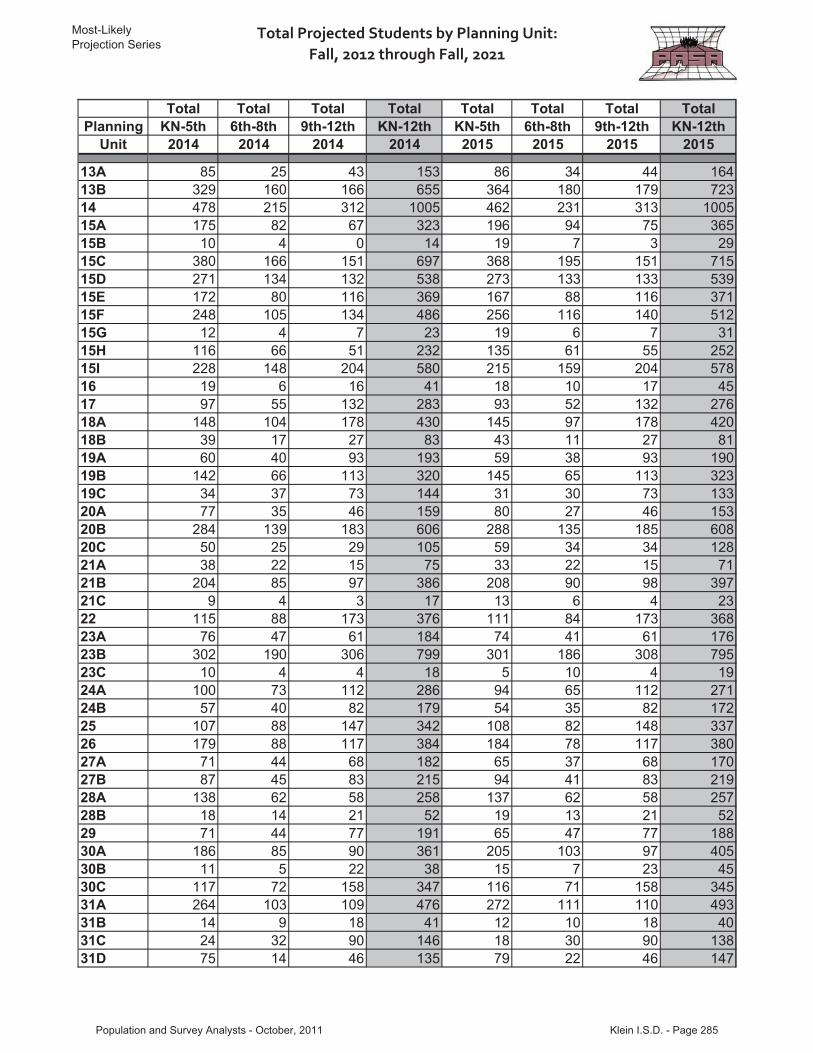
Most-LikelyProjection Series
Total�Projected�Students�by�Planning�Unit:��Fall,�2012�through�Fall,�2021
PlanningUnit
13A13B1415A15B15C15D15E15F15G15H15I161718A18B19A19B19C20A20B20C21A21B21C2223A23B23C24A24B252627A27B28A28B2930A30B30C31A31B31C31D
Total Total Total Total Total Total Total TotalKN-5th 6th-8th 9th-12th KN-12th KN-5th 6th-8th 9th-12th KN-12th2014 2014 2014 2014 2015 2015 2015 2015
85 25 43 153 86 34 44 164329 160 166 655 364 180 179 723478 215 312 1005 462 231 313 1005175 82 67 323 196 94 75 36510 4 0 14 19 7 3 29
380 166 151 697 368 195 151 715271 134 132 538 273 133 133 539172 80 116 369 167 88 116 371248 105 134 486 256 116 140 51212 4 7 23 19 6 7 31
116 66 51 232 135 61 55 252228 148 204 580 215 159 204 57819 6 16 41 18 10 17 4597 55 132 283 93 52 132 276
148 104 178 430 145 97 178 42039 17 27 83 43 11 27 8160 40 93 193 59 38 93 190
142 66 113 320 145 65 113 32334 37 73 144 31 30 73 13377 35 46 159 80 27 46 153
284 139 183 606 288 135 185 60850 25 29 105 59 34 34 12838 22 15 75 33 22 15 71
204 85 97 386 208 90 98 3979 4 3 17 13 6 4 23
115 88 173 376 111 84 173 36876 47 61 184 74 41 61 176
302 190 306 799 301 186 308 79510 4 4 18 5 10 4 19
100 73 112 286 94 65 112 27157 40 82 179 54 35 82 172
107 88 147 342 108 82 148 337179 88 117 384 184 78 117 38071 44 68 182 65 37 68 17087 45 83 215 94 41 83 219
138 62 58 258 137 62 58 25718 14 21 52 19 13 21 5271 44 77 191 65 47 77 188
186 85 90 361 205 103 97 40511 5 22 38 15 7 23 45
117 72 158 347 116 71 158 345264 103 109 476 272 111 110 49314 9 18 41 12 10 18 4024 32 90 146 18 30 90 13875 14 46 135 79 22 46 147
Population and Survey Analysts - October, 2011 Klein I.S.D. - Page 285

Most-LikelyProjection Series
Total�Projected�Students�by�Planning�Unit:��Fall,�2012�through�Fall,�2021
PlanningUnit
31E31F31G32A32B32C32D32E33A33B34A34B34C34D35A35B3637A37B38A38B394041A41B4243A43B43C43D44A44B4546474849505152A52B5354A54B55A
Total Total Total Total Total Total Total TotalKN-5th 6th-8th 9th-12th KN-12th KN-5th 6th-8th 9th-12th KN-12th2014 2014 2014 2014 2015 2015 2015 2015
64 46 88 198 61 50 88 19915 8 27 50 11 10 27 483 4 4 11 3 3 4 10
124 73 119 316 139 62 121 32293 40 124 256 96 44 125 264
114 73 99 286 120 71 101 29290 32 46 168 102 28 46 17570 31 39 140 73 28 39 141
167 74 152 393 183 66 152 40082 32 28 143 97 31 31 15824 18 40 82 20 18 40 7833 26 38 97 35 18 38 9145 25 48 118 47 19 48 11419 13 39 71 17 14 39 70
138 94 116 348 143 92 119 35455 28 35 117 57 25 35 117
145 55 109 309 148 54 109 312153 87 117 357 162 71 117 35065 40 53 158 58 43 53 155
233 126 225 583 220 129 225 57385 37 45 168 95 31 45 172
199 106 187 492 208 105 190 50425 26 47 98 29 24 47 100
240 105 233 578 231 111 234 57628 10 34 72 26 14 35 75
124 57 44 225 123 62 44 229130 60 118 308 135 57 118 31043 33 42 118 40 31 42 1141 0 0 1 2 0 0 20 0 0 0 0 0 0 0
71 55 101 227 58 60 101 2200 0 0 0 0 0 0 0
16 8 7 31 17 7 7 32100 34 25 159 102 37 25 164185 79 68 332 193 89 71 35459 28 21 107 62 28 21 111
150 62 100 312 150 69 100 31970 35 36 141 64 41 36 141
291 117 158 566 299 114 159 572308 163 194 665 316 162 194 672135 49 92 276 141 50 92 283113 47 86 246 106 58 86 25177 41 47 165 79 40 47 16693 54 57 204 96 60 59 215
289 135 242 665 276 149 242 667
Population and Survey Analysts - October, 2011 Klein I.S.D. - Page 286

Most-LikelyProjection Series
Total�Projected�Students�by�Planning�Unit:��Fall,�2012�through�Fall,�2021
PlanningUnit
55B55C55D56A56B57A57B5859606162A62B62C63A63B63C64656667A67B6869
Total:
Total Total Total Total Total Total Total TotalKN-5th 6th-8th 9th-12th KN-12th KN-5th 6th-8th 9th-12th KN-12th2014 2014 2014 2014 2015 2015 2015 2015
101 58 53 212 110 49 53 21240 17 13 69 43 19 14 7621 11 17 49 20 8 17 46
322 180 257 759 311 188 260 760496 181 280 957 494 195 280 969136 64 64 263 130 58 64 25244 27 50 121 46 25 50 12197 73 90 260 101 59 90 249
227 85 75 387 221 95 76 392361 156 178 694 363 147 178 688425 189 242 856 414 202 243 859280 146 193 619 282 126 193 601
4 2 0 6 7 2 0 938 15 22 75 40 14 22 76
202 92 81 374 212 83 81 37695 39 33 167 89 46 33 168
217 93 60 370 227 100 63 390234 108 80 421 243 111 80 433171 95 157 424 155 105 157 417161 80 137 378 149 80 137 366294 146 185 624 304 129 185 618117 86 93 295 113 73 93 279266 118 129 513 278 106 129 512
0 0 0 0 0 0 0 0
22855 11244 14725 48824 23396 11514 14954 49864
Population and Survey Analysts - October, 2011 Klein I.S.D. - Page 287

Most-LikelyProjection Series
Total�Projected�Students�by�Planning�Unit:��Fall,�2012�through�Fall,�2021
PlanningUnit
1A1B1C1D23A3B3C3D3E4A4B4C4D4E4F5A5B5C5D5E5F5G5H5I6A6B6C6D7A7B8A8B9A9B9C9D9E1011A11B11C12A12B12C
Total Total Total Total Total Total Total TotalKN-5th 6th-8th 9th-12th KN-12th KN-5th 6th-8th 9th-12th KN-12th2016 2016 2016 2016 2017 2017 2017 2017
517 306 354 1176 542 314 373 1229369 174 138 681 385 180 149 714
0 5 12 16 0 5 12 16135 76 101 312 157 84 118 360500 225 248 973 532 236 273 1041131 64 77 272 158 74 98 330
0 1 0 1 0 1 0 1157 85 78 319 180 93 95 368
2 3 3 7 4 4 4 1115 8 8 31 17 9 10 35
949 397 345 1691 952 395 348 1696449 213 184 846 458 216 190 86419 8 6 33 23 10 8 41
106 43 54 203 115 46 60 22121 14 38 73 29 17 44 90
172 107 84 362 173 107 84 364427 170 138 735 435 172 145 75215 6 4 25 15 6 4 25
455 279 293 1027 462 280 299 1041202 117 107 426 204 117 108 429150 86 76 312 161 90 85 336683 309 195 1187 697 313 206 121535 32 34 101 35 32 35 102
152 56 40 248 162 59 47 269203 85 76 364 210 88 81 379157 101 128 386 158 101 129 387319 135 192 647 327 137 198 661538 275 318 1131 569 286 341 1196146 71 64 281 152 72 68 292207 104 227 538 222 110 238 56930 13 6 50 40 16 14 7071 21 18 110 80 24 25 12995 43 85 223 99 44 88 23048 30 23 101 50 31 25 106
214 73 67 354 224 77 75 37645 22 17 84 62 30 31 123
150 96 108 354 163 101 118 38129 13 19 61 29 13 19 61
386 172 196 754 409 180 214 804205 121 175 502 206 121 176 50229 12 27 68 29 12 27 68
226 105 86 417 227 106 87 420207 112 226 544 209 112 228 548
9 5 4 18 12 6 6 244 2 0 6 6 2 0 8
Population and Survey Analysts - October, 2011 Klein I.S.D. - Page 288

Most-LikelyProjection Series
Total�Projected�Students�by�Planning�Unit:��Fall,�2012�through�Fall,�2021
PlanningUnit
13A13B1415A15B15C15D15E15F15G15H15I161718A18B19A19B19C20A20B20C21A21B21C2223A23B23C24A24B252627A27B28A28B2930A30B30C31A31B31C31D
Total Total Total Total Total Total Total TotalKN-5th 6th-8th 9th-12th KN-12th KN-5th 6th-8th 9th-12th KN-12th2016 2016 2016 2016 2017 2017 2017 2017
91 41 46 178 97 43 50 190404 183 190 777 431 194 211 836454 240 306 1000 455 239 307 1001214 100 83 397 233 108 97 43827 10 5 42 32 12 9 53
360 207 147 714 363 207 149 718271 136 129 536 271 135 130 536172 79 114 364 172 79 114 364256 133 143 532 267 137 151 55526 10 8 45 38 14 17 69
148 62 59 269 159 66 67 292205 152 200 556 207 151 202 56119 11 17 47 21 12 18 5193 53 130 276 93 53 130 276
139 89 175 404 140 89 176 40544 12 27 82 44 12 27 8362 33 91 186 62 33 92 187
148 65 111 324 150 65 112 32734 22 71 128 34 22 72 12883 29 45 158 83 29 45 158
299 134 183 616 304 134 186 62563 35 36 134 65 36 37 13828 24 16 68 30 25 17 73
210 98 96 405 212 98 97 40816 7 5 28 18 8 7 33
107 81 171 358 108 81 172 36170 41 60 171 70 41 60 172
298 175 304 776 301 175 307 7845 8 4 17 5 8 4 17
85 72 110 267 85 72 111 26748 37 81 166 48 37 81 166
107 71 145 324 108 71 146 325182 85 115 383 183 85 115 38364 40 66 170 64 40 67 170
103 34 82 218 103 34 82 219144 60 57 261 144 60 57 26117 11 20 48 17 11 20 4862 45 75 183 63 45 76 183
215 118 103 436 229 123 114 46618 8 24 50 21 9 26 56
124 60 156 339 124 59 156 340293 108 107 509 294 108 108 50912 10 18 40 13 10 18 4011 31 89 131 12 31 90 13289 27 47 163 93 29 50 172
Population and Survey Analysts - October, 2011 Klein I.S.D. - Page 289
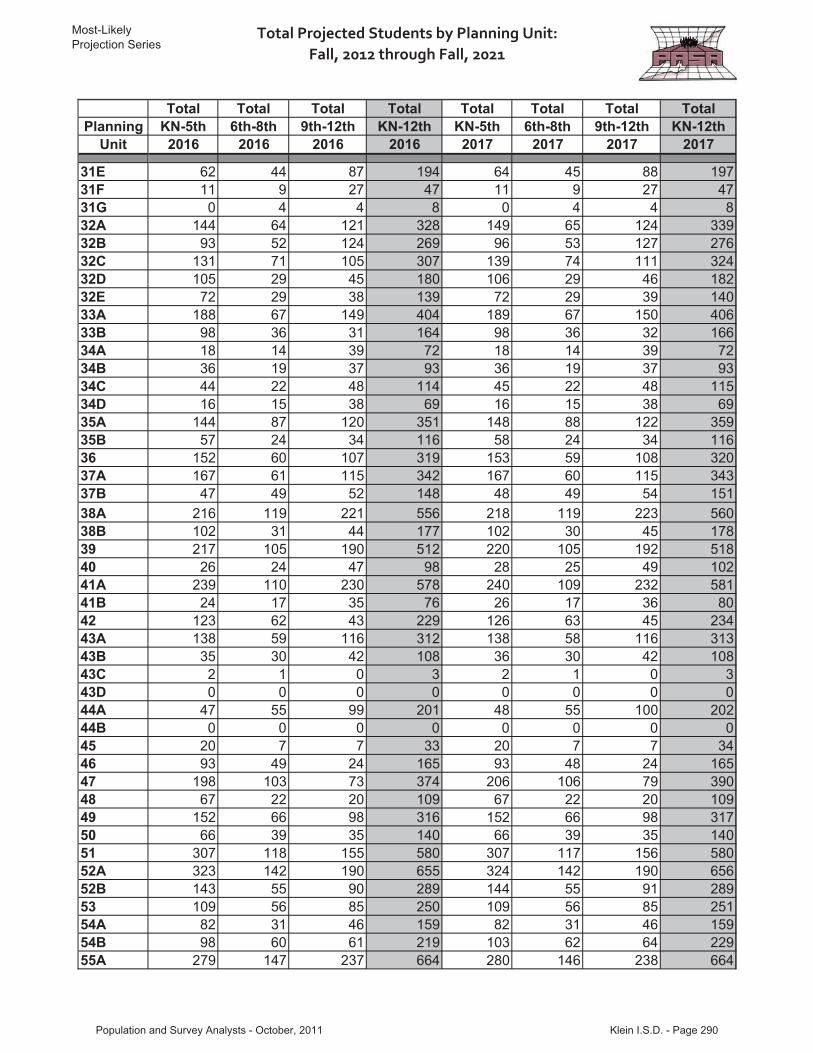
Most-LikelyProjection Series
Total�Projected�Students�by�Planning�Unit:��Fall,�2012�through�Fall,�2021
PlanningUnit
31E31F31G32A32B32C32D32E33A33B34A34B34C34D35A35B3637A37B38A38B394041A41B4243A43B43C43D44A44B4546474849505152A52B5354A54B55A
Total Total Total Total Total Total Total TotalKN-5th 6th-8th 9th-12th KN-12th KN-5th 6th-8th 9th-12th KN-12th2016 2016 2016 2016 2017 2017 2017 2017
62 44 87 194 64 45 88 19711 9 27 47 11 9 27 470 4 4 8 0 4 4 8
144 64 121 328 149 65 124 33993 52 124 269 96 53 127 276
131 71 105 307 139 74 111 324105 29 45 180 106 29 46 18272 29 38 139 72 29 39 140
188 67 149 404 189 67 150 40698 36 31 164 98 36 32 16618 14 39 72 18 14 39 7236 19 37 93 36 19 37 9344 22 48 114 45 22 48 11516 15 38 69 16 15 38 69
144 87 120 351 148 88 122 35957 24 34 116 58 24 34 116
152 60 107 319 153 59 108 320167 61 115 342 167 60 115 34347 49 52 148 48 49 54 151
216 119 221 556 218 119 223 560102 31 44 177 102 30 45 178217 105 190 512 220 105 192 51826 24 47 98 28 25 49 102
239 110 230 578 240 109 232 58124 17 35 76 26 17 36 80
123 62 43 229 126 63 45 234138 59 116 312 138 58 116 31335 30 42 108 36 30 42 1082 1 0 3 2 1 0 30 0 0 0 0 0 0 0
47 55 99 201 48 55 100 2020 0 0 0 0 0 0 0
20 7 7 33 20 7 7 3493 49 24 165 93 48 24 165
198 103 73 374 206 106 79 39067 22 20 109 67 22 20 109
152 66 98 316 152 66 98 31766 39 35 140 66 39 35 140
307 118 155 580 307 117 156 580323 142 190 655 324 142 190 656143 55 90 289 144 55 91 289109 56 85 250 109 56 85 25182 31 46 159 82 31 46 15998 60 61 219 103 62 64 229
279 147 237 664 280 146 238 664
Population and Survey Analysts - October, 2011 Klein I.S.D. - Page 290

Most-LikelyProjection Series
Total�Projected�Students�by�Planning�Unit:��Fall,�2012�through�Fall,�2021
PlanningUnit
55B55C55D56A56B57A57B5859606162A62B62C63A63B63C64656667A67B6869
Total:
Total Total Total Total Total Total Total TotalKN-5th 6th-8th 9th-12th KN-12th KN-5th 6th-8th 9th-12th KN-12th2016 2016 2016 2016 2017 2017 2017 2017
116 50 54 220 119 51 56 22645 22 15 82 47 23 17 8818 12 17 46 18 12 17 46
329 166 258 753 339 169 266 773508 196 274 977 509 195 275 979130 62 62 254 130 62 62 25443 24 49 116 43 24 49 11697 58 88 243 99 58 89 246
215 108 73 396 216 108 74 398354 162 174 689 355 161 175 691414 208 237 859 414 207 238 859284 121 189 595 285 121 190 595
9 3 0 12 10 3 0 1441 13 22 76 41 13 22 76
218 91 78 386 219 90 79 38983 47 31 161 83 46 32 161
240 92 64 396 245 94 68 408254 106 78 438 256 106 79 442156 100 154 411 157 100 155 412141 88 134 364 142 88 135 364301 130 181 612 302 129 182 613117 62 91 270 118 62 91 271289 93 126 508 290 93 126 509
0 0 0 0 0 0 0 0
23995 11769 14901 50665 24636 11948 15390 51973
Population and Survey Analysts - October, 2011 Klein I.S.D. - Page 291
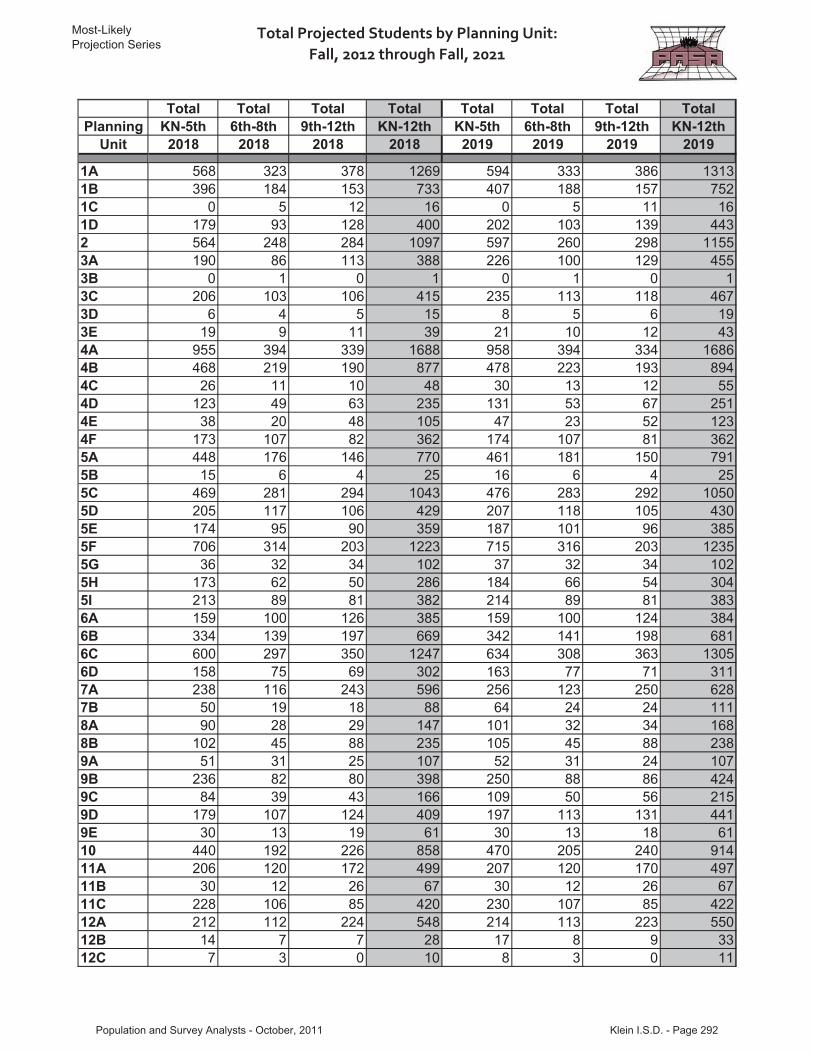
Most-LikelyProjection Series
Total�Projected�Students�by�Planning�Unit:��Fall,�2012�through�Fall,�2021
PlanningUnit
1A1B1C1D23A3B3C3D3E4A4B4C4D4E4F5A5B5C5D5E5F5G5H5I6A6B6C6D7A7B8A8B9A9B9C9D9E1011A11B11C12A12B12C
Total Total Total Total Total Total Total TotalKN-5th 6th-8th 9th-12th KN-12th KN-5th 6th-8th 9th-12th KN-12th2018 2018 2018 2018 2019 2019 2019 2019
568 323 378 1269 594 333 386 1313396 184 153 733 407 188 157 752
0 5 12 16 0 5 11 16179 93 128 400 202 103 139 443564 248 284 1097 597 260 298 1155190 86 113 388 226 100 129 455
0 1 0 1 0 1 0 1206 103 106 415 235 113 118 467
6 4 5 15 8 5 6 1919 9 11 39 21 10 12 43
955 394 339 1688 958 394 334 1686468 219 190 877 478 223 193 89426 11 10 48 30 13 12 55
123 49 63 235 131 53 67 25138 20 48 105 47 23 52 123
173 107 82 362 174 107 81 362448 176 146 770 461 181 150 79115 6 4 25 16 6 4 25
469 281 294 1043 476 283 292 1050205 117 106 429 207 118 105 430174 95 90 359 187 101 96 385706 314 203 1223 715 316 203 123536 32 34 102 37 32 34 102
173 62 50 286 184 66 54 304213 89 81 382 214 89 81 383159 100 126 385 159 100 124 384334 139 197 669 342 141 198 681600 297 350 1247 634 308 363 1305158 75 69 302 163 77 71 311238 116 243 596 256 123 250 62850 19 18 88 64 24 24 11190 28 29 147 101 32 34 168
102 45 88 235 105 45 88 23851 31 25 107 52 31 24 107
236 82 80 398 250 88 86 42484 39 43 166 109 50 56 215
179 107 124 409 197 113 131 44130 13 19 61 30 13 18 61
440 192 226 858 470 205 240 914206 120 172 499 207 120 170 49730 12 26 67 30 12 26 67
228 106 85 420 230 107 85 422212 112 224 548 214 113 223 55014 7 7 28 17 8 9 337 3 0 10 8 3 0 11
Population and Survey Analysts - October, 2011 Klein I.S.D. - Page 292

Most-LikelyProjection Series
Total�Projected�Students�by�Planning�Unit:��Fall,�2012�through�Fall,�2021
PlanningUnit
13A13B1415A15B15C15D15E15F15G15H15I161718A18B19A19B19C20A20B20C21A21B21C2223A23B23C24A24B252627A27B28A28B2930A30B30C31A31B31C31D
Total Total Total Total Total Total Total TotalKN-5th 6th-8th 9th-12th KN-12th KN-5th 6th-8th 9th-12th KN-12th2018 2018 2018 2018 2019 2019 2019 2019
103 46 52 201 109 48 55 213458 206 222 886 482 216 233 931456 238 300 995 457 238 297 992252 116 105 473 266 121 112 49943 16 14 73 53 19 18 90
367 207 146 720 375 210 147 731272 135 126 533 272 135 125 532172 78 112 362 172 78 110 361276 141 154 570 284 143 156 58360 23 28 111 90 35 43 167
170 71 72 312 177 73 75 325209 151 198 558 212 151 196 55822 12 18 53 24 13 19 5594 53 128 274 94 53 127 273
141 89 173 403 142 89 171 40244 12 26 82 44 12 26 8263 33 90 185 63 33 89 185
151 65 111 327 152 65 110 32735 22 70 127 35 22 70 12783 29 44 157 84 29 44 157
307 135 184 626 310 135 183 62867 36 38 141 70 37 38 14532 26 18 76 34 26 18 78
213 99 96 408 215 99 95 40919 8 7 34 19 8 7 34
109 81 169 359 110 81 168 35971 41 59 171 71 41 58 170
305 176 303 784 308 177 302 7876 8 4 17 6 8 4 17
85 71 108 265 85 71 107 26448 37 80 165 48 37 79 164
108 71 143 323 109 71 142 322183 85 113 381 184 85 112 38064 40 65 169 64 40 64 168
103 34 80 217 103 34 80 216144 60 56 260 144 60 55 25917 11 20 47 17 11 20 4763 45 74 182 63 45 74 181
244 128 119 491 260 134 126 51924 10 27 61 28 11 28 67
125 59 154 338 126 59 153 337294 107 105 507 295 107 104 50613 10 17 40 13 10 17 4012 31 89 131 13 31 88 13198 31 52 180 103 33 54 190
Population and Survey Analysts - October, 2011 Klein I.S.D. - Page 293
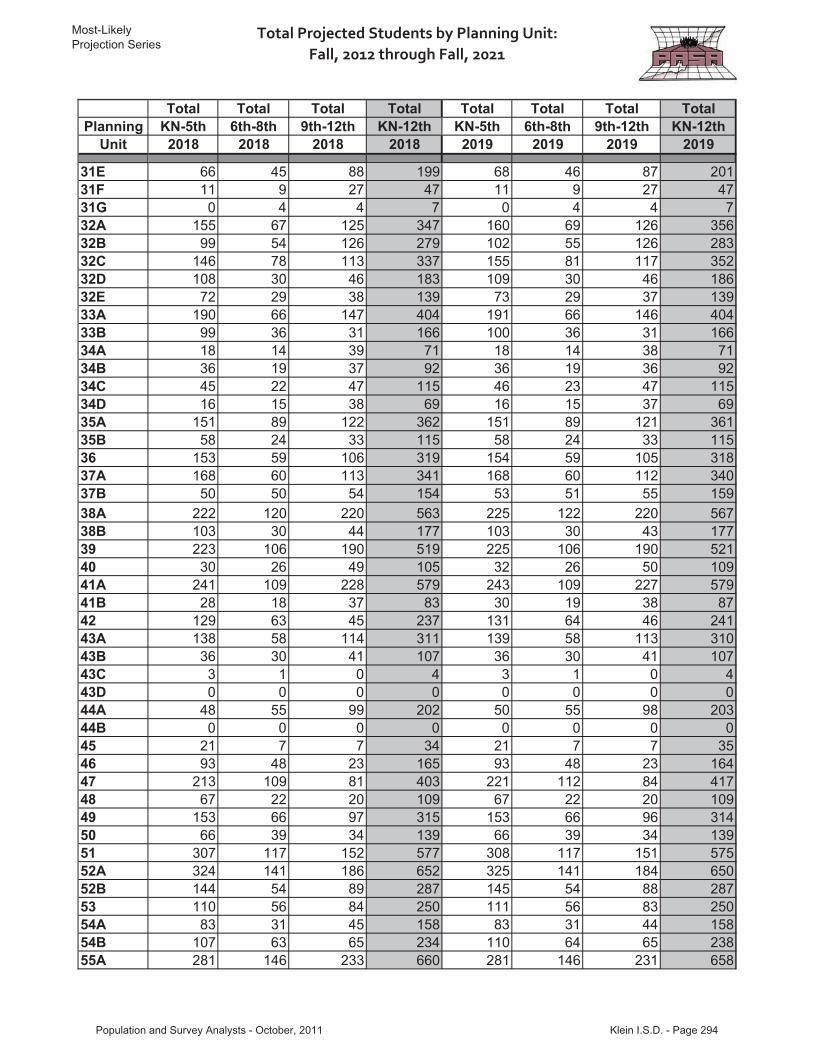
Most-LikelyProjection Series
Total�Projected�Students�by�Planning�Unit:��Fall,�2012�through�Fall,�2021
PlanningUnit
31E31F31G32A32B32C32D32E33A33B34A34B34C34D35A35B3637A37B38A38B394041A41B4243A43B43C43D44A44B4546474849505152A52B5354A54B55A
Total Total Total Total Total Total Total TotalKN-5th 6th-8th 9th-12th KN-12th KN-5th 6th-8th 9th-12th KN-12th2018 2018 2018 2018 2019 2019 2019 2019
66 45 88 199 68 46 87 20111 9 27 47 11 9 27 470 4 4 7 0 4 4 7
155 67 125 347 160 69 126 35699 54 126 279 102 55 126 283
146 78 113 337 155 81 117 352108 30 46 183 109 30 46 18672 29 38 139 73 29 37 139
190 66 147 404 191 66 146 40499 36 31 166 100 36 31 16618 14 39 71 18 14 38 7136 19 37 92 36 19 36 9245 22 47 115 46 23 47 11516 15 38 69 16 15 37 69
151 89 122 362 151 89 121 36158 24 33 115 58 24 33 115
153 59 106 319 154 59 105 318168 60 113 341 168 60 112 34050 50 54 154 53 51 55 159
222 120 220 563 225 122 220 567103 30 44 177 103 30 43 177223 106 190 519 225 106 190 52130 26 49 105 32 26 50 109
241 109 228 579 243 109 227 57928 18 37 83 30 19 38 87
129 63 45 237 131 64 46 241138 58 114 311 139 58 113 31036 30 41 107 36 30 41 1073 1 0 4 3 1 0 40 0 0 0 0 0 0 0
48 55 99 202 50 55 98 2030 0 0 0 0 0 0 0
21 7 7 34 21 7 7 3593 48 23 165 93 48 23 164
213 109 81 403 221 112 84 41767 22 20 109 67 22 20 109
153 66 97 315 153 66 96 31466 39 34 139 66 39 34 139
307 117 152 577 308 117 151 575324 141 186 652 325 141 184 650144 54 89 287 145 54 88 287110 56 84 250 111 56 83 25083 31 45 158 83 31 44 158
107 63 65 234 110 64 65 238281 146 233 660 281 146 231 658
Population and Survey Analysts - October, 2011 Klein I.S.D. - Page 294

Most-LikelyProjection Series
Total�Projected�Students�by�Planning�Unit:��Fall,�2012�through�Fall,�2021
PlanningUnit
55B55C55D56A56B57A57B5859606162A62B62C63A63B63C64656667A67B6869
Total:
Total Total Total Total Total Total Total TotalKN-5th 6th-8th 9th-12th KN-12th KN-5th 6th-8th 9th-12th KN-12th2018 2018 2018 2018 2019 2019 2019 2019
123 52 56 232 128 54 57 23950 24 19 93 53 25 20 9818 12 17 46 18 12 16 46
348 172 266 787 359 177 269 806510 194 269 972 510 194 265 970130 62 61 252 130 62 60 25143 24 48 115 43 24 48 115
100 58 87 246 102 58 86 247217 108 72 396 218 108 71 396356 161 170 687 357 161 168 686415 207 232 853 415 207 229 851285 120 186 591 286 120 184 59012 3 0 15 13 3 0 1641 13 22 76 41 13 22 76
220 90 77 387 222 90 76 38883 46 31 160 84 46 30 160
252 97 70 418 258 99 72 429258 106 77 441 260 106 76 442158 99 152 409 158 99 150 408142 88 132 362 142 88 131 360302 129 178 609 302 129 176 608118 62 89 269 119 62 88 268290 92 123 506 290 92 121 504
0 0 0 0 0 0 0 0
25310 12156 15396 52861 26003 12400 15550 53952
Population and Survey Analysts - October, 2011 Klein I.S.D. - Page 295

Most-LikelyProjection Series
Total�Projected�Students�by�Planning�Unit:��Fall,�2012�through�Fall,�2021
PlanningUnit
1A1B1C1D23A3B3C3D3E4A4B4C4D4E4F5A5B5C5D5E5F5G5H5I6A6B6C6D7A7B8A8B9A9B9C9D9E1011A11B11C12A12B12C
Total Total Total Total Total Total Total TotalKN-5th 6th-8th 9th-12th KN-12th KN-5th 6th-8th 9th-12th KN-12th2020 2020 2020 2020 2021 2021 2021 2021
616 342 393 1351 644 355 403 1402419 193 161 773 432 199 167 798
0 5 11 16 0 5 11 16218 110 146 475 233 117 153 503628 274 310 1211 663 289 324 1277266 117 148 530 305 134 165 604
0 1 0 1 0 1 0 1265 126 131 522 296 140 144 58011 6 7 24 14 8 9 3123 11 12 47 26 12 13 51
962 395 329 1686 966 396 327 1689491 228 197 916 504 234 202 94034 15 14 64 39 17 17 73
141 57 71 269 151 62 75 28858 28 57 142 69 33 61 163
175 107 80 362 176 107 80 363476 188 155 819 495 196 162 85216 6 3 25 16 6 3 25
483 285 291 1059 491 288 291 1071208 118 104 430 209 119 103 431203 108 103 414 218 115 111 444725 320 203 1249 736 325 205 126638 32 33 103 39 32 33 104
197 71 58 326 212 77 63 352215 89 80 384 215 89 80 385160 100 123 383 161 101 122 384350 145 199 694 359 148 202 709670 324 376 1370 709 341 392 1442170 79 73 322 176 82 76 335277 132 259 668 302 144 271 71780 31 30 141 102 40 40 183
113 38 40 191 128 44 46 217108 47 89 244 113 49 90 25252 32 24 108 53 32 24 109
265 95 94 454 282 103 102 487140 64 72 277 177 81 91 350217 122 140 479 242 133 151 52630 13 18 61 30 13 18 62
501 219 253 973 535 234 269 1038207 120 168 496 207 121 168 49630 12 26 67 30 12 26 67
236 109 87 432 242 112 90 443216 113 221 550 217 113 220 55120 9 10 39 23 11 12 4510 4 1 14 12 4 1 18
Population and Survey Analysts - October, 2011 Klein I.S.D. - Page 296

Most-LikelyProjection Series
Total�Projected�Students�by�Planning�Unit:��Fall,�2012�through�Fall,�2021
PlanningUnit
13A13B1415A15B15C15D15E15F15G15H15I161718A18B19A19B19C20A20B20C21A21B21C2223A23B23C24A24B252627A27B28A28B2930A30B30C31A31B31C31D
Total Total Total Total Total Total Total TotalKN-5th 6th-8th 9th-12th KN-12th KN-5th 6th-8th 9th-12th KN-12th2020 2020 2020 2020 2021 2021 2021 2021
117 52 59 227 124 55 63 242499 223 240 962 510 228 244 983458 239 293 990 459 239 292 990277 126 116 519 288 131 121 53962 23 22 107 73 28 26 127
384 214 149 746 397 219 153 769272 135 123 531 273 135 122 531172 78 109 360 172 78 109 360289 145 157 591 294 147 158 599131 54 64 249 177 75 86 338181 75 76 333 186 77 78 341214 152 194 560 218 153 193 56325 13 19 57 26 14 19 5994 53 126 272 94 53 125 272
143 89 170 402 145 89 169 40344 12 25 81 44 12 25 8163 33 89 185 64 33 89 185
152 66 109 326 152 66 108 32635 22 69 126 35 22 69 12784 29 43 156 84 29 43 156
312 136 181 628 314 137 180 63073 38 39 150 76 40 40 15636 27 19 81 37 27 19 82
216 100 95 411 218 101 95 41420 8 7 35 21 8 7 36
112 82 167 360 113 82 167 36271 41 58 170 71 41 58 170
310 178 300 788 312 178 300 7906 8 4 17 6 8 4 17
86 71 106 263 86 71 106 26348 37 79 164 48 37 78 164
109 71 141 321 110 71 141 322184 85 111 380 185 85 110 38064 40 64 168 64 40 64 168
103 34 79 216 103 34 79 216144 60 54 258 145 60 54 25817 11 20 47 17 11 19 4763 45 73 181 63 45 73 181
277 141 132 550 295 149 140 58433 13 29 74 38 15 31 83
126 59 151 337 127 59 151 337295 107 103 506 296 108 103 50613 10 17 41 14 10 17 4114 31 87 132 15 31 87 133
108 35 56 199 113 38 59 210
Population and Survey Analysts - October, 2011 Klein I.S.D. - Page 297
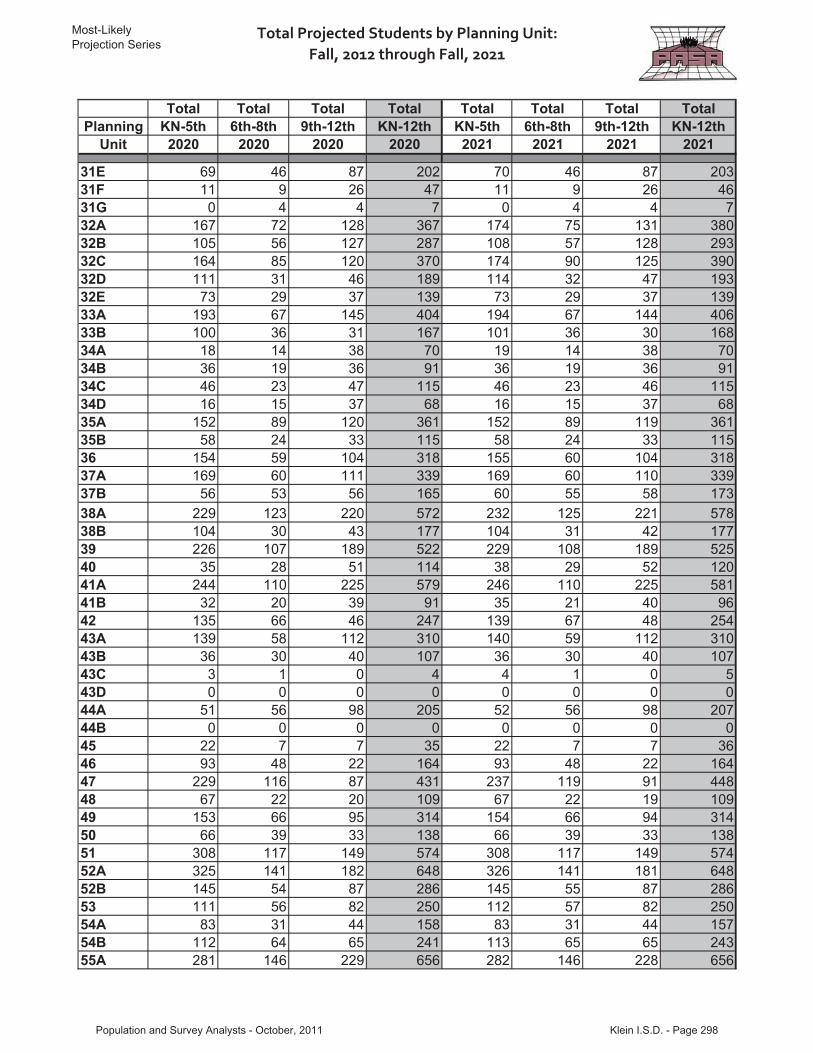
Most-LikelyProjection Series
Total�Projected�Students�by�Planning�Unit:��Fall,�2012�through�Fall,�2021
PlanningUnit
31E31F31G32A32B32C32D32E33A33B34A34B34C34D35A35B3637A37B38A38B394041A41B4243A43B43C43D44A44B4546474849505152A52B5354A54B55A
Total Total Total Total Total Total Total TotalKN-5th 6th-8th 9th-12th KN-12th KN-5th 6th-8th 9th-12th KN-12th2020 2020 2020 2020 2021 2021 2021 2021
69 46 87 202 70 46 87 20311 9 26 47 11 9 26 460 4 4 7 0 4 4 7
167 72 128 367 174 75 131 380105 56 127 287 108 57 128 293164 85 120 370 174 90 125 390111 31 46 189 114 32 47 19373 29 37 139 73 29 37 139
193 67 145 404 194 67 144 406100 36 31 167 101 36 30 16818 14 38 70 19 14 38 7036 19 36 91 36 19 36 9146 23 47 115 46 23 46 11516 15 37 68 16 15 37 68
152 89 120 361 152 89 119 36158 24 33 115 58 24 33 115
154 59 104 318 155 60 104 318169 60 111 339 169 60 110 33956 53 56 165 60 55 58 173
229 123 220 572 232 125 221 578104 30 43 177 104 31 42 177226 107 189 522 229 108 189 52535 28 51 114 38 29 52 120
244 110 225 579 246 110 225 58132 20 39 91 35 21 40 96
135 66 46 247 139 67 48 254139 58 112 310 140 59 112 31036 30 40 107 36 30 40 1073 1 0 4 4 1 0 50 0 0 0 0 0 0 0
51 56 98 205 52 56 98 2070 0 0 0 0 0 0 0
22 7 7 35 22 7 7 3693 48 22 164 93 48 22 164
229 116 87 431 237 119 91 44867 22 20 109 67 22 19 109
153 66 95 314 154 66 94 31466 39 33 138 66 39 33 138
308 117 149 574 308 117 149 574325 141 182 648 326 141 181 648145 54 87 286 145 55 87 286111 56 82 250 112 57 82 25083 31 44 158 83 31 44 157
112 64 65 241 113 65 65 243281 146 229 656 282 146 228 656
Population and Survey Analysts - October, 2011 Klein I.S.D. - Page 298
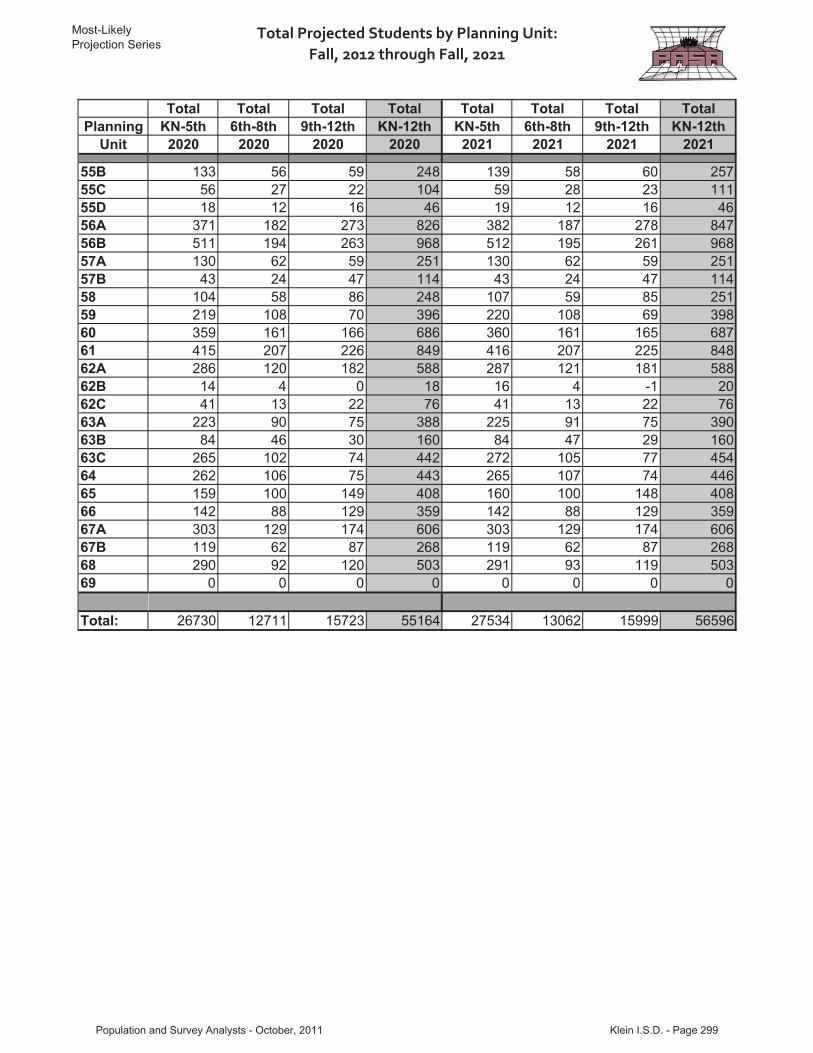
Most-LikelyProjection Series
Total�Projected�Students�by�Planning�Unit:��Fall,�2012�through�Fall,�2021
PlanningUnit
55B55C55D56A56B57A57B5859606162A62B62C63A63B63C64656667A67B6869
Total:
Total Total Total Total Total Total Total TotalKN-5th 6th-8th 9th-12th KN-12th KN-5th 6th-8th 9th-12th KN-12th2020 2020 2020 2020 2021 2021 2021 2021
133 56 59 248 139 58 60 25756 27 22 104 59 28 23 11118 12 16 46 19 12 16 46
371 182 273 826 382 187 278 847511 194 263 968 512 195 261 968130 62 59 251 130 62 59 25143 24 47 114 43 24 47 114
104 58 86 248 107 59 85 251219 108 70 396 220 108 69 398359 161 166 686 360 161 165 687415 207 226 849 416 207 225 848286 120 182 588 287 121 181 58814 4 0 18 16 4 -1 2041 13 22 76 41 13 22 76
223 90 75 388 225 91 75 39084 46 30 160 84 47 29 160
265 102 74 442 272 105 77 454262 106 75 443 265 107 74 446159 100 149 408 160 100 148 408142 88 129 359 142 88 129 359303 129 174 606 303 129 174 606119 62 87 268 119 62 87 268290 92 120 503 291 93 119 503
0 0 0 0 0 0 0 0
26730 12711 15723 55164 27534 13062 15999 56596
Population and Survey Analysts - October, 2011 Klein I.S.D. - Page 299