student performance accountability florida … at or above proficient on the state test and the...
TRANSCRIPT

AYP and Florida Grades for Connections Academy Programs in Florida
Program Florida School Grade
AYP Rating
2015-16 Florida Virtual School Full Time K-8 Program
C N/A
District Virtual Instruction Program A N/A 2014-15 Florida Virtual School Full Time K-8
Program B N/A
District Virtual Instruction Program A N/A 2013-14 Florida Virtual School Full Time K-8
Program B N/A
District Virtual Instruction Program A N/A 2012-13 Florida Virtual School Full Time K-8
Program C N/A*
District Virtual Instruction Program A N/A* 2011-12 Florida Virtual School Full Time K-8
Program C* N/A*
District Virtual Instruction Program B N/A* 2010-11 K-8 Continuation Program B No
District Virtual Instruction Program A Not Rated 2009-10 K-8 Continuation Program A Yes
District Virtual Instruction Program A Not Rated 2008-09 Florida Connections Academy A No 2007-08 Florida Connections Academy A No 2006-07 Florida Connections Academy A No 2005-06 Florida Connections Academy B No 2004-05 Florida Connections Academy B Yes 2003-04 Florida Connections Academy C Not Rated
*AYP discontinued in Florida for school accountability in 2011-12

NOTE: Connections Academy’s Florida programs had significant growth (over 180%) in both new student enrollment and overall enrollments, from 2010-11 to 2011-12. The extremely high percentage of students new to Florida Connections Academy programs during that year affected both the percentage of students scoring at or above proficient on the state test and the school grade.

State Test Proficiency Data
Connections Academy Programs in Florida
Results below are based on all Florida Connections Academy programs operating within Florida during a given year including Florida Connections Academy, the K-8 Continuation Program for Florida Connections Academy, the Florida Virtual School Full Time K-8 Program, and District Virtual Instruction Programs.
Values in the tables below are based on all available student test results from a given year; the percent proficient is the percentage of tested students scoring at Levels 3, 4, or 5 on the FCAT or FCAT 2.0 for Math, Reading, or Science, and for Writing, the percentage of students scoring a 3.0 or higher on the FCAT for Writing.
Results from 2003-04 through 2008-09 are as reported on the Florida Department of Education website. Beginning in 2009-10, Connections results include a number of students in programs that are either not reported in public FCAT results or are suppressed due to small numbers of students within a program at particular grades; results from 2009-10 through 2015-16 are based on Connections ‘ records of student FCAT results.
In 2011-12, Florida implemented fully the change from the FCAT based on the Sunshine State Standards to the FCAT 2.0 based on the more rigorous Next Generation Sunshine State Standards for Math, Reading, and Science.
NOTE: Connections Academy’s Florida programs had significant growth (over 180%) in both new student enrollment and overall enrollments, from 2010-11 to 2011-12. The extremely high percentage of students new to Florida Connections Academy programs during that year affected both the percentage of students scoring at or above proficient on the state test and the school grade.

Math State Test Proficiency
2015-16 2014-15 2013-14 2012-13 2011-12 2010-11 2009-10 2008-09 2007-08 2006-07 2005-06 3rd Grade Students Tested 382 275 282 289 138 109 117 48 81 70 45
3rd Grade % Proficient 41% 42% 38% 32% 44% 72% 68% 56% 81% 66% 69%
4th Grade Students Tested 349 281 273 308 150 85 79 31 78 60 31
4th Grade % Proficient 43% 46% 42% 47% 39% 71% 70% 71% 74% 65% 65%
5th Grade Students Tested 445 318 340 352 168 97 79 39 74 37 46
5th Grade % Proficient 36% 44% 39% 41% 49% 61% 61% 46% 62% 57% 52%
6th Grade Students Tested 587 355 369 356 246 65 64 40 84 72 44
6th Grade % Proficient 49% 61% 54% 63% 54% 58% 52% 65% 68% 64% 39%
7th Grade Students Tested 611 361 371 390 285 70 62 50 89 55 52
7th Grade % Proficient 62% 72% 68% 60% 53% 76% 73% 86% 82% 55% 54%
8th Grade Students Tested 607 444 332 403 237 53 63 55 55 58 30
8th Grade % Proficient 51% 72% 51% 58% 42% 64% 78% 89% 78% 72% 53%
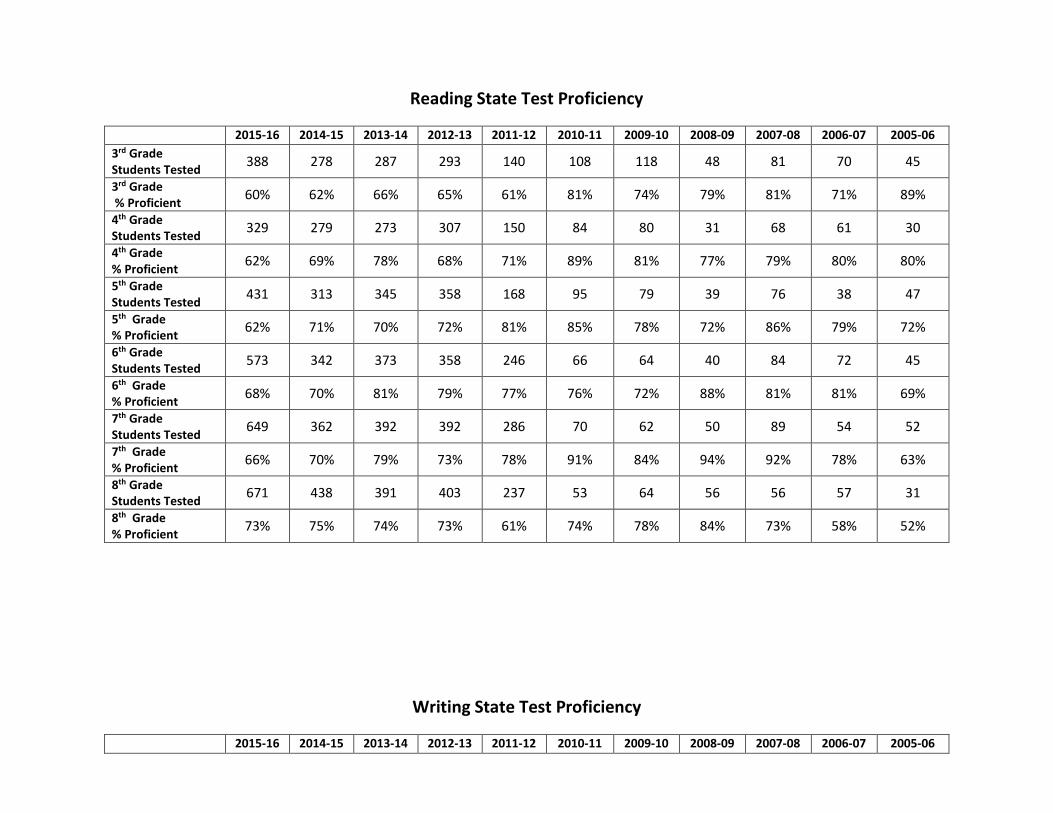
Reading State Test Proficiency
2015-16 2014-15 2013-14 2012-13 2011-12 2010-11 2009-10 2008-09 2007-08 2006-07 2005-06 3rd Grade Students Tested 388 278 287 293 140 108 118 48 81 70 45
3rd Grade % Proficient 60% 62% 66% 65% 61% 81% 74% 79% 81% 71% 89%
4th Grade Students Tested 329 279 273 307 150 84 80 31 68 61 30
4th Grade % Proficient 62% 69% 78% 68% 71% 89% 81% 77% 79% 80% 80%
5th Grade Students Tested 431 313 345 358 168 95 79 39 76 38 47
5th Grade % Proficient 62% 71% 70% 72% 81% 85% 78% 72% 86% 79% 72%
6th Grade Students Tested 573 342 373 358 246 66 64 40 84 72 45
6th Grade % Proficient 68% 70% 81% 79% 77% 76% 72% 88% 81% 81% 69%
7th Grade Students Tested 649 362 392 392 286 70 62 50 89 54 52
7th Grade % Proficient 66% 70% 79% 73% 78% 91% 84% 94% 92% 78% 63%
8th Grade Students Tested 671 438 391 403 237 53 64 56 56 57 31
8th Grade % Proficient 73% 75% 74% 73% 61% 74% 78% 84% 73% 58% 52%
Writing State Test Proficiency
2015-16 2014-15 2013-14 2012-13 2011-12 2010-11 2009-10 2008-09 2007-08 2006-07 2005-06

4th Grade Students Tested NA NA 284 332 153 99 84 33 70 56 24
4th Grade % Proficient NA NA 36% 64% 57% 90% 69% 75% 46% 79% 63%
8th Grade Students Tested NA NA 418 428 247 50 64 56 53 50 27
8th Grade % Proficient NA NA 36% 68% 62% 100% 94% 96% 47% 36% 96%
Science State Test Proficiency
2015-16 2014-15 2013-14 2012-13 2011-12 2010-11 2009-10 2008-09 2007-08 2006-07 2005-06 5th Grade Students Tested 439 315 342 351 166 95 76 38 71 34 40
5th Grade % Proficient 56% 61% 57% 53% 62% 69% 63% 47% 59% 56% 53%
8th Grade Students Tested 594 441 383 401 235 53 61 49 50 56 29
8th Grade % Proficient 57% 69% 66% 58% 51% 62% 75% 71% 60% 50% 28%
Algebra 1 End of Course Test
2015-16 2014-15 2013-14 2012-13 2011-12 2010-11 2009-10 2008-09 2007-08 2006-07 2005-06 Students Tested 129 83 84 95 NA NA NA NA NA NA NA % Proficient 79% 88% 96% 97% NA NA NA NA NA NA NA
Geometry End of Course Test
2015-16 2014-15 2013-14 2012-13 2011-12 2010-11 2009-10 2008-09 2007-08 2006-07 2005-06 Students Tested 50 44 30 19 NA NA NA NA NA NA NA % Proficient 90% 58% 93% 95% NA NA NA NA NA NA NA
Civics End of Course Test*
2015-16 2014-15 Students Tested 653 391 % Proficient 76% 78%

*Florida DOE did not release passing standards for 2013-14. FLVSFT K-8 tested 364 students that year.
Florida Connections Subgroup Performance 2004-05 through 2014-15
Results below are based on all Connections Academy programs operating within Florida during a given year including Florida Connections Academy, the K-8 Continuation Program for Florida Connections Academy, the Florida Virtual School Full Time K-8 Program, and District Virtual Instruction Programs.
Values in the tables below are based on all available student test results from a given year; the % Proficient is the percentage of tested students scoring at Levels3, 4, or 5 on the FCAT or FCAT 2.0 for Math, Reading, or Science, and for Writing, the % of students scoring a 3.0 or higher on the FCAT for Writing. In order tomaximize the number of students contained within a group, results are presented collapsed across Grades 3-8 for a given year
Although results from 2004-05 through 2008-09 are available for Florida Connections Academy on the Florida Department of Education website, results aredisaggregated by grade, which results in suppressed scores for a number of subgroups. As our approach is to present as complete a picture as possible of subgroup performance by aggregating across grades, we have used data on subgroup results for Florida Connections Academy from Connections Education’srecords of student FCAT results and demographic identifiers, in cases where an overall results across grades cannot be calculated. In a similar manner, studentstatus as new or returning from a previous year comes from Connections Education’s records of student FCAT results. The exception is for Free and ReducedMeal eligibility for 2004-05 and 2005-06 as Connections Education does not have accurate data on student eligibility for those years. Note that results for groupsthat consist of fewer than 10 students are suppressed in these reports.
Results from 2009-10 through 2015-16 include a number of students in programs that are either not reported in public FCAT results or are suppressed due tosmall numbers of students within a program at particular grades; results below are based on Connections Education’s records of student FCAT results anddemographic identifiers.
In 2011-12, Florida implemented fully the change from the FCAT based on the Sunshine State Standards to the FCAT 2.0 based on the more rigorous Next Generation Sunshine State Standards for Math, Reading, and Science. In addition, Connections Academy’s Florida programs had significant growth (over 180%)in both new student enrollment and overall enrollments, from 2010-11 to 2011-12. The extremely high percentage of students new to Florida ConnectionsAcademy programs during that year affected both the percentage of students scoring at or above proficient on the state test and the school grade.
.

FCAT Math
Group 2015-16 N
2015-16 % at Levels 3, 4, or
5
2014-15 N
2014-15 % at Levels 3, 4, or
5
2013-14 N
2013-14 % at Levels 3, 4, or
5
2012-13 N
2012-13 % at Levels 3, 4, or
5
2011-12 N
2011-12 % at Levels 3, 4, or
5
2010-11 N
2010-11 % at Levels 3, 4, or
5
2009-10 N
2009-10 % at Levels 3, 4, or 5
2008-09 N
2008-09 % at Levels 3, 4, or 5
2007-08 N
2007-08 % at Levels 3, 4, or 5
2006-07 N
2006-07 % at Levels 3, 4, or 5
All Students 3133 50.3% 2037 58.9% 1955 49.8% 2098 51.0% 1322 48.9% 479 67.4% 436 71.1% 263 70.3% 461 74.2% 352 63.7% Students Eligible for Free and Reduced Meals
1380 39.9% 876 50.9% 884 40.8% 981 39.9% 552 39.1% 181 56.9% 182 62.6% 115 67.8% 183 67.7% 172 54.7%
IEP Students 187 33.7% 119 42.9% 92 35.9% 129 31.0% 95 24.2% 34 47.1% 30 46.7% 7 NA 17 70.6% 24 50.0% English Language Learner Students 40 32.5% 22 18.2% 17 29.4% 18 16.7% 4 NA 2 NA 2 NA 2 NA 0 NA 0 NA
White/ Caucasian Students 1883 53.0% 1228 60.5% 1248 49.8% 1403 53.7% 860 52.0% 342 68.7% 300 74.7% 170 70.6% 318 75.6% 241 69.7%
African American Students 301 33.9% 181 49.2% 202 42.6% 173 35.3% 119 26.9% 35 42.9% 32 50.0% 21 42.9% 36 63.9% 30 43.3%
Hispanic Students 679 47.1% 406 53.7% 335 48.4% 370 47.0% 267 42.3% 79 67.1% 78 66.7% 41 78.0% 50 76.0% 42 61.9% Asian Students 87 72.4% 44 68.2% 53 79.2% 48 68.8% 21 85.7% 4 NA 10 80.0% 7 NA 12 58.3% 7 NA American Indian/ Alaskan Native Students
9 NA 11 45.5% 17 52.9% 10 60.0% 7 NA 0 NA 0 NA 0 NA 2 NA 4 NA
Native Hawaiian or other Pacific Islander Students^
8 NA 5 NA 1 NA 1 NA 3 NA 3 NA 0 NA NA NA NA NA NA NA
Students of Multiple Races/ Multiracial
166 50.0% 114 59.6% 99 49.5% 93 44.1% 45 55.6% 15 80.0% 16 62.5% 24 75.0% 40 80.0% 28 46.4%
Students Returning to Florida Connections from the Previous Year
1043 52.6% 975 61.9% 934 54.0% 562 58.5% 309 55.4% 224 72.8% 171 77.8% 262 70.6% 158 74.1% 124 70.2%
Students New to Florida Connections from the Previous Year
1909 46.0% 1062 56.1% 1021 45.7% 1536 48.2% 1013 46.4% 255 62.7% 265 66.8% 1 NA 303 74.9% 228 60.5%
Results based on all available test scores and are not presented for groups with fewer than 10 students for a given year. New and Returning status of students is based on information from Connections Education.
aSubgroups are based on currently used Federal reporting categories. Prior to 2008-09, the label “Asian/Pacific Islander” was used in place of the current separate categories for “Asian” and “Native Hawaiian or Other Pacific Islander”. For 2004-05 to 2008-09, the “Asian/Pacific Islander” group is reported within the row for “Asian” students.
bResults suppressed by grade on FCAT reporting site.

FCAT Reading
Group
2015-16 N
2015-16 % at Levels 3, 4, or
5
2014-15 N
2014-15 % at Levels 3, 4, or
5
2013-14 N
2013-14 % at Levels 3, 4, or
5
2012-13 N
2012-13 % at Levels 3, 4, or
5
2011-12 N
2011-12 % at Levels 3, 4, or
5
2010-11 N
2010-11 % at Levels 3, 4, or
5
2009-10 N
2009-10 % at Levels 3, 4, or 5
2008-09 N
2008-09
% at Levels 3, 4, or 5
2007-08 N
2007-08
% at Levels 3, 4, or 5
2006-07 N
2006-07
% at Levels 3, 4, or 5
All Students 3041 66.0% 2012 70.0% 2,059 75.1% 2111 72.1% 1329 72.7% 477 83.2% 439 82.5% 264 83.0% 454 82.7% 352 74.4% Students Eligible for Free and Reduced Meals
1326 58.2% 875 65.4% 922 67.8% 986 63.7% 555 65.2% 181 81.2% 184 79.9% 115 79.1% 181 80.1% 172 68.6%
IEP Students 184 41.8% 120 50.0% 99 54.5% 132 46.2% 95 57.9% 34 70.6% 30 60.0% 7 NA 17 70.6% 24 50.0% English Language Learner Students 38 28.9% 21 38.1% 17 11.8% 19 15.8% 4 NA 2 NA 2 NA 2 NA 0 NA 0 NA
White/ Caucasian Students 1845 67.8% 1222 69.6% 1322 75.1% 1417 73.7% 863 74.4% 341 82.7% 302 83.8% 171 84.2% 316 83.2% 241 76.8%
African American Students 288 55.6% 183 61.2% 203 69.0% 174 62.6% 120 60.0% 35 80.0% 32 75.0% 21 57.1% 31 74.2% 30 60.0%
Hispanic Students 662 66.0% 416 71.9% 355 74.9% 368 69.0% 270 70.0% 79 83.5% 79 86.1% 41 85.4% 50 82.0% 42 64.3% Asian Students 82 78.0% 53 84.9% 58 86.2% 48 83.3% 21 90.5% 4 NA 10 70.0% 7 NA 12 75.0% 7 NA American Indian/Alaskan Native Students
9 NA 11 54.5% 18 77.8% 10 70.0% 7 NA 0 NA 0 NA 0 NA 3 NA 4 NA
Native Hawaiian or other Pacific Islander Students^
8 NA 6 NA 1 NA 1 NA 3 NA 4 NA 0 NA NA NA NA NA NA NA
Students of Multiple Races/ Multiracial
160 58.8% 121 75.2% 102 74.5% 93 72.0% 45 82.2% 14 100.0% 16 62.5% 24 91.7% 39 87.2% 28 64.3%
Students Returning to Florida Connections from the Previous Year
1067 70.1% 961 72.8% 982 78.3% 573 76.4% 314 80.6% 221 86.9% 171 87.8% 263 83.7% 154 79.2% 124 77.4%
Students New to Florida Connections from the Previous Year
1986 63.9% 1051 67.4% 1077 71.6% 1538 70.5% 1015 70.2% 256 80.1% 268 79.1% 1 NA 300 83.0% 228 72.4%
Results based on all available test scores and are not presented for groups with fewer than 10 students for a given year. New and Returning status of students is based on information from Connections Education.
aSubgroups are based on currently used Federal reporting categories. Prior to 2008-09, the label “Asian/Pacific Islander” was used in place of the current separate categories for “Asian” and “Native Hawaiian or Other Pacific Islander”. For 2004-05 to 2008-09, the “Asian/Pacific Islander” group is reported within the row for “Asian” students.
bResults suppressed by grade on FCAT reporting site.

FCAT Science
Group
2015-16 N
2015-16 % at Levels 3, 4, or
5
2014-15 N
2014-15 % at Levels 3, 4, or
5
2013-14 N
2013-14 % at Levels 3, 4, or
5
2012-13 N
2012-13 % at Levels 3, 4, or
5
2011-12 N
2011-12 % at Levels 3, 4, or
5
2010-11 N
2010-11 % at Levels 3, 4, or
5
2009-10 N
2009-10 % at Levels 3, 4, or 5
2008-09 N
2008-09
% at Levels 3, 4, or 5
2007-08 N
2007-08
% at Levels 3, 4, or 5
2006-07 N
2006-07
% at Levels 3, 4, or 5
All Students 1070 57.9% 756 65.4% 720 61.8% 752 55.3% 437 55.4% 148 66.9% 126 74.6% 87 60.5% 121 59.4% 90 52.3% Students Eligible for Free and Reduced Meals
442 48.9% 307 57.3% 304 55.3% 352 46.6% 187 50.3% 49 67.3% 47 61.7% 42 57.1% 47 44.4% 35 51.4%
IEP Students 621 64.3% 14 64.2% 31 35.5% 45 46.7% 37 60.0% 9 NA 5 NA 4 NA 5 NA 4 NA English Language Learner Students 17 29.4% 7 NA 4 NA 6 NA 2 NA 2 NA 0 NA 0 NA 0 NA 0 NA
White/CaucasianStudents
663 60.8% 473 65.1% 466 62.9% 503 60.4% 281 58.0% 106 66.0% 95 78.9% 61 62.3% 88 47.7% 61 54.3%
African American Students 89 37.1% 69 46.4% 67 49.3% 52 23.1% 46 47.8% 7 NA 7 NA 9 NA 7 NA 5 NA
Hispanic Students 215 52.1% 149 67.8% 124 58.9% 140 51.4% 87 51.7% 27 63.0% 18 72.2% 10 70.0% 16 56.3% 13 69.2%
Asian Students 26 69.2% 16 100.0% 17 82.4% 18 61.1% 7 NA 2 NA 3 NA 0 NA 6 NA 3 NA
American Indian/Alaskan Native Students
3 NA 3 NA 7 NA 4 NA 5 NA 0 NA 0 NA 0 NA 1 NA 2 NA
Native Hawaiian or other Pacific Islander Students^
3 NA 1 NA 0 NA 0 NA 1 NA 1 NA 0 NA NA NA NA NA NA NA
Students of Multiple Races/ Multiracial
49 65.3% 45 75.3% 39 64.1% 35 42.9% 14 42.9% 5 NA 3 NA 7 NA 9 NA 6 NA
Students Returning to Florida Connections from the Previous Year
369 61.8% 348 70.0% 342 64.0% 238 59.7% 110 60.9% 67 70.1% 46 91.3% 87 60.5% 45 62.2% 32 62.5%
Students New to Florida Connections from the Previous Year
657 53.6% 408 61.0% 378 59.0% 514 53.3% 327 53.5% 81 64.2% 80 65.0% 0 NA 76 56.6% 58 43.1%
Results based on all available test scores and are not presented for groups with fewer than 10 students for a given year. New and Returning status of students is based on information from Connections Education.
aSubgroups are based on currently used Federal reporting categories. Prior to 2008-09, the label “Asian/Pacific Islander” was used in place of the current separate categories for “Asian” and “Native Hawaiian or Other Pacific Islander”. For 2004-05 to 2008-09, the “Asian/Pacific Islander” group is reported within the row for “Asian” students.
b FCAT Science Data not included in Connections Education records for 2005-06; FARM data suppressed by grade on FCAT reporting site.

FCAT Writing
Group 2015-16 N
2015-16 % at
3 or Higher
2014-15 N
2014-15 % at
3 or Higher
2013-14 N
2013-14 % at
3 or Higher
2012-13 N
2012-13 % at
3 or Higher
2011-12 N
2011-12 % at
3 or Higher
2010-11 N
2010-11 % at
3 or Higher
2009-10 N
2009-10 % at
3 or Higher
2008-09 N
2008-09
% at 3 or
Higher
2007-08 N
2007-08
% at 3 or
Higher
2006-07 N
2006-07
% at 3 or
Higher All Students NA NA NA NA 698 36.2% 760 66.2% 427 60.0% 150 93.3% 131 90.0% 89 73.0% 123 83.9% 106 88.9% Students Eligible for Free and Reduced Meals
NA NA NA NA 313 31.0% 341 60.7% 185 58.4% 55 89.1% 60 83.3% 38 71.0% 46 73.9% 47 83.0%
IEP Students NA NA NA NA 28 21.4% 46 45.6% 34 26.5% 9 NA 10 70.0% 6 NA 6 NA 4 NA English Language Learner Students
NA NA NA NA 3 NA 10 50.0% 2 NA 0 NA 2 NA 0 NA 0 NA 0 NA
White/ Caucasian Students
NA NA NA NA 436 36.9% 514 66.1% 272 58.8% 106 94.3% 86 90.7% 65 86.2% 86 77.9% 71 90.1%
African American Students
NA NA NA NA 125 30.3%
57 45.6% 45 55.6% 14 78.6% 7 NA 5 NA 10 90.0% 12 83.3%
Hispanic Students NA NA NA NA 125 33.6% 139 72.7% 87 63.2% 25 60.0% 30 90.0% 10 100.0% 11 100.0
% 13 84.6%
Asian Studentsa NA NA NA NA 20 55.0% 18 83.3% 6 NA 1 NA 3 NA 1 NA 1 NA 2 NA American Indian/Alaskan Native Students
NA NA NA NA 4 NA 5 NA 3 NA 0 NA 0 NA 0 NA 2 NA 2 NA
Native Hawaiian or other Pacific Islander Students^
NA NA NA NA 0 NA 0 NA 0 NA 2 NA 0 NA NA NA NA NA NA NA
Students of Multiple Races/ Multiracial
NA NA NA NA 37 43.2% 27 66.7% 14 71.4% 2 NA 5 NA 8 NA 13 100.0
% 6 NA
Students Returning to Florida Connections from the Previous Year
NA NA NA NA
336 33.9% 218 63.8% 103 52.4% 79 96.2% 47 89.4% 87 72.4% 48 85.4% 38 92.1%
Students New to Florida Connections from the Previous Year
NA NA NA NA
362 38.7% 542 67.2% 324 62.3% 71 90.1% 84 90.5% 2 NA 73 82.2% 68 88.2%
Results based on all available test scores and are not presented for groups with fewer than 10 students for a given year. New and Returning status of students is based on information from Connections Education. Florida subgroup results for 2008-09 and earlier are only reported as % of students at a score of 3.5 or higher. To maintain consistency with more recent years, results above for 2008-09 and earlier are based on Connections Education’s records of students scoring at 3.0 or higher.
aSubgroups are based on currently used Federal reporting categories. Prior to 2008-09, the label “Asian/Pacific Islander” was used in place of the current separate categories for “Asian” and “Native Hawaiian or Other Pacific Islander”. For 2004-05 to 2008-09, the “Asian/Pacific Islander” group is reported within the row for “Asian” students. bResults suppressed by grade and type of Writing test on FCAT reporting site.

Algebra 1 End of Course Test
Group 2015-16 N
2015-16 % at
Level s 3, 4, or 5
2014-15 N
2014-15 % at
Level s 3, 4, or 5
2013-14 N
2013-14 % at Level s 3, 4, or 5
2012-13 N
2012-13 % at Levels 3, 4, or 5
All Students 130 78.5% 374 57.2% 89 97% 95 96.8% Students Eligible for Free and Reduced Meals 39 64.1% 140 47.1% 33 93.9% 20 100.0% IEP Students 6 NA 9 55.6% 6 NA 3 NA English Language Learner Students 0 NA 5 NA 0 NA 7 NA White/Caucasian Students 87 80.5% 234 58.5% 65 95.4% 75 96.0% African American Students 9 NA 35 40.0% 4 NA 1 NA Hispanic Students 22 90.9% 83 56.6% 12 91.7% 11 100.0% Asian Students 7 NA 8 NA 3 NA 6 NA American Indian/Alaskan Native Students 0 NA 1 NA 1 NA 1 NA Native Hawaiian or other Pacific Islander Students^ 4 NA 0 NA 0 NA 0 NA Students of Multiple Races/ Multiracial 1 NA 13 84.6% 4 NA 1 NA Students Returning to Florida Connections from the Previous Year
29 79.3% 95 50.5% 41 97.6% 39 97.4%
Students New to Florida Connections from the Previous Year
101 78.2% 279 59.5% 48 93.8% 56 96.4%
Results based on all available test scores and are not presented for groups with fewer than 10 students for a given year. New and Returning status of students is based on information from Connections Education. aSubgroups are based on currently used Federal reporting categories.
Geometry End of Course Test
Group 2015-16 N
2015-16 % at
Level s 3, 4, or 5
2014-15 N
2014-15 % at
Level s 3, 4, or 5
2013-14 N
2013-14 % at Levels 3, 4, or 5
2012-13 N
2012-13 % at Levels 3, 4, or 5
All Students 51 90.2% 35 42.9% 32 93% 19 94.7% Students Eligible for Free and Reduced Meals 11 90.9% 12 25.0% 9 NA 6 NA IEP Students 0 NA 1 NA 0 NA 1 NA English Language Learner Students 0 NA 0 NA 0 NA 0 NA White/ Caucasian Students 37 91.9% 26 42.3% 19 94.7% 13 92.3% African American Students 0 NA 1 NA 0 NA 1 NA Hispanic Students 10 80.0% 6 NA 5 NA 2 NA Asian Students 2 NA 0 NA 5 NA 2 NA American Indian/Alaskan Native Students 1 NA 0 NA 0 NA 0 NA Native Hawaiian or other Pacific Islander Students^ 0 NA 0 NA 0 NA 0 NA Students of Multiple Races/ Multiracial 1 NA 2 NA 3 NA 1 NA
Students Returning to Florida Connections from the Previous Year
15 100.0% 21 33.3% 19 94.7% 10 100.0%
Students New to Florida Connections from the Previous Year
36 86.1% 14 57.1% 13 92.3% 9 NA

Results based on all available test scores and are not presented for groups with fewer than 10 students for a given year. New and Returning status of students is based on information from Connections Education.
aSubgroups are based on currently used Federal reporting categories.
Civics End of Course Test
Group 2015-16 N
2015-16 % at
Levels 3, 4, or 5
2014-15 N
2014-15 % at Levels 3, 4, or 5
All Students 653 75.7% 395 78.2% Students Eligible for Free and Reduced Meals 236 68.6% 170 75.3% IEP Students 54 66.7% 4 NA English Language Learner Students 4 NA 7 NA White/ Caucasian Students 417 76.3% 264 79.5% African American Students 51 68.6% 24 70.8% Hispanic Students 139 75.5% 75 76.0% Asian Students 16 75.0% 11 72.7% American Indian/Alaskan Native Students 0 NA 1 NA Native Hawaiian or other Pacific Islander Students^ 3 NA 1 NA Students of Multiple Races/ Multiracial 27 77.8% 19 84.2%
Students Returning to Florida Connections from the Previous Year
197 78.7% 199 78.9%
Students New to Florida Connections from the Previous Year
456 74.3% 196 77.6%
Results based on all available test scores and are not presented for groups with fewer than 10 students for a given year. New and Returning status of students is based on information from Connections Education.
aSubgroups are based on currently used Federal reporting categories.