student loans: is it time for employers to step in? loans.pdf · student loans: is it time for...
TRANSCRIPT
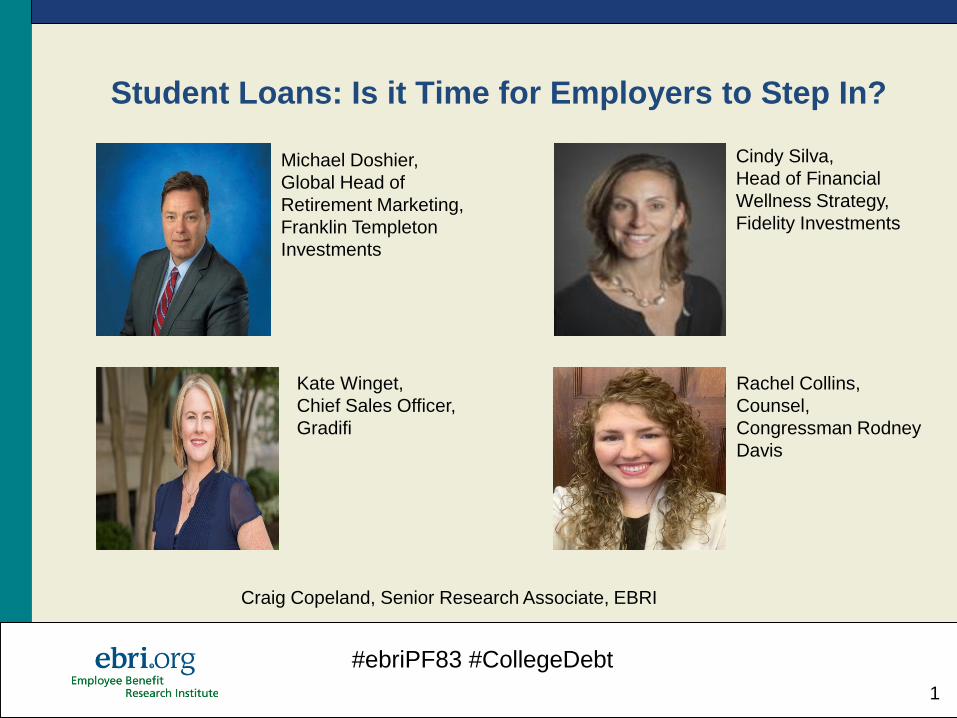
Student Loans: Is it Time for Employers to Step In?
1
Michael Doshier,
Global Head of
Retirement Marketing,
Franklin Templeton
Investments
Rachel Collins,
Counsel,
Congressman Rodney
Davis
Cindy Silva,
Head of Financial
Wellness Strategy,
Fidelity Investments
Kate Winget,
Chief Sales Officer,
Gradifi
Craig Copeland, Senior Research Associate, EBRI
#ebriPF83 #CollegeDebt
Trends in Student Loan Debt, 1992-2016
Craig Copeland, EBRI
EBRI Policy Forum
May 10, 2018
2
© Employee Benefit Research Institute 2018
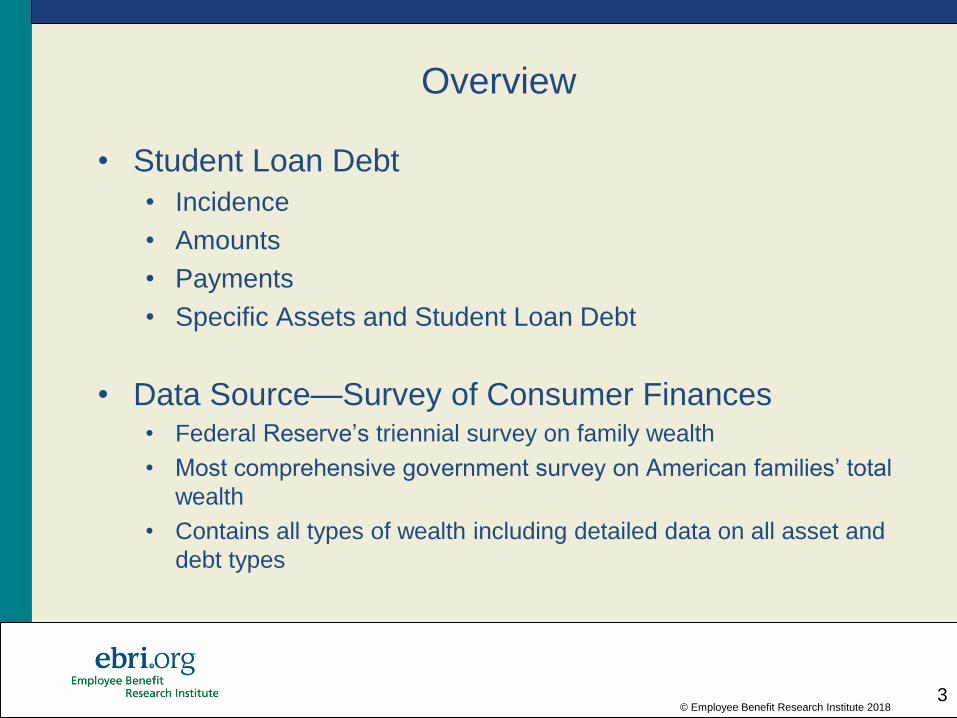
Overview
• Student Loan Debt
• Incidence
• Amounts
• Payments
• Specific Assets and Student Loan Debt
• Data Source—Survey of Consumer Finances• Federal Reserve’s triennial survey on family wealth
• Most comprehensive government survey on American families’ total
wealth
• Contains all types of wealth including detailed data on all asset and
debt types
3
© Employee Benefit Research Institute 2018
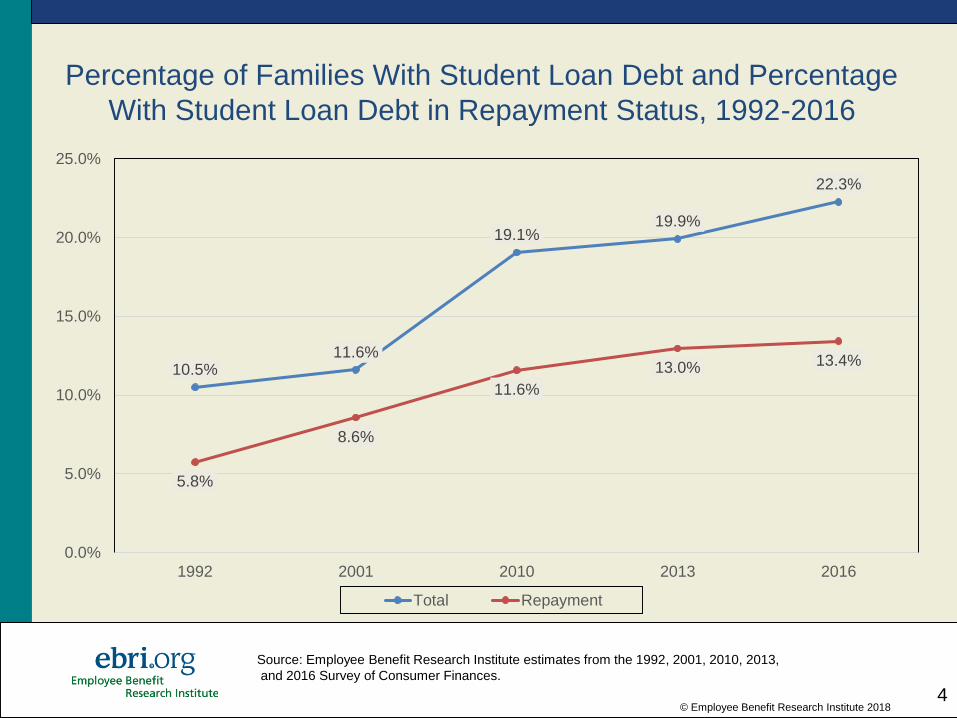
Percentage of Families With Student Loan Debt and Percentage
With Student Loan Debt in Repayment Status, 1992-2016
10.5%11.6%
19.1%19.9%
22.3%
5.8%
8.6%
11.6%
13.0% 13.4%
0.0%
5.0%
10.0%
15.0%
20.0%
25.0%
1992 2001 2010 2013 2016
Total Repayment
4
Source: Employee Benefit Research Institute estimates from the 1992, 2001, 2010, 2013,
and 2016 Survey of Consumer Finances.

© Employee Benefit Research Institute 2018
Percentage of Families With Student Loan Debt,
by Age of Family Head, 1992-2016
24.4%26.0%
40.0%41.4%
44.8%
11.7% 11.9%
26.2%
28.7%
34.3%
5.7%
10.7%
17.5%18.4%
23.7%
2.9%
5.2%
9.3%
12.0%12.9%
1.2%0.4%
2.7% 2.1% 2.4%
0.0%
5.0%
10.0%
15.0%
20.0%
25.0%
30.0%
35.0%
40.0%
45.0%
1992 2001 2010 2013 2016
<35 35-44 45-54 55-64 65 or Older
5
Source: Employee Benefit Research Institute estimates from the 1992, 2001, 2010, 2013,
and 2016 Survey of Consumer Finances.
© Employee Benefit Research Institute 2018
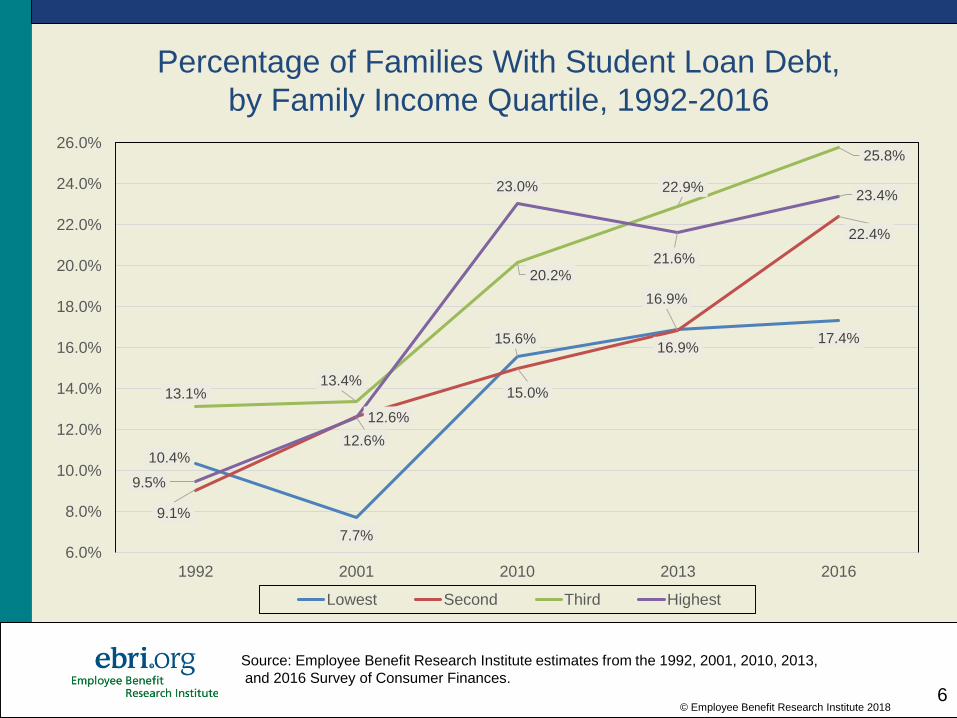
Percentage of Families With Student Loan Debt,
by Family Income Quartile, 1992-2016
10.4%
7.7%
15.6%16.9%
17.4%
9.1%
12.6%
15.0%
16.9%
22.4%
13.1%13.4%
20.2%
22.9%
25.8%
9.5%
12.6%
23.0%
21.6%
23.4%
6.0%
8.0%
10.0%
12.0%
14.0%
16.0%
18.0%
20.0%
22.0%
24.0%
26.0%
1992 2001 2010 2013 2016
Lowest Second Third Highest
6
Source: Employee Benefit Research Institute estimates from the 1992, 2001, 2010, 2013,
and 2016 Survey of Consumer Finances.
Student Loan Debt Amounts
7
© Employee Benefit Research Institute 2018
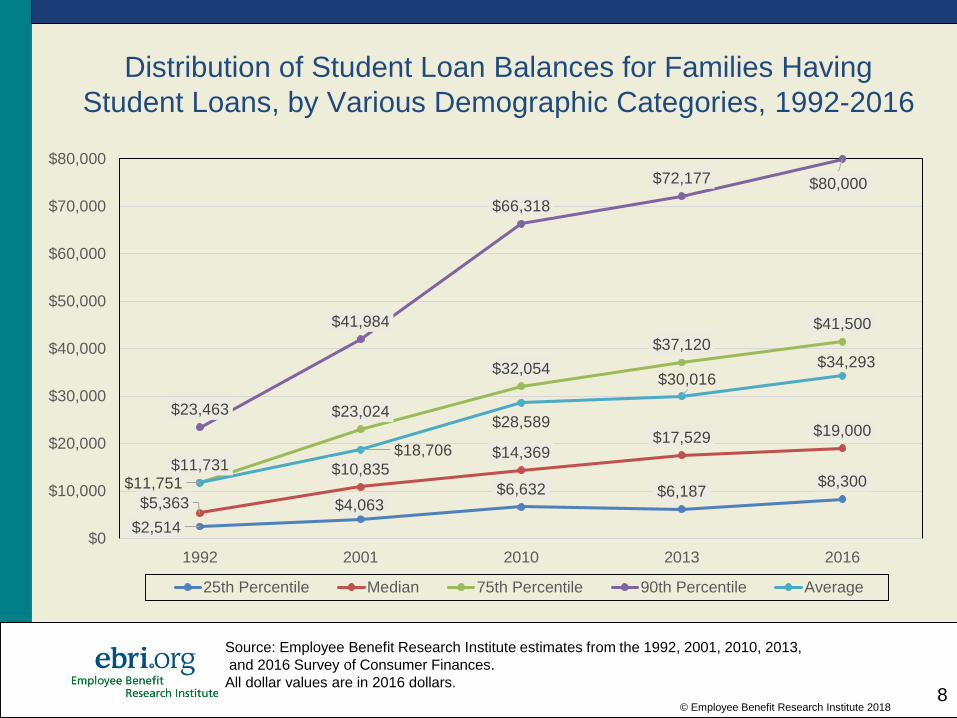
Distribution of Student Loan Balances for Families Having
Student Loans, by Various Demographic Categories, 1992-2016
$2,514
$4,063$6,632 $6,187
$8,300
$5,363
$10,835$14,369
$17,529 $19,000
$11,731
$23,024
$32,054
$37,120
$41,500
$23,463
$41,984
$66,318
$72,177 $80,000
$11,751
$18,706
$28,589
$30,016$34,293
$0
$10,000
$20,000
$30,000
$40,000
$50,000
$60,000
$70,000
$80,000
1992 2001 2010 2013 2016
25th Percentile Median 75th Percentile 90th Percentile Average
8
Source: Employee Benefit Research Institute estimates from the 1992, 2001, 2010, 2013,
and 2016 Survey of Consumer Finances.
All dollar values are in 2016 dollars.

Median Monthly Required
Student Loan Debt Payments
and Percentage of Income the
Debt Payments Represent
9

© Employee Benefit Research Institute 201310
$100
$200
$350
$630
$3041.6%
3.1%
5.9%
9.9%
5.0%
0.0%
2.0%
4.0%
6.0%
8.0%
10.0%
12.0%
$0
$100
$200
$300
$400
$500
$600
$700
25th Percentile Median 75th Percentile 90th Percentile Average
Distribution of Reported Required Family Monthly Student Loan Debt Payments and Distribution of the Percentage of Family
Income That the Debt Payments Represent, 2016
Monthly Debt Payment Percentage of Income
Source: Employee Benefit Research Institute estimates of the 2016 Survey of Consumer Finances.

© Employee Benefit Research Institute 201311
$200 $200 $200 $200
$100
4.0%
2.8% 2.9%
3.1%
1.6%
0.0%
0.5%
1.0%
1.5%
2.0%
2.5%
3.0%
3.5%
4.0%
4.5%
$0
$50
$100
$150
$200
$250
<35 35-44 45-54 55-64 65 or Older
Required Median Monthly Student Loan Debt Payments and Percentage of Income That the Debt Payments Represented, by
Family Head Age, 2016
Median Monthly Payment Percentage of Family Income
Source: Employee Benefit Research Institute estimates of the 2016 Survey of Consumer Finances.

Specific Assets and Student Loan
Debt
• Home Ownership
• DC Plans
12
© Employee Benefit Research Institute 2018
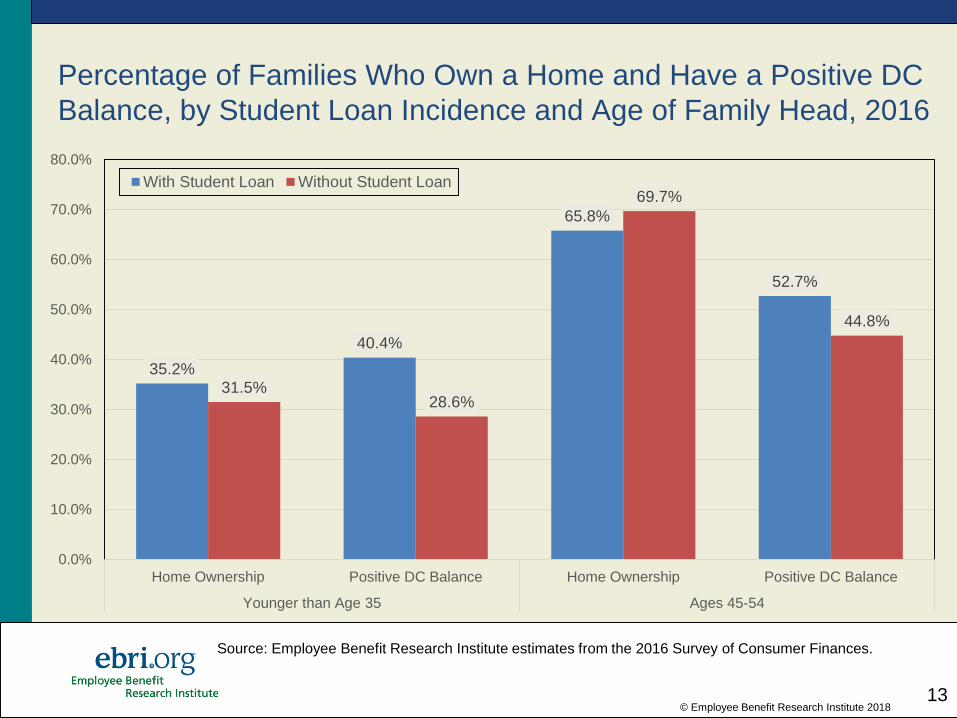
Percentage of Families Who Own a Home and Have a Positive DC
Balance, by Student Loan Incidence and Age of Family Head, 2016
13
35.2%
40.4%
65.8%
52.7%
31.5%28.6%
69.7%
44.8%
0.0%
10.0%
20.0%
30.0%
40.0%
50.0%
60.0%
70.0%
80.0%
Home Ownership Positive DC Balance Home Ownership Positive DC Balance
Younger than Age 35 Ages 45-54
With Student Loan Without Student Loan
Source: Employee Benefit Research Institute estimates from the 2016 Survey of Consumer Finances.

© Employee Benefit Research Institute 2018
Distribution of DC Plan Balances for Families With and Without
Student Loans, Families With Heads of Specific Ages, 2016
$2,400 $8,000$24,000
$62,000
$3,000 $11,000
$38,000
$90,000
$16,000
$46,000
$148,100
$410,000
$18,000
$80,000
$227,000
$500,000
$0
$50,000
$100,000
$150,000
$200,000
$250,000
$300,000
$350,000
$400,000
$450,000
$500,000
25th Percentile Median 75th Percentile 90th Percentile
Younger than Age 35 with Student Loan Younger than Age 35 without Student Loan
Age 45-54 with Student Loan Age 45-54 without Student Loan
14
Source: Employee Benefit Research Institute estimates from the 2016 Survey of Consumer Finances.

© Employee Benefit Research Institute 201315
27.3%
24.9%26.5%
36.3%
0%
5%
10%
15%
20%
25%
30%
35%
40%
Home Ownership Positive Defined Contribution Balance
Percentage of Families With Heads Younger Than Age 35 and Having Some College That Own a Home and Have a Positive Defined Contribution
Balance, by Student Loan Incidence, 2016
With Student Loan No Student Loan
Source: Employee Benefit Research Institute estimates of the 2016 Survey of Consumer Finances.

© Employee Benefit Research Institute 201316
$1,600
$4,700
$15,300
$16,667
$3,000
$10,000
$23,200
$21,490
$0
$5,000
$10,000
$15,000
$20,000
$25,000
25th Percentile Median 75th Percentile Average
Distribution of Defined Contribution Balances for Families With Heads Ages Younger Than 35 and Some College, by Student Loan Incidence, 2016
With Student Loan No Student Loan
Source: Employee Benefit Research Institute estimates of the 2016 Survey of Consumer Finances.

© Employee Benefit Research Institute 2018
Takeaways
• The incidence of student loan debt has been growing
significantly (nearly doubling since 2001), particularly among
families with heads younger than age 35 and ages 35-44.
• The average student loan debt amount increased in real
amounts by 20% from 2010 to 2016, and the median
increased 32%.
• The required median debt payment was $200 in 2016, which
represented 3.1% of family income. However, these
payments reach 10 percent and above of family income for
those with the highest debt payments.
• DC balances are lower for those with student loan debt than
for those without it.
17
© Employee Benefit Research Institute 2018
1100 13th Street NW
Washington, D.C. 20005
202-659-0670
www.ebri.org www.choosetosave.org
18
© Employee Benefit Research Institute 201819
EBRI-ERF Policy Forum #83
Retirement, Health and Financial Wellbeing
Thursday, May 10, 2018
Wireless Network: DCCTR
Wireless Password: meeting2015DC
Tweet: #ebriPF83

EBRI Policy Forum
KATE W INGET
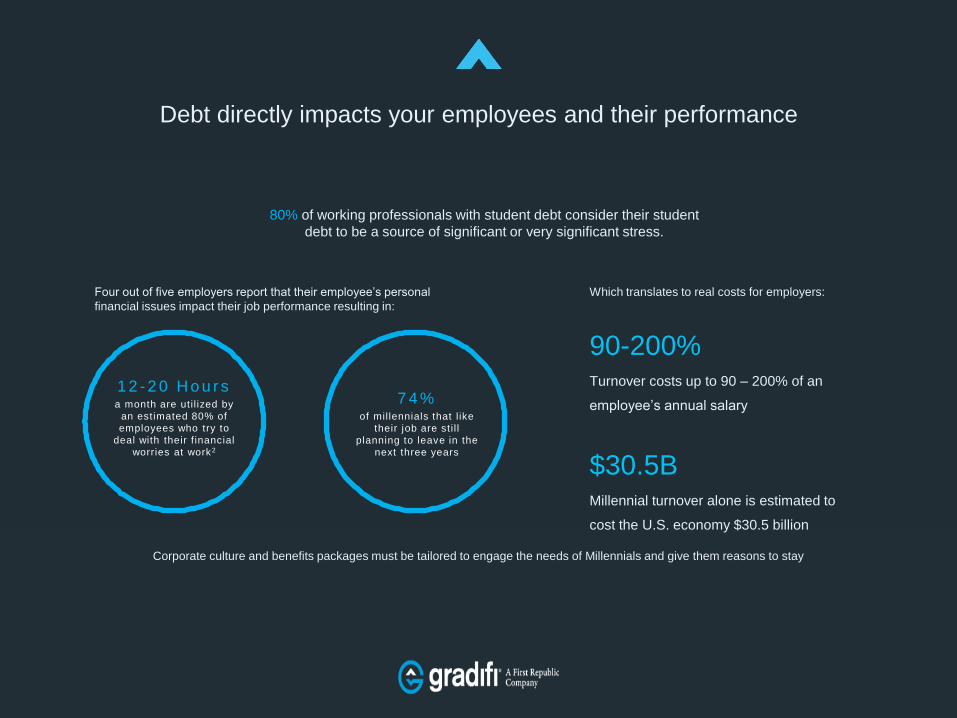
Debt directly impacts your employees and their performance
80% of working professionals with student debt consider their student
debt to be a source of significant or very significant stress.
1 2 - 2 0 H o u r sa month are uti l ized by
an estimated 80% of
employees who try to
deal with their f inancial
worries at work2
7 4 % of millennials that l ike
their job are sti l l
planning to leave in the
next three years
Four out of five employers report that their employee’s personal
financial issues impact their job performance resulting in:
Which translates to real costs for employers:
$30.5BMillennial turnover alone is estimated to
cost the U.S. economy $30.5 billion
90-200%Turnover costs up to 90 – 200% of an
employee’s annual salary
Corporate culture and benefits packages must be tailored to engage the needs of Millennials and give them reasons to stay

Attraction
Mid-level management
Master’s preferred
$200/month benefit
3 years
Diversity Women & Minorities
$100/month benefit Increase of $100/year
3 years
Competitive Talent Hire
High value employees with specialized training
One time hiring bonus of $7,200 after 1 year of employment
Retention Millennials $100/month benefit
6 years
Goal PlanTarget
Debt is not a one size fits all problem, and our solutions shouldn’t be either
Budget: $7.500/employee
