student loan borrowing across nyc neighborhoods · pdf file2 abstract u.s. student loan debt...
TRANSCRIPT

1
December 2017
FEDERAL RESERVE BANK OF NEW YORK RESEARCH AND STATISTICS GROUP ● MICROECONOMIC STUDIES COMMUNICATIONS & OUTREACH ● OUTREACH AND EDUCATION
Student Loan Borrowing Across NYC Neighborhoods
In Partnership with NYC Department of ConsumerAffairs Office of Financial Empowerment

2
AbstractU.S. student loan debt now totals over $1.3 trillion. However, this number obscures a diversity of consumer experiences with student debt regionally and demographically. This New York City report highlights the high rates of delinquency and default and slow repayment rates, especially among borrowers with lower student loan balances who live in lower-income areas.
Key words: student debt, financial health
AcknowledgmentsJoelle Scally, Administrator of the Center for Microeconomic Data at the Federal Reserve Bank of New York, and Zayne Abdessalam, Director of Policy and Research at the NYC Department of Consumer Affairs (DCA) Office of Financial Empowerment (OFE), were the leads on this report. Claire Kramer Mills, Assistant Vice President and Community Affairs Officer at the New York Fed, provided drafting and editorial guidance. At OFE, Amelia Josephson contributed to the report drafting and Nichole Davis, Director of Programs, provided editing and technical support. Sanjay Sudhir provided data support at the New York Fed and Idisha Odama provided similar support at OFE.
The New York Fed and DCA also wish to acknowledge the following staff members for their contributions:
New York Fed:Andrew Haughwout, Senior Vice President; Donghoon Lee, Research Officer; Wilbert van der Klaauw, Senior Vice President
DCA:Lorelei Salas, Commissioner; Sandra Abeles, Executive Deputy Commissioner; Kenny Minaya, Chief of Staff; Nicole Perry, Deputy Commissioner for OFE; Matthew Mueller, GIS Developer for the Division of Technology and Strategic Solutions (DoTSS); and Bryan Menegazzo, GIS Specialist for DoTSS
Special thanks to Debra-Ellen Glickstein, Kimberly Goulart, Joseph Dwyer, Seth Samelson, and Adrian Franco.

3
1 https://www.newyorkfed.org/microeconomics/hhdc.html2 Delinquency is defined as being 90 or more days past due, while default is defined as being 270 or more days late, and a subset of delinquency.3 https://www.newyorkfed.org/medialibrary/media/newsevents/mediaadvisory/2015/Student-Loan-Press-Briefing-Presentation.pdf
About the OrganizationsPart of the mission of the New York Fed’s community outreach team is to provide information at the local level for decision makers and policymakers, particularly for issues that affect low- and middle-income residents of Federal Reserve System’s Second District, comprising New York, northern New Jersey, Fairfield County in Connecticut, Puerto Rico, and the Virgin Islands. To that end, The New York Fed partnered with OFE to produce this report on student loan borrowing in New York City using our Consumer Credit Panel, which is based on Equifax credit report data.
OFE’s mission is to educate, empower, and protect residents and neighborhoods so they can improve their financial health and build assets, which furthers DCA’s mission to protect and enhance the daily economic lives of New Yorkers to create thriving communities. OFE uses data, research, policy, partnerships, and convenings to advance its mission. This report provides a strong foundation for OFE to better understand how New Yorkers are managing their student loan debt and determine which neighborhoods might benefit most from targeted assistance.
IntroductionThis report is the first city-level examination of student loan debt, and provides an in-depth look at student loans across neighborhoods in New York City’s five boroughs. In a city of about 6.5 million adults, approximately one million (15 percent) have a student loan, owing a collective student loan balance of $34.8 billion. In the United States as a whole, approximately 44 million adults (18 percent of the adult population) have a student loan. The national collective loan balance totaled roughly $1.3 trillion dollars at the end of 2016.1
In New York City, borrowers’ repayment success on their student debt varies considerably by borough and neighbor-hood. We find that the borough with the highest rates of student loan distress, as measured by delinquency and default, is the Bronx.2 Of the five neighborhoods with the highest percentage of borrowers whose student loans are delinquent, three are in the Bronx, while the other two are in Brooklyn. Four of the five neighborhoods with the highest student loan default rates are in the Bronx, with the fifth in Brooklyn.
Perhaps not surprisingly, higher delinquency and default rates are found among New Yorkers from lower-income areas. Delinquency rates among borrowers in the lowest income neighborhoods were 20 percent, with over half of those delinquent borrowers in default. In the highest income neighborhoods, the delinquency rate is less than half that, under 10 percent. Further, we find over half of borrowers residing in higher income areas are making payments and success-fully reducing the balances on their student loans, while only about one fourth of borrowers in the lowest income neighborhoods are successfully reducing their balances, consistent with the general trends found at the national level.3
Also consistent with earlier, national-level analysis, we find higher rates of delinquency and default among borrowers with low balances and those located in lower income neighborhoods.
Finally, older borrowers (those 45 years old and older) have higher delinquency rates than younger borrowers. Younger borrowers are more likely to be enrolled in school or eligible for tailored repayment plans, such as income-driven repayment, to ease debt burden.

4
ContextStudent loans are a key part of how higher education is financed in the United States, and access to higher education and investment in knowledge and skills are crucial for social and economic mobility. Although student loans can provide critical access to higher education, student loans are not a risk-free way of financing it. Indeed, loans taken for higher education that do not provide sufficient returns can have significant, negative impacts on individuals’ financial health. Borrowers may find themselves with high debt burdens even when they lack the kinds of degrees that enhance earning power. Moreover, delinquent borrowers and those in default may see a spillover effect as their repayment status restricts their access to other types of credit and asset-building tools. Because defaulted student loans cannot be easily discharged in bankruptcy, the defaulted debt remains as a blemish on credit reports indefinitely. For these reasons, New York Fed and OFE’s joint report pays special attention to delinquency and default rates among New Yorkers with student debt.
Our analysis finds key similarities and differences between student debt patterns in New York City and the United States. Borrowers in New York City have higher median balances than Americans overall. New Yorkers’ delinquency and default rates are slightly lower than the national average. In general, these results are consistent with a concentra-tion of individuals with advanced degrees who are managing their debts more successfully than the average student borrower. However, these balance-weighted aggregates mask underlying diversity, with high-balance borrowers in Manhattan faring better than low-balance borrowers in the Bronx, potentially reflecting variation in the quality and completion of their degrees.
While this joint report provides critical insight into the state of student debt in New York City’s neighborhoods, it does not purport to provide a complete picture of borrower characteristics. Further research on this topic is needed to understand how payment status and median balance vary by key variables such as race, gender, school type, employ-ment status, degree completion, and participation in a repayment plan.
About the DataThis report is based on the New York Fed Consumer Credit Panel (CCP), a five percent representative sample of anonymized, individual-level credit reports from the credit bureau Equifax. The CCP is the key source for the New York Fed’s Quarterly Report on Household Debt and Credit, which provides national estimates for household borrowing, including student loan debt balances and delinquency on a quarterly basis. The student loan component of the data, used in this analysis, provides loan-level information on each student loan borrower, with detailed information on the balance, payment, delinquency rate, and origination date. All outstanding student debts are accounted for, including both private and federal loans, although we are not able to distinguish between the two categories. All of the figures are based on data that appeared on credit reports as of December 31, 2016.
The CCP does not contain any individual-level information on income. To supplement the data on debt, we have used data on income from the Census Bureau’s American Community Survey (ACS) for neighborhood-level median income, and the Statistics of Income (SOI) Individual Income Tax Statistics from the Internal Revenue Service (IRS) for Zip Code-level income data. We have also used the ACS for Educational Attainment data and Public Use Microdata Area (PUMA) population figures.
Because the CCP does not contain any individual-level information on income, we calculate average income per tax filing at the Zip Code level using the IRS data. We have sorted the New York City Zip Codes into income quintiles, each with equal populations, with the first quintile being the lowest income and representing the 20 percent of New York City living in the lowest income Zip Codes, and the fifth quintile being the highest income representing the 20 percent who live in the wealthiest New York City Zip Codes. We match borrowers into an income-quintile based on the Zip Code on their credit report.

5
BorrowersAs of the end of 2016, there were approximately one million student loan borrowers in New York City. About 15 percent of adults in New York City have student loans, with an average balance of $34,900, notably higher than the U.S. average of $29,500. The median age of New York borrowers is 33, with little variation across boroughs.
PrevalencePrevalence—the percentage of residents with student loans— varies by borough, as seen in Figure 1, a snapshot as of December 31, 2016. Much of this variation reflects underlying differences in the educational attainment in each borough; an absence of student loans can indicate either an ability to finance higher education without loans or non-pursuit of higher education. For context, we also provide the percentage of residents in each borough that is college educated.4
Figure 1
Source: New York Fed Consumer Credit Panel / Equifax; Census Bureau
We see that rates of indebtedness do not perfectly correspond to rates of completion of higher education. Manhattan boasts high levels of post-secondary education while maintaining a relatively low percentage of adults with student loan debt. On the other end of the scale, Staten Island has the highest percentage of population with student debt, yet the borough has relatively fewer degrees to show for the debt.
4 As indicated by a bachelor’s degree or higher. Source: Bureau of the Census American Community Survey (2011-2015)
9.2%
15.3%
14.6%
12.9%
17.5%
13.1%
16.7%
Percent of residents with a student loan
Bronx
Brooklyn
Manhattan
Queens
Staten Island
NYC Overall
United States
Student Loan Prevalence and Educational Attainment
6.6%
12.8%
28.4%
11.1%
12.4%
14.6%
11.2%
12.3%
20.1%
31.6%
19.3%
18.4%
21.0%
18.5%
Bachelor’s CountyGraduate or professional
(2016Q4)
Highest Degree Attained

6
The map in Figure 2 below shows the prevalence of student loan borrowers by PUMAs, which are aligned to Commu-nity Districts (and thus New York City neighborhoods), calculated as the number of individuals with a student loan divided by the Census population. As stated, although borrowing can provide critical access to higher education, student loans are not a risk-free way of financing higher education. As the map indicates, some lower-income neighbor-hoods have high rates of borrowing. For example, Brooklyn Community District (CD) 17 (East Flatbush, Farragut and Rugby), Staten Island CD 1 (Port Richmond, Stapleton and Mariner’s Harbor), and Bronx CD 12 (Wakefield, Williams-bridge and Woodlawn) each have over 18 percent of residents with student loans. In these neighborhoods, where unemployment and underemployment are higher than the city average, student loans were taken with the intention of improving income and employment prospects. However, as we discuss in the next sections, higher balances and delinquency rates in these areas suggest that the loans may not yield the intended payoffs for all borrowers.
Figure 2
22
21
46
3
2
23
44
32
45
53
5
9
55
4
47
51
1
54
50
31
42
52
39
10
43
24
28
35
8
48
36
40
41
16
6
37
27
33
17
711
38
49
30
25
20
26
29
15
19
34
12
18
14
13
Percent of Population with Student Loan
0% - 9%
9% - 12%
12% - 15%
15% - 18%
>18%
Percent of Population with a Student Loan by Community District
22
21
46
3
2
23
44
32
45
53
5
9
55
4
47
51
1
54
50
31
42
52
39
10
43
24
28
35
8
48
36
40
41
16
6
37
27
33
17
711
38
49
30
25
20
26
29
15
19
34
12
18
14
13
Percent of Population with Student Loan
0% - 9%
9% - 12%
12% - 15%
15% - 18%
>18%
0% - 9%
>9% - 12%
>12% - 15%
>15% - 18%
>18%
Source: New York Fed Consumer Credit Panel / Equifax
(2016Q4)
See Index of Community Districts

7
However, comparing median loan balances with median family incomes (which should be a proxy for educational attainment), Bronx neighborhoods have high loan balances relative to income. Again, comparing Manhattan and Bronx borrowers, those who reside in Manhattan owe a median student debt of $21,483, while Bronx borrowers have a median balance of $14,784, a significant difference. However, the gap in median household incomes between the Bronx and Manhattan is even more sizable than the median loan balances, suggesting that despite higher balances in Manhattan, these balances may be a smaller percent of income. The typical Bronx family owes more of their limited income to student loans, as seen in Figure 4.
Bronx
Brooklyn
Manhattan
Queens
Staten Island
NYC Overall
$14,784
$17,202
$21,483
$15,792
$15,521
$16,957
Median Student Loan Balances among BorrowersFigure 3
Source: New York Fed Consumer Credit Panel / Equifax
Balances Higher educational attainment is often associated with higher loan balances, and professional degrees, which enhance earning potential, are often associated with particularly high balances.5 Balances in Manhattan (where many highly educated—and thus highly indebted—professionals reside) are considerably higher, on average, than balances in the Bronx, where educational attainment is lower.
This pattern holds when we examine median loan balances, as seen in Figure 3 below. These medians are in keeping with Manhattan and the Bronx’s respective rates of educational attainment. Because of higher levels of educational attainment in Manhattan, we would expect borrowers there to have higher median and average loan balances than borrowers in the Bronx, where only 18.9 percent of the adult population has completed a college degree.
5 See https://www.urban.org/sites/default/files/publication/22591/413123-Student-Loans-Rising.PDF
(2016Q4)

8
Manhattan has a higher concentration of high-balance borrowers, defined here as those with balances over $100,000 (Figure 5). This concentration is consistent with a greater prevalence in Manhattan of borrowers with graduate de-grees, and is not in itself a cause for concern, as long as the additional education carries a sufficiently large wage premium. Almost half of the degree holders in Manhattan have a graduate degree.6 Manhattan’s median household income of $72,871 indicates a higher ability to repay student debt.
6 2011-2015 American Community Survey 5-Year Estimates, Educational Attainment.
Bronx
Brooklyn
Manhattan
Queens
Staten Island
5%
8%
12%
7%
6%
Percent of Borrowers with Student Loan Balances Greater than $100,000Figure 5
Source: New York Fed Consumer Credit Panel / Equifax
Median Student Loan Balance as Percent of Median Income
Bronx
Brooklyn
Manhattan
Queens
Staten Island
NYC Overall
Figure 4
Source: New York Fed Consumer Credit Panel / Equifax; Census Bureau
(2016Q4)
(2016Q4)
43%
36%
29%
27%
21%
32%

9
Repayment OutcomesHaving examined who borrows and how much, we can examine outcomes of student loan debt as measured by delinquency, default, and repayment success.
DelinquencyDelinquency, measured here as the percent of borrowers who are at least 90 days or more past due on one or more student loans, is another indicator that varies substantially by borough (Figure 7). Borrowers in the Bronx are more likely to be behind on their student loans, despite having lower median loan balances ($14,784, compared to the citywide median of $16,957).
The map in Figure 6 shows the median student loan balance per borrower in each of New York City’s Community Districts. The contrast between Manhattan neighborhoods and all other outer borough neighborhoods is clear from the map. Residents in Manhattan’s West Side, East Side, and downtown neighborhoods, as well as Brooklyn Heights tend to have significantly higher median balances.
22
21
46
3
2
23
44
32
45
53
5
9
55
4
47
51
1
54
50
31
42
52
39
10
43
24
28
35
8
48
36
40
41
16
6
37
27
33
17
711
38
49
30
25
20
26
29
15
19
34
12
18
14
13
Median Student Loan Balance / Borrower
$11,000 - $15,000
$15,001 - $19,000
$19,001 - $23,000
$23,001 - $27,000
Figure 6
Median Student Loan Balance per Borrower by Community District
22
21
46
3
2
23
44
32
45
53
5
9
55
4
47
51
1
54
50
31
42
52
39
10
43
24
28
35
8
48
36
40
41
16
6
37
27
33
17
711
38
49
30
25
20
26
29
15
19
34
12
18
14
13
Median Student Loan Balance / Borrower
$11,000 - $15,000
$15,001 - $19,000
$19,001 - $23,000
$23,001 - $27,000
$11,000 - $15,000
$15,001 - $19,000
$19,001 - $23,000
$23,001 - $27,000
Source: New York Fed Consumer Credit Panel / Equifax
(2016Q4)
See Index of Community Districts

10
Bronx
Brooklyn
Manhattan
Queens
Staten Island
NYC Overall
19%
15%
12%
12%
11%
14%
Below, in Figure 8 we provide a map indicating delinquency rates by neighborhood, from which the high delinquency rates in Brooklyn and the Bronx are evident. The community districts with the highest delinquency rates despite relatively low median loan balances are: Brooklyn CD 5 (East New York and Starrett City) -- 10%; Bronx CD 5 (Morris Heights, Fordham South and Mount Hope) -- 8%; Bronx CD 4 (Concourse, Highbridge and Mount Eden) -- 8%; Bronx CD 1 and 2 (Hunts Point, Longwood and Melrose) --7%; and Brooklyn CD 17 (East Flatbush, Farragut and Rugby) --7%. Wealthy areas of Manhattan show very low delinquency rates though median loan balances are high.
Percent of Student Loan Borrowers 90+ Days Past Due on Student LoansFigure 7
Source: New York Fed Consumer Credit Panel / Equifax
22
21
46
3
2
23
44
32
45
53
5
9
55
4
47
51
1
54
50
31
42
52
39
10
43
24
28
35
8
48
36
40
41
16
6
37
27
33
17
711
38
49
30
25
20
26
29
15
19
34
12
18
14
13
Percentage of Borrowers in Delinquent Status
0% - 2%
2% - 4%
4% - 6%
6% - 8%
>8%
Percent of Student Loan Borrowers 90+ Days Past Due on Student Loans by Community DistrictFigure 8
22
21
46
3
2
23
44
32
45
53
5
9
55
4
47
51
1
54
50
31
42
52
39
10
43
24
28
35
8
48
36
40
41
16
6
37
27
33
17
711
38
49
30
25
20
26
29
15
19
34
12
18
14
13
Percentage of Borrowers in Delinquent Status
0% - 2%
2% - 4%
4% - 6%
6% - 8%
>8%
0% - 2%
>2% - 4%
>4% - 6%
>6% - 8%
>8%
Source: New York Fed Consumer Credit Panel / Equifax
(2016Q4)
(2016Q4)
See Index of Community Districts

11
Among student loan borrowers, Brooklyn and the Bronx has high concentrations of defaulted borrowers. The five community districts with the highest borrower default rates are (see map below for all PUMAs): Bronx CD 3 and 6 (Belmont, Crotona Park East and East Tremont) -- 16%; Bronx CD 1 and 2 (Hunts Point, Longwood and Melrose) -- 15%; Bronx CD 4 (Concourse, Highbridge & Mount Eden) --15%; Brooklyn CD 16 (Brownsville and Ocean Hill) --14%; and Bronx CD 5 (Morris Heights, Fordham South, and Mount Hope) -- 14%. These findings have implications for overall community financial health in Brooklyn and the Bronx. Residents who have defaulted on student debt are likely to have difficulty accessing credit to cover emergency expenses or start a small business, for example. Defaulted federal loans may also be collected through wage or tax refund garnishment, leading to further financial insecurity among those borrowers.
Percent of NYC Student Loan Borrowers Who Have Ever Defaulted as of 2016Q4, by Neighborhood Income
25%
20%
15%
10%
5%
0%
less t
han $
35,900
$35,901-
$45,800
$45,801-
$56,300
$56,301-
$72,300
greate
r than
$72
,301
DefaultBorrowers who live in lower-income areas are also more likely to default, which is defined as becoming 270 days delinquent on student loan payments. As described, we do not have income data at the borrower level and use Zip Code income from the IRS. Borrowers in the lowest quintile are twice as likely to have ever defaulted as those in the highest income quintile (Figure 9). Even though low-income borrowers typically have smaller loan balances, they are also more likely to default due to nonpayment of their balances.
Figure 9
Source: New York Fed Consumer Credit Panel / Equifax
Average Zip Code
Income
12
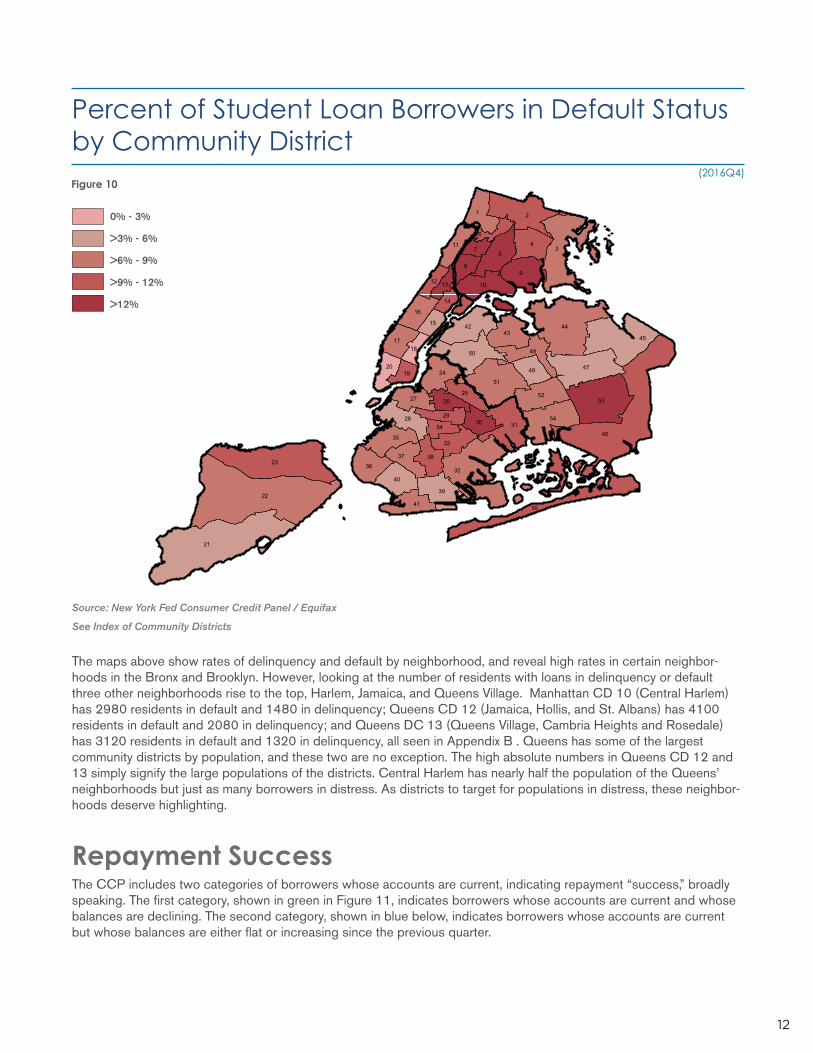
The maps above show rates of delinquency and default by neighborhood, and reveal high rates in certain neighbor-hoods in the Bronx and Brooklyn. However, looking at the number of residents with loans in delinquency or default three other neighborhoods rise to the top, Harlem, Jamaica, and Queens Village. Manhattan CD 10 (Central Harlem) has 2980 residents in default and 1480 in delinquency; Queens CD 12 (Jamaica, Hollis, and St. Albans) has 4100 residents in default and 2080 in delinquency; and Queens DC 13 (Queens Village, Cambria Heights and Rosedale) has 3120 residents in default and 1320 in delinquency, all seen in Appendix B . Queens has some of the largest community districts by population, and these two are no exception. The high absolute numbers in Queens CD 12 and 13 simply signify the large populations of the districts. Central Harlem has nearly half the population of the Queens’ neighborhoods but just as many borrowers in distress. As districts to target for populations in distress, these neighbor-hoods deserve highlighting.
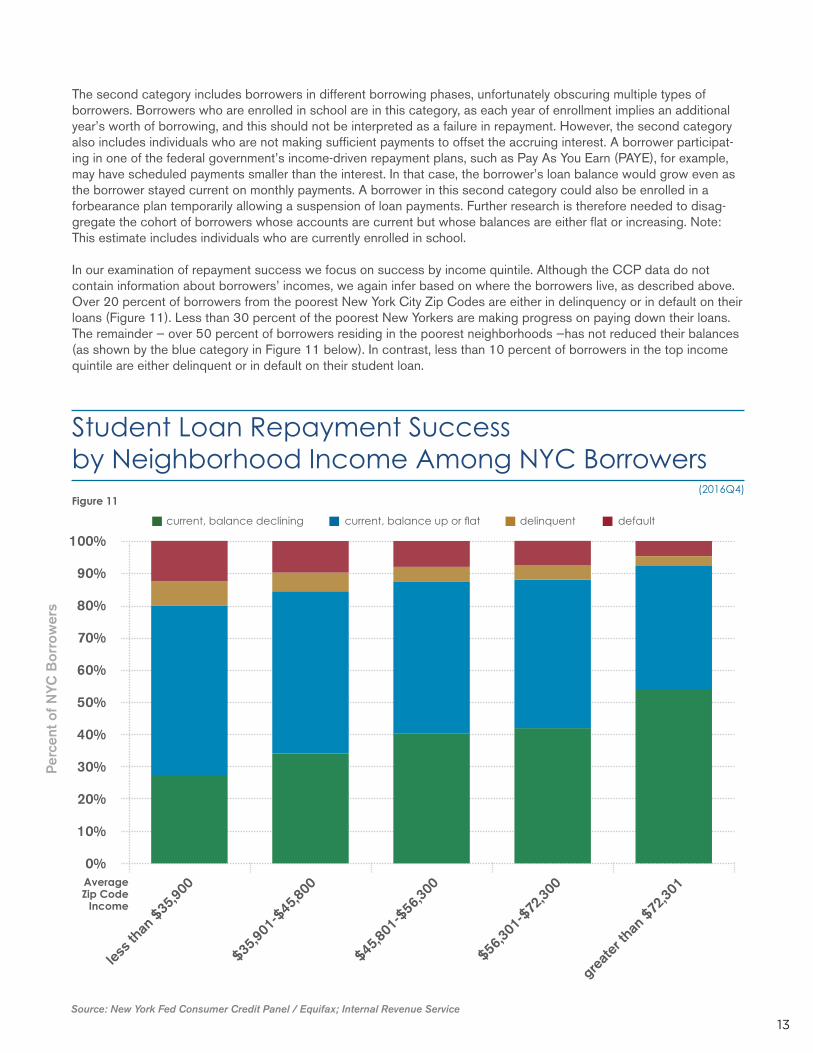
Repayment SuccessThe CCP includes two categories of borrowers whose accounts are current, indicating repayment “success,” broadly speaking. The first category, shown in green in Figure 11, indicates borrowers whose accounts are current and whose balances are declining. The second category, shown in blue below, indicates borrowers whose accounts are current but whose balances are either flat or increasing since the previous quarter.
22
21
46
3
2
23
44
32
45
53
5
9
55
4
47
51
1
54
50
31
42
52
39
10
43
24
28
35
8
48
36
40
41
16
6
37
27
33
17
711
38
49
30
25
20
26
29
15
19
34
12
18
14
13
Percentage of Borrowers in Default Status
0% - 3%
3% - 6%
6% - 9%
9% - 12%
>12%
Figure 10
Percent of Student Loan Borrowers in Default Status by Community District
22
21
46
3
2
23
44
32
45
53
5
9
55
4
47
51
1
54
50
31
42
52
39
10
43
24
28
35
8
48
36
40
41
16
6
37
27
33
17
711
38
49
30
25
20
26
29
15
19
34
12
18
14
13
Percentage of Borrowers in Default Status
0% - 3%
3% - 6%
6% - 9%
9% - 12%
>12%
0% - 3%
>3% - 6%
>6% - 9%
>9% - 12%
>12%
Source: New York Fed Consumer Credit Panel / Equifax
(2016Q4)
See Index of Community Districts
13
The second category includes borrowers in different borrowing phases, unfortunately obscuring multiple types of borrowers. Borrowers who are enrolled in school are in this category, as each year of enrollment implies an additional year’s worth of borrowing, and this should not be interpreted as a failure in repayment. However, the second category also includes individuals who are not making sufficient payments to offset the accruing interest. A borrower participat-ing in one of the federal government’s income-driven repayment plans, such as Pay As You Earn (PAYE), for example, may have scheduled payments smaller than the interest. In that case, the borrower’s loan balance would grow even as the borrower stayed current on monthly payments. A borrower in this second category could also be enrolled in a forbearance plan temporarily allowing a suspension of loan payments. Further research is therefore needed to disag-gregate the cohort of borrowers whose accounts are current but whose balances are either flat or increasing. Note: This estimate includes individuals who are currently enrolled in school.
In our examination of repayment success we focus on success by income quintile. Although the CCP data do not contain information about borrowers’ incomes, we again infer based on where the borrowers live, as described above. Over 20 percent of borrowers from the poorest New York City Zip Codes are either in delinquency or in default on their loans (Figure 11). Less than 30 percent of the poorest New Yorkers are making progress on paying down their loans. The remainder — over 50 percent of borrowers residing in the poorest neighborhoods —has not reduced their balances (as shown by the blue category in Figure 11 below). In contrast, less than 10 percent of borrowers in the top income quintile are either delinquent or in default on their student loan.
Student Loan Repayment Success by Neighborhood Income Among NYC Borrowers
100%
90%
80%
70%
60%
50%
40%
30%
20%
10%
0%
less t
han $
35,900
$35,901-
$45,800
$45,801-
$56,300
$56,301-
$72,300
greate
r than
$72
,301
current, balance up or flat defaultdelinquentcurrent, balance declining
Perc
ent o
f NYC
Bor
row
ers
Figure 11
Source: New York Fed Consumer Credit Panel / Equifax; Internal Revenue Service
(2016Q4)
Average Zip Code
Income

14
Number of Delinquent and Defaulted Student Loan Borrowers in NYC by Outstanding Balance and Neighborhood Income
Figure 12 below describes the number of borrowers who are delinquent or in default status in each income quintile, as well as the size of their loan balances. As shown already, and as we may expect, the lowest income Zip Codes have the greatest number of borrowers in distress. But equally striking is the fact that nearly 25 percent of these low-income borrowers owe less than $5,000 on their student loans. This large cohort calls out for more research as to how such small loan amounts are wreaking havoc on borrowers’ credit, especially among individuals who may not have finished their degrees.
45
40
35
30
25
20
15
10
5
0
less t
han $
35,900
$35,901-
$45,800
$45,801-
$56,300
$56,301-
$72,300
greate
r than
$72
, 301
$50k-$100k $10k-$25k $5k-$10k <$5k$25k-$50k$100k+
Tho
usa
nd
s o
f Bo
rro
we
rs
Figure 12
Source: New York Fed Consumer Credit Panel / Equifax; Internal Revenue Service
Student Loan Balance Outstanding
(2016Q4)
Average Zip Code
Income

15
While this may be surprising, one key reason for this finding is that younger borrowers are still in the borrowing phase of their loans and are not yet in the repayment cycle. Further, the fact that defaulted student loan debt balances cannot be discharged in bankruptcy means that the pool of stagnant defaulted debts grows with age, inflating the delinquency rates. Additionally, older student loan borrowers may still be in the pool because they have been delinquent and not yet successfully repaid their loans.
Delinquency and Default by AgeAs mentioned in the introduction, older borrowers (those 45 and older) have higher delinquency rates than younger borrowers, who are more likely to be enrolled in school or eligible for income-based repayment plans that limit a borrow-er’s monthly payments. There is some variation in delinquency and default rates broken out by the age of the borrower, and delinquency rates increase with age, with only a small decline among borrowers 55 or older (Figure 13).
Percent of Balance 90+ Days Delinquent by Borrower Age in NYC
16%
14%
12%
10%
8%
6%
4%
2%
0%
<25 25-34 35-44 45-54 55+Age of Borrower
Figure 13
Source: New York Fed Consumer Credit Panel / Equifax
(2016Q4)

16
Student Loan Repayment Status by Borrower Age in NYC
100%
90%
80%
70%
60%
50%
40%
30%
20%
10%
0%
current, balance up or flat defaultdelinquentcurrent, balance declining
<25 25-34 35-44 45-54 55+
Figure 14
Source: New York Fed Consumer Credit Panel / Equifax
Age of Borrower
(2016Q4)
In Figure 14, we disaggregate borrowers into their repayment status by their age group, using the same repayment statuses described above. For the younger borrowers, the large blue share stands out, with 77 percent of borrowers 18-24 experiencing increasing loan balances. This reflects the fact that college-age adults are likely still enrolled. As it takes more than a year from the last enrollment for a borrower to default, the very small share of borrowers in default among the youngest borrowers is mostly because too little time has elapsed since leaving college.
The high delinquency rate observed in older borrowers is partly due to selection, such that some older borrowers are left with loans perhaps taken out for their own educations but left in delinquent status for many years. Additionally, a limitation exists in the data such that we cannot observe whether an individual has borrowed for his or her own educa-tion or to finance the education of his or her children (with a Parent PLUS loan, for example). Parent PLUS loans have higher interest rates and fewer, less borrower-friendly income-based repayment options, so can be onerous for parent borrowers. The surprising dip in borrowers in repayment among 45 to 54 year olds may be due to co-signing on private loans or loans taken out through the federal Parent PLUS program. Further research is therefore needed to understand the specific profile of older borrowers in New York City.

17
ConclusionThis report, the first to provide a comprehensive examination of student loan debt across New York City (or indeed any single U.S. city) at a neighborhood level, provides insight into areas likely to be of interest to policymakers, advocates, and others. Acute student loan-connected financial distress, as measured by the default rate, is troublingly high among New Yorkers from the poorest neighborhoods. We hope that this report will serve as a foundation for policymakers and other stakeholders to develop pragmatic solutions that can provide relief to struggling borrowers. Our findings here suggest that lower-income areas have disproportionately high delinquency and default rates. Borrowers in these areas may benefit from programs designed to educate troubled borrowers on the repayment programs for which they may be eligible and assist them with enrollment, with the goal of curing delinquent and defaulted loans that continue to dam-age city residents’ credit reports. Such an intervention would enable these New Yorkers to access credit in the future. Further, providing more comprehensive information about student loans at the time of origination may assist new students with making sensible decisions about their borrowing. As noted above, opportunities for further research abound and can provide a more detailed picture of New York borrowers.
18
22
21
46
3
2
23
44
32
45
53
5
9
55
4
47
51
1
54
50
31
42
52
39
10
43
24
28
35
8
48
36
40
41
16
6
37
27
33
17
711
38
49
30
25
20
26
29
15
19
34
12
18
14
13
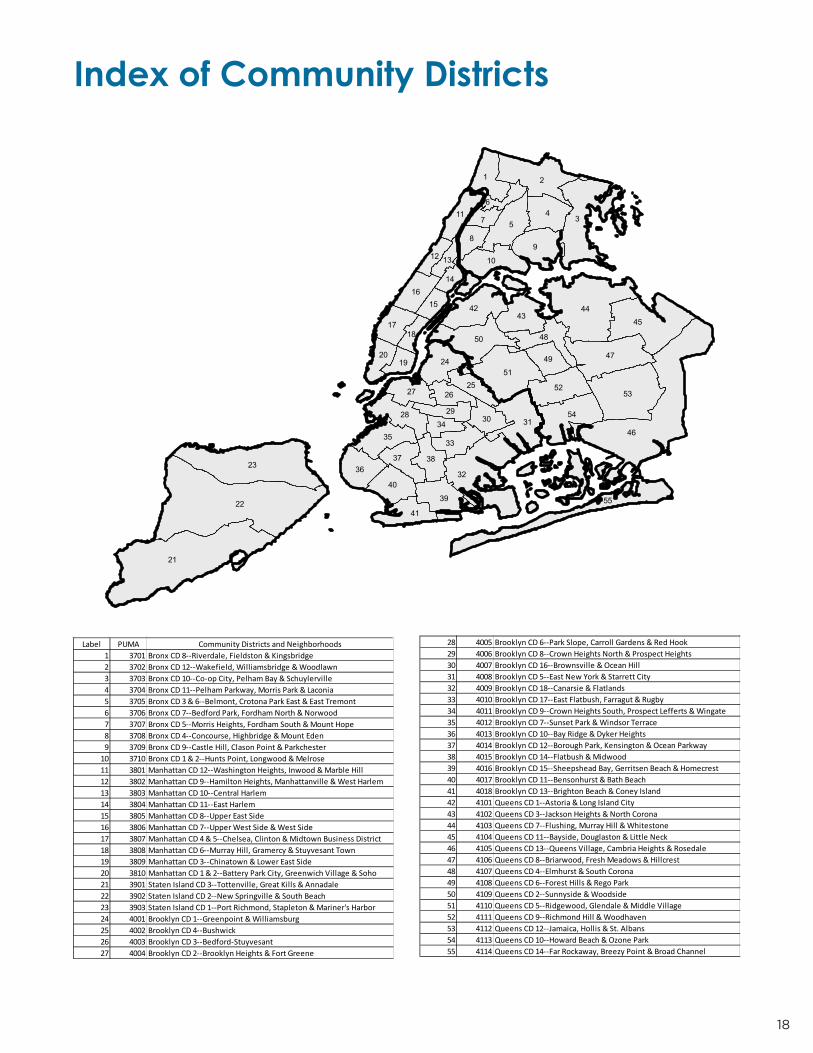
Label PUMA Community Districts and Neighborhoods1 3701 Bronx CD 8--Riverdale, Fieldston & Kingsbridge2 3702 Bronx CD 12--Wakefield, Williamsbridge & Woodlawn3 3703 Bronx CD 10--Co-op City, Pelham Bay & Schuylerville4 3704 Bronx CD 11--Pelham Parkway, Morris Park & Laconia5 3705 Bronx CD 3 & 6--Belmont, Crotona Park East & East Tremont6 3706 Bronx CD 7--Bedford Park, Fordham North & Norwood7 3707 Bronx CD 5--Morris Heights, Fordham South & Mount Hope8 3708 Bronx CD 4--Concourse, Highbridge & Mount Eden9 3709 Bronx CD 9--Castle Hill, Clason Point & Parkchester
10 3710 Bronx CD 1 & 2--Hunts Point, Longwood & Melrose11 3801 Manhattan CD 12--Washington Heights, Inwood & Marble Hill12 3802 Manhattan CD 9--Hamilton Heights, Manhattanville & West Harlem13 3803 Manhattan CD 10--Central Harlem14 3804 Manhattan CD 11--East Harlem15 3805 Manhattan CD 8--Upper East Side16 3806 Manhattan CD 7--Upper West Side & West Side17 3807 Manhattan CD 4 & 5--Chelsea, Clinton & Midtown Business District18 3808 Manhattan CD 6--Murray Hill, Gramercy & Stuyvesant Town19 3809 Manhattan CD 3--Chinatown & Lower East Side20 3810 Manhattan CD 1 & 2--Battery Park City, Greenwich Village & Soho21 3901 Staten Island CD 3--Tottenville, Great Kills & Annadale22 3902 Staten Island CD 2--New Springville & South Beach23 3903 Staten Island CD 1--Port Richmond, Stapleton & Mariner's Harbor24 4001 Brooklyn CD 1--Greenpoint & Williamsburg25 4002 Brooklyn CD 4--Bushwick26 4003 Brooklyn CD 3--Bedford-Stuyvesant27 4004 Brooklyn CD 2--Brooklyn Heights & Fort Greene28 4005 Brooklyn CD 6--Park Slope, Carroll Gardens & Red Hook29 4006 Brooklyn CD 8--Crown Heights North & Prospect Heights30 4007 Brooklyn CD 16--Brownsville & Ocean Hill31 4008 Brooklyn CD 5--East New York & Starrett City32 4009 Brooklyn CD 18--Canarsie & Flatlands33 4010 Brooklyn CD 17--East Flatbush, Farragut & Rugby34 4011 Brooklyn CD 9--Crown Heights South, Prospect Lefferts & Wingate35 4012 Brooklyn CD 7--Sunset Park & Windsor Terrace36 4013 Brooklyn CD 10--Bay Ridge & Dyker Heights37 4014 Brooklyn CD 12--Borough Park, Kensington & Ocean Parkway38 4015 Brooklyn CD 14--Flatbush & Midwood39 4016 Brooklyn CD 15--Sheepshead Bay, Gerritsen Beach & Homecrest40 4017 Brooklyn CD 11--Bensonhurst & Bath Beach41 4018 Brooklyn CD 13--Brighton Beach & Coney Island42 4101 Queens CD 1--Astoria & Long Island City43 4102 Queens CD 3--Jackson Heights & North Corona44 4103 Queens CD 7--Flushing, Murray Hill & Whitestone45 4104 Queens CD 11--Bayside, Douglaston & Little Neck46 4105 Queens CD 13--Queens Village, Cambria Heights & Rosedale47 4106 Queens CD 8--Briarwood, Fresh Meadows & Hillcrest48 4107 Queens CD 4--Elmhurst & South Corona49 4108 Queens CD 6--Forest Hills & Rego Park50 4109 Queens CD 2--Sunnyside & Woodside51 4110 Queens CD 5--Ridgewood, Glendale & Middle Village52 4111 Queens CD 9--Richmond Hill & Woodhaven53 4112 Queens CD 12--Jamaica, Hollis & St. Albans54 4113 Queens CD 10--Howard Beach & Ozone Park55 4114 Queens CD 14--Far Rockaway, Breezy Point & Broad Channel
22
21
46
3
2
23
44
32
45
53
5
9
55
4
47
51
1
54
50
31
42
52
39
10
43
24
28
35
8
48
36
40
41
16
6
37
27
33
17
711
38
49
30
25
20
26
29
15
19
34
12
18
14
13
Label PUMA Community Districts and Neighborhoods1 3701 Bronx CD 8--Riverdale, Fieldston & Kingsbridge2 3702 Bronx CD 12--Wakefield, Williamsbridge & Woodlawn3 3703 Bronx CD 10--Co-op City, Pelham Bay & Schuylerville4 3704 Bronx CD 11--Pelham Parkway, Morris Park & Laconia5 3705 Bronx CD 3 & 6--Belmont, Crotona Park East & East Tremont6 3706 Bronx CD 7--Bedford Park, Fordham North & Norwood7 3707 Bronx CD 5--Morris Heights, Fordham South & Mount Hope8 3708 Bronx CD 4--Concourse, Highbridge & Mount Eden9 3709 Bronx CD 9--Castle Hill, Clason Point & Parkchester
10 3710 Bronx CD 1 & 2--Hunts Point, Longwood & Melrose11 3801 Manhattan CD 12--Washington Heights, Inwood & Marble Hill12 3802 Manhattan CD 9--Hamilton Heights, Manhattanville & West Harlem13 3803 Manhattan CD 10--Central Harlem14 3804 Manhattan CD 11--East Harlem15 3805 Manhattan CD 8--Upper East Side16 3806 Manhattan CD 7--Upper West Side & West Side17 3807 Manhattan CD 4 & 5--Chelsea, Clinton & Midtown Business District18 3808 Manhattan CD 6--Murray Hill, Gramercy & Stuyvesant Town19 3809 Manhattan CD 3--Chinatown & Lower East Side20 3810 Manhattan CD 1 & 2--Battery Park City, Greenwich Village & Soho21 3901 Staten Island CD 3--Tottenville, Great Kills & Annadale22 3902 Staten Island CD 2--New Springville & South Beach23 3903 Staten Island CD 1--Port Richmond, Stapleton & Mariner's Harbor24 4001 Brooklyn CD 1--Greenpoint & Williamsburg25 4002 Brooklyn CD 4--Bushwick26 4003 Brooklyn CD 3--Bedford-Stuyvesant27 4004 Brooklyn CD 2--Brooklyn Heights & Fort Greene28 4005 Brooklyn CD 6--Park Slope, Carroll Gardens & Red Hook29 4006 Brooklyn CD 8--Crown Heights North & Prospect Heights30 4007 Brooklyn CD 16--Brownsville & Ocean Hill31 4008 Brooklyn CD 5--East New York & Starrett City32 4009 Brooklyn CD 18--Canarsie & Flatlands33 4010 Brooklyn CD 17--East Flatbush, Farragut & Rugby34 4011 Brooklyn CD 9--Crown Heights South, Prospect Lefferts & Wingate35 4012 Brooklyn CD 7--Sunset Park & Windsor Terrace36 4013 Brooklyn CD 10--Bay Ridge & Dyker Heights37 4014 Brooklyn CD 12--Borough Park, Kensington & Ocean Parkway38 4015 Brooklyn CD 14--Flatbush & Midwood39 4016 Brooklyn CD 15--Sheepshead Bay, Gerritsen Beach & Homecrest40 4017 Brooklyn CD 11--Bensonhurst & Bath Beach41 4018 Brooklyn CD 13--Brighton Beach & Coney Island42 4101 Queens CD 1--Astoria & Long Island City43 4102 Queens CD 3--Jackson Heights & North Corona44 4103 Queens CD 7--Flushing, Murray Hill & Whitestone45 4104 Queens CD 11--Bayside, Douglaston & Little Neck46 4105 Queens CD 13--Queens Village, Cambria Heights & Rosedale47 4106 Queens CD 8--Briarwood, Fresh Meadows & Hillcrest48 4107 Queens CD 4--Elmhurst & South Corona49 4108 Queens CD 6--Forest Hills & Rego Park50 4109 Queens CD 2--Sunnyside & Woodside51 4110 Queens CD 5--Ridgewood, Glendale & Middle Village52 4111 Queens CD 9--Richmond Hill & Woodhaven53 4112 Queens CD 12--Jamaica, Hollis & St. Albans54 4113 Queens CD 10--Howard Beach & Ozone Park55 4114 Queens CD 14--Far Rockaway, Breezy Point & Broad Channel
Index of Community Districts

19
Appendix A: Repayment Success by NYC Community District
current, balance same or up defaultdelinquentcurrent, balance declining
Bronx CD 1 & 2--Hunts Point, Longwood & MelroseBronx CD 3 & 6--Belmont, Crotona Park East & East Tremont
Bronx CD 4--Concourse, Highbridge & Mount EdenBronx CD 5--Morris Heights, Fordham South & Mount Hope
Bronx CD 7--Bedford Park, Fordham North & NorwoodBronx CD 8--Riverdale, Fieldston & Kingsbridge
Bronx CD 9--Castle Hill, Clason Point & ParkchesterBronx CD 10--Co-op City, Pelham Bay & SchuylervilleBronx CD 11--Pelham Parkway, Morris Park & LaconiaBronx CD 12--Wakefield, Williamsbridge & Woodlawn
Brooklyn CD 1--Greenpoint & WilliamsburgBrooklyn CD 2--Brooklyn Heights & Fort Greene
Brooklyn CD 3--Bedford-StuyvesantBrooklyn CD 4--Bushwick
Brooklyn CD 5--East New York & Starrett CityBrooklyn CD 6--Park Slope, Carroll Gardens & Red Hook
Brooklyn CD 7--Sunset Park & Windsor TerraceBrooklyn CD 8--Crown Heights North & Prospect Heights
Brooklyn CD 9--Crown Heights South, Prospect Lefferts & WingateBrooklyn CD 10--Bay Ridge & Dyker HeightsBrooklyn CD 11--Bensonhurst & Bath Beach
Brooklyn CD 12--Borough Park, Kensington & Ocean ParkwayBrooklyn CD 13--Brighton Beach & Coney Island
Brooklyn CD 14--Flatbush & MidwoodBrooklyn CD 15--Sheepshead Bay, Gerritsen Beach & Homecrest
Brooklyn CD 16--Brownsville & Ocean HillBrooklyn CD 17--East Flatbush, Farragut & Rugby
Brooklyn CD 18--Canarsie & Flatlands
Manhattan CD 1 & 2--Battery Park City, Greenwich Village & SohoManhattan CD 3--Chinatown & Lower East Side
Manhattan CD 4 & 5--Chelsea, Clinton & Midtown Business DistrictManhattan CD 6--Murray Hill, Gramercy & Stuyvesant Town
Manhattan CD 7--Upper West Side & West SideManhattan CD 8--Upper East Side
Manhattan CD 9--Hamilton Heights, Manhattanville & West HarlemManhattan CD 10--Central Harlem
Manhattan CD 11--East HarlemManhattan CD 12--Washington Heights, Inwood & Marble Hill
Queens CD 1--Astoria & Long Island CityQueens CD 2--Sunnyside & Woodside
Queens CD 3--Jackson Heights & North CoronaQueens CD 4--Elmhurst & South Corona
Queens CD 5--Ridgewood, Glendale & Middle VillageQueens CD 6--Forest Hills & Rego Park
Queens CD 7--Flushing, Murray Hill & WhitestoneQueens CD 8--Briarwood, Fresh Meadows & Hillcrest
Queens CD 9--Richmond Hill & WoodhavenQueens CD 10--Howard Beach & Ozone Park
Queens CD 11--Bayside, Douglaston & Little NeckQueens CD 12--Jamaica, Hollis & St. Albans
Queens CD 13--Queens Village, Cambria Heights & RosedaleQueens CD 14--Far Rockaway, Breezy Point & Broad Channel
Staten Island CD 1--Port Richmond, Stapleton & Mariner’s HarborStaten Island CD 2--New Springville & South Beach
Staten Island CD 3--Tottenville, Great Kills & Annadale
100%90%80%70%60%50%40%30%20%10%0%
Source: New York Fed Consumer Credit Panel / Equifax

20
borrowers - defaultborrowers - delinquent
Bronx CD 1 & 2--Hunts Point, Longwood & MelroseBronx CD 3 & 6--Belmont, Crotona Park East & East Tremont
Bronx CD 4--Concourse, Highbridge & Mount EdenBronx CD 5--Morris Heights, Fordham South & Mount Hope
Bronx CD 7--Bedford Park, Fordham North & NorwoodBronx CD 8--Riverdale, Fieldston & Kingsbridge
Bronx CD 9--Castle Hill, Clason Point & ParkchesterBronx CD 10--Co-op City, Pelham Bay & SchuylervilleBronx CD 11--Pelham Parkway, Morris Park & LaconiaBronx CD 12--Wakefield, Williamsbridge & Woodlawn
Brooklyn CD 1--Greenpoint & WilliamsburgBrooklyn CD 2--Brooklyn Heights & Fort Greene
Brooklyn CD 3--Bedford-StuyvesantBrooklyn CD 4--Bushwick
Brooklyn CD 5--East New York & Starrett CityBrooklyn CD 6--Park Slope, Carroll Gardens & Red Hook
Brooklyn CD 7--Sunset Park & Windsor TerraceBrooklyn CD 8--Crown Heights North & Prospect Heights
Brooklyn CD 9--Crown Heights South, Prospect Lefferts & WingateBrooklyn CD 10--Bay Ridge & Dyker HeightsBrooklyn CD 11--Bensonhurst & Bath Beach
Brooklyn CD 12--Borough Park, Kensington & Ocean ParkwayBrooklyn CD 13--Brighton Beach & Coney Island
Brooklyn CD 14--Flatbush & MidwoodBrooklyn CD 15--Sheepshead Bay, Gerritsen Beach & Homecrest
Brooklyn CD 16--Brownsville & Ocean HillBrooklyn CD 17--East Flatbush, Farragut & Rugby
Brooklyn CD 18--Canarsie & Flatlands
Manhattan CD 1 & 2--Battery Park City, Greenwich Village & SohoManhattan CD 3--Chinatown & Lower East Side
Manhattan CD 4 & 5--Chelsea, Clinton & Midtown Business DistrictManhattan CD 6--Murray Hill, Gramercy & Stuyvesant Town
Manhattan CD 7--Upper West Side & West SideManhattan CD 8--Upper East Side
Manhattan CD 9--Hamilton Heights, Manhattanville & West HarlemManhattan CD 10--Central Harlem
Manhattan CD 11--East HarlemManhattan CD 12--Washington Heights, Inwood & Marble Hill
Queens CD 1--Astoria & Long Island CityQueens CD 2--Sunnyside & Woodside
Queens CD 3--Jackson Heights & North CoronaQueens CD 4--Elmhurst & South Corona
Queens CD 5--Ridgewood, Glendale & Middle VillageQueens CD 6--Forest Hills & Rego Park
Queens CD 7--Flushing, Murray Hill & WhitestoneQueens CD 8--Briarwood, Fresh Meadows & Hillcrest
Queens CD 9--Richmond Hill & WoodhavenQueens CD 10--Howard Beach & Ozone Park
Queens CD 11--Bayside, Douglaston & Little NeckQueens CD 12--Jamaica, Hollis & St. Albans
Queens CD 13--Queens Village, Cambria Heights & RosedaleQueens CD 14--Far Rockaway, Breezy Point & Broad Channel
Staten Island CD 1--Port Richmond, Stapleton & Mariner’s HarborStaten Island CD 2--New Springville & South Beach
Staten Island CD 3--Tottenville, Great Kills & Annadale
Source: New York Fed Consumer Credit Panel / Equifax
Appendix B: Number of Borrowers in Delinquency and Default by NYC Community District
1000 2000 3000 4000 5000 6000 70000%