student housing trends - boston
TRANSCRIPT
Student Housing Trends: 2018 to 2019 School Year
1
STUDENT HOUSING TRENDS2018 TO 2019 SCHOOL YEAR
EXECUTIVE SUMMARY
Boston has more than 150,000 undergraduate and graduate students, excluding those studying at community colleges. This large number of students places enormous strain on the city’s residential housing market and contributes to higher housing costs for Boston’s workforce. In Housing a Changing City: Boston 2030, the Walsh Administration outlined three goals to combat this issue:
1. Create 18,500 new dormitory beds by the end of 2030.1
2. Reduce the number of undergraduates living off-campus by 50 percent.2
3. Ensure that all students reside in safe and suitable housing.
1 The City’s 18,500 dorm-bed goal includes 16,000 beds for undergraduates and 2,500 for graduates.
2 In Housing a Changing City: Boston 2030, the gross off-campus count was 20,600. Given data revisions and the addition of six new schools added to the original 2013 dataset, this number has been revised to 25,508. This would mean the gross off-campus count needs to drop to 12,754 or lower to meet this goal.
NEIGHBORHOOD DEVELOPMENT
Student Housing Trends: 2018 to 2019 School Year
2
The Annual Student Housing Report provides an overview of the trends in student housing and the impact they have on the local housing market. Boston-based colleges and universities submit University Accountability Reports, which provide student-related data and are the basis of this report.3 Among the key findings are:
• Total student enrollment was 150,113 in 2019, an increase of just over 5,300(3.7 percent) since 2013. This is 300 fewer students than last year.
• The growth in graduate student enrollment continues to outpaceundergraduate enrollment. Graduate enrollment has grown by 10.5 percentsince 2013, while undergraduate enrollment has declined by 0.1 percent.
• Although enrollment has remained stagnant since 2013, the number ofundergraduate students housed on-campus has increased by just over 4,000students (10 percent).
• Boston-based higher education institutions house 62.8 percent of full-timeundergraduate students on campus.
• Almost 36,300 students live in Boston private housing stock. This numberhas decreased by over 1,100 since last year. Slightly over 19,000 of thesestudents are undergraduates.
• More than 6,100 undergraduate dorm-beds were built between 2014 and2019. Over 1,100 were built in 2019.
• Over 500 net dorm-beds (total new dorm-beds factoring in demolitions) arecurrently under review.
• Just over 10,500 net dorm-beds need to be built for the city to reach its18,500 dorm-bed goal.
Despite significant progress, challenges remain. Over 17,500 students currently occupy private single-family, two-family, or three-family homes and condominiums within the city. Every unit inhabited by students shrinks the pool of housing available for Boston’s workforce. This increases the pressure on Boston’s supply of unsubsidized middle-income housing.
3 As required by Boston’s University Accountability ordinance, all Boston-based universities and colleges must submit a report to the City each year providing detailed data on the students enrolled in their school, including data on whether they are living on-campus or off-campus.
NEIGHBORHOOD DEVELOPMENT
Student Housing Trends: 2018 to 2019 School Year
3
ENROLLMENT TRENDS
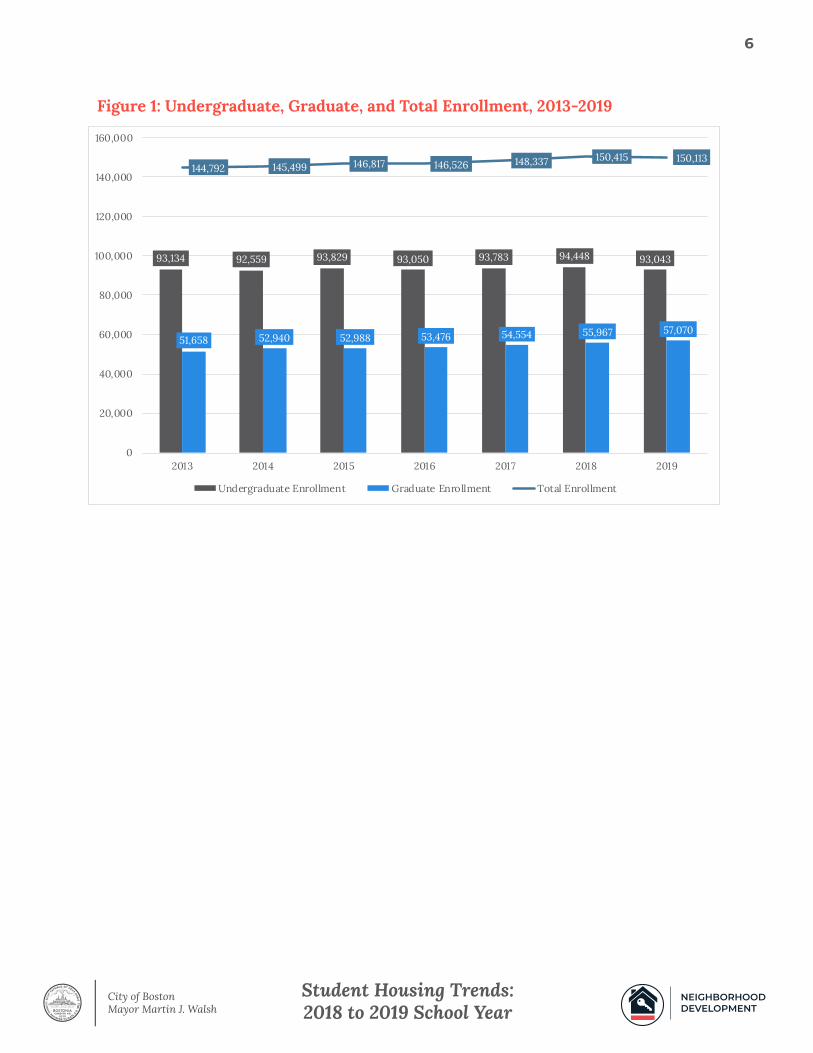
Using data from the 2013 fall semester, the 2014 Housing a Changing City: Boston 2030 comprehensive housing plan established the baseline as Boston’s student housing report. Since 2013, overall enrollment has been trending upward at Boston’s colleges and universities, peaking in 2018 at 150,415 students.
Total enrollment has increased by 5,321 students (3.7 percent) since 2013, a 0.61 percent annual growth rate. This rate is below the 1.4 percent yearly rate of growth seen from 1995-2010.4 The enrollment increase is primarily led by graduate students, which grew by just over 5,400 students (10.5 percent) since 2013. Undergraduate student enrollment has remained virtually stagnant. Since 2013, it has decreased by just 91 students (0.1 percent) (see Appendix Table B1).
It is estimated that growth in graduate enrollment has been rapidly outpacing any growth in undergraduate enrollment since approximately 1995. Graduate housing remains in short supply.5 On-campus housing is typically very limited for graduate students; it is estimated that 60 percent of them reside in private housing. Boston University and Northeastern University account for half of the graduate students living in private housing.
Between 2013 and 2019, Northeastern grew by slightly more than 6,300 students (24.1 percent). Nearly 5,300 (84 percent) were graduate students. Northeastern’s growth accounts for much of the increase in Boston’s student population, which otherwise would have declined by just over 1,000 students (1 percent), due to stagnant undergraduate student enrollment growth and school mergers.
4 Refer to Boston 2030, page 75. Total percentage growth from 1995-2010 was 21 percent, or 1.4 percent per year.
5 Refer to Boston 2030, page 76.
NEIGHBORHOOD DEVELOPMENT
Student Housing Trends: 2018 to 2019 School Year
4
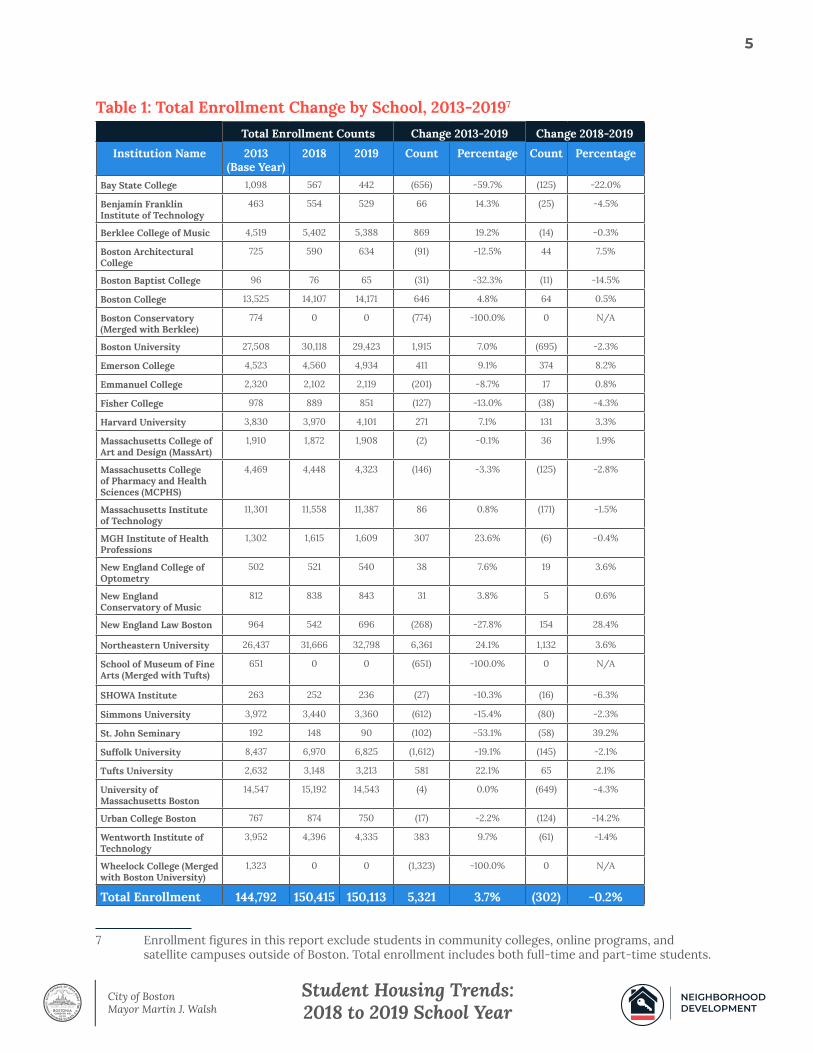
Table 1, on the next page, provides a breakdown of the total enrollment figures for each school.
In 2016, Tufts University acquired the School of the Museum of Fine Arts and Berklee College of Music acquired Boston Conservatory. In 2018 Boston University acquired Wheelock College. All schools are reported separately until 2018. Due to these mergers, in Table 1, the three acquired colleges show no students in the 2018 and 2019 columns.
Between 2018 and 2019, enrollment decreased by 302 undergraduate students (0.2 percent), the second reported decline since the City of Boston started reporting this data. Over the past year, only Northeastern has had significant enrollment growth, increasing by just over 1,100 students (3.6 percent). This is a smaller increase than their previous year-over-year growth of 4.3 percent. Enrollment declined at both Boston University and the University of Massachusetts Boston, by 695 and 649 students, respectively.
Notable national trends impacting the education sector such as declining undergraduate enrollment, falling birth rates, rising operation costs, and school closures all impact Boston.6
Enrollments will likely continue to decline unless higher education institutions increase their graduate program capacity or attract international and out-of-state students. This decline in undergraduate enrollment provides the city with an opportunity to quickly reduce the dorm-bed gap, which is discussed in the new on-campus housing section of this report.
6 Refer to the Boston Economy 2019 Report by the Boston Planning and Development Agency (BPDA), pages 39-54.
Note: Larger versions of the figures and charts in this report may be viewed by clicking on them.
NEIGHBORHOOD DEVELOPMENT
Student Housing Trends: 2018 to 2019 School Year
5
Table 1: Total Enrollment Change by School, 2013-20197
7 Enrollment figures in this report exclude students in community colleges, online programs, and satellite campuses outside of Boston. Total enrollment includes both full-time and part-time students.
Total Enrollment Counts Change 2013-2019 Change 2018-2019
Institution Name 2013 (Base Year)
2018 2019 Count Percentage Count Percentage
Bay State College 1,098 567 442 (656) -59.7% (125) -22.0%
Benjamin Franklin Institute of Technology
463 554 529 66 14.3% (25) -4.5%
Berklee College of Music 4,519 5,402 5,388 869 19.2% (14) -0.3%
Boston Architectural College
725 590 634 (91) -12.5% 44 7.5%
Boston Baptist College 96 76 65 (31) -32.3% (11) -14.5%
Boston College 13,525 14,107 14,171 646 4.8% 64 0.5%
Boston Conservatory (Merged with Berklee)
774 0 0 (774) -100.0% 0 N/A
Boston University 27,508 30,118 29,423 1,915 7.0% (695) -2.3%
Emerson College 4,523 4,560 4,934 411 9.1% 374 8.2%
Emmanuel College 2,320 2,102 2,119 (201) -8.7% 17 0.8%
Fisher College 978 889 851 (127) -13.0% (38) -4.3%
Harvard University 3,830 3,970 4,101 271 7.1% 131 3.3%
Massachusetts College of Art and Design (MassArt)
1,910 1,872 1,908 (2) -0.1% 36 1.9%
Massachusetts College of Pharmacy and Health Sciences (MCPHS)
4,469 4,448 4,323 (146) -3.3% (125) -2.8%
Massachusetts Institute of Technology
11,301 11,558 11,387 86 0.8% (171) -1.5%
MGH Institute of Health Professions
1,302 1,615 1,609 307 23.6% (6) -0.4%
New England College of Optometry
502 521 540 38 7.6% 19 3.6%
New England Conservatory of Music
812 838 843 31 3.8% 5 0.6%
New England Law Boston 964 542 696 (268) -27.8% 154 28.4%
Northeastern University 26,437 31,666 32,798 6,361 24.1% 1,132 3.6%
School of Museum of Fine Arts (Merged with Tufts)
651 0 0 (651) -100.0% 0 N/A
SHOWA Institute 263 252 236 (27) -10.3% (16) -6.3%
Simmons University 3,972 3,440 3,360 (612) -15.4% (80) -2.3%
St. John Seminary 192 148 90 (102) -53.1% (58) 39.2%
Suffolk University 8,437 6,970 6,825 (1,612) -19.1% (145) -2.1%
Tufts University 2,632 3,148 3,213 581 22.1% 65 2.1%
University of Massachusetts Boston
14,547 15,192 14,543 (4) 0.0% (649) -4.3%
Urban College Boston 767 874 750 (17) -2.2% (124) -14.2%
Wentworth Institute of Technology
3,952 4,396 4,335 383 9.7% (61) -1.4%
Wheelock College (Merged with Boston University)
1,323 0 0 (1,323) -100.0% 0 N/A
Total Enrollment 144,792 150,415 150,113 5,321 3.7% (302) -0.2%
NEIGHBORHOOD DEVELOPMENT
Student Housing Trends: 2018 to 2019 School Year
6
Figure 1: Undergraduate, Graduate, and Total Enrollment, 2013-2019
93,134 92,559 93,829 93,050 93,783 94,448 93,043
51,658 52,940 52,988 53,476 54,554 55,967 57,070
144,792 145,499 146,817 146,526 148,337 150,415 150,113
0
20,000
40,000
60,000
80,000
100,000
120,000
140,000
160,000
2013 2014 2015 2016 2017 2018 2019
Undergraduate Enrollment Graduate Enrollment Total Enrollment
NEIGHBORHOOD DEVELOPMENT
Student Housing Trends: 2018 to 2019 School Year
7
STUDENT HOUSING IN GREATER BOSTON: ON-CAMPUS AND OFF-CAMPUS
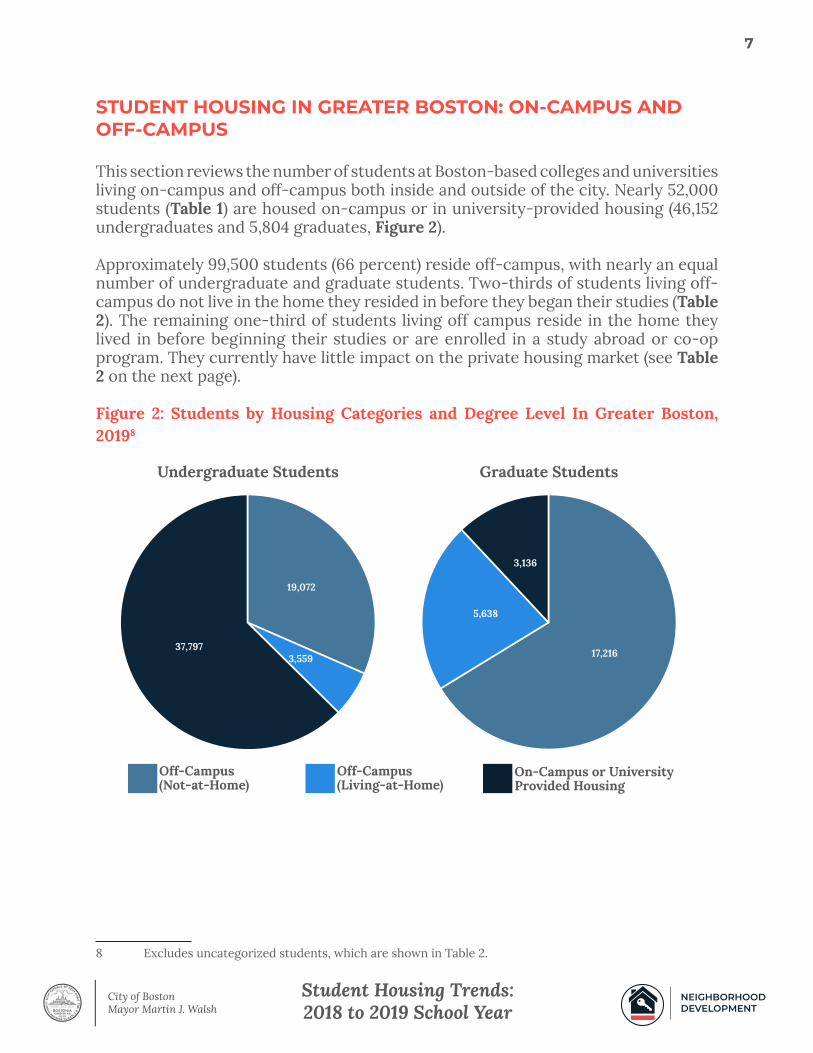
This section reviews the number of students at Boston-based colleges and universities living on-campus and off-campus both inside and outside of the city. Nearly 52,000 students (Table 1) are housed on-campus or in university-provided housing (46,152 undergraduates and 5,804 graduates, Figure 2).
Approximately 99,500 students (66 percent) reside off-campus, with nearly an equal number of undergraduate and graduate students. Two-thirds of students living off-campus do not live in the home they resided in before they began their studies (Table 2). The remaining one-third of students living off campus reside in the home they lived in before beginning their studies or are enrolled in a study abroad or co-op program. They currently have little impact on the private housing market (see Table 2 on the next page).
Figure 2: Students by Housing Categories and Degree Level In Greater Boston, 20198
8 Excludes uncategorized students, which are shown in Table 2.
17,216
5,638
3,136
Graduate Students
19,072
3,55937,797
Undergraduate Students
Off-Campus (Not-at-Home)
Off-Campus (Living-at-Home)
On-Campus or University Provided Housing
NEIGHBORHOOD DEVELOPMENT
Student Housing Trends: 2018 to 2019 School Year
8
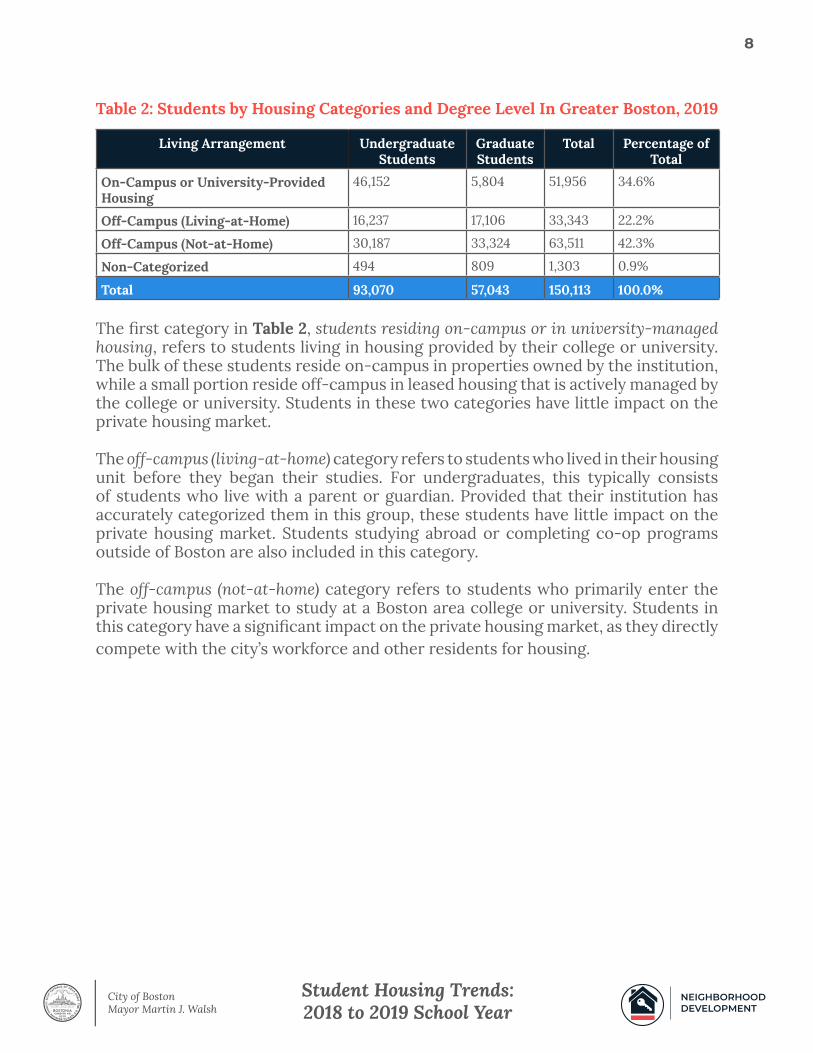
Table 2: Students by Housing Categories and Degree Level In Greater Boston, 2019
The first category in Table 2, students residing on-campus or in university-managed housing, refers to students living in housing provided by their college or university. The bulk of these students reside on-campus in properties owned by the institution, while a small portion reside off-campus in leased housing that is actively managed by the college or university. Students in these two categories have little impact on the private housing market.
The off-campus (living-at-home) category refers to students who lived in their housing unit before they began their studies. For undergraduates, this typically consists of students who live with a parent or guardian. Provided that their institution has accurately categorized them in this group, these students have little impact on the private housing market. Students studying abroad or completing co-op programs outside of Boston are also included in this category.
The off-campus (not-at-home) category refers to students who primarily enter the private housing market to study at a Boston area college or university. Students in this category have a significant impact on the private housing market, as they directly compete with the city’s workforce and other residents for housing.
Living Arrangement Undergraduate Students
Graduate Students
Total Percentage of Total
On-Campus or University-Provided Housing
46,152 5,804 51,956 34.6%
Off-Campus (Living-at-Home) 16,237 17,106 33,343 22.2%
Off-Campus (Not-at-Home) 30,187 33,324 63,511 42.3%
Non-Categorized 494 809 1,303 0.9%
Total 93,070 57,043 150,113 100.0%
NEIGHBORHOOD DEVELOPMENT
Student Housing Trends: 2018 to 2019 School Year
9
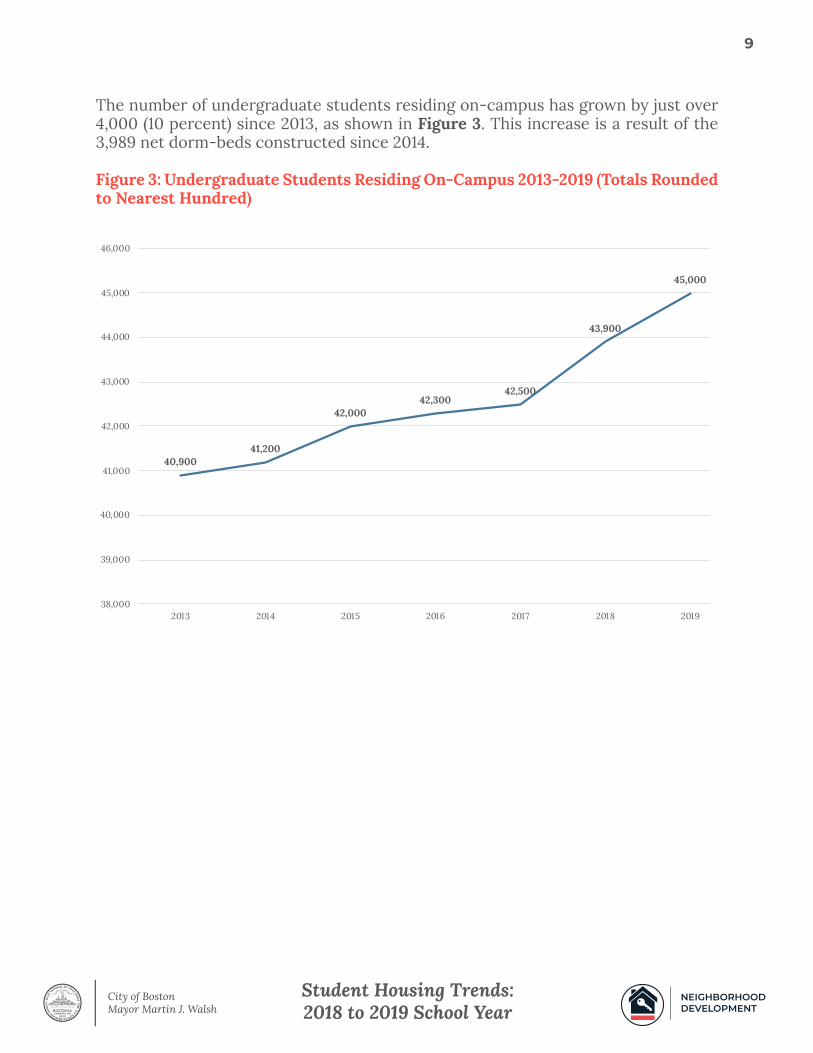
The number of undergraduate students residing on-campus has grown by just over 4,000 (10 percent) since 2013, as shown in Figure 3. This increase is a result of the 3,989 net dorm-beds constructed since 2014.
Figure 3: Undergraduate Students Residing On-Campus 2013-2019 (Totals Rounded to Nearest Hundred)
40,90041,200
42,00042,300
42,500
43,900
45,000
38,000
39,000
40,000
41,000
42,000
43,000
44,000
45,000
46,000
2013 2014 2015 2016 2017 2018 2019
NEIGHBORHOOD DEVELOPMENT
Student Housing Trends: 2018 to 2019 School Year
10
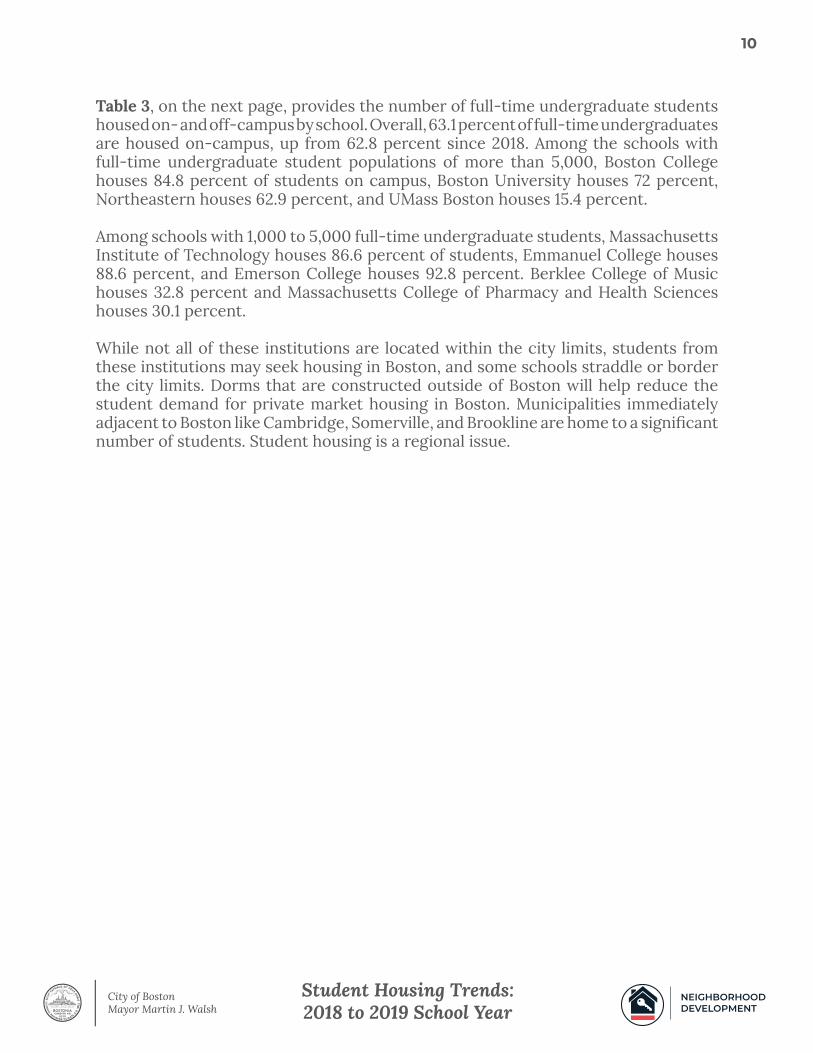
Table 3, on the next page, provides the number of full-time undergraduate students housed on- and off-campus by school. Overall, 63.1 percent of full-time undergraduates are housed on-campus, up from 62.8 percent since 2018. Among the schools with full-time undergraduate student populations of more than 5,000, Boston College houses 84.8 percent of students on campus, Boston University houses 72 percent, Northeastern houses 62.9 percent, and UMass Boston houses 15.4 percent.
Among schools with 1,000 to 5,000 full-time undergraduate students, Massachusetts Institute of Technology houses 86.6 percent of students, Emmanuel College houses 88.6 percent, and Emerson College houses 92.8 percent. Berklee College of Music houses 32.8 percent and Massachusetts College of Pharmacy and Health Sciences houses 30.1 percent.
While not all of these institutions are located within the city limits, students from these institutions may seek housing in Boston, and some schools straddle or border the city limits. Dorms that are constructed outside of Boston will help reduce the student demand for private market housing in Boston. Municipalities immediately adjacent to Boston like Cambridge, Somerville, and Brookline are home to a significant number of students. Student housing is a regional issue.
NEIGHBORHOOD DEVELOPMENT
Student Housing Trends: 2018 to 2019 School Year
11
Table 3: Full-Time Undergraduates Housed by School (Greater Boston), 20199
9 Table 3 calculates the percentage of students housed for the entire enrolled undergraduate (full-time) population, not just Boston. Part-time students are excluded from the calculation. MGH Institute of Health Professions is identified with *, as the school did not distinguish between students residing off-
campus, living-at-home, and off-campus, not-at-home. Benjamin Franklin, MGH, and Urban College do not own any buildings in Boston used to house students. Schools with ** include the data for only their Boston-based programs. The formula for the percentage of students provided housing by school is: Students Provided Housing by the School / (Enrollment - Students Not In Need of Housing). For some schools, the number of students provided housing and the number of students that live off-
campus in this table does not equal the number of students enrolled, as some addresses were suppressed for privacy reasons. These addresses are categorized as “other” and not shown in this table. Refer to Table 2.
Students Provided Housing by School
Students Not in Need of Housing
Institution Name Full-Time Students
University-Owned
Housing
University-Managed Housing
Off-Campus (Living-at-
Home)
Study Abroad/
Co-op
Off-Campus (Not-at-Home)
Percentage of Students
Provided Housing by
SchoolBay State College 348 33 0 236 1 78 29.7%
Benjamin Franklin Institute of Technology
499 0 0 162 0 337 0.0%
Berklee College of Music 4,824 1,406 0 97 133 3,188 30.6%
Boston Architectural College 259 17 0 24 0 217 7.2%
Boston Baptist College 34 29 0 2 0 4 90.6%
Boston College 9,370 7,503 0 200 322 1,345 84.8%
Boston University 17,127 11,352 0 916 448 4,411 72.0%
Emerson College 3,843 2,678 0 958 0 183 92.8%
Emmanuel College 1,985 1,369 95 317 16 184 88.6%
Fisher College 648 337 0 262 0 56 87.3%
Harvard University** 0 0 0 0 0 0 N/A
MassArt 1,734 814 0 180 0 739 52.4%
MCPHS 2,608 713 0 243 0 1,672 30.1%
Massachusetts Institute of Technology 4,502 3,370 508 15 11 139 86.6%
MGH Institute of Health Professions* 179 0 0 179 0 0 N/A
New England College of Optometry 0 0 0 0 0 0 N/A
New England Conservatory of Music 464 237 0 227 0 0 100.0%
New England Law Boston 0 0 0 0 0 0 N/A
Northeastern University 18,792 8,868 569 1,715 2,085 5,555 62.9%
SHOWA Institute 236 236 0 0 0 0 100.0%
Simmons University 1,612 1,074 0 14 0 524 67.2%
St. John Seminary 23 16 0 0 0 7 69.6%
Suffolk University 4,713 1,530 0 1,392 29 1,762 46.5%
Tufts University** 295 212 0 29 10 44 82.8%
University of Massachusetts Boston 9,918 1,049 0 3,121 0 5,748 15.4%
Urban College Boston 41 0 0 3 0 38 0.0%
Wentworth Institute of Technology** 3,892 2,069 0 1,197 0 626 76.8%
Total 87,946 44,912 1,172 11,489 3,055 26,857 62.8%
Part-Timers (All Schools) 5,097 84 6 1,680 13 3,330 N/A
Grand Total 93,043 44,974 1,178 13,169 3,068 30,187 N/A
NEIGHBORHOOD DEVELOPMENT
Student Housing Trends: 2018 to 2019 School Year
12
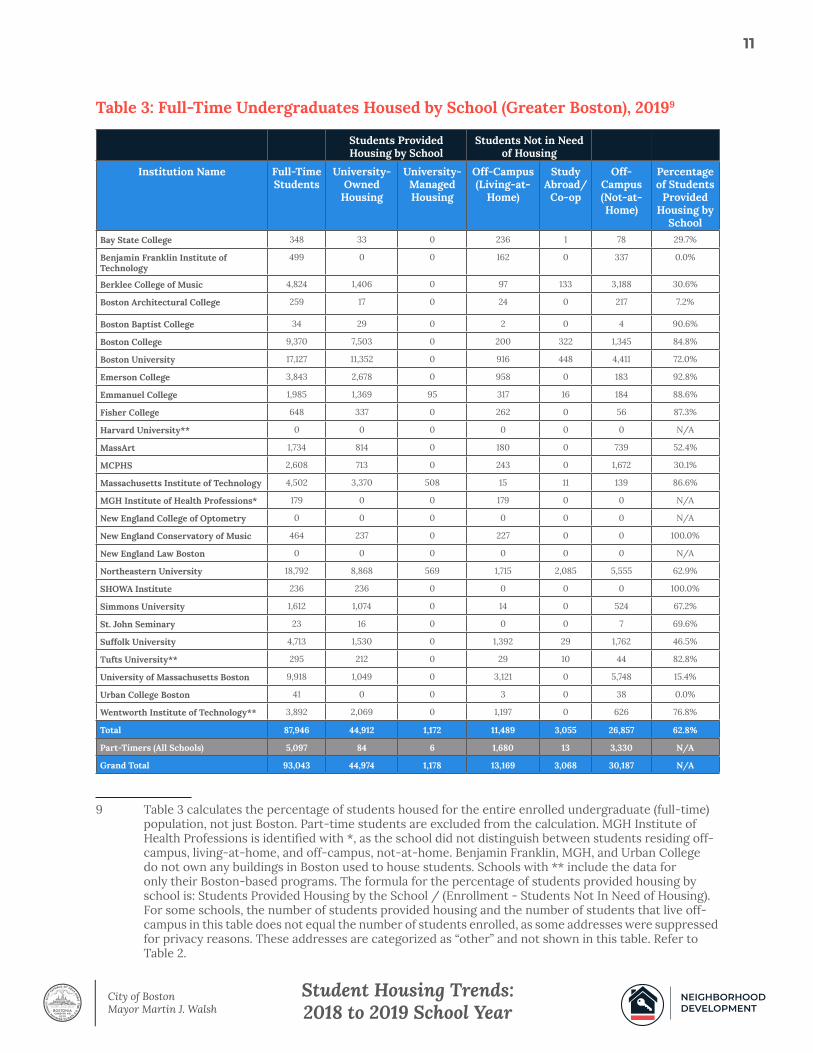
STUDENTS LIVING OFF-CAMPUS WITHIN THE CITY OF BOSTON
The student population in Boston includes just under 41,000 students (47 percent) living on campus or in university-provided housing and just over 46,600 students (53 percent) living off campus (see Table 4 on the next page). The population residing on campus and in university-managed housing is primarily composed of undergraduate students (37,797, or 92 percent), while the off-campus population is evenly split between undergraduates (23,681, or 51 percent) and graduates (22,963, or 49 percent).
Figure 4: Students by General Housing Categories and Degree Level In Boston, 201910
10 Excludes uncategorized students, which are shown in Table 2.
Off-Campus (Not-at-Home)
Off-Campus (Living-at-Home)
On-Campus or University Provided Housing
19,072
3,55937,797
Undergraduate Students
17,216
5,638
3,136
Graduate Students
NEIGHBORHOOD DEVELOPMENT
Student Housing Trends: 2018 to 2019 School Year
13
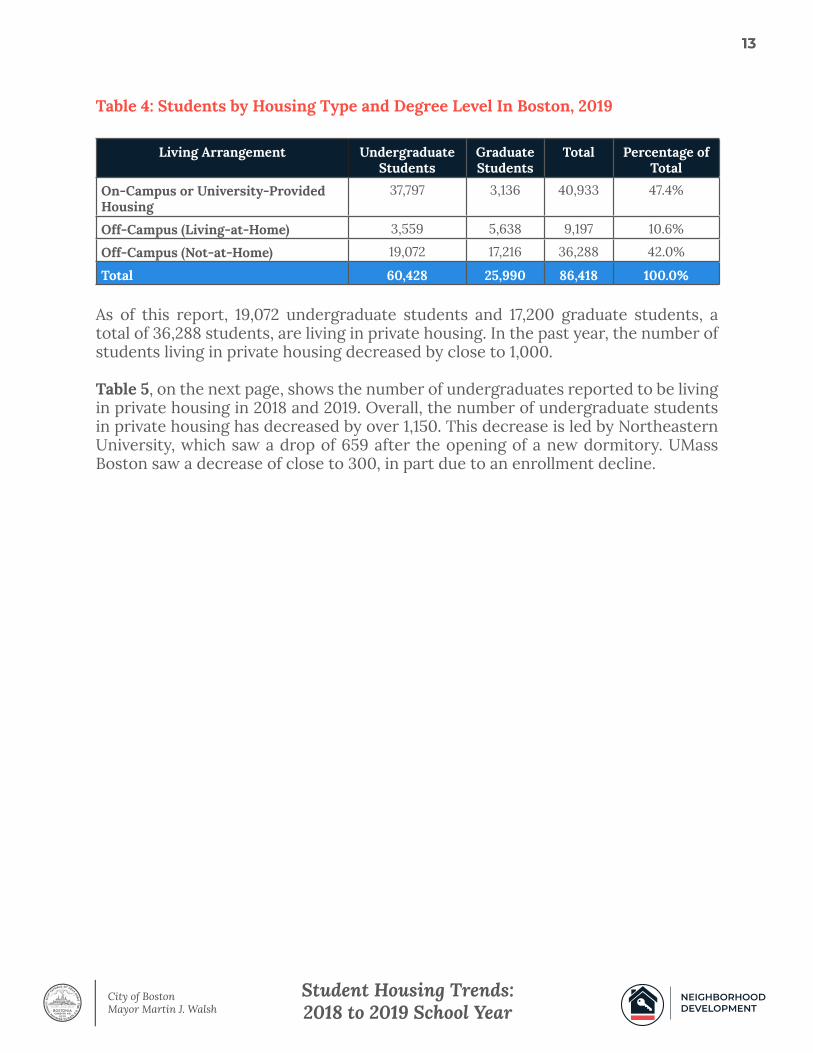
Table 4: Students by Housing Type and Degree Level In Boston, 2019
As of this report, 19,072 undergraduate students and 17,200 graduate students, a total of 36,288 students, are living in private housing. In the past year, the number of students living in private housing decreased by close to 1,000.
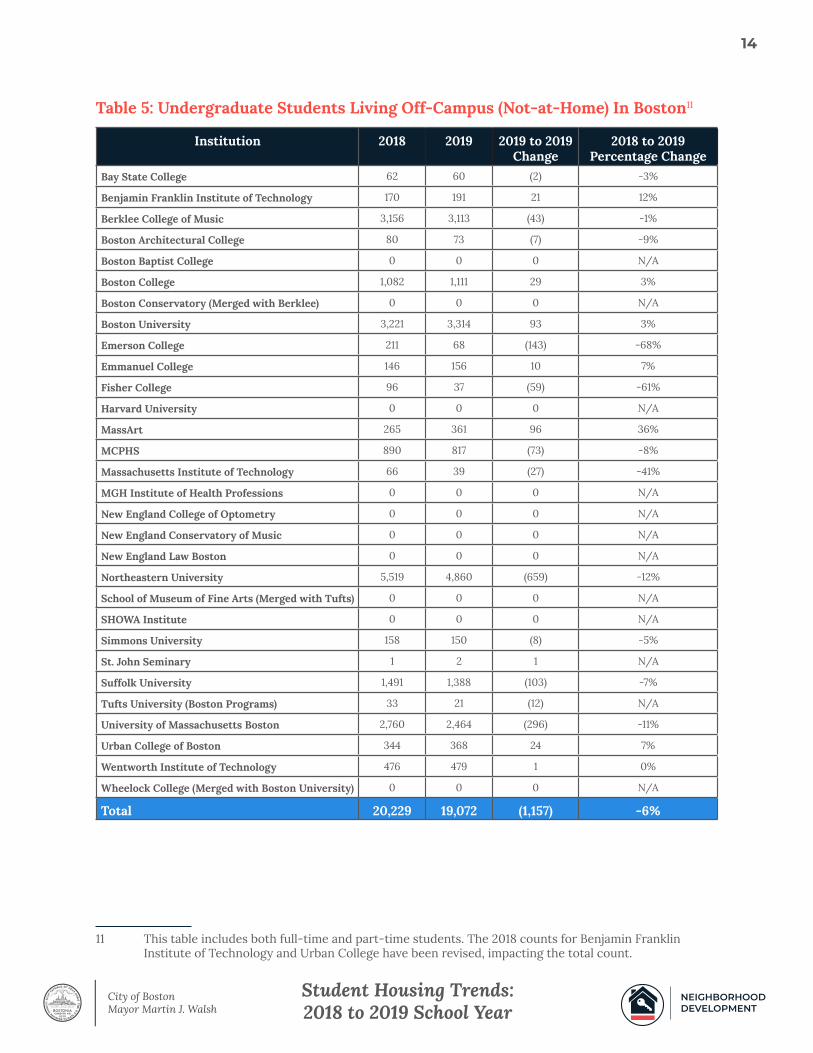
Table 5, on the next page, shows the number of undergraduates reported to be living in private housing in 2018 and 2019. Overall, the number of undergraduate students in private housing has decreased by over 1,150. This decrease is led by Northeastern University, which saw a drop of 659 after the opening of a new dormitory. UMass Boston saw a decrease of close to 300, in part due to an enrollment decline.
Living Arrangement Undergraduate Students
Graduate Students
Total Percentage of Total
On-Campus or University-Provided Housing
37,797 3,136 40,933 47.4%
Off-Campus (Living-at-Home) 3,559 5,638 9,197 10.6%
Off-Campus (Not-at-Home) 19,072 17,216 36,288 42.0%
Total 60,428 25,990 86,418 100.0%
NEIGHBORHOOD DEVELOPMENT
Student Housing Trends: 2018 to 2019 School Year
14
Table 5: Undergraduate Students Living Off-Campus (Not-at-Home) In Boston11
11 This table includes both full-time and part-time students. The 2018 counts for Benjamin Franklin Institute of Technology and Urban College have been revised, impacting the total count.
Institution 2018 2019 2019 to 2019 Change
2018 to 2019 Percentage Change
Bay State College 62 60 (2) -3%
Benjamin Franklin Institute of Technology 170 191 21 12%
Berklee College of Music 3,156 3,113 (43) -1%
Boston Architectural College 80 73 (7) -9%
Boston Baptist College 0 0 0 N/A
Boston College 1,082 1,111 29 3%
Boston Conservatory (Merged with Berklee) 0 0 0 N/A
Boston University 3,221 3,314 93 3%
Emerson College 211 68 (143) -68%
Emmanuel College 146 156 10 7%
Fisher College 96 37 (59) -61%
Harvard University 0 0 0 N/A
MassArt 265 361 96 36%
MCPHS 890 817 (73) -8%
Massachusetts Institute of Technology 66 39 (27) -41%
MGH Institute of Health Professions 0 0 0 N/A
New England College of Optometry 0 0 0 N/A
New England Conservatory of Music 0 0 0 N/A
New England Law Boston 0 0 0 N/A
Northeastern University 5,519 4,860 (659) -12%
School of Museum of Fine Arts (Merged with Tufts) 0 0 0 N/A
SHOWA Institute 0 0 0 N/A
Simmons University 158 150 (8) -5%
St. John Seminary 1 2 1 N/A
Suffolk University 1,491 1,388 (103) -7%
Tufts University (Boston Programs) 33 21 (12) N/A
University of Massachusetts Boston 2,760 2,464 (296) -11%
Urban College of Boston 344 368 24 7%
Wentworth Institute of Technology 476 479 1 0%
Wheelock College (Merged with Boston University) 0 0 0 N/A
Total 20,229 19,072 (1,157) -6%
NEIGHBORHOOD DEVELOPMENT
Student Housing Trends: 2018 to 2019 School Year
15
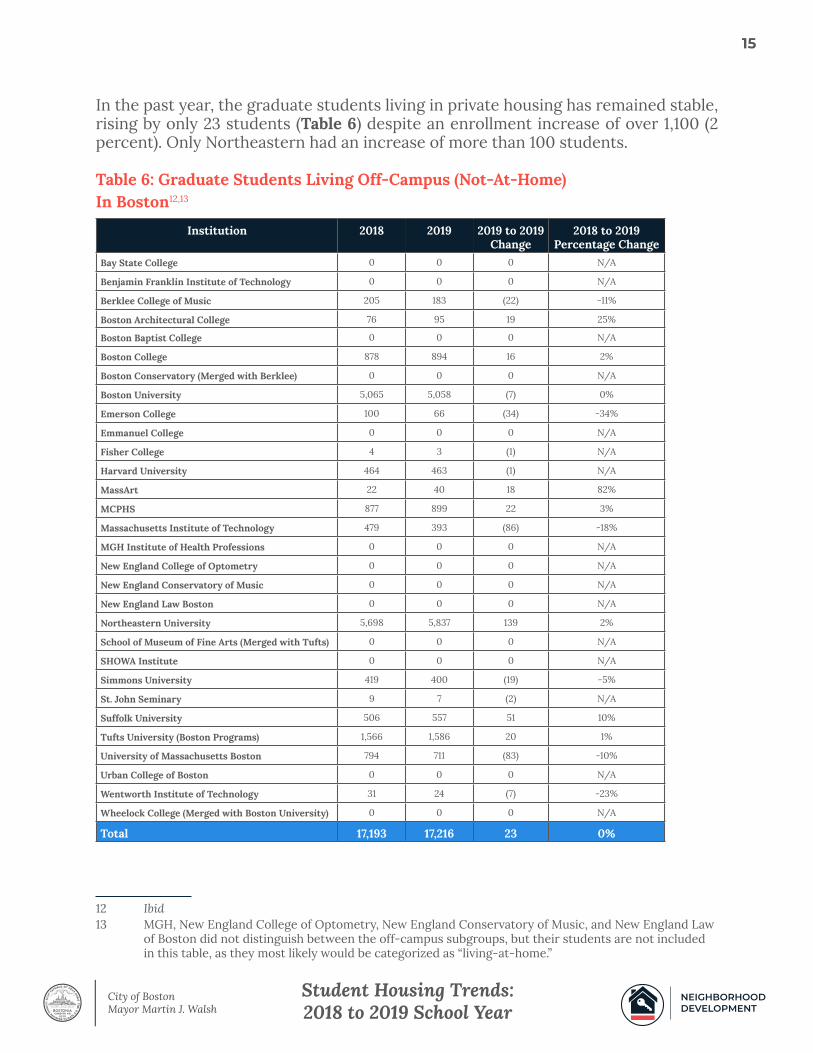
In the past year, the graduate students living in private housing has remained stable, rising by only 23 students (Table 6) despite an enrollment increase of over 1,100 (2 percent). Only Northeastern had an increase of more than 100 students.
Table 6: Graduate Students Living Off-Campus (Not-At-Home)In Boston12,13
12 Ibid13 MGH, New England College of Optometry, New England Conservatory of Music, and New England Law
of Boston did not distinguish between the off-campus subgroups, but their students are not included in this table, as they most likely would be categorized as “living-at-home.”
Institution 2018 2019 2019 to 2019 Change
2018 to 2019 Percentage Change
Bay State College 0 0 0 N/A
Benjamin Franklin Institute of Technology 0 0 0 N/A
Berklee College of Music 205 183 (22) -11%
Boston Architectural College 76 95 19 25%
Boston Baptist College 0 0 0 N/A
Boston College 878 894 16 2%
Boston Conservatory (Merged with Berklee) 0 0 0 N/A
Boston University 5,065 5,058 (7) 0%
Emerson College 100 66 (34) -34%
Emmanuel College 0 0 0 N/A
Fisher College 4 3 (1) N/A
Harvard University 464 463 (1) N/A
MassArt 22 40 18 82%
MCPHS 877 899 22 3%
Massachusetts Institute of Technology 479 393 (86) -18%
MGH Institute of Health Professions 0 0 0 N/A
New England College of Optometry 0 0 0 N/A
New England Conservatory of Music 0 0 0 N/A
New England Law Boston 0 0 0 N/A
Northeastern University 5,698 5,837 139 2%
School of Museum of Fine Arts (Merged with Tufts) 0 0 0 N/A
SHOWA Institute 0 0 0 N/A
Simmons University 419 400 (19) -5%
St. John Seminary 9 7 (2) N/A
Suffolk University 506 557 51 10%
Tufts University (Boston Programs) 1,566 1,586 20 1%
University of Massachusetts Boston 794 711 (83) -10%
Urban College of Boston 0 0 0 N/A
Wentworth Institute of Technology 31 24 (7) -23%
Wheelock College (Merged with Boston University) 0 0 0 N/A
Total 17,193 17,216 23 0%
NEIGHBORHOOD DEVELOPMENT
Student Housing Trends: 2018 to 2019 School Year
16
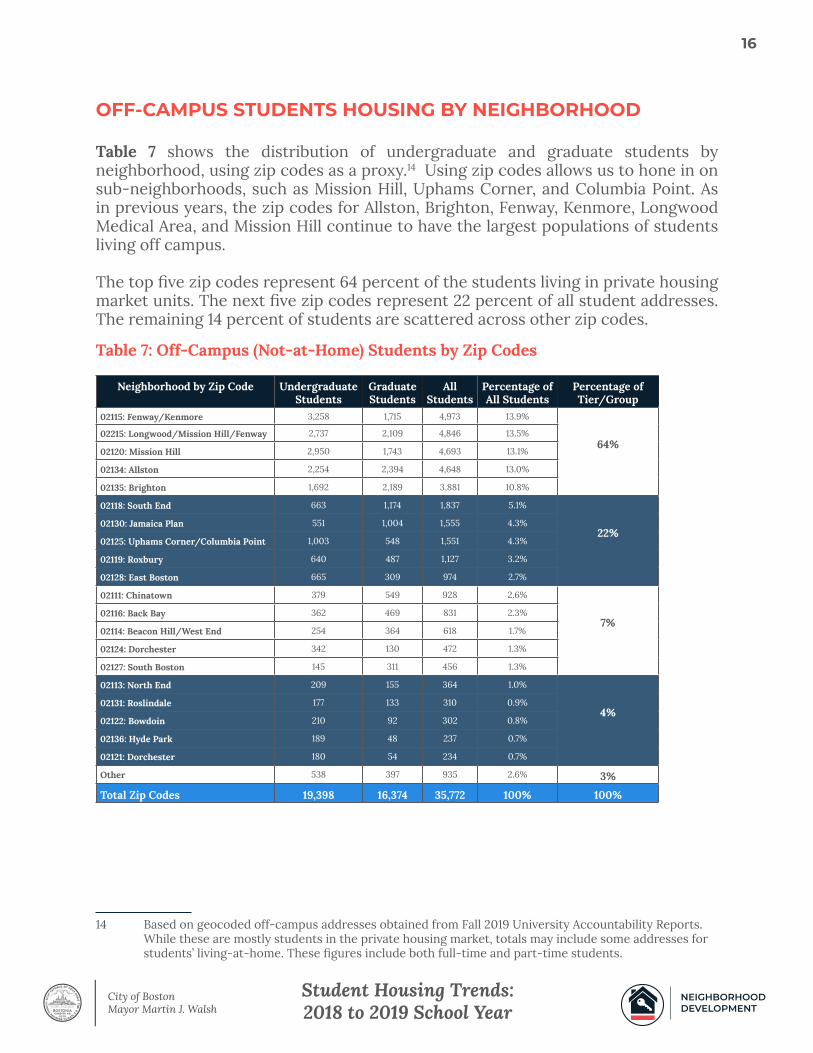
OFF-CAMPUS STUDENTS HOUSING BY NEIGHBORHOOD
Table 7 shows the distribution of undergraduate and graduate students by neighborhood, using zip codes as a proxy.14 Using zip codes allows us to hone in on sub-neighborhoods, such as Mission Hill, Uphams Corner, and Columbia Point. As in previous years, the zip codes for Allston, Brighton, Fenway, Kenmore, Longwood Medical Area, and Mission Hill continue to have the largest populations of students living off campus.
The top five zip codes represent 64 percent of the students living in private housing market units. The next five zip codes represent 22 percent of all student addresses. The remaining 14 percent of students are scattered across other zip codes.
14 Based on geocoded off-campus addresses obtained from Fall 2019 University Accountability Reports. While these are mostly students in the private housing market, totals may include some addresses for students’ living-at-home. These figures include both full-time and part-time students.
Table 7: Off-Campus (Not-at-Home) Students by Zip Codes
Neighborhood by Zip Code Undergraduate Students
Graduate Students
All Students
Percentage of All Students
Percentage of Tier/Group
02115: Fenway/Kenmore 3,258 1,715 4,973 13.9%
64%02215: Longwood/Mission Hill/Fenway 2,737 2,109 4,846 13.5%
02120: Mission Hill 2,950 1,743 4,693 13.1%
02134: Allston 2,254 2,394 4,648 13.0%
02135: Brighton 1,692 2,189 3,881 10.8%
02118: South End 663 1,174 1,837 5.1%
22%02130: Jamaica Plan 551 1,004 1,555 4.3%
02125: Uphams Corner/Columbia Point 1,003 548 1,551 4.3%
02119: Roxbury 640 487 1,127 3.2%
02128: East Boston 665 309 974 2.7%
02111: Chinatown 379 549 928 2.6%
7%02116: Back Bay 362 469 831 2.3%
02114: Beacon Hill/West End 254 364 618 1.7%
02124: Dorchester 342 130 472 1.3%
02127: South Boston 145 311 456 1.3%
02113: North End 209 155 364 1.0%
4%02131: Roslindale 177 133 310 0.9%
02122: Bowdoin 210 92 302 0.8%
02136: Hyde Park 189 48 237 0.7%
02121: Dorchester 180 54 234 0.7%
Other 538 397 935 2.6% 3%
Total Zip Codes 19,398 16,374 35,772 100% 100%
NEIGHBORHOOD DEVELOPMENT
Student Housing Trends: 2018 to 2019 School Year
17
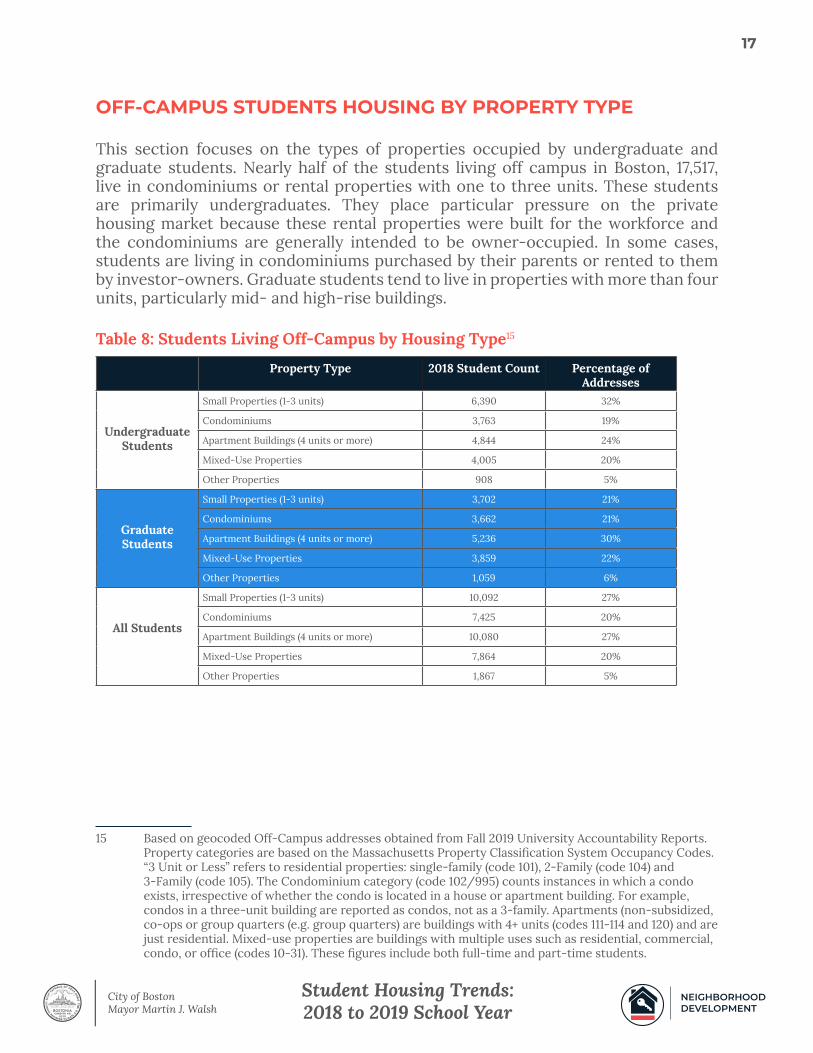
OFF-CAMPUS STUDENTS HOUSING BY PROPERTY TYPE
This section focuses on the types of properties occupied by undergraduate and graduate students. Nearly half of the students living off campus in Boston, 17,517, live in condominiums or rental properties with one to three units. These students are primarily undergraduates. They place particular pressure on the private housing market because these rental properties were built for the workforce and the condominiums are generally intended to be owner-occupied. In some cases, students are living in condominiums purchased by their parents or rented to them by investor-owners. Graduate students tend to live in properties with more than four units, particularly mid- and high-rise buildings.
Table 8: Students Living Off-Campus by Housing Type15
15 Based on geocoded Off-Campus addresses obtained from Fall 2019 University Accountability Reports. Property categories are based on the Massachusetts Property Classification System Occupancy Codes. “3 Unit or Less” refers to residential properties: single-family (code 101), 2-Family (code 104) and 3-Family (code 105). The Condominium category (code 102/995) counts instances in which a condo exists, irrespective of whether the condo is located in a house or apartment building. For example, condos in a three-unit building are reported as condos, not as a 3-family. Apartments (non-subsidized, co-ops or group quarters (e.g. group quarters) are buildings with 4+ units (codes 111-114 and 120) and are just residential. Mixed-use properties are buildings with multiple uses such as residential, commercial, condo, or office (codes 10-31). These figures include both full-time and part-time students.
Property Type 2018 Student Count Percentage of Addresses
Undergraduate Students
Small Properties (1-3 units) 6,390 32%
Condominiums 3,763 19%
Apartment Buildings (4 units or more) 4,844 24%
Mixed-Use Properties 4,005 20%
Other Properties 908 5%
Graduate Students
Small Properties (1-3 units) 3,702 21%
Condominiums 3,662 21%
Apartment Buildings (4 units or more) 5,236 30%
Mixed-Use Properties 3,859 22%
Other Properties 1,059 6%
All Students
Small Properties (1-3 units) 10,092 27%
Condominiums 7,425 20%
Apartment Buildings (4 units or more) 10,080 27%
Mixed-Use Properties 7,864 20%
Other Properties 1,867 5%
NEIGHBORHOOD DEVELOPMENT
Student Housing Trends: 2018 to 2019 School Year
18
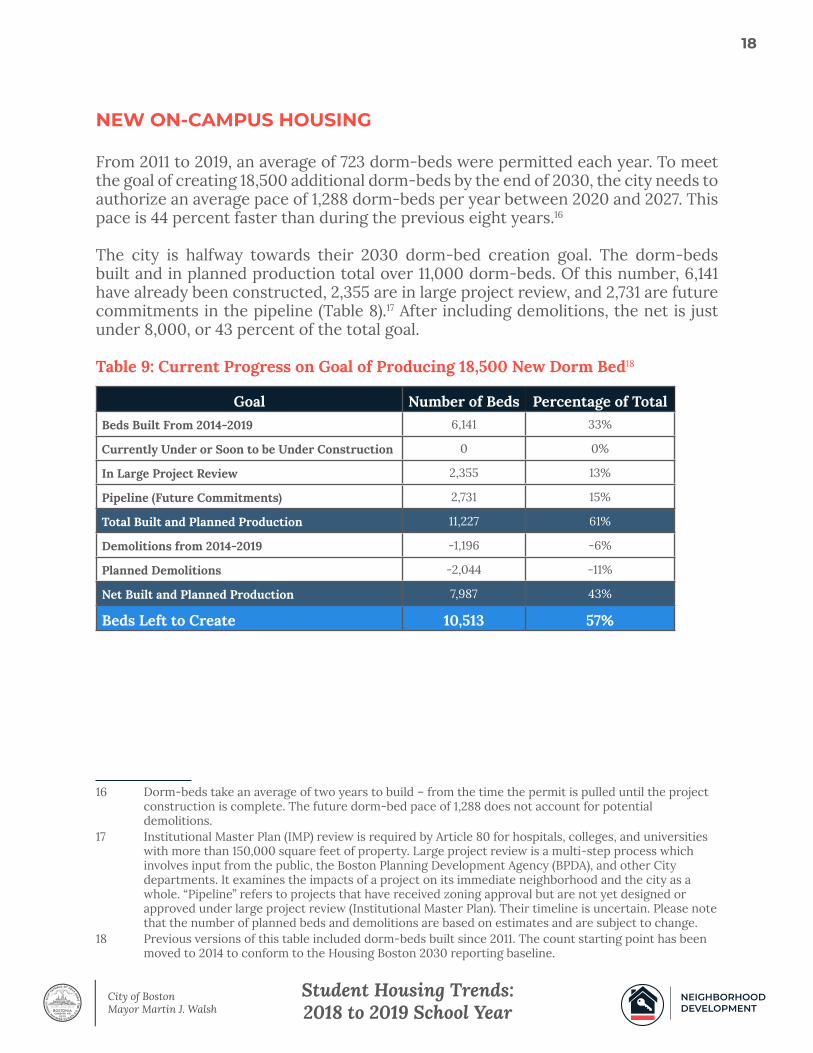
NEW ON-CAMPUS HOUSING
From 2011 to 2019, an average of 723 dorm-beds were permitted each year. To meet the goal of creating 18,500 additional dorm-beds by the end of 2030, the city needs to authorize an average pace of 1,288 dorm-beds per year between 2020 and 2027. This pace is 44 percent faster than during the previous eight years.16
The city is halfway towards their 2030 dorm-bed creation goal. The dorm-beds built and in planned production total over 11,000 dorm-beds. Of this number, 6,141 have already been constructed, 2,355 are in large project review, and 2,731 are future commitments in the pipeline (Table 8).17 After including demolitions, the net is just under 8,000, or 43 percent of the total goal.
Table 9: Current Progress on Goal of Producing 18,500 New Dorm Bed18
16 Dorm-beds take an average of two years to build – from the time the permit is pulled until the project construction is complete. The future dorm-bed pace of 1,288 does not account for potential demolitions.
17 Institutional Master Plan (IMP) review is required by Article 80 for hospitals, colleges, and universities with more than 150,000 square feet of property. Large project review is a multi-step process which involves input from the public, the Boston Planning Development Agency (BPDA), and other City departments. It examines the impacts of a project on its immediate neighborhood and the city as a whole. “Pipeline” refers to projects that have received zoning approval but are not yet designed or approved under large project review (Institutional Master Plan). Their timeline is uncertain. Please note that the number of planned beds and demolitions are based on estimates and are subject to change.
18 Previous versions of this table included dorm-beds built since 2011. The count starting point has been moved to 2014 to conform to the Housing Boston 2030 reporting baseline.
Goal Number of Beds Percentage of TotalBeds Built From 2014-2019 6,141 33%
Currently Under or Soon to be Under Construction 0 0%
In Large Project Review 2,355 13%
Pipeline (Future Commitments) 2,731 15%
Total Built and Planned Production 11,227 61%
Demolitions from 2014-2019 -1,196 -6%
Planned Demolitions -2,044 -11%
Net Built and Planned Production 7,987 43%
Beds Left to Create 10,513 57%
NEIGHBORHOOD DEVELOPMENT
Student Housing Trends: 2018 to 2019 School Year
19
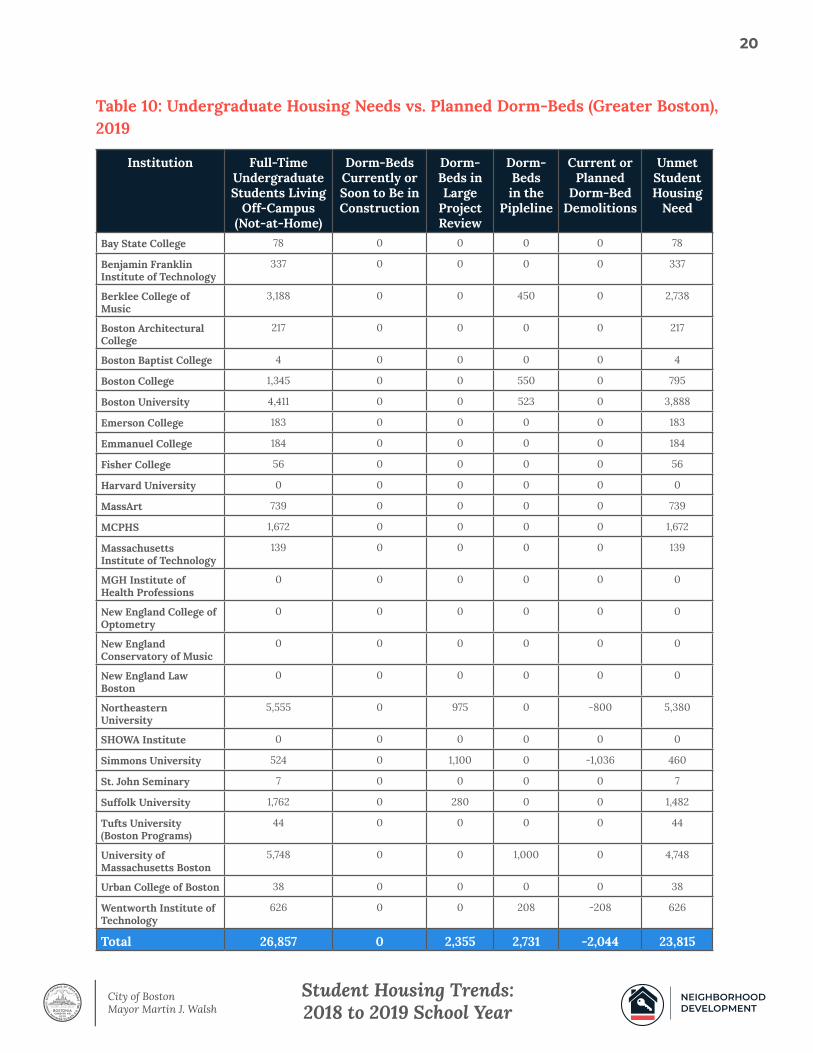
Table 10, on the next page, shows undergraduate housing needs and planned construction for each school. Dorm-beds currently in large project review include Suffolk’s 280 dorm-beds in the former Ames Hotel and UMass Boston’s planned 1,000 dorm-beds.
Recent buildings, such as LightView at Northeastern and Residence Hall 1 at the University of Massachusetts Boston, are owned by private developers. Recent projects and proposals from private developers to create independent dormitories reflects the high-level of interest in building specifically for the city’s student population. Neighborhood groups where these new dormitories would be situated, however, have expressed significant concerns about how oversight would work in buildings without direct university oversight. This opposition has led to companies withdrawing from their original development plans.
Private companies can be particularly helpful in developing graduate student housing, and can cater to the diversity of graduate students’ housing needs. Massachusetts Institute of Technology’s Kendall Square Initiative featured more than 80 community meetings and is an example of thoughtful and thoroughly planned graduate student housing.
NEIGHBORHOOD DEVELOPMENT
Student Housing Trends: 2018 to 2019 School Year
20
Table 10: Undergraduate Housing Needs vs. Planned Dorm-Beds (Greater Boston), 2019
Institution Full-Time Undergraduate Students Living
Off-Campus (Not-at-Home)
Dorm-Beds Currently or Soon to Be in Construction
Dorm-Beds in Large
Project Review
Dorm-Beds in the
Pipleline
Current or Planned
Dorm-Bed Demolitions
Unmet Student Housing
Need
Bay State College 78 0 0 0 0 78
Benjamin Franklin Institute of Technology
337 0 0 0 0 337
Berklee College of Music
3,188 0 0 450 0 2,738
Boston Architectural College
217 0 0 0 0 217
Boston Baptist College 4 0 0 0 0 4
Boston College 1,345 0 0 550 0 795
Boston University 4,411 0 0 523 0 3,888
Emerson College 183 0 0 0 0 183
Emmanuel College 184 0 0 0 0 184
Fisher College 56 0 0 0 0 56
Harvard University 0 0 0 0 0 0
MassArt 739 0 0 0 0 739
MCPHS 1,672 0 0 0 0 1,672
Massachusetts Institute of Technology
139 0 0 0 0 139
MGH Institute of Health Professions
0 0 0 0 0 0
New England College of Optometry
0 0 0 0 0 0
New England Conservatory of Music
0 0 0 0 0 0
New England Law Boston
0 0 0 0 0 0
Northeastern University
5,555 0 975 0 -800 5,380
SHOWA Institute 0 0 0 0 0 0
Simmons University 524 0 1,100 0 -1,036 460
St. John Seminary 7 0 0 0 0 7
Suffolk University 1,762 0 280 0 0 1,482
Tufts University (Boston Programs)
44 0 0 0 0 44
University of Massachusetts Boston
5,748 0 0 1,000 0 4,748
Urban College of Boston 38 0 0 0 0 38
Wentworth Institute of Technology
626 0 0 208 -208 626
Total 26,857 0 2,355 2,731 -2,044 23,815
NEIGHBORHOOD DEVELOPMENT

Student Housing Trends: 2018 to 2019 School Year
21
CONCLUSION
Student Housing Trends: 2018 to 2019 School Year reports on progress against the goals established by Housing Boston 2030, the City of Boston’s comprehensive housing policy. Goals for Student Housing are:
1. Creating 18,500 dorm-beds
2. Reducing the number of students living off campus by 50 percent
3. Ensuring that students reside in safe and suitable housing
Based on the current projection of dorm bed development, Boston is lagging on the pace necessary to achieve the dorm bed goal. The City of Boston is continuing to increase efforts to boost dorm-bed commitments from colleges and universities.
Student housing creation must significantly exceed enrollment growth if the number of students in the private housing market is to substantially decrease. Stagnant undergraduate enrollment provides the city with an excellent opportunity to minimize the number of undergraduates living off campus. However, the rapid increase in graduate student enrollment adds complexity to the situation.
Student housing developments will continue to face three significant challenges – neighborhood resistance, land constraints, and financial limitations. Pushback from constituents can lead to developers scrapping their student housing plans in favor of other proposals. Some colleges and universities will seek to build further away from campus, putting pressure on neighborhoods, and hesitancy from institutions to take on more debt will lead to more public-private partnerships.
NEIGHBORHOOD DEVELOPMENT
Student Housing Trends: 2018 to 2019 School Year
22
Due to data quality issues associated with earlier student data reports, it is difficult to calculate the progress that has been made towards reducing the number of students living off-campus by 50 percent. We estimate that the gross off-campus population has decreased between 7 and 10 percent, as the number of students that live on campus has increased by 10 percent since 2013. We are continuing to work with local institutions to improve data collection.
While the quality of data continues to improve, the Walsh Administration will continue to revise its policy priorities to ease the pressure on the private housing market.
The Department of Neighborhood Development (DND) will work collaboratively with the Inspectional Services Division (ISD) to identify students, particularly undergraduates, who are living in unsuitable housing. The data improvements mentioned earlier will play a key role in determining both overcrowded units and units with building and sanitary code violations. DND is cross-referencing the student addresses to identify overcrowding, nuisance, and quality of life issues that can be both harmful to students and impact the lives of non-student residents. DND will share this analysis with the Problem Properties Task Force, which will decide whether properties should be designated as problem properties, which can lead to hefty fines for property owners.
NEIGHBORHOOD DEVELOPMENT
Student Housing Trends: 2018 to 2019 School Year
23
APPENDIX A: DEFINITIONS AND KEY DATA ISSUES
As required by the University Accountability Ordinance, all Boston-based universities and colleges must submit a report to the City each year, providing data about the students enrolled in their school, including information on where students are living. Since 2013, the overall reporting quality has improved. However, this has created complications in analyzing long-term trends. The next few paragraphs give a brief overview of these data issues. When applicable, the footnotes in this report contain specific information about data reconciliations. Please note this report is based only on fall semester data.
Off-Campus Housing:
In 2013, the off-campus numbers were not separated into the sub-categories of students: off-campus (living-at-home), off-campus (not-at-home), and living in university-managed housing. These sub-categories were included in data from 2014-2017. There are a small number of institutions that have not made these distinctions in any year.
Off-Campus (Living-at-Home):
This category was called “commuters” in previous reports. It refers to a living arrangement in which a student lives with their parent or legal guardian in a housing facility that is not owned or controlled by the educational institution. For part-timers, non-traditional students, or graduate students, this category represents a place the student lives before beginning their studies. Generally, living-at-home occurs when the “local/mailing” and “home/permanent” address in the institutional database are the same.
Off-Campus (Not-at-Home):
In previous reports, this category was called “private-housing.” It refers to a student who does not live with a parent or legal guardian or in a housing facility owned or controlled by their educational institution. Generally, living-at-home is when the “local/mailing” and “home/permanent” address in the institutional database are not the same. For graduate students, the address matching methodology is less effective.
Address Data:
While several institutions have improved their collection, addresses are typically reported by students and subject to error.
NEIGHBORHOOD DEVELOPMENT
Student Housing Trends: 2018 to 2019 School Year
24
Geographic Distribution:
Currently, the student housing report does not compare the geographic distribution of students with earlier reports because of data incompatibilities.
Another issue with some University Accountability Reports, particularly in previous reports, is a lack of address standardization, such as including the addresses for students enrolled in online programs or at satellite campuses.
NEIGHBORHOOD DEVELOPMENT
Student Housing Trends: 2018 to 2019 School Year
25
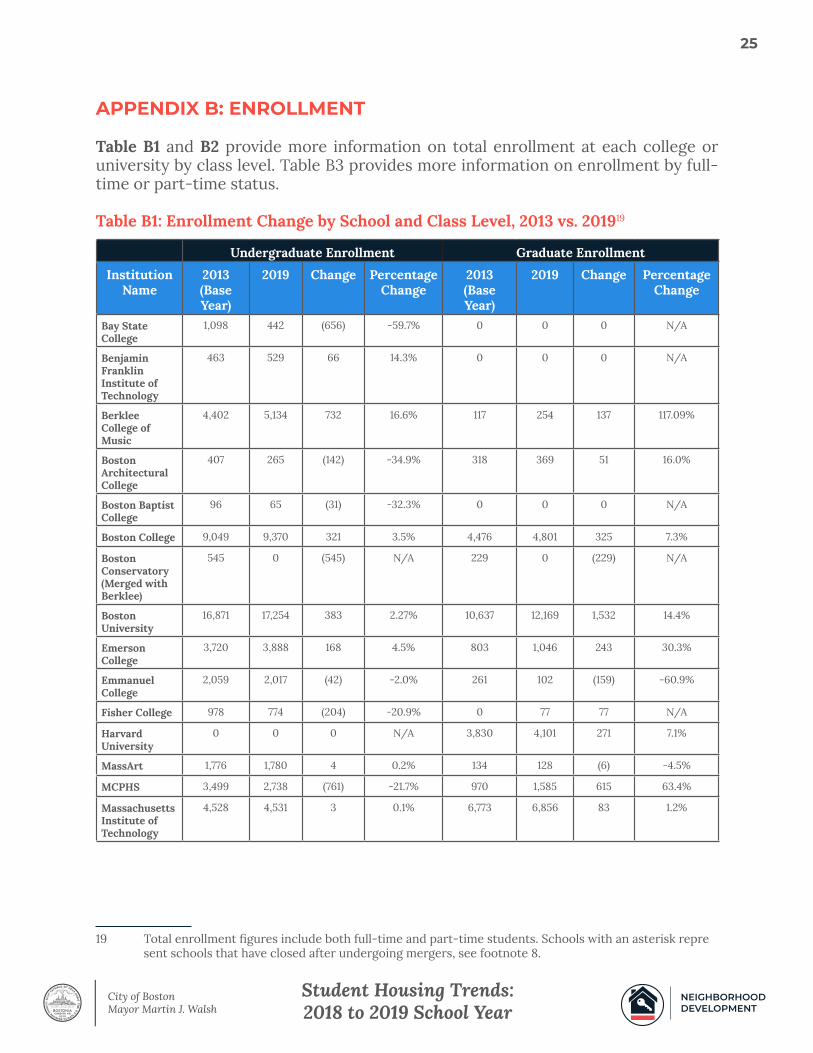
APPENDIX B: ENROLLMENT
Table B1 and B2 provide more information on total enrollment at each college or university by class level. Table B3 provides more information on enrollment by full-time or part-time status.
Table B1: Enrollment Change by School and Class Level, 2013 vs. 201919
19 Total enrollment figures include both full-time and part-time students. Schools with an asterisk represent schools that have closed after undergoing mergers, see footnote 8.
Undergraduate Enrollment Graduate Enrollment
Institution Name
2013 (Base Year)
2019 Change Percentage Change
2013 (Base Year)
2019 Change Percentage Change
Bay State College
1,098 442 (656) -59.7% 0 0 0 N/A
Benjamin Franklin Institute of Technology
463 529 66 14.3% 0 0 0 N/A
Berklee College of Music
4,402 5,134 732 16.6% 117 254 137 117.09%
Boston Architectural College
407 265 (142) -34.9% 318 369 51 16.0%
Boston Baptist College
96 65 (31) -32.3% 0 0 0 N/A
Boston College 9,049 9,370 321 3.5% 4,476 4,801 325 7.3%
Boston Conservatory (Merged with Berklee)
545 0 (545) N/A 229 0 (229) N/A
Boston University
16,871 17,254 383 2.27% 10,637 12,169 1,532 14.4%
Emerson College
3,720 3,888 168 4.5% 803 1,046 243 30.3%
Emmanuel College
2,059 2,017 (42) -2.0% 261 102 (159) -60.9%
Fisher College 978 774 (204) -20.9% 0 77 77 N/A
Harvard University
0 0 0 N/A 3,830 4,101 271 7.1%
MassArt 1,776 1,780 4 0.2% 134 128 (6) -4.5%
MCPHS 3,499 2,738 (761) -21.7% 970 1,585 615 63.4%
Massachusetts Institute of Technology
4,528 4,531 3 0.1% 6,773 6,856 83 1.2%
NEIGHBORHOOD DEVELOPMENT
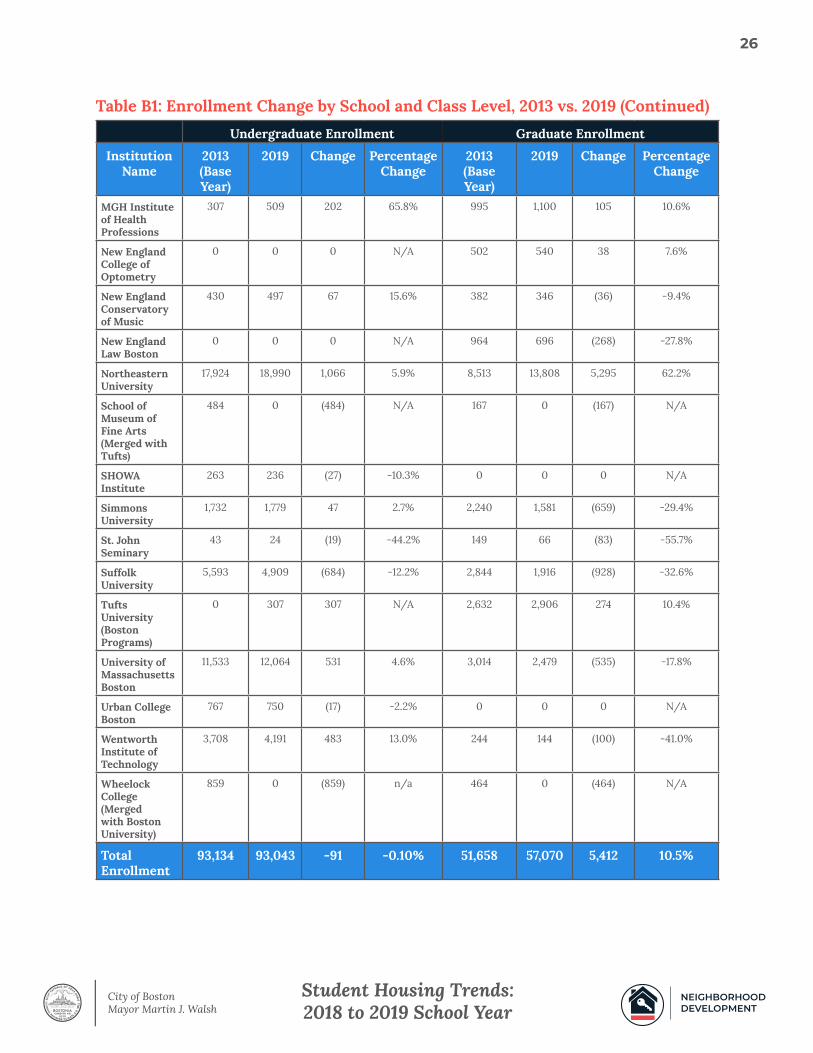
Student Housing Trends: 2018 to 2019 School Year
26
Table B1: Enrollment Change by School and Class Level, 2013 vs. 2019 (Continued)
Undergraduate Enrollment Graduate Enrollment
Institution Name
2013 (Base Year)
2019 Change Percentage Change
2013 (Base Year)
2019 Change Percentage Change
MGH Institute of Health Professions
307 509 202 65.8% 995 1,100 105 10.6%
New England College of Optometry
0 0 0 N/A 502 540 38 7.6%
New England Conservatory of Music
430 497 67 15.6% 382 346 (36) -9.4%
New England Law Boston
0 0 0 N/A 964 696 (268) -27.8%
Northeastern University
17,924 18,990 1,066 5.9% 8,513 13,808 5,295 62.2%
School of Museum of Fine Arts (Merged with Tufts)
484 0 (484) N/A 167 0 (167) N/A
SHOWA Institute
263 236 (27) -10.3% 0 0 0 N/A
Simmons University
1,732 1,779 47 2.7% 2,240 1,581 (659) -29.4%
St. John Seminary
43 24 (19) -44.2% 149 66 (83) -55.7%
Suffolk University
5,593 4,909 (684) -12.2% 2,844 1,916 (928) -32.6%
Tufts University (Boston Programs)
0 307 307 N/A 2,632 2,906 274 10.4%
University of Massachusetts Boston
11,533 12,064 531 4.6% 3,014 2,479 (535) -17.8%
Urban College Boston
767 750 (17) -2.2% 0 0 0 N/A
Wentworth Institute of Technology
3,708 4,191 483 13.0% 244 144 (100) -41.0%
Wheelock College (Merged with Boston University)
859 0 (859) n/a 464 0 (464) N/A
Total Enrollment
93,134 93,043 -91 -0.10% 51,658 57,070 5,412 10.5%
NEIGHBORHOOD DEVELOPMENT
Student Housing Trends: 2018 to 2019 School Year
27
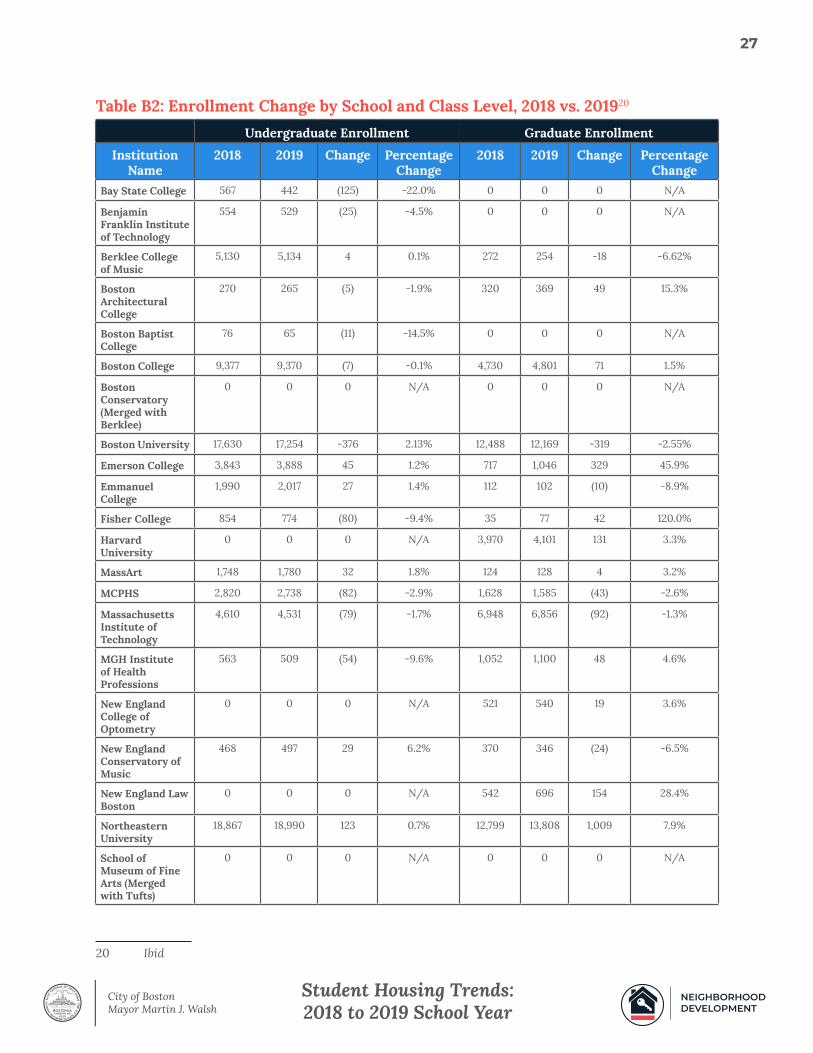
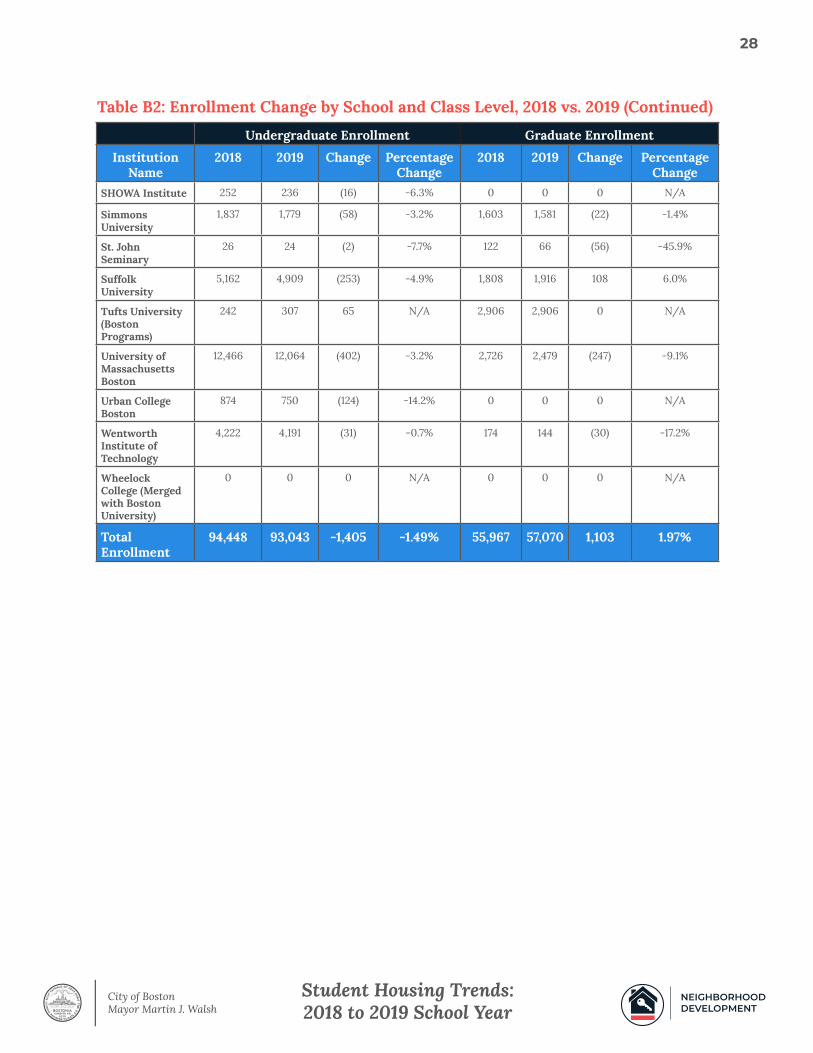
Table B2: Enrollment Change by School and Class Level, 2018 vs. 201920
20 Ibid
Undergraduate Enrollment Graduate Enrollment
Institution Name
2018 2019 Change Percentage Change
2018 2019 Change Percentage Change
Bay State College 567 442 (125) -22.0% 0 0 0 N/A
Benjamin Franklin Institute of Technology
554 529 (25) -4.5% 0 0 0 N/A
Berklee College of Music
5,130 5,134 4 0.1% 272 254 -18 -6.62%
Boston Architectural College
270 265 (5) -1.9% 320 369 49 15.3%
Boston Baptist College
76 65 (11) -14.5% 0 0 0 N/A
Boston College 9,377 9,370 (7) -0.1% 4,730 4,801 71 1.5%
Boston Conservatory (Merged with Berklee)
0 0 0 N/A 0 0 0 N/A
Boston University 17,630 17,254 -376 2.13% 12,488 12,169 -319 -2.55%
Emerson College 3,843 3,888 45 1.2% 717 1,046 329 45.9%
Emmanuel College
1,990 2,017 27 1.4% 112 102 (10) -8.9%
Fisher College 854 774 (80) -9.4% 35 77 42 120.0%
Harvard University
0 0 0 N/A 3,970 4,101 131 3.3%
MassArt 1,748 1,780 32 1.8% 124 128 4 3.2%
MCPHS 2,820 2,738 (82) -2.9% 1,628 1,585 (43) -2.6%
Massachusetts Institute of Technology
4,610 4,531 (79) -1.7% 6,948 6,856 (92) -1.3%
MGH Institute of Health Professions
563 509 (54) -9.6% 1,052 1,100 48 4.6%
New England College of Optometry
0 0 0 N/A 521 540 19 3.6%
New England Conservatory of Music
468 497 29 6.2% 370 346 (24) -6.5%
New England Law Boston
0 0 0 N/A 542 696 154 28.4%
Northeastern University
18,867 18,990 123 0.7% 12,799 13,808 1,009 7.9%
School of Museum of Fine Arts (Merged with Tufts)
0 0 0 N/A 0 0 0 N/A
NEIGHBORHOOD DEVELOPMENT
Student Housing Trends: 2018 to 2019 School Year
28
Undergraduate Enrollment Graduate Enrollment
Institution Name
2018 2019 Change Percentage Change
2018 2019 Change Percentage Change
SHOWA Institute 252 236 (16) -6.3% 0 0 0 N/A
Simmons University
1,837 1,779 (58) -3.2% 1,603 1,581 (22) -1.4%
St. John Seminary
26 24 (2) -7.7% 122 66 (56) -45.9%
Suffolk University
5,162 4,909 (253) -4.9% 1,808 1,916 108 6.0%
Tufts University (Boston Programs)
242 307 65 N/A 2,906 2,906 0 N/A
University of Massachusetts Boston
12,466 12,064 (402) -3.2% 2,726 2,479 (247) -9.1%
Urban College Boston
874 750 (124) -14.2% 0 0 0 N/A
Wentworth Institute of Technology
4,222 4,191 (31) -0.7% 174 144 (30) -17.2%
Wheelock College (Merged with Boston University)
0 0 0 N/A 0 0 0 N/A
Total Enrollment
94,448 93,043 -1,405 -1.49% 55,967 57,070 1,103 1.97%
Table B2: Enrollment Change by School and Class Level, 2018 vs. 2019 (Continued)
NEIGHBORHOOD DEVELOPMENT
Student Housing Trends: 2018 to 2019 School Year
29
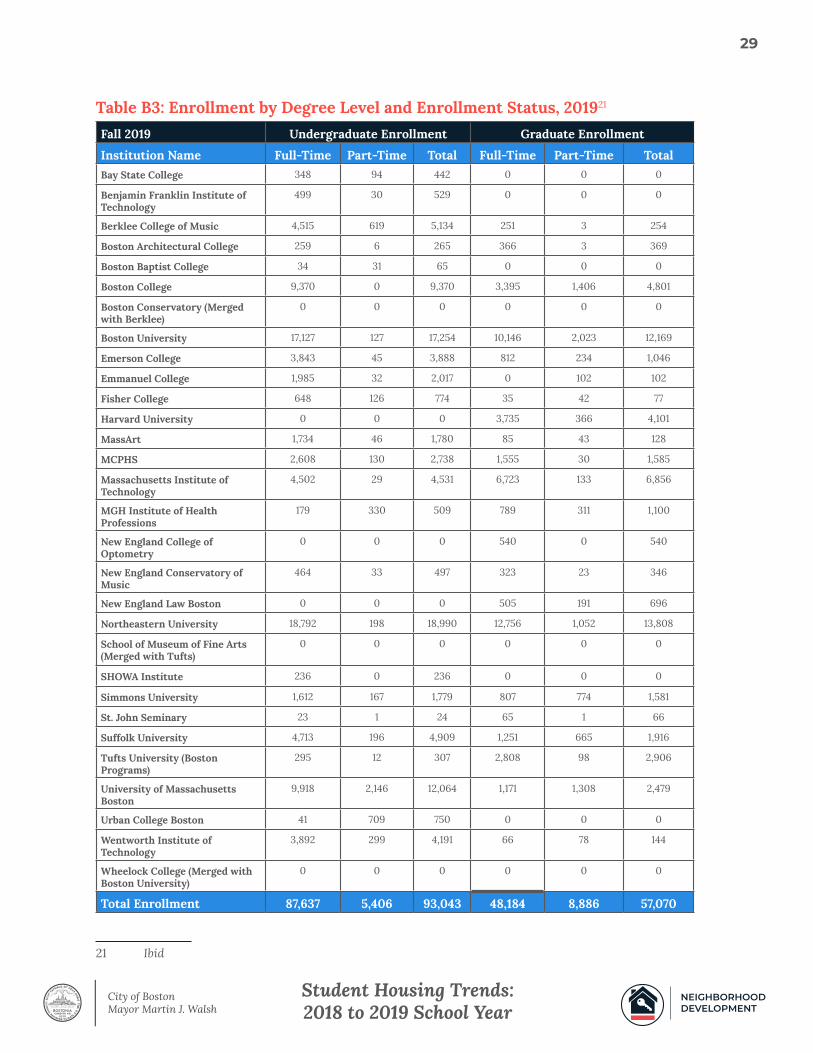
Table B3: Enrollment by Degree Level and Enrollment Status, 201921
21 Ibid
Fall 2019 Undergraduate Enrollment Graduate Enrollment
Institution Name Full-Time Part-Time Total Full-Time Part-Time TotalBay State College 348 94 442 0 0 0
Benjamin Franklin Institute of Technology
499 30 529 0 0 0
Berklee College of Music 4,515 619 5,134 251 3 254
Boston Architectural College 259 6 265 366 3 369
Boston Baptist College 34 31 65 0 0 0
Boston College 9,370 0 9,370 3,395 1,406 4,801
Boston Conservatory (Merged with Berklee)
0 0 0 0 0 0
Boston University 17,127 127 17,254 10,146 2,023 12,169
Emerson College 3,843 45 3,888 812 234 1,046
Emmanuel College 1,985 32 2,017 0 102 102
Fisher College 648 126 774 35 42 77
Harvard University 0 0 0 3,735 366 4,101
MassArt 1,734 46 1,780 85 43 128
MCPHS 2,608 130 2,738 1,555 30 1,585
Massachusetts Institute of Technology
4,502 29 4,531 6,723 133 6,856
MGH Institute of Health Professions
179 330 509 789 311 1,100
New England College of Optometry
0 0 0 540 0 540
New England Conservatory of Music
464 33 497 323 23 346
New England Law Boston 0 0 0 505 191 696
Northeastern University 18,792 198 18,990 12,756 1,052 13,808
School of Museum of Fine Arts (Merged with Tufts)
0 0 0 0 0 0
SHOWA Institute 236 0 236 0 0 0
Simmons University 1,612 167 1,779 807 774 1,581
St. John Seminary 23 1 24 65 1 66
Suffolk University 4,713 196 4,909 1,251 665 1,916
Tufts University (Boston Programs)
295 12 307 2,808 98 2,906
University of Massachusetts Boston
9,918 2,146 12,064 1,171 1,308 2,479
Urban College Boston 41 709 750 0 0 0
Wentworth Institute of Technology
3,892 299 4,191 66 78 144
Wheelock College (Merged with Boston University)
0 0 0 0 0 0
Total Enrollment 87,637 5,406 93,043 48,184 8,886 57,070
NEIGHBORHOOD DEVELOPMENT
Student Housing Trends: 2018 to 2019 School Year
30
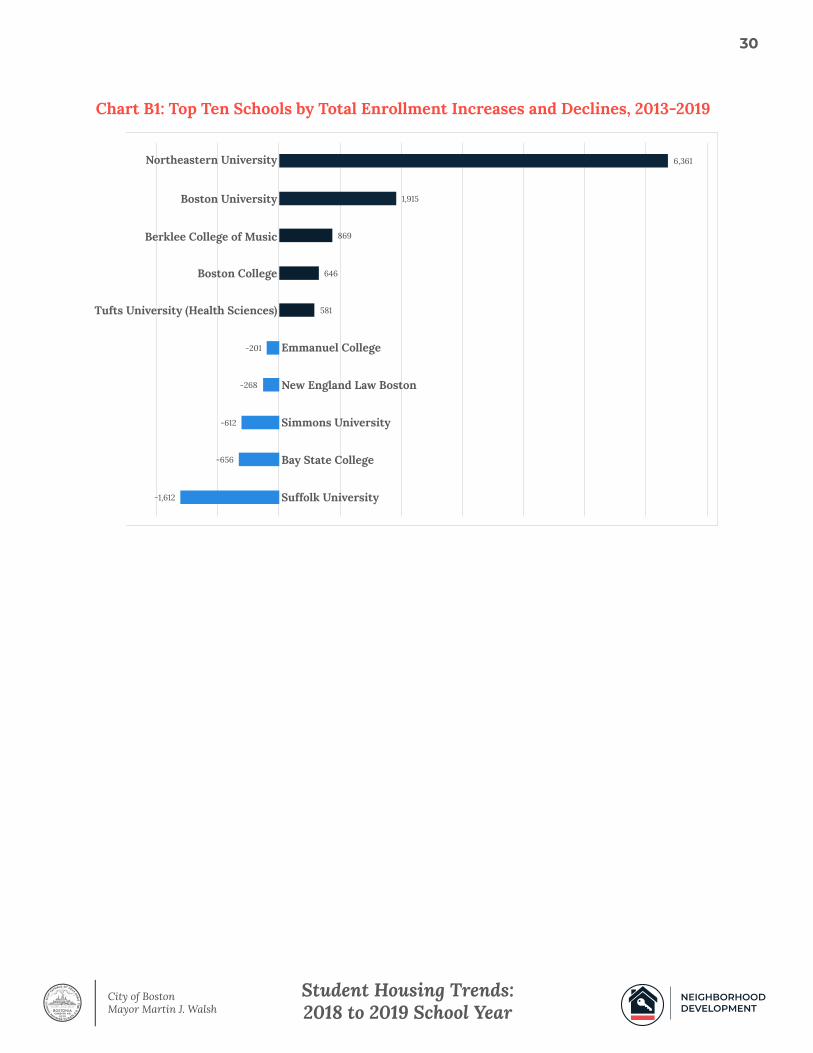
Chart B1: Top Ten Schools by Total Enrollment Increases and Declines, 2013-2019
-1,612
-656
-612
-268
-201
581
646
869
1,915
6,361
Suffolk University
Bay State College
Simmons University
New England Law Boston
Emmanuel College
Tufts University (Health Sciences)
Boston College
Northeastern University
Berklee College of Music
Boston University
NEIGHBORHOOD DEVELOPMENT
Student Housing Trends: 2018 to 2019 School Year
31
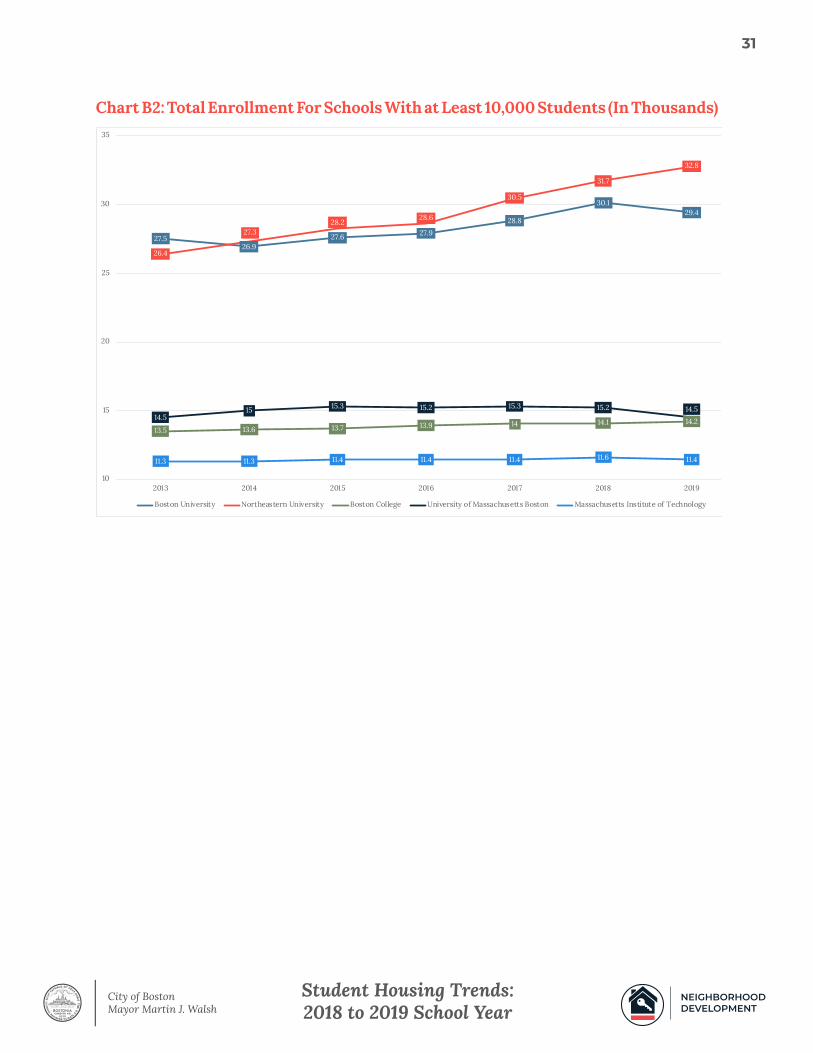
Chart B2: Total Enrollment For Schools With at Least 10,000 Students (In Thousands)
27.526.9
27.6 27.9
28.8
30.129.4
26.4
27.328.2
28.6
30.5
31.7
32.8
13.5 13.6 13.7 13.9 14 14.1 14.214.515 15.3 15.2 15.3 15.2 14.5
11.3 11.3 11.4 11.4 11.4 11.6 11.4
10
15
20
25
30
35
2013 2014 2015 2016 2017 2018 2019
Boston University Northeastern University Boston College University of Massachusetts Boston Massachusetts Institute of Technology
NEIGHBORHOOD DEVELOPMENT
Student Housing Trends: 2018 to 2019 School Year
32
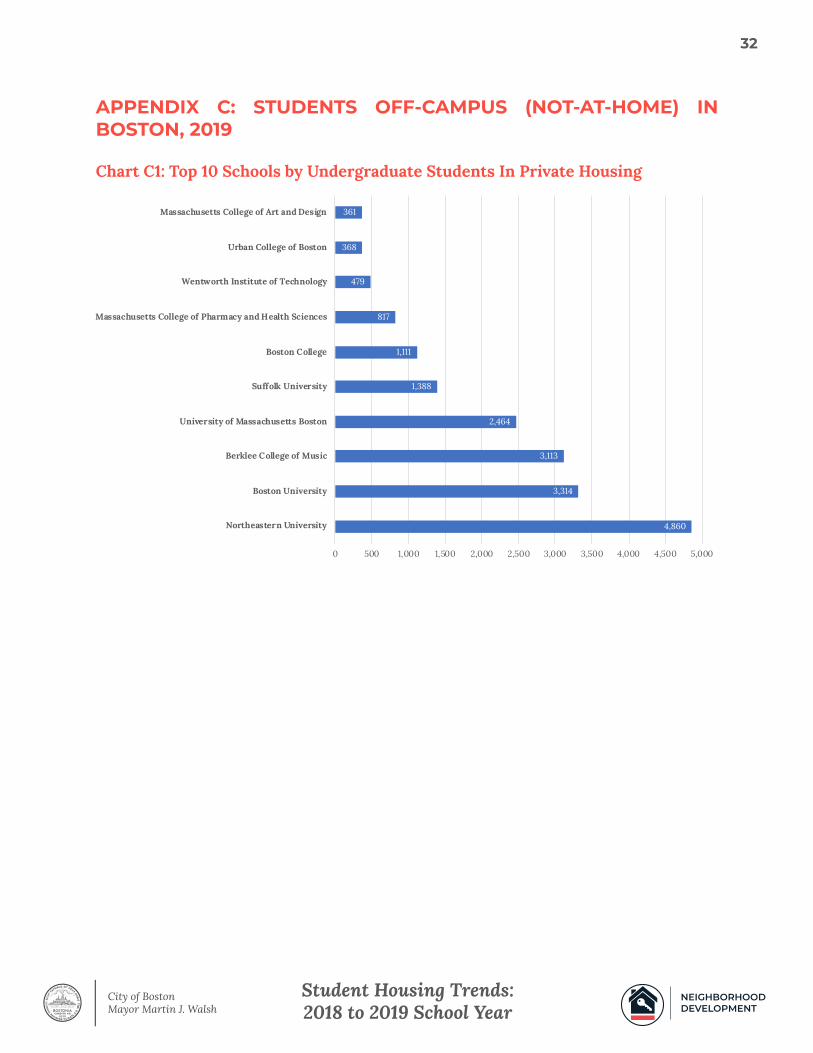
APPENDIX C: STUDENTS OFF-CAMPUS (NOT-AT-HOME) IN BOSTON, 2019
Chart C1: Top 10 Schools by Undergraduate Students In Private Housing
4,860
3,314
3,113
2,464
1,388
1,111
817
479
368
361
0 500 1,000 1,500 2,000 2,500 3,000 3,500 4,000 4,500 5,000
Northeastern University
Boston University
Berklee College of Music
University of Massachusetts Boston
Suffolk University
Boston College
Massachusetts College of Pharmacy and Health Sciences
Wentworth Institute of Technology
Urban College of Boston
Massachusetts College of Art and Design
NEIGHBORHOOD DEVELOPMENT
Student Housing Trends: 2018 to 2019 School Year
33
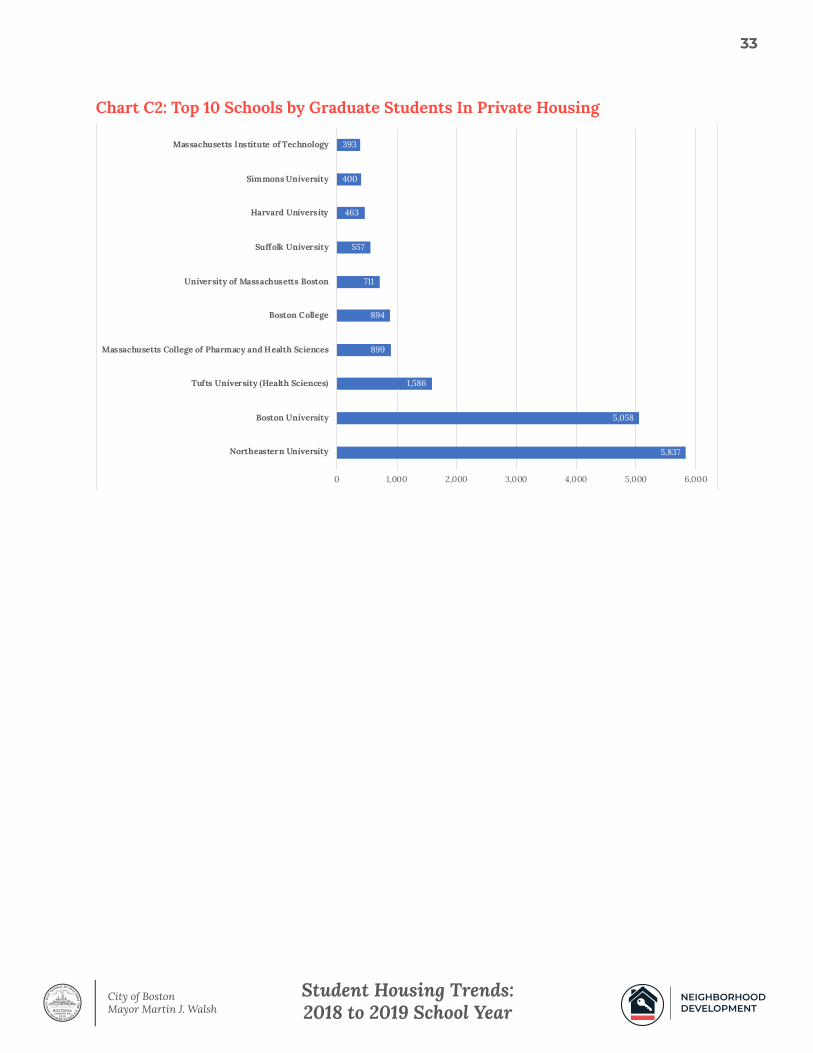
Chart C2: Top 10 Schools by Graduate Students In Private Housing
5,837
5,058
1,586
899
894
711
557
463
400
393
0 1,000 2,000 3,000 4,000 5,000 6,000
Northeastern University
Boston University
Tufts University (Health Sciences)
Massachusetts College of Pharmacy and Health Sciences
Boston College
University of Massachusetts Boston
Suffolk University
Harvard University
Simmons University
Massachusetts Institute of Technology
NEIGHBORHOOD DEVELOPMENT
Student Housing Trends: 2018 to 2019 School Year
34
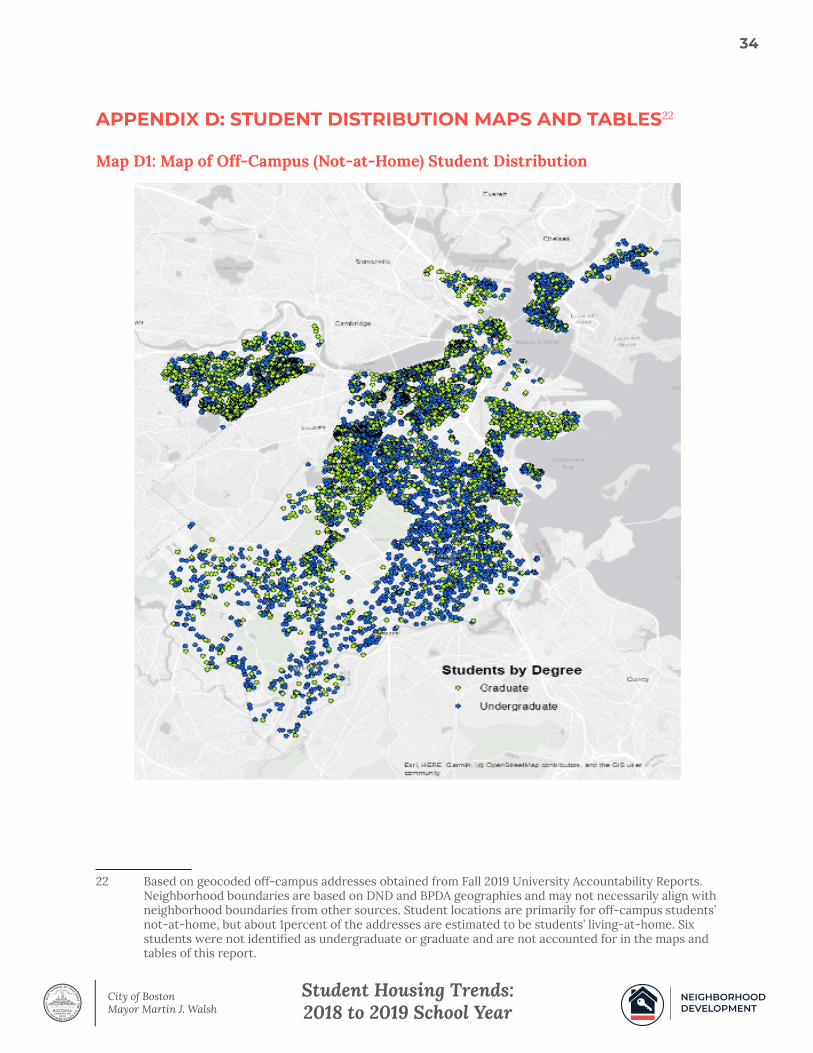
APPENDIX D: STUDENT DISTRIBUTION MAPS AND TABLES22
Map D1: Map of Off-Campus (Not-at-Home) Student Distribution
22 Based on geocoded off-campus addresses obtained from Fall 2019 University Accountability Reports. Neighborhood boundaries are based on DND and BPDA geographies and may not necessarily align with neighborhood boundaries from other sources. Student locations are primarily for off-campus students’ not-at-home, but about 1percent of the addresses are estimated to be students’ living-at-home. Six students were not identified as undergraduate or graduate and are not accounted for in the maps and tables of this report.
NEIGHBORHOOD DEVELOPMENT
Student Housing Trends: 2018 to 2019 School Year
35
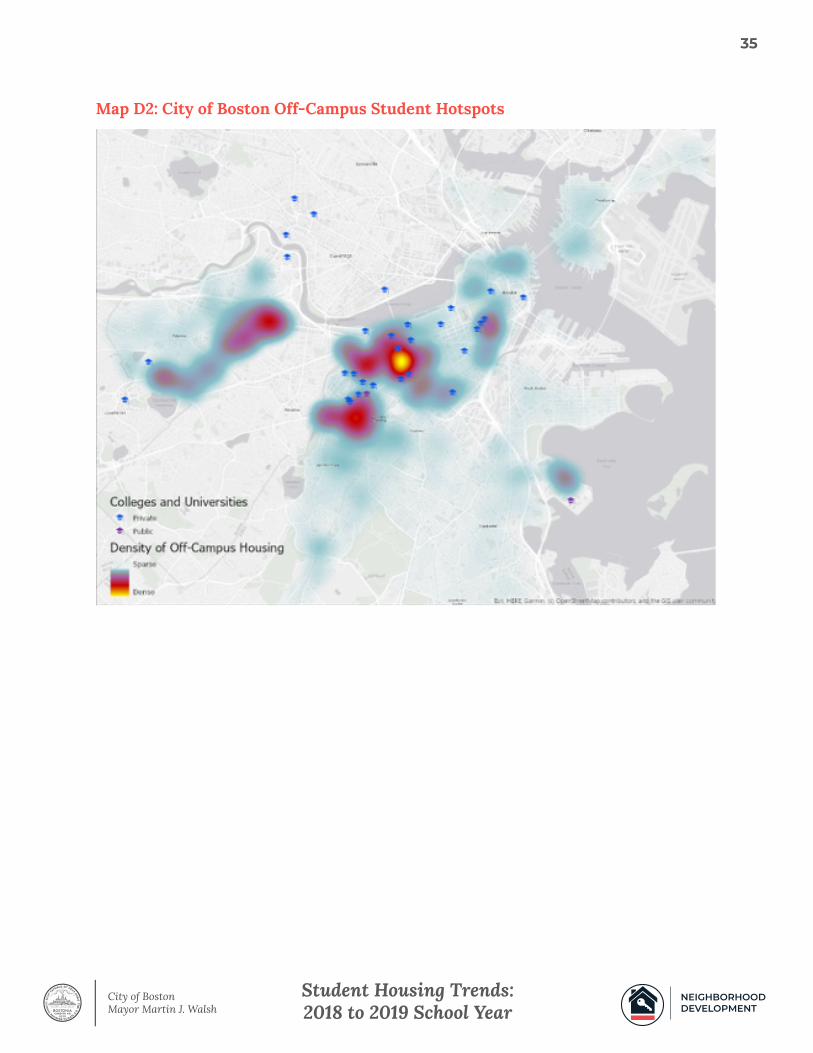
Map D2: City of Boston Off-Campus Student Hotspots
NEIGHBORHOOD DEVELOPMENT
Student Housing Trends: 2018 to 2019 School Year
36
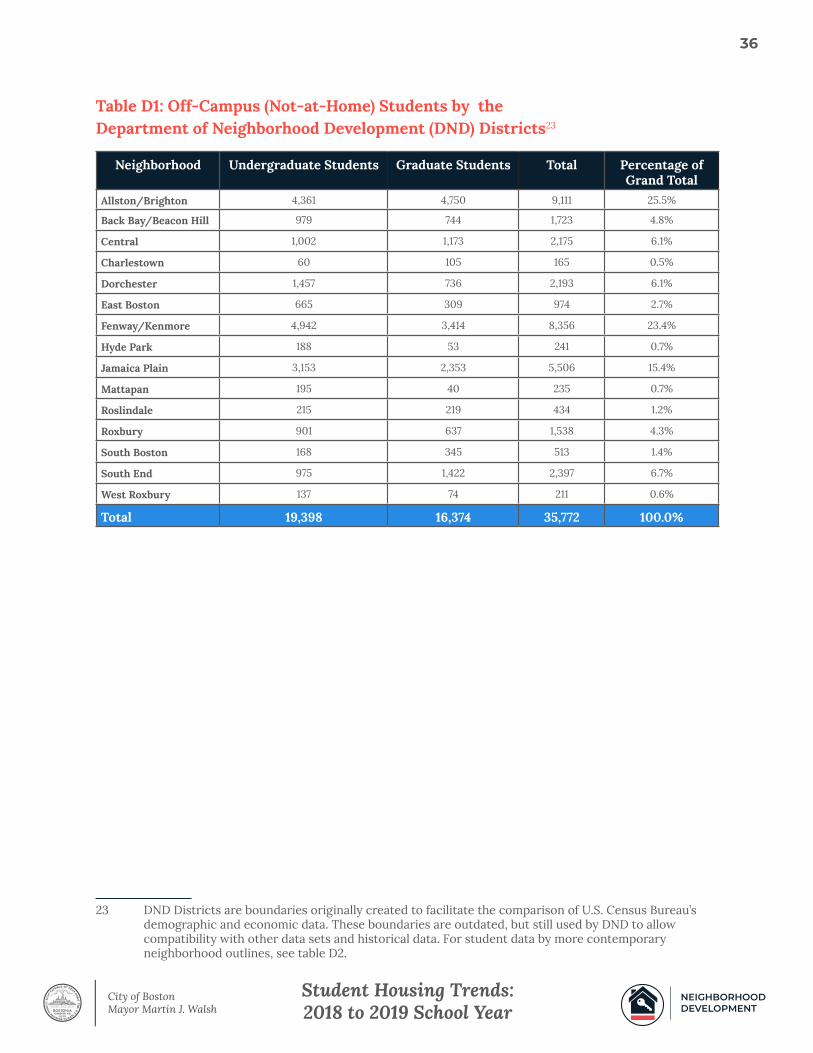
Table D1: Off-Campus (Not-at-Home) Students by the Department of Neighborhood Development (DND) Districts23
23 DND Districts are boundaries originally created to facilitate the comparison of U.S. Census Bureau’s demographic and economic data. These boundaries are outdated, but still used by DND to allow compatibility with other data sets and historical data. For student data by more contemporary neighborhood outlines, see table D2.
Neighborhood Undergraduate Students Graduate Students Total Percentage of Grand Total
Allston/Brighton 4,361 4,750 9,111 25.5%
Back Bay/Beacon Hill 979 744 1,723 4.8%
Central 1,002 1,173 2,175 6.1%
Charlestown 60 105 165 0.5%
Dorchester 1,457 736 2,193 6.1%
East Boston 665 309 974 2.7%
Fenway/Kenmore 4,942 3,414 8,356 23.4%
Hyde Park 188 53 241 0.7%
Jamaica Plain 3,153 2,353 5,506 15.4%
Mattapan 195 40 235 0.7%
Roslindale 215 219 434 1.2%
Roxbury 901 637 1,538 4.3%
South Boston 168 345 513 1.4%
South End 975 1,422 2,397 6.7%
West Roxbury 137 74 211 0.6%
Total 19,398 16,374 35,772 100.0%
NEIGHBORHOOD DEVELOPMENT
Student Housing Trends: 2018 to 2019 School Year
37
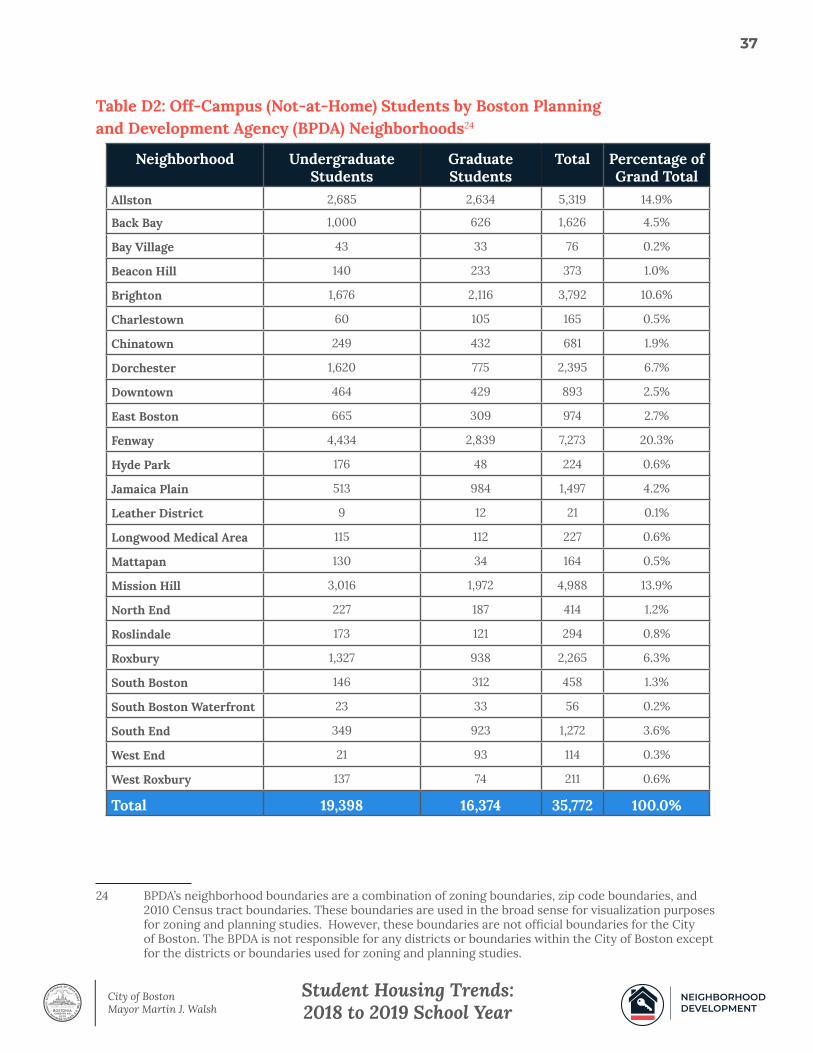
Table D2: Off-Campus (Not-at-Home) Students by Boston Planning and Development Agency (BPDA) Neighborhoods24
24 BPDA’s neighborhood boundaries are a combination of zoning boundaries, zip code boundaries, and 2010 Census tract boundaries. These boundaries are used in the broad sense for visualization purposes for zoning and planning studies. However, these boundaries are not official boundaries for the City of Boston. The BPDA is not responsible for any districts or boundaries within the City of Boston except for the districts or boundaries used for zoning and planning studies.
Neighborhood Undergraduate Students
Graduate Students
Total Percentage of Grand Total
Allston 2,685 2,634 5,319 14.9%
Back Bay 1,000 626 1,626 4.5%
Bay Village 43 33 76 0.2%
Beacon Hill 140 233 373 1.0%
Brighton 1,676 2,116 3,792 10.6%
Charlestown 60 105 165 0.5%
Chinatown 249 432 681 1.9%
Dorchester 1,620 775 2,395 6.7%
Downtown 464 429 893 2.5%
East Boston 665 309 974 2.7%
Fenway 4,434 2,839 7,273 20.3%
Hyde Park 176 48 224 0.6%
Jamaica Plain 513 984 1,497 4.2%
Leather District 9 12 21 0.1%
Longwood Medical Area 115 112 227 0.6%
Mattapan 130 34 164 0.5%
Mission Hill 3,016 1,972 4,988 13.9%
North End 227 187 414 1.2%
Roslindale 173 121 294 0.8%
Roxbury 1,327 938 2,265 6.3%
South Boston 146 312 458 1.3%
South Boston Waterfront 23 33 56 0.2%
South End 349 923 1,272 3.6%
West End 21 93 114 0.3%
West Roxbury 137 74 211 0.6%
Total 19,398 16,374 35,772 100.0%
NEIGHBORHOOD DEVELOPMENT