struktol company of america - supplier of rubber and ... 2001 acs paper no 79.pdf · struktol...
TRANSCRIPT

Struktol Company of America 201 E. Steels Corners Road • P. O. Box 1649 • Stow, Ohio 44224-0649
Phone: (330) 928-5188Fax: (330) 928-8726
Technical Services: 1-800-327-8649 Internet: www.struktol.com
Producers of Specialty Chemicals
Paper No. 79 STP0208
ZINC SOAP EFFECTS ON TESPT AND TESPD TREATED SILICA COMPOUNDS ON PROCESSING AND SILICA
DISPERSION DURING MIXING IN NATURAL RUBBER
by Kwang-Jea Kim
John VanderKooi*
Struktol Company of America
201 E. Steels Corners Road P.O. Box 1649
Stow, OH 44224-0649
Presented at a meeting of the
Rubber Division, American Chemical Society
Cleveland, Ohio
October 16-19, 2001 *Speaker
1
ZINC SOAP EFFECTS ON TESPT AND TESPD TREATED SILICA COMPOUNDS ON PROCESSING AND SILICA DISPERSION DURING
MIXING IN NATURAL RUBBER
Kwang-Jea Kim* and John VanderKooi
Struktol Company of America, Polymer Processing & Additives R&D
Stow, OH 44224-0649
ABSTRACT
A zinc soap (ZB) was added into the TESPT (bis(trietoxysilylpropyl) tetrasulfide) and the TESPD (bis(trietoxysilylpropyl) disulfide) treated silica and its effects on NR (natural rubber) compounds were investigated based on processability, rheology, mechanical properties and silica dispersion. The ZB improved the mechanical property, torque between maximum and minimum, modulus, silica particle dispersion, density of the compounds, and reduced the cure time; and lowered the viscosity, tanδ values, heat generation during mixing in the internal mixer, reverting cure behavior, ODR minimum torque, viscosity, maximum tensile stress, maximum elongation%, abrasion loss, and swell ratios. The most significant improvement was found from the blowout experiment with the addition of the ZB. The ZB effects were more significant at higher concentration. * Author to whom correspondence should be addressed.
2
INTRODUCTION
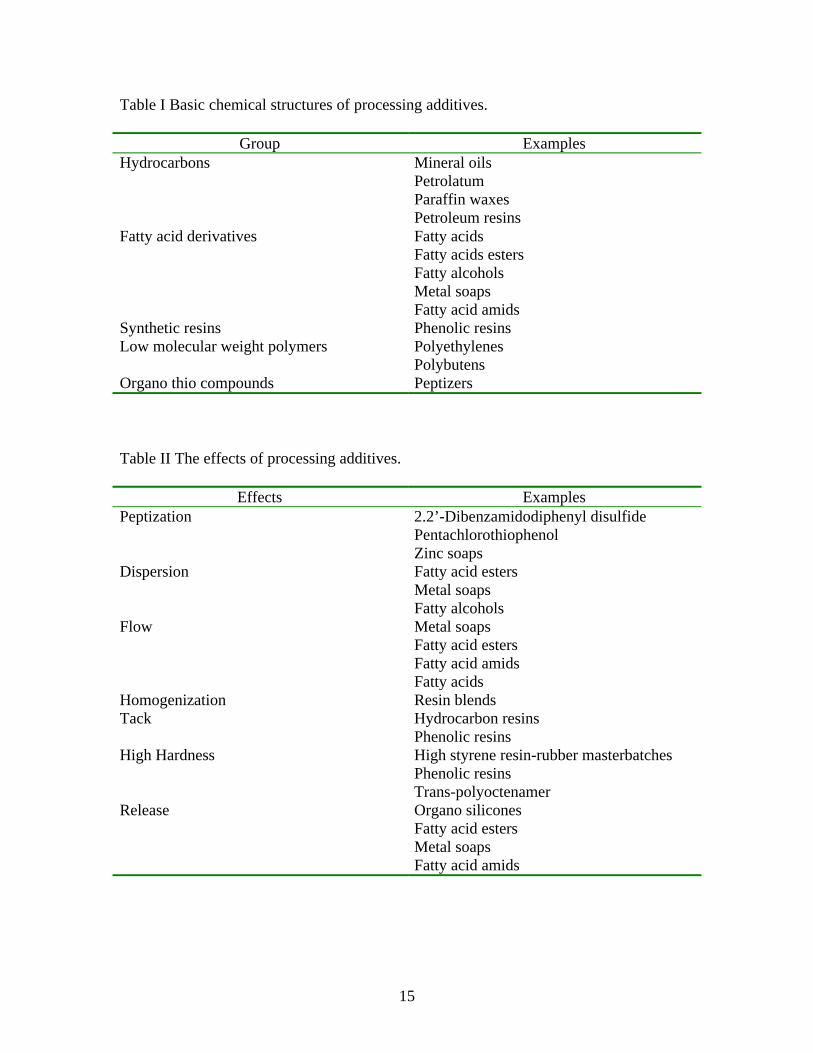
Processing additives are material used at relatively low dosage levels, which improves processing characteristics without significantly affecting physical properties. In the early years, the classic additives such as mineral oil, bees wax, stearic acid, and palmitic acid etc. were used as a natural raw materials, which are not constant as regards composition and quality. In recent years, they maintained a high standard through appropriate purification process. The growth rate of additives such as homogenizers, peptizers, and lubricants increased about four times between 1980 and 19951. The chemical structures of the processing agents are classified as hydrocarbons, fatty acid derivatives, synthetic resins, LMW (low molecular weight) polymers, and organic thio compounds as shown on Table I. Their effects are subdivided as peptisation, dispersion, flow, homogenization, tack, high hardness, and release etc. as shown on Table II. Several additives such as fatty acid esters act as lubricant and dispersing agents. Sulfur containing bifunctional coupling agents have been studied since 1970’s to improve the processability at the mixing stage and to improve the chemical bonding between silica and rubber chain at the vulcanization stage2,3.
Bifunctional organosilanes such as TESPT and TESPD had been used in the ‘green tire’ tread compound as a processing aids during mixing and acted as a chemical bonding agent at the vulcanization stage between silica and rubber matrix due to their bifunctional characteristics. On the one end of the alkoxy group reacts with the silanol group on the silica surface via hydrolysis mechanism4-7. The other end of the sulfur reacts with the rubber chain at the vulcanization stage8 and covalently bonds between silica and rubber chain9. Studies on green tire compounds using silane were mainly based on the SBR/BR compounds11-18. Green tire exhibits low rolling resistance, good wet and snow traction19, which improves low gas mileage, good grip on road surface. However, silica particle exhibited more difficult to process and disperse in rubber matrix than other particles14,20,21 due to their polar and hydrophobic character22,23. There have been works to disperse the silica agglomerates mechanically, chemically, and physically etc15,24-32, however, there were no researches of polysulfidic silane treated silica compound in the NR matrix.
The NR compounds have been used in the area of airplane tire, winter tire, fork lift tire, and medium and heavy-duty truck tire industries due to their abrasion-, cutting-, tear-, rolling resistance, and adhesion on steel surface. They also used in the area of building’s vibration absorption against earthquake10. The NR is non-polar and has more double bonds than that of the SBR.
Various zinc soaps such as zinc stearate, zinc laurate, zinc tallowate, zinc naphthenate, zinc resinate, and zinc 2-ethylhexanoate (ZEH) are currently used in the rubber compounds as additives. Depending on their structure such as carbon chain length, chain length distribution, polarity, and branching, their final product property varies. Most zinc soaps act as an intermolecular lubricant because they are rubber soluble. They improve surfactant action as their hydrocarbon chain length (Cx) increased longer than C10. Unsaturated zinc soap such as zinc tallowate improves dispersibility. Even though large amount of additives are used in the industry now, there were few systematic theory or researches33 on the zinc soap illustrated above.
3
We present the effects of the ZB (a class of zinc soap), which developed in our lab, on TESPT and TESPD treated silica compounds in the NR compound during mixing and after vulcanization. Processability, silica agglomerate dispersion, and mechanical properties of each compound were compared.
EXPERIMENTAL
Materials
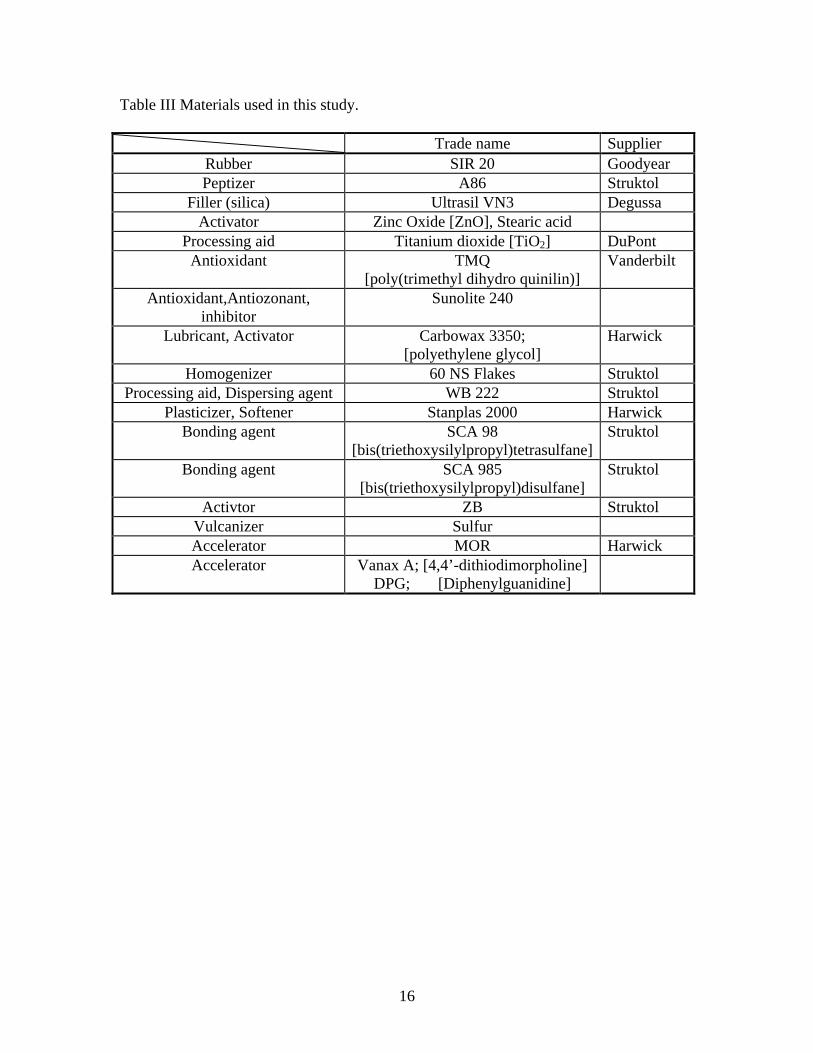
The silanes used in this study were the TESPT and the TESPD trade name SCA98 and SCA985, which were a product of Struktol. The ZB used in this study is in commercial evaluation from Struktol R&D.
The elastomer used was natural rubber (polyisoprene rubber), which was a Goodyear product by the brand name of SIR-20.
The silica used was Ultrasil VN3, which is precipitated silica with BET area 175 (m2/g) supplied by Degussa.
Various additives including activator (zinc oxide), processing aids (stearic acid, Sunolite 240, Carbowax 3350), titanium dioxide, anti oxidant (TMQ), homogenizer (60NS Flakes), WB222, Stanplas 2000, curing agent (Sulphur), and accelerators (MOR, Vanax A, DPG) were used. The information on the materials used in this study was summarized on Table III.
Mixing
Banbury internal mixer (BR 1600) was used compounding rubber and additives and a data acquisition computer was attached to the banbury mixer to obtain the data at the time of mastification. Two stage mixings were carried. The first stage was compounding of rubber, filler, and additives. At the second stage, sulfur and other accelerators were added into the first stage compound. The fill factor was fixed at 0.7 and the starting operation temperature of mixer was set to 65.5 oC. The rotor speed was set to 77 RPM.
The stock temperature changes during mixing were recorded in the computer and the data were analyzed. The mixing formulations and vulcanizations are included in Table IV.
Scanning Electron Microscope (SEM) Characterization
A Hitachi S-2150 SEM was used to characterize the order of agglomerate particle size. The prepared compounds were fractured in liquid nitrogen and coated with silver using sputter coater. The SEM pictures of agglomerate particles were characterized using an Image Analyzer (IA) system Leica LQ500MC. The individual particle diameters were converted to mass average particle diameter. Average agglomerate sizes were generally represented in terms of higher averages because of the problem of subjectivity in dealing with small particles. Specifically we have used the ‘mass’ or ‘z+1’ average34,35.
i
iin ÓN
dÓNd
⋅=
4
ii
iiiw dÓN
ddÓNd
⋅=
3
3
ii
iiim dÓN
ddÓNd
⋅=
n
wd d
dp = (2.1a,b,c,d)
where dn, dw, and dm are number-, weight-, and mass average particle agglomerate diameter respectively, pd is polydispersity, di is diameter of i-th particle, Ni are the number of diameters of silica agglomerate diameter di.
Shear Viscosity Measurement
Shear viscosity was measured in a pressurized rotational rheometer with a biconical rotor. This was the instrument described by Montes et al36, which measures the viscosity at various speeds. The shear rate and shear stress were given by
áÙ
ã =⋅
(2.2a)
312 4
3
ðR
Mó = (2.2b)
where Ω is the angular velocity, α is the cone angle, M is the torque and R is the cone radius.
Reversion Test
Rheometer ODR (oscillating disc cure meter) 2000 manufactured from Monsanto Co. was used measuring vulcanization and reversion resistance property of the compounds following ASTM D 2084 at 160 oC. This instrument measures the vulcanazation characteristics of vulcanizable rubber compounds at a constant speed in a pressurized rotational biconical rotor. The oscillation frequency was 100 cycles/min (1.66 Hz) with amplitude of 3o. Minimum torque (ML), scorch time (ts2), cure time (ts90), maximum torque (MH), and reversion resistance time were measured.
Viscoelastic Property (Tanδ) Before Vulcanization
The rubber compounds after second stage mixing were characterized using the RPA 2000 manufactured by Monsanto, which uses a biconical dies in a pressurized sample chamber. The tip of each convex center of the two cones is facing each other. The relations are as follow

5
áè
ã2
= (2.3)
where γ is the strain, θ is the angle of the oscillation die, and α is the cone angle.
This instrument measures viscoelastic properties of the compounds using sinusoidal deformation. The tanδ and dynamic viscosity were measured at various temperatures and shear rates. The temperature measured were ranges from 60 to 140 oC at 1Hz and the shear rates were from 0.03 to 34 (1/s) at oscillation angle 1o. Oscillatory dynamic signal responses were measured and recorded as the elastic and the dynamic viscous property as follow34,35
tanδ = G”/G’ (2.4a) G’(ω) = G* cosδ (2.4b) G”(ω) = G* sinδ (2.4c) η’(ω) = ωG” = G* sinδ (2.4d)
where ω represents oscillation frequency, G* is the modulus; δ is the phase angle, G’(ω) is the storage modulus, G”(ω) is the loss modulus, and η’(ω) is the dynamic shear viscosity.
Viscoelastic Property (Tanδ) After Vulcanization
Vulcanized materials were characterized using Mechanical Energy Resolver (MER-1100B) manufactured by Instrumentors, Inc. This instrument measures oscillatory input of axial tension/compression response of the cylindrical specimen as shown in Figure 1(b). Oscillatory tension/compression signal responses depending on material were measured as follow37
E’(ω) = E* cosδ (2.5a) E”(ω) = E* sinδ (2.5b) σ = (E’+iE”) ε =E* ε (2.5c) E* = (E’2 + E”2)1/2 = E’[1 + (tanδ)2]1/2 (2.5d) ωηel= E” (2.5e)
where ω represents oscillation frequency, E* is the complex dynamic modulus, δ is the phase angle, E’(ω) is the real dynamic modulus, E”(ω) is the imaginary dynamic modulus, and ηel(ω) is the tensile viscosity.
Tensile Test
The tensile test curves were obtained from the dumbbell shaped specimens measured following ASTM D 412-87 method. The tensile stress maximum (Pa), elongation at 100, 200, and 300% %, and modulus (Pa) of each compound was measured.

6
The thickness and the width of the specimens were average 2.2mm and 6.3 mm, respectively.
Extrusion Characteristics
Capillary extrudate swell ratio d/D (d: extrudate diameter, D: die diameter) of each system were measured using the ‘Rheo-Tester1000’ rheometer manufactured from Göettfert at the wall shear rate of 1,000 (sec-1) at 100 oC. The die used was L/D 15 with die diameter of 1.5mm.
Heat Build Up (HBU) and Blowout (BO) Test
The “Firestone Flexometer”38 was used measuring heat build up and blowout of the sample as of ASTM D 623. This is a testing apparatus for applying a uniform circulatory oscillating action under compression. The test specimen is located between the fixed upper part and the moving bottom part. The bottom part is circulatory oscillating at constant speed of 13.1 Hz (787 RPM). The amplitude of the lower moving part was 7.62 mm. The compression pressure applied was 0.78 MPa on the HBU and 1.73 MPa on the BO sample. The test specimen was in the shape of a frustum of a rectangular pyramid with dimensions; base, 54 by 28.6 mm; top, 50.8 by 25.4 mm; and altitude, 38.1 mm. For HBU test, the inside temperature of each specimen was probed after 45 min. running. For BO test, the dimensions of the center part of the sample were measured and their deformation ratios (%) deviated from before tests were presented. The BO samples were further tested until the sample blowout and the blowout time were measured.
Abrasion Loss Test The abrasion loss of each cured compound was measured using the APH-40 abrasion tester manufactured from Hampton Test Equipment Limited. An abrasive paper P-60 (DIN 53512) attached to the 150mm diameter was rotating at the speed of 40 RPM. The cylindrical sample (Diameter; 16mm) with 10 mm thickness inserted into the sample holder traveled over the surface of the abrasive paper at a rate of 0.32 m/sec under a loading of 10 N for a distance of 40 m. After the abrasion test, the test sample was removed, and weighing and calculation determine its volume loss. The each debris collected from abrasion test was converted to volume loss from the density of each compound using following relation.
S
SmA
⋅⋅∆
=ρ
0 (2.6)
where A is the abrasion (mm3), ∆m is the loss (mg), ρ is the density (g/cm3), S0 is the normal abrasion grade (200 mg), and S is the abrasive grade (mg).
7
RESULTS AND DISCUSSION
Temperature and Power Changes During Mixing The stock temperature changes during mixing were presented in Figure 1. The
addition of the ZB into the S4 compounds lower the stock temperature as well as the S2 compounds. As the concentration of the ZB increased from 0 to 1 wt%(2 parts) and 3 wt%(5 parts), the slope of the temperature rises on the S4 compound decreased from 1.276 to 1.236 and 0.176 each during mixing and that of the S2 systems decreased from 1.336 to 1.288 and 1.184. The S2, S2Z2 (1 wt% ZB), and S2Z5 (3 wt% ZB) compounds generated more heat and consumed more power than that of the S4, S4Z2 (1 wt% ZB), and S4Z5 (3 wt% ZB) compounds during mixing, respectively.
Steady Shear Viscosity
The shear viscosity of each compound from internal mixer is summarized in Figure 2. The addition of the TESPT and the TESPD reduced the viscosity of the NR thus the S4 and the S2 compounds exhibited lower viscosity than that of the NR. The addition of the ZB in the S4 and the S2 compound further lowered the viscosity of the S4 and the S2 compound each thus the NR/silane/silica/ZB compounds exhibited lower viscosity than the NR/silane/silica compounds. As the concentration of the ZB increased in the compounds, the viscosity of each compound decreased i.e. S4 > S2, S4S2 > S4S5, and S2Z2 > S2Z5. It is common trend that the viscosity increases as the filler concentration increases due to large filler surface area contacting polymer chains21,32-
35,39,40. The viscosity reductions of the silane treated silica compounds were reported previously32,40. The oil lubricate between the oleophilic silica (treated silica) and the rubber matrix, and between the rubber-rubber chains39. The oil effects on emulsification of the calcite and talc particles were also discussed in the polystyrene matrix40.
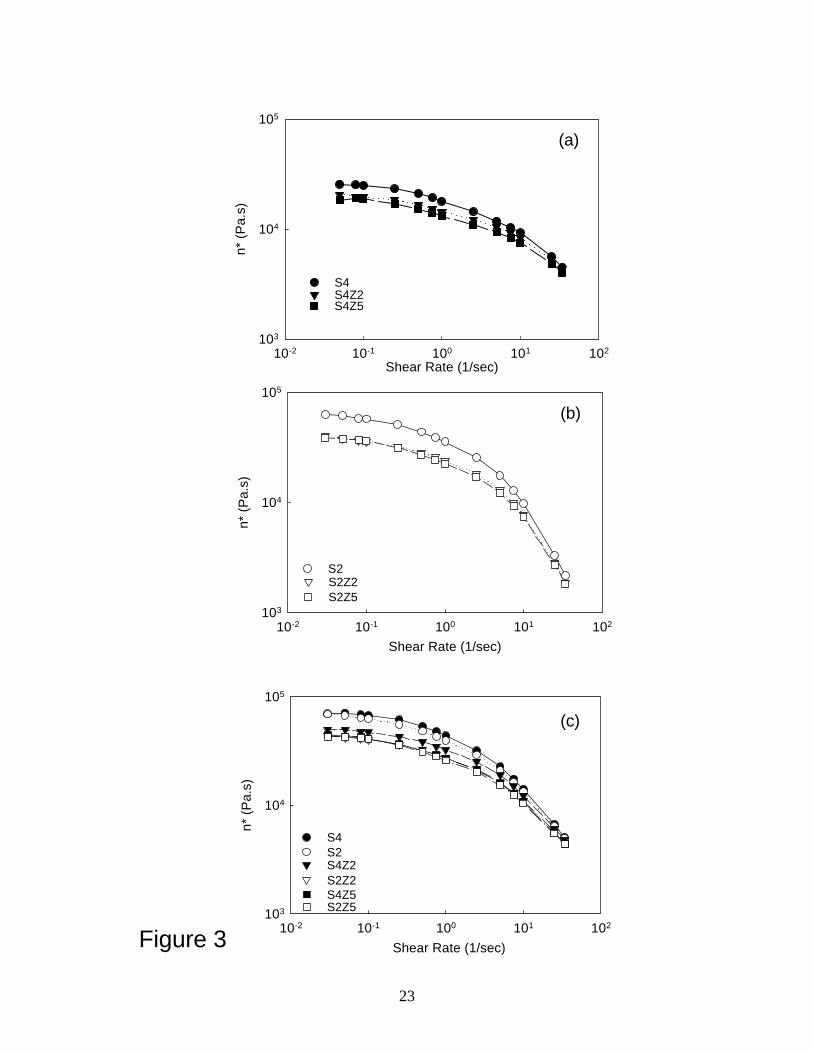
Complex Viscosity
The complex viscosity dependence on shear rate measured at 100 oC and 1% strain using the RPA is shown in Figure 3. As the concentration of the ZB increased, the complex viscosity of the S4 and the S2 compounds decreased. The ZB effects on the S2Z2 and the S2Z5 seem close together. As the shear rate increased the viscosity of each compound decreased due to shear thinning as explained from other researches41. The complex viscosity of the S4, S4Z2, and S4Z5 compounds exhibited slightly higher than that of the S2, S2Z2, and S2Z5 compounds, respectively. The addition of the ZB reduced the viscosity of the S4 and the S2 compounds i.e. S4 > S4Z2 > S4Z5 and S2 > S2Z2 > S2Z5, which exhibited same trend of the steady shear viscosity measurement as shown above. Over all, the addition of the ZB reduced the complex viscosity of the S4 and the S2 compounds.
8
Mooney Viscosity
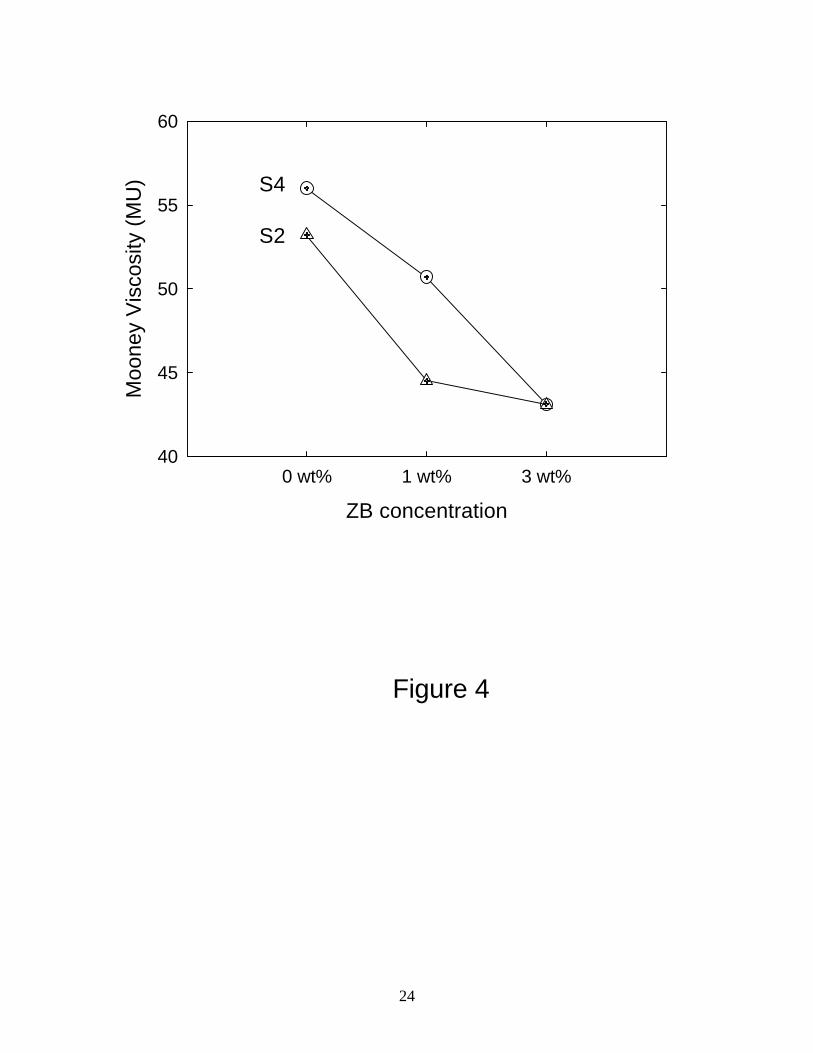
The Mooney viscosity dependence on the ZB concentration at 0.2 rad/sec and 100 oC is represented in Figure 4. As the concentration of the ZB increased, the complex viscosity of the S4 and the S2 compounds decreased. The Mooney viscosity of the S4 and S4Z2 compounds exhibited higher than that of the S2 and S2Z2 compounds, respectively. The addition of the ZB reduced the viscosity of the S4 and the S2 compounds i.e. S4 > S4Z2 > S4Z5 and S2 > S2Z2 > S2Z5, which exhibited the same trend of the steady shear and the complex viscosities measurement as shown above. At higher ZB concentration, the viscosity of the S4Z5 and the S2Z5 compounds exhibited close to each other. Over all, the addition of the ZB reduced the Mooney viscosity of the S4 and the S2 compounds and it depended on the ZB concentration.
Viscoelastic Property (Tanδ) Before Vulcanization
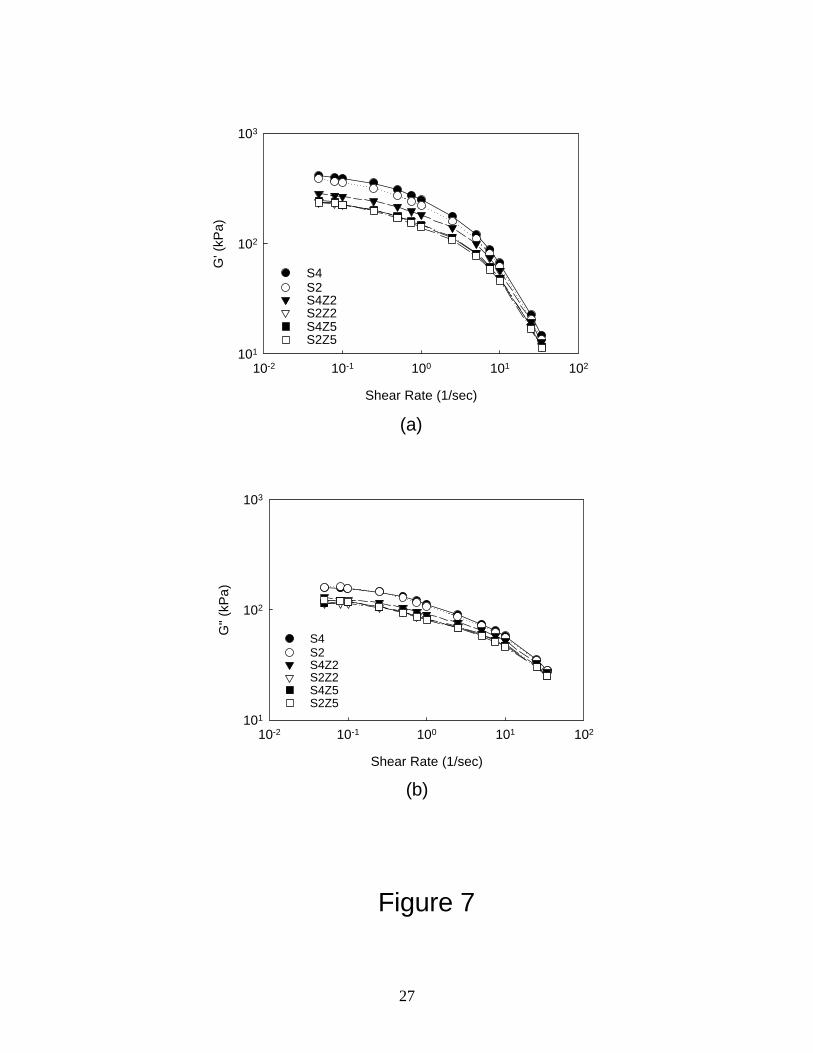
The tanδ values (G”/G’) dependence on the shear rate of each compound before vulcanization is presented in Figure 5. The addition of the ZB increased the tanδ values of each compound from around 0.35 to 0.40 at 60 oC (not shown) and from around 0.46 to 0.58 at 100 oC, 1 Hz, and 1 (1/sec) i.e. S4 < S4Z2 < S4Z5 and S2 < S2Z2 < S2Z5. Figure 6 represents the tanδ value changes at different temperatures and at different ZB concentrations. As the temperature increased from 60 oC to 100 oC the tanδ values of the S4, S4Z2 and S4Z5, and the S2, S2Z2 and S2Z5 compounds increased. The tanδ values of the S4, S4Z2 and S4Z5 compounds exhibited lower than that of the S2, S2Z2 and S2Z5 compounds at both temperatures and they increased as the ZB concentration increased. This results from the lower elastic modulus (G’) of the S2, S2Z2 and S2Z5 compounds due to increase of the ZB concentration, while the loss modulus (G”) of each compound close together i.e. S4 ≈ S2, S4Z2 ≈ S2Z2 and S4Z5 ≈ S2Z5 as shown in Figure 7.
Over all, the addition of the ZB increased the tanδ value of each compound and this further increased them as the concentration of the ZB increased due to lower G’. Thus the addition of the ZB increased the processability during internal mixer mixing
Viscoelastic Property (Tanδ) After Vulcanization
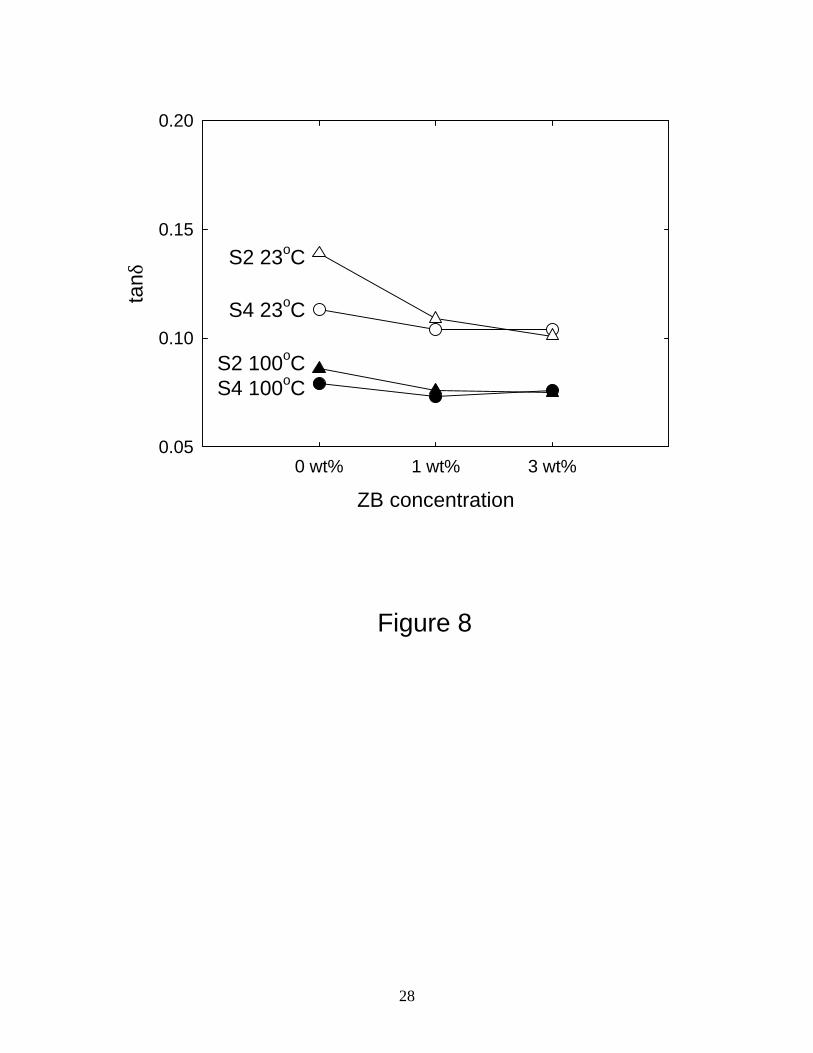
Figure 8 represents the tanδ values (E”/E’) as a function of the ZB concentration of each compound after vulcanization at 23 oC and 100 oC. As the test temperature increased from 23 oC to 100 oC the tanδ value of each compound decreased, which was the opposite trend compared with the unvulcanized systems. The tanδ values of the TESPT treated silica compounds exhibited lower than that of the TESPD treated silica compounds at both temperatures and they were decreased as the ZB concentration increased, which were also the opposite trend compared with the unvulcanized systems. The lower tanδ values of the TESPT treated compounds result from the higher elastic properties (E’) of the TESPT treated compounds while the loss modulus (E”) differences of the same ZB concentration were almost zero (not shown), which was similar to unvulcanized systems (see Figure 7), respectively. The addition of the ZB decreased the
9
tanδ values and further decreased them as the ZB concentration and the temperature increased, which was the opposite result compared with the unvulcanized systems. At higher ZB concentration, the tanδ values differences between S4Z5 and S2Z5 became close together.
Over all, this represent the ZB acted as a lubricant during mixing and increased the degree of cross-linking as the ZB concentration and the temp increases after vulcanization.
Reversion Test
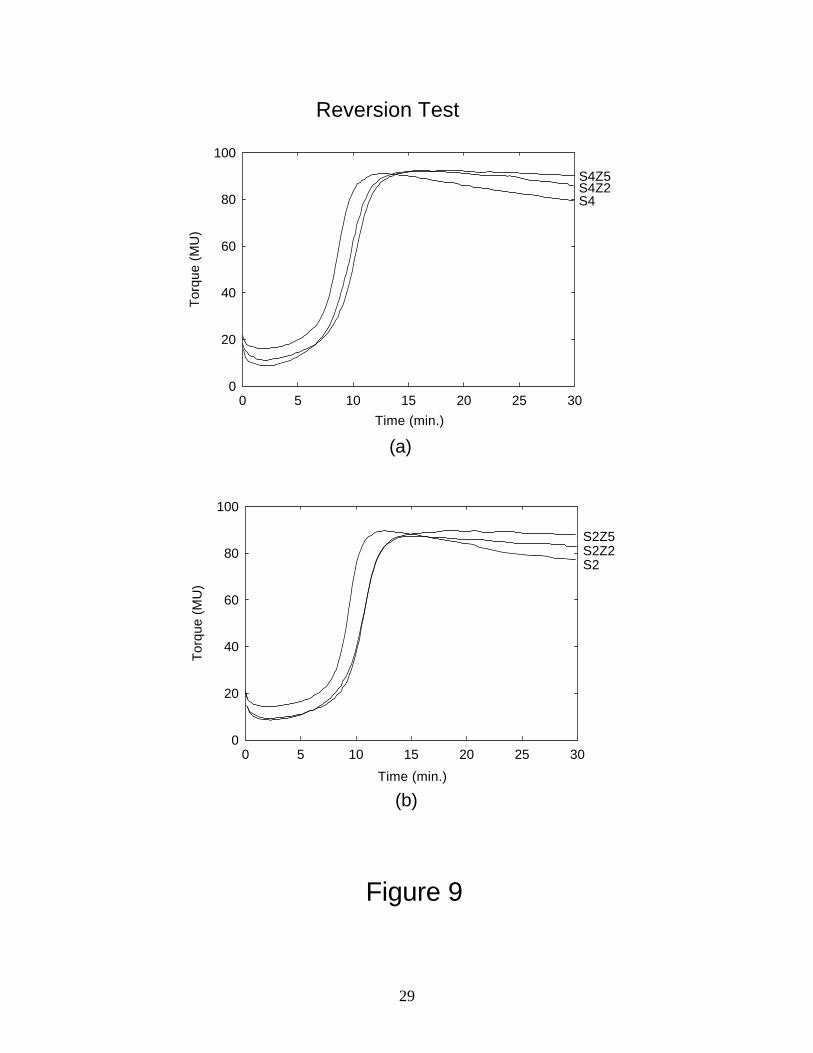
Figure 9 shows the vulcanization curve of the S4, S4Z2, S4Z5, S2, S2Z2, and S2Z5 compounds with respect to time increment at 160 oC for 30 min. The addition of the ZB increased the reversion time. As the concentration of the ZB increased the reversion time of the each compound (S4Z2, S4Z5, S2Z2 and S2Z5) increased. At the same ZB concentration, the S4, S4Z2, and S4Z5 compounds exhibited higher maximum and minimum torque than those of the S2, S2Z2, and S2Z5 compounds, respectively. The S4Z5 and S2Z5 compounds exhibited no reversion torques for 30 min. at 160oC. As the ZB concentration increases, the torque rise from minimum to maximum increased, which implies higher degree of 3-dimensional network formed. The S4, S4Z2 and S4Z5 compounds exhibited higher minimum torque, higher maximum torque, and faster cure time than those of the S2, S2Z2 and S2Z5 compounds, respectively. The higher minimum torque of the S4 compound matches with the shear viscosity data and the Mooney viscosity as previously shown. The high torque of the S4, S4Z2 and S4Z5 compounds might result from the higher amount of sulfur level than those of the S2, S2Z2 and S2Z5 compounds, respectively. At the same weight, the TESPT compounds (S4, S4Z2 and S4Z5) have higher sulfur level than those of the TESPD compounds (S2, S2Z2 and S2Z5). We summarized the maximum and minimum torque, scorching, cure, reversion, and maximum torque time on Table V.
Over all, the addition of the ZB increased the reversion time and the degree of cross-linking and they were proportional to the ZB concentration.
Tensile Test
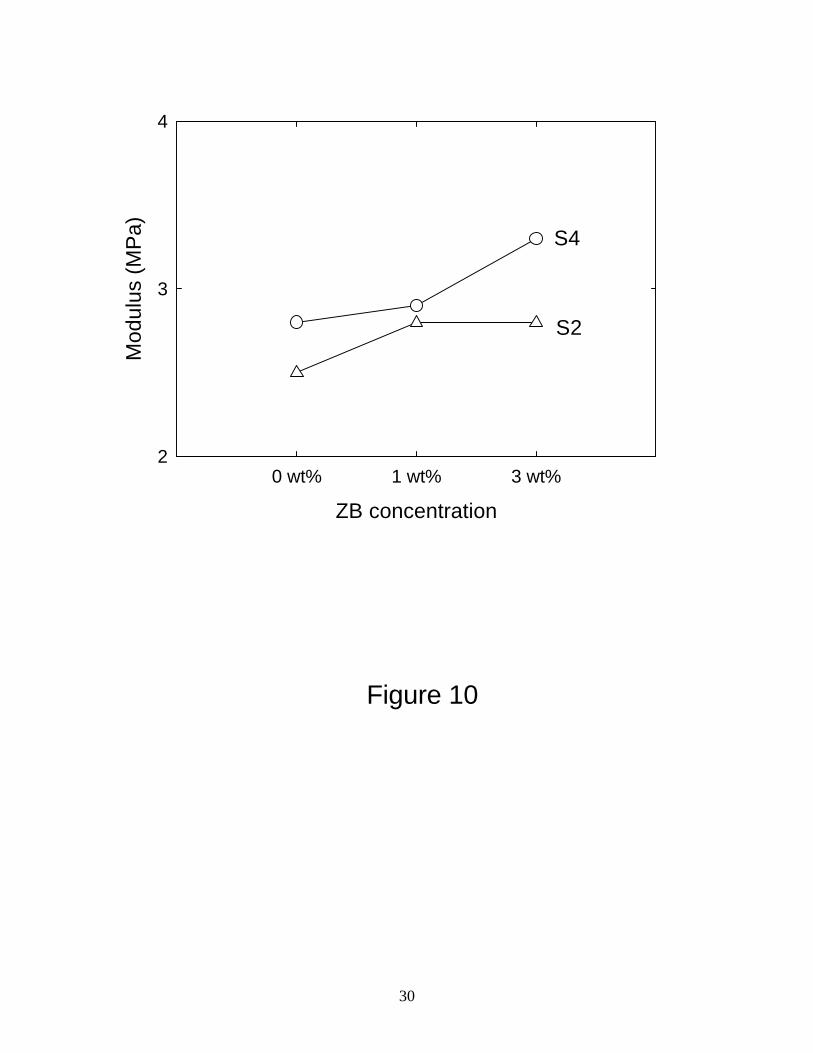
Figure 10 represent the modulus changes depend on ZB concentration at 100% elongation, which measured from the dumbbell shaped specimens following ASTM D 412-87 method. At 100, 200, and 300% elongation, as the ZB concentration increased from zero to 1 and 3 wt% ZB, the modulus of each compound increased. As the concentration of the ZB increased the maximum elongation% and the maximum tensile stress decreased. The TESPT treated compounds exhibited lower maximum elongation% and the maximum tensile stress than that of the TESPD treated compounds, respectively. We presented various tensile properties measured from dumbbell shape specimen on Table 6.

10
Extrusion Characteristics The capillary extrudate photographs of each compound taken at shear rate 1,000 (sec-1) are shown in Figure 11. The surface appearance of the NR extrudate improved by the addition of the TESPT, TESPD and ZB. The order of the extrudate swell ratio was reduced from the NR to the S4, the S4Z2 and the S4Z5, and to the S2, S2Z2 and the S2Z5 compounds each as shown in Figure 12. There were no significant differences between S2 and S4 compounds in swell reduction.
Blowout (BO) and Heat Build Up (HBU)
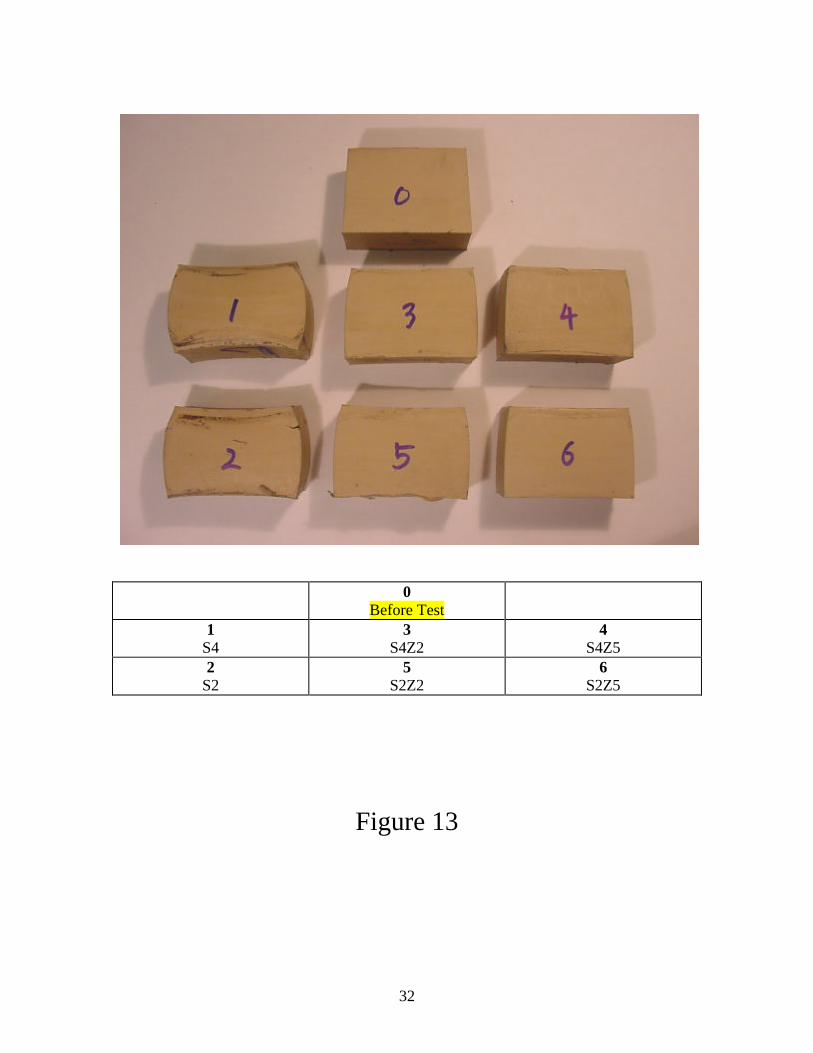
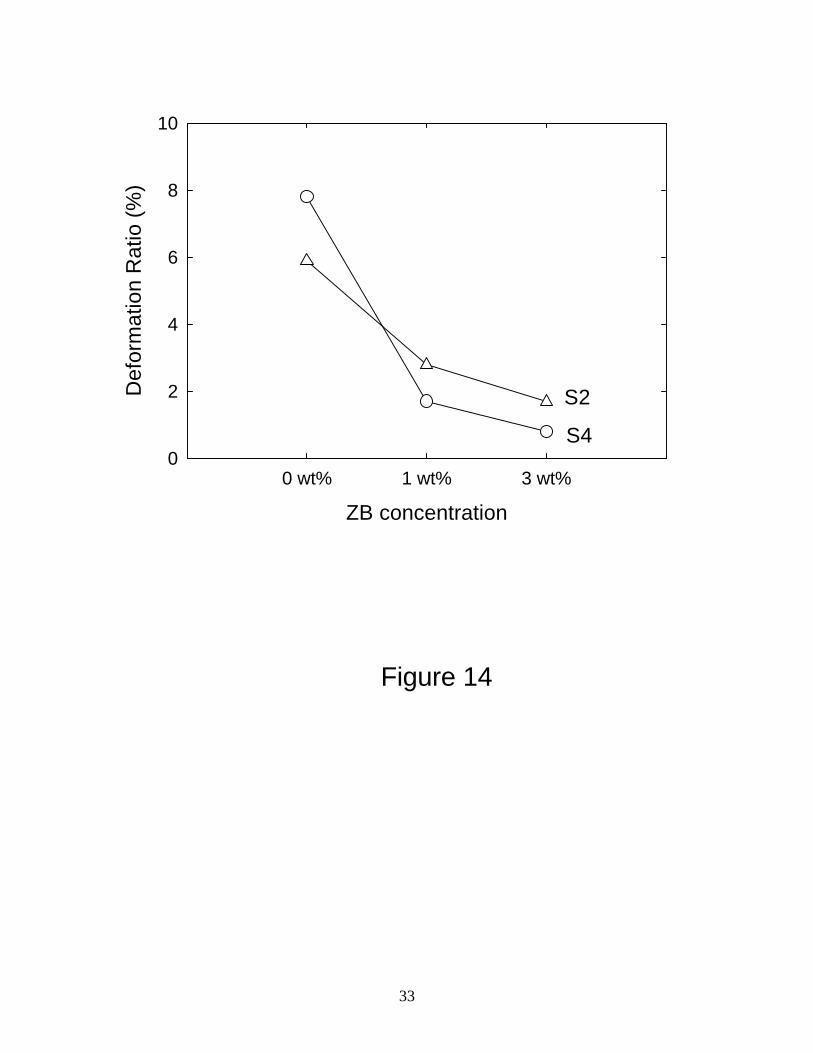
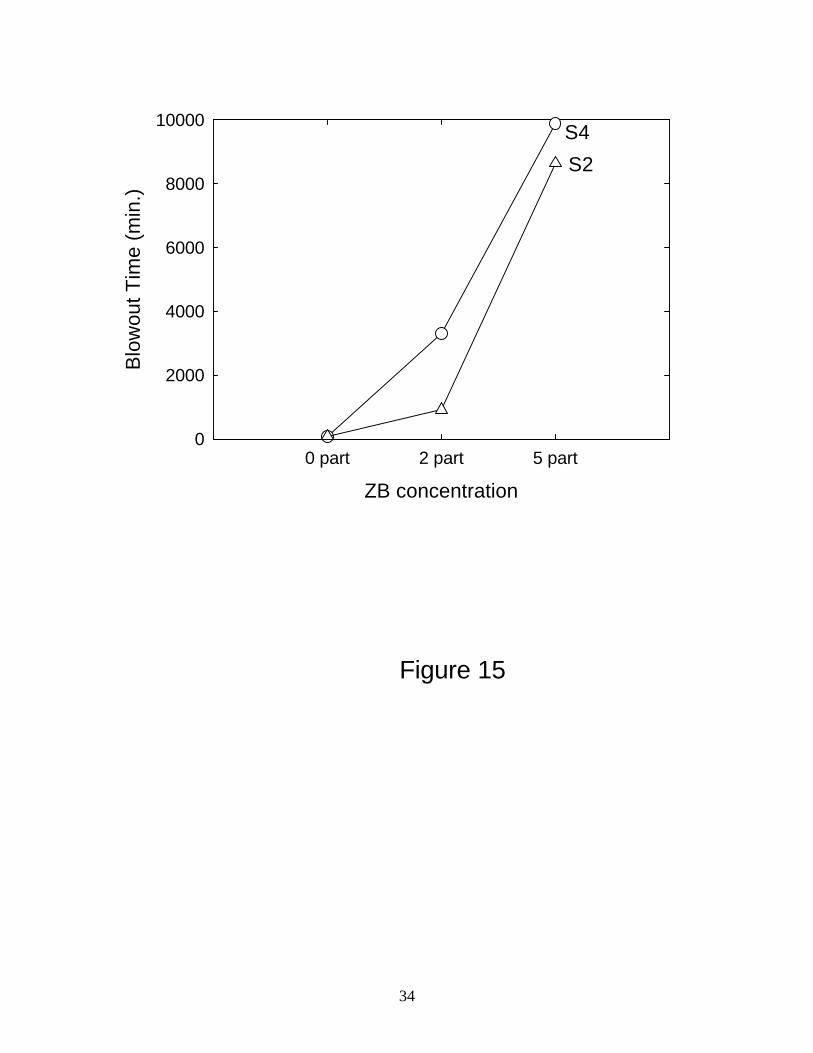
Figure 13 represents the photograph of the BO specimen after BO test following ASTM D 623 using ‘Firestone Flexometer’. The deformation ratios measured from each specimen were plotted in Figure 14. The addition of the 3 wt% ZB into the S4 and the S2 compounds lowered the deformation ratio from 8% to 1% and 6% to 2%, respectively. For comparing the S4 and the S2 compound, the S2 compound exhibited less deformation than that of the S4 compound. However, after addition of the ZB, the S4 compound exhibited less deformation than that of the S2 compound, which was opposite result compared to without the ZB addition. This will be discussed later in this section. These samples were further tested under the same condition with the BO test until the sample blow out. The addition of the 3 wt% ZB into the S4 compound increased the BO time from 84 min to 9,900 min and that of the S2 compounds increased from 81 min to 8,600 min. The S4, S4Z2 and S4Z5 compounds exhibited higher BO time than that of the S2, S2Z2 and S2Z5 compounds, respectively. The temperature generated by the circular oscillation movement from each sample was measured. The addition of the 3 wt% ZB into the S4 compound decreased the HBU temperature from 118oC to 107oC and that of the S2 compounds decreased from 121oC to 106oC.
Over all, the addition of the ZB lowered the deformation ratio, lowered the HBU temperature and extended the BO time and they were proportional to the concentration of the ZB. Those represent the addition of the ZB into the TESPT and TESPD compounds form stronger 3-dimension network and the TESPT network were stronger than that of the TESPD compound. The ZB seems more interactive with the TESPT than with the TESPD. The concentration of the sulfur exist in the TESPT compounds is higher than that of the TESPD. The excessive sulfur exist in the TESPT compounds might increased the 3-dimensional network in the compound than in the TESPD.
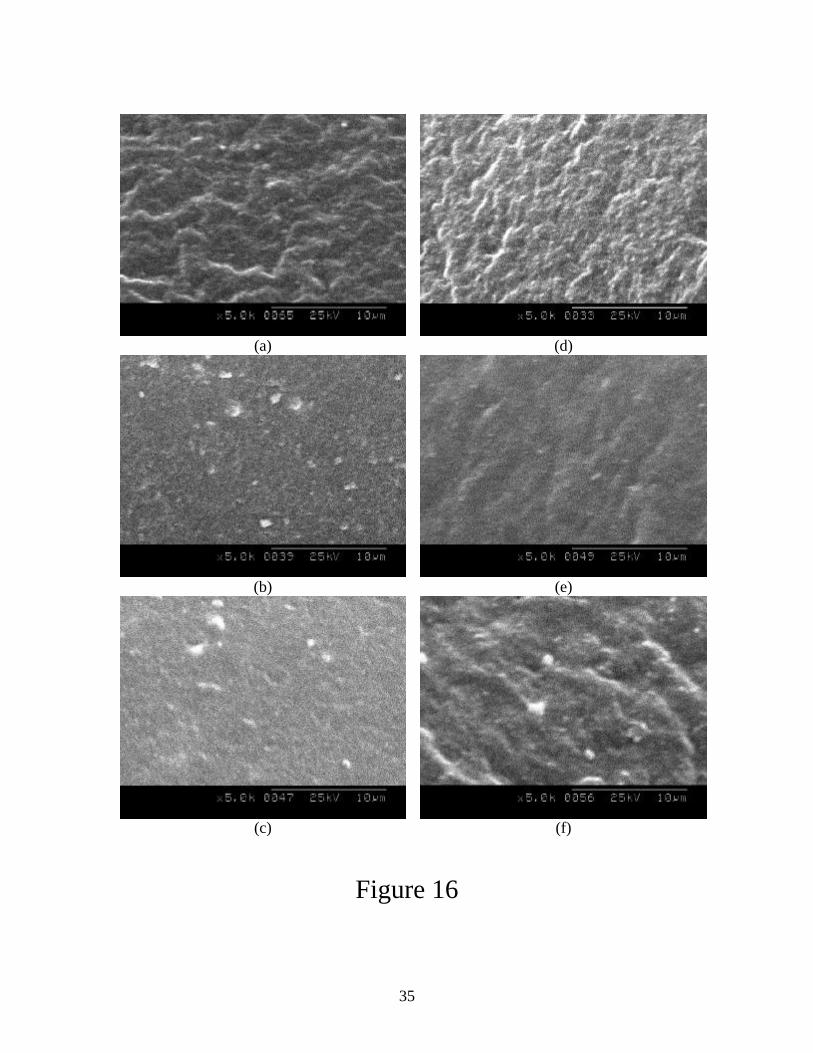
Scanning Electron Microscope (SEM) Characterization
Figure 16 represents typical SEM photographs of the TESPT, TESPD and ZB treated silica dispersion in the NR after vulcanization. The silica agglomerates in the S4 and the S2 compounds were well dispersed. However, the SEM photographs of the ZB added compounds exhibited several large silica agglomerates. The polydispersites of the vulcanized S4, S4Z2, and S4Z5 compounds calculated from an Image Analyzer data were 0.741, 0.790 and 0.796 and that of the S2, S2Z2 and S2Z5 compounds was 0.708, 0.716 and 0.749, respectively. The addition of the ZB increased the polydispersity of each compounds. The S4, S4Z2 and S4Z5 compounds exhibited more wide distribution of the
11
silica agglomerates than that of the S2, S2Z2 and S2Z5 compounds, respectively. The silica agglomerate diameter before vulcanization exhibited bigger than that of the after vulcanization. The ZB effects on the size and dispersion of silica agglomerates in the NR compounds were summarized on Table 7. Over all, the vulcanization reduced the silica agglomerate sizes and the addition of the ZB shifted the distribution of the silica agglomerate into mixtures of big and small agglomerates.
Abrasion Resistance
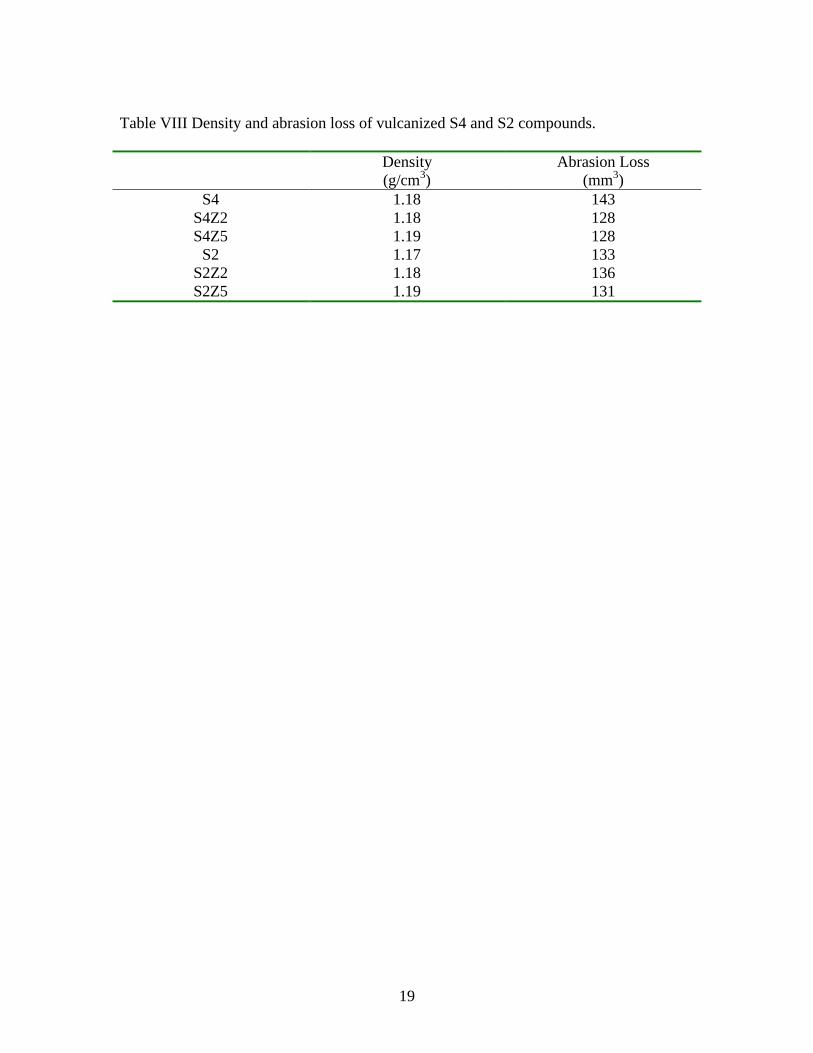
The addition of the 3 wt% ZB into the S4 and the S2 reduced the abrasion loss (mm3) from 143 to 128 and 133 to 131 and increased the compound density (g/cm3) from 1.18 to1.19 and 1.17 to 1.19, respectively. The S4 compound exhibited more abrasion loss than that of the S2 compound, however, the addition of the ZB reduced the abrasion loss and depended on the concentration of the ZB. The ZB effects were more significant on the S4 than that of the S2 compound. The result of the abrasion resistance and the density of each compound were represented on Table 8.
Over all, the addition of the ZB into the S4 and the S2 compounds increased a stronger 3D network structure. The ZB effect was more significant on the S4 than the S2 compound.
12
CONCLUSIONS
The addition of the ZB into the TESPT and the TESPD compounds improved the processability and they were proportional to the ZB concentration. The TESPT compounds exhibited higher viscosity than the TESPD compounds during mixing. The addition of the ZB also increased reversion resistance time of the each compounds and proportional to the ZB concentration. After the vulcanization, the BO time of the ZB added compounds exhibited significantly higher than without the ZB compounds. It also improved the tensile modulus at elongations, increased the compound density and lowered the abrasion loss of the compound. The silica agglomerate sizes were reduced after vulcanization. The addition of the ZB increased the polydispersity of the agglomerate sizes.
The addition of the ZB increase the strong 3-dimensional network structure in the TESPT and the TESPD treated silica filled NR compound. The zinc in the ZB seems related to the vulcanization mechanism and the free sulfur and the functional sulfur level exists in the organo silane also related to the degree of cross-linking of the compounds. Thus affecting the processability and properties of the final compounds.
The S4 compounds were less stable during mixing and more reactive after vulcanization than the S2. However, the addition of the ZB changed their character. The ZB improved the stability of the TESPT more than the TESPD compounds during mixing and improved the degree of cross-linking after vulcanization. The mechanism of the ZB is not clear at this stage. We presume the addition of the ZB affected the role of sulfur reaction mechanism in the compound including the breaking of the sulfur in the silane, and the efficiency of the coupling is still under investigation. This will be discussed more later manuscript with chemical reaction experiments.
ACKNOWLEDGMENT
The author would like to express great appreciation to Mrs. Barbara Eikelberry and Mr. Kevin Tracy for their support on the experiment and Mr. M. Hensel at Schill& Seilacher (Hamburg, German) for RPA and abrasion tests. Special thanks are extended to Struktol Company of America for permission to publish this paper.

13
REFERENCES
1 “Rubber Handbook”, Struktol Co. (2001). 2 F. Thurn and S. Wolff, Kautsch. Gummi Kunstst., 28, 733 (1975). 3 S. Wolff, Kautsch. Gummi Kunstst., 32, 760 (1979). 4 A. Hunsche, U. Görl, A. Müller, M. Knaack, T. Göbel, Kautsch. Gummi Kunstst., 50,
881 (1997). 5 A. Hunsche, U. Görl, H. G. Koban, T. Lehmann, Kautsch. Gummi Kunstst., 51, 525
(1998). 6 H. Ishida, Polym. Compos., 5, 101 (1984) 7 H. Ishida and J. L. Koenig, J. Colloid Interface Sci., 106, 334 (1985). 8 S. Wolff, Kautsch. Gummi Kunstst., 34, 280 (1981). 9 S. Wolff, “The Role of Rubber-to-Silica Bonds in Reinforcement”, paper presented at
the first Franco-German Rubber Symposium, Obernai, France, Nov. 1985. 10 A. D. Roberts, “Natural Rubber Science and Technology”, Oxford Science Publishers,
New York, 1988. 11 Europe Patent EP0501 227, (1991), R. Rauline (Michelin). 12 R. W. Cruse, M. H. Hofstetter, L. M. Panzer and R. J. Pickwell, “Effects of
polysulfidic silane sulfur on rolling resistance”, ACS Rubber Division meeting, Louisville, KY, Oct. 8-11, 1996. Paper No. 75.
13 A. McNeish and J. T. Byers, “Low Rolling Resistance Tread Compounds-Some Compounding Solutions”, Degussa Corporation, ACS Rubber Division meeting, Anaheim CA, May 1997.
14 C. R Stone, M. Hensel, K .H. Menting, Kautsch. Gummi Kunstst., 51, 568 (1998). 15 C. R. Stone, K. H. Menting and D. M. Hensel, “Improving the silica “Green Tyre”
tread compound by the use of special process additives”, Schill & Seilacher, ACS Rubber Division meeting, Orlando FL, Sept. 1999.
16 C. R. Stone, K. H. Menting and D. M. Hensel, “Optimising the use of Disulphide Silane in a silica “Green Tyre” tread compound”, Schill & Seilacher, ACS Rubber Division meeting, Cincinnati OH, Oct. 2000.
17 P. Cochet, “Highly dispersible reactive silica for low-rolling-resistance tires”, Rhodia Silica, ITEC-2000 (No 22A), Akron OH, Sept. 2000.
18 F. Yatsuyagagi and H. Kaidou*, N. Suzuki and M. Ito**, “Relationship between secondary structure of fillers and the mechanical properties of silica filled rubber systems”, *Yokohama Rubber Co., **Science Univ. of Tokyo, ACS Rubber Division meeting, Providence RI, Apr. 2001.
19 U.S. Patent (filed Feb. 20, 1992) 5,227,425 (1993), R. Rauline (Michelin). 20 H. Ismail and P. K. Freakley, Polym. Plast. Technol. Eng., 36, 873 (1997). 21 K. J. Kim and J. L. White, J. Ind. Eng. Chem., 6(4), 262 (2000). 22 J. A. Hockley and B. A. Pethica, Trans Faraday Soc., 57, 2247 (1961). 23 R. Bassett, E. A. Boucher, and A. C. Zettlemoyer, J. Colloid Interface Sci., 27, 649
(1968). 24 J. H. Bachmann, J. W. Sellers, M. P. Wagner, Rubber Chem. Technol., 32, 1286
(1959). 25 E. M. Dannenberg, Rubber Chem. Technol., 48, 410 (1975); 48, 558 (1975). 26 M. P. Wagner, Rubber Chem. Technol., 49, 703 (1976).
14
27 P. Vondracek, M. Hradec, V. Chvalovsky, and H. D. Khanh, Rubber Chem. Technol., 57, 675 (1984).
28 Krysztafkiewicz, Colloid Polym. Sci., 267, 399 (1989). 29 S. Kohjiya, Y. Ikeda, Rubber Chem. Technol., 73, 534 (2000). 30 U.S. Patent (filed July 7, 1998) 6,169,137 (2001), Vasseur;Didier (Compagnie Genearl
des Etablissement Michelin&Cie). 31 H.-D. Luginsland, J. Fröhlich and A. Wehmeier, “Influence of Different Silanes on The
Reinforcement of Silica-Filled Rubber Compounds”, Degussa AG, ACS Rubber Division meeting, Providence RI, Apr. 2001.
32 K. J. Kim and J. L. White, Composite Interfaces, (in print). 33 J. VenderKooi, “Zinc Soaps for Improved Vulcanizates Part II”, Struktol Company of
America, ACS Rubber Division meeting, Louisville KE, Oct. 1996. Paper No. 2. 34 J. L. White, “Principle of Polymer Engineering Rheology”, Wiley Inter-Science, New
York (1990). 35 J. L. White, “Rubber Processing: Technology, Materials, and Principles”, Hanser
Publishers, Cincinnati (1995). 36 S. Montes, J. L. White, and Nakajima, J. Non-Newtonian Fluid Mech., 28, 183 (1988). 37 A. N. Gent, “Engineering with Rubber: How to Design Rubber Components”, Hanser
Publishers, New York (1992). 38 U.S. Patent (filed June 9, 1931) 02,048,314 (July 21, 1936), R. W. Allen (Firestone
Tire & Rubber Co.). 39 K. J. Kim and J. VanderKooi, “Comparative Studies on Effects of TESPT and TESPD
Treated Silica Compounds on Processing and Silica Dispersion During Mixing in Natural Rubber” Struktol Company of America, ACS Rubber Division meeting, Cleveland OH, Oct. 2001. Paper No. 93.
40 K. J. Kim and J. L. White, Polym. Eng. & Sci., 39, 2189 (1999). 41 H. J. Choi, S. J. Vinay III, and M. S. Jhon, Polymer, 40, 2869 (1999).
15
Table I Basic chemical structures of processing additives.
Group Examples Hydrocarbons Mineral oils
Petrolatum Paraffin waxes Petroleum resins
Fatty acid derivatives Fatty acids Fatty acids esters Fatty alcohols Metal soaps Fatty acid amids
Synthetic resins Phenolic resins Low molecular weight polymers Polyethylenes
Polybutens Organo thio compounds Peptizers Table II The effects of processing additives.
Effects Examples Peptization 2.2’-Dibenzamidodiphenyl disulfide
Pentachlorothiophenol Zinc soaps
Dispersion Fatty acid esters Metal soaps Fatty alcohols
Flow Metal soaps Fatty acid esters Fatty acid amids Fatty acids
Homogenization Resin blends Tack Hydrocarbon resins
Phenolic resins High Hardness High styrene resin-rubber masterbatches
Phenolic resins Trans-polyoctenamer
Release Organo silicones Fatty acid esters Metal soaps Fatty acid amids
16
Table III Materials used in this study. Trade name Supplier
Rubber SIR 20 Goodyear Peptizer A86 Struktol
Filler (silica) Ultrasil VN3 Degussa Activator Zinc Oxide [ZnO], Stearic acid
Processing aid Titanium dioxide [TiO2] DuPont Antioxidant TMQ
[poly(trimethyl dihydro quinilin)] Vanderbilt
Antioxidant,Antiozonant, inhibitor
Sunolite 240
Lubricant, Activator Carbowax 3350; [polyethylene glycol]
Harwick
Homogenizer 60 NS Flakes Struktol Processing aid, Dispersing agent WB 222 Struktol
Plasticizer, Softener Stanplas 2000 Harwick Bonding agent SCA 98
[bis(triethoxysilylpropyl)tetrasulfane] Struktol
Bonding agent SCA 985 [bis(triethoxysilylpropyl)disulfane]
Struktol
Activtor ZB Struktol Vulcanizer Sulfur Accelerator MOR Harwick Accelerator Vanax A; [4,4’-dithiodimorpholine]
DPG; [Diphenylguanidine]

17
Table IV Mixing formulations and procedure on NR compounds. 4.1 Formulation
1st Stage
Material Control 1
(S4) Control 2
(S2) SCA98 (S4Z2)
SCA98 (S4Z5)
SCA985 (S2Z2)
SAC985 (S2Z5)
SMR20 100.00 - - - - -
A 86 0.25 - - - - -
Ultrasil VN3 57.00 - - - - -
Zinc Oxide 4.00 - - - - -
Stearic Acid 2.00 - - - - -
TiO2 5.00 - - - - -
TMQ 1.00 - - - - -
Sunolite 240 1.25 - - - - -
Polyethylene glycol 1.00 - - - - -
60 NS Flakes 3.50 - - - - -
WB 222 2.00 - - - - -
Stanplas 2000 4.00 - - - - -
SCA98 (S4) 2.50 0.00 2.50 2.50 0.00 0.00
SCA985 (S2) 0.00 2.50 0.00 0.00 2.50 2.50
ZB (ZB47) 0.00 0.00 2.00 5.00 2.00 5.00 2nd Stage
Sulfur 2.00 - - - - -
MOR 2.00 - - - - -
Vanax A 0.50 - - - - -
DPG 0.50 - - - - - 4.2 Mixing Procedure
a. Add rubber and A86 b. Mix to 30 sec c. Add rest additives d. Mix to 250oF and sweep e. Mix to 5 min and dump.

18
Table V The vulcanization characteristics of the compounds at 160 oC 30 min. (Error=±2%)
Torque Time (min)
System
Max Torq. (MU)
Min Torq. (MU)
∆ Torque (MH-ML)
(MU)
Ts2
(min)
Tc50
(min)
Tc90
(min)
Reversion (T-2) (min)
Time (MH) (min)
S4 91.0 16.0 75.0 4.2 8.5 10.1 16.4 13.2 S4Z2 92.0 11.3 80.7 4.5 10.0 12.0 24.7 17.1 S4Z5 95.4 8.6 86.8 4.0 9.5 11.7 >30 19.7 S2 89.5 14.2 75.3 4.8 9.2 10.5 16.0 13.1 S2Z2 87.2 9.2 78.0 5.2 10.5 12.7 22.9 15.9 S2Z5 90.7 8.4 82.3 4.8 10.4 12.3 >30 19.8 Table VI Tensile properties of each compound. Tensile
Stress Max (MPa)
Elongation Max (%)
Modulus 100% (MPa)
Modulus 200% (MPa)
Modulus 300% (MPa)
S4 26.2 581 2.8 6.2 10.6 S4Z2 24.6 554 2.9 6.4 10.7 S4Z5 23.2 480 3.3 7.6 12.7
S2 27.0 606 2.5 5.6 9.8 S2Z2 25.4 562 2.8 6.2 10.5 S2Z5 24.9 537 2.8 6.5 11.1
Table VII The ZB effects on the size and dispersion of silica agglomerates in the NR
compounds. Compound Number Average
(µm) Mass Average
(µm) Polydispersity
pd S4 0.694 1.006 0.780
S4Z2 0.527 0.707 0.577 S4Z5 0.550 0.877 0.609
S2 0.783 1.706 0.966 S2Z2 0.577 0.692 0.613
Before Vulcanization
S2Z5 0.503 0.644 0.546 S4 0.422 0.608 0.741
S4Z2 0.443 0.973 0.790 S4Z5 0.451 0.870 0.796
S2 0.400 0.452 0.708 S2Z2 0.301 0.725 0.716
After Vulcanization
S2Z5 0.391 0.677 0.749
19
Table VIII Density and abrasion loss of vulcanized S4 and S2 compounds.
Density (g/cm3)
Abrasion Loss (mm3)
S4 1.18 143 S4Z2 1.18 128 S4Z5 1.19 128
S2 1.17 133 S2Z2 1.18 136 S2Z5 1.19 131
20
Figure Captions Figure 1 ZB concentration effects on temperature changes (a) the S4 compounds, (b) the
S2 compounds during first stage mixing. Figure 2 ZB concentration effects on shear viscosity (a) the S4 compounds, (b) the S2
compounds at 100oC. Figure 3 ZB concentration effects on complex viscosity (a) the S4 compounds, (b) the S2
compounds, (c) all compounds at 1 Hz, and 100 oC. Figure 4 ZB concentration effects on Mooney viscosity on the S4 and the S2 compounds. Figure 5 ZB concentration effects on viscoelastic property (tanδ) (a) the S4 compounds,
(b) the S2 compounds, (c) all compounds at 1 Hz, and 100 oC. Figure 6 ZB concentration effects on viscoelastic property (tanδ) (a) the S4 compounds,
(b) the S2 compounds, (c) all compounds at 1o, 1 Hz, 60 oC and 100 oC. Figure 7 Shear modulus changes as a function of shear rate (a) real (G’) modulus, (b)
imaginary (G”) modulus at 1% strain and 100 oC. Figure 8 ZB concentration effects on viscoelastic property (tanδ) on the S4 and the S2
compounds at 23 oC and 100 oC from MER (1 Hz, 3%). Figure 9 ZB concentration effects on reversion (a) the S4 compounds, (b) the S2
compounds. Figure 10 ZB concentration effects on tensile modulus at 100% elongation on the S4 and
the S2 compounds. Figure 11 Photographs of capillary extrudates at 1,000(1/sec). Figure 12 Capillary extrudate swell (d/D) at shear rate 1,000 (1/sec). (±0.05% error). Figure 13 Photograph of the S4 and the S2 compounds after ‘Firestone Flexometer’ BO
testing (45 min). Figure 14 ZB concentration effects on BO deformation ratio (d/D) on (a) the S4
compounds, (b) the S2 compounds. Figure 15 ZB concentration effects on BO time on the S4 and the S2 compounds. Figure 16 SEM photographs of vulcanized ZB/silane/silica/NR/additives compounds (a)
S4, (b) S4Z2, (c) S4Z5, (d) S2, (e) S2Z2, and (f) S2Z5 at 5,000 magnifications.

21
Figure 1
(a)
(b)
Time (sec)
0 60 120 180 240 300
Tem
p (
o C)
0
50
100
150
200
S4S4/Z2S4/Z5
Ram open
Time (sec)
0 60 120 180 240 300
Tem
p (
o C)
0
50
100
150
200
S2S2/Z2S2/Z5
Ram open

22
(a)
Figure 2
(b) Shear Rate (1/sec)
10-1 100
Vis
cosi
ty (
Pa.
s)
108
109
S2Z5S2Z2
S2NR
(b)
Shear Rate (1/sec)
10-1 100
Vis
cosi
ty (
Pa.
s)
108
109
S4
S4Z2S4Z5
NR
23
Shear Rate (1/sec)
10-2 10-1 100 101 102
n*
(Pa
.s)
103
104
105
Shear Rate (1/sec)
10-2 10-1 100 101 102
n*
(Pa
.s)
103
104
105
Shear Rate (1/sec)10-2 10-1 100 101 102
n*
(Pa
.s)
103
104
105
S4S4Z2S4Z5
S2S2Z2S2Z5
S4S2S4Z2S2Z2S4Z5S2Z5
(a)
(b)
(c)
Figure 3
24
ZB concentration
0 wt% 1 wt% 3 wt%
Moo
ney
Vis
cosi
ty (
MU
)
40
45
50
55
60
S4
S2
Figure 4

25
S4S2S4Z2
S4Z5S2Z2S2Z5
Shear Rate (1/s)
10-2 10-1 100 101 102
tan δ
10-1
100
101
Shear Rate (1/s)
10-2 10-1 100 101 102
tan δ
10-1
100
101
S4S2Z2S4Z2
S2S2Z2S2Z5
(a)
(b)
Shear Rate (1/s)
10-2 10-1 100 101 102
tan
δ
10-1
100
101
S4S2S4Z2S2Z2S4Z5S2Z5
(c)
Figure 5

26
ZB concentration
0 wt% 1 wt% 3 wt%
tanδ
0.3
0.4
0.5
0.6
0.7
S4 60oCS2 60oC
S4 100oC
S2 100oC
Figure 6
27
Shear Rate (1/sec)
10-2 10-1 100 101 102
G' (
kPa)
101
102
103
S4S2S4Z2S2Z2S4Z5S2Z5
Shear Rate (1/sec)
10-2 10-1 100 101 102
G"
(kP
a)
101
102
103
S4S2S4Z2S2Z2S4Z5S2Z5
Figure 7
(a)
(b)
28
ZB concentration
0 wt% 1 wt% 3 wt%
tanδ
0.05
0.10
0.15
0.20
S4 23oC
S2 23oC
S4 100oCS2 100oC
Figure 8
29
(a)
Time (min.)
0 5 10 15 20 25 30
To
rqu
e (
MU
)
0
20
40
60
80
100
S4S4Z2
(b)Time (min.)
0 5 10 15 20 25 30
To
rqu
e (
MU
)
0
20
40
60
80
100
S2Z5S2Z2
S4Z5
S2
Reversion Test
Figure 9
30
ZB concentration
0 wt% 1 wt% 3 wt%
Mod
ulus
(M
Pa)
2
3
4
S4
S2
Figure 10
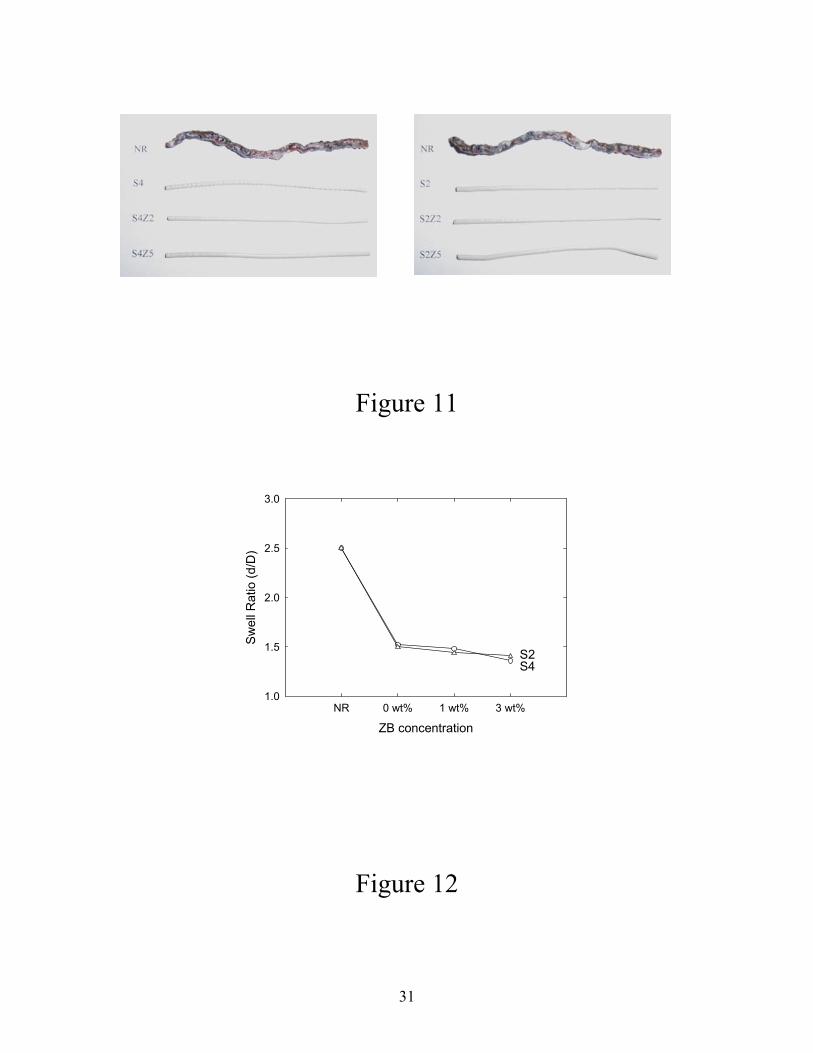
Figure 11
ZB concentrationNR 0 wt% 1 wt% 3 wt%
Sw
ell R
atio
(d/D
)
1.0
1.5
2.0
2.5
3.0
S4S2
Figure 12
31
32
0 Before Test
1 S4
3 S4Z2
4 S4Z5
2 S2
5 S2Z2
6 S2Z5
Figure 13
33
ZB concentration
0 wt% 1 wt% 3 wt%
Def
orm
atio
n R
atio
(%
)
0
2
4
6
8
10
S4
S2
Figure 14
34
ZB concentration
0 part 2 part 5 part
Blo
wou
t T
ime
(min
.)
0
2000
4000
6000
8000
10000S4
S2
Figure 15
35
(a)
(d)
(b)
(e)
(c)
(f)
Figure 16