structuring system process requirements. learning objectives understand the logical modeling of...
TRANSCRIPT
Structuring System Process Requirements
Learning Objectives
Understand the logical modeling of processes by studying examples of data flow diagrams (DFDs).
Draw data flow diagrams following specific rules and guidelines that lead to accurate and well-structured process models.
Decompose data flow diagrams into lower-level diagrams.
Balance higher-level and lower-level data flow diagrams.
Explain the differences among four types of DFDs: current physical, current logical, new physical, and new logical.
Use data flow diagrams as a tool to support the analysis of information systems.
Discuss process modeling for electronic commerce applications.

Process Modeling
• Graphically represent the processes that capture, manipulate, store, and distribute data between a system and its environment and among system components.
• Utilize information gathered during requirements determination.
• Processes and data structures are modeled.

Deliverables and Outcomes
• Context data flow diagram (DFD)– Scope of system.
• DFDs of current physical system– Adequate detail only.
• DFDs of current logical system– Enables analysts to understand current
system.• DFDs of new logical system
– Technology independent.– Show data flows, structure, and functional
requirements of new system.• Thorough description of each DFD
component

Data Flow Diagramming Mechanics
• Represent both physical and logical information systems.
• Only four symbols are used.• Useful for depicting purely logical
information flows.• DFDs that detail physical systems differ
from system flowcharts which depict details of physical computing equipment.

Definitions and Symbols

Definitions and Symbols (Cont.)
• Process: work or actions performed on data (inside the system).
• Data store: data at rest (inside the system).• Source/sink: external entity that is origin or
destination of data (outside the system).• Data flow: arrows depicting movement of
data.

Developing DFDs
• Context diagram is an overview of an organizational system that shows: – the system boundaries;– external entities that interact with the
system;– Major information flows between the
entities and the system.• Note: only one process symbol, and no data
stores shown.

Context Diagram

Developing DFDs (Cont.)
• Level-0 diagram is a data flow diagram that represents a system’s major processes, data flows, and data stores at a high level of detail.– Processes are labeled 1.0, 2.0, etc. These
will be decomposed into more primitive (lower-level) DFDs.

Level-0 Diagram

Data Flow Diagramming Rules
• There are two DFD guidelines that apply:– The inputs to a process are different from
the outputs of that process.•Processes purpose is to transform
inputs into outputs.– Objects on a DFD have unique names.
•Every process has a unique name.

Decomposition of DFDs
• Functional decomposition is an iterative process of breaking a system description down into finer and finer detail.– Creates a set of charts in which one process on a
given chart is explained in greater detail on another chart.
– Continues until no sub process can logically be broken down any further.
• Primitive DFD is the lowest level of a DFD.• Level-1 diagram results from decomposition of Level-
0 diagram.• Level-n diagram is a DFD diagram that is the result of
a n nested decompositions from a process on a level-0 diagram.
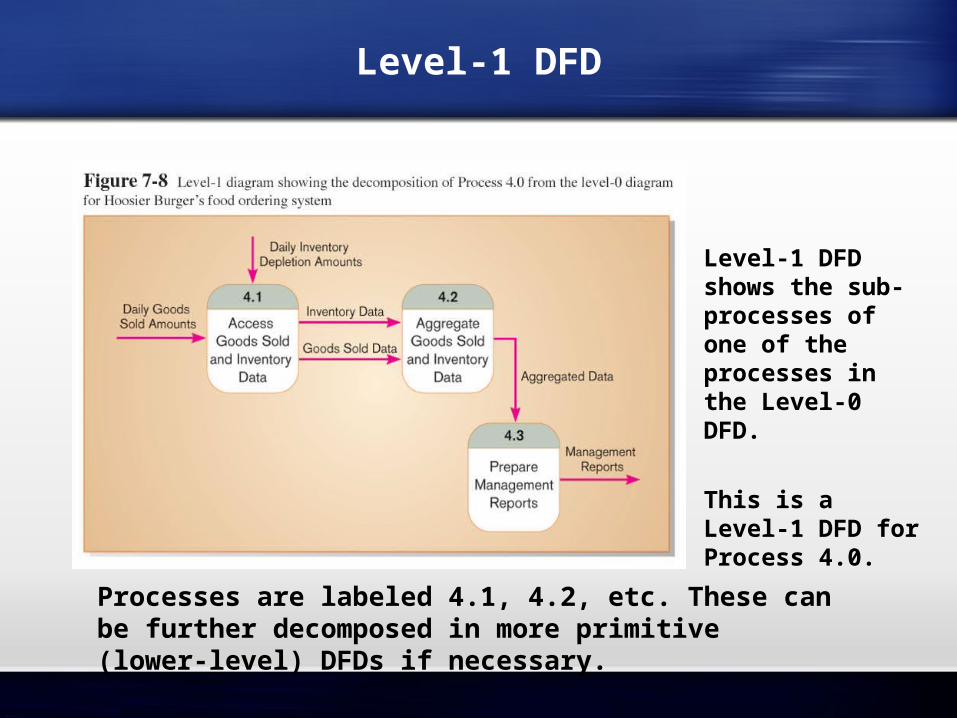
Level-1 DFD
Level-1 DFD shows the sub-processes of one of the processes in the Level-0 DFD.
This is a Level-1 DFD for Process 4.0.
Processes are labeled 4.1, 4.2, etc. These can be further decomposed in more primitive (lower-level) DFDs if necessary.

Level-n DFD
Level-n DFD shows the sub-processes of one of the processes in the Level n-1 DFD.
This is a Level-2 DFD for Process 4.3.
Processes are labeled 4.3.1, 4.3.2, etc. If this is the lowest level of the hierarchy, it is called a primitive DFD.
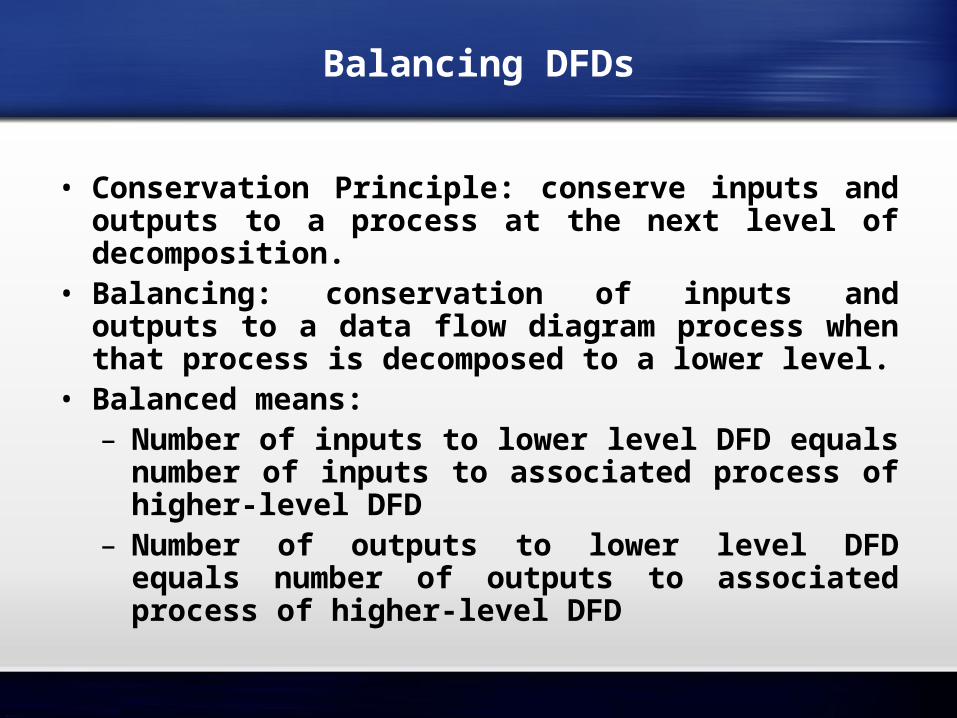
Balancing DFDs
• Conservation Principle: conserve inputs and outputs to a process at the next level of decomposition.
• Balancing: conservation of inputs and outputs to a data flow diagram process when that process is decomposed to a lower level.
• Balanced means:– Number of inputs to lower level DFD
equals number of inputs to associated process of higher-level DFD
– Number of outputs to lower level DFD equals number of outputs to associated process of higher-level DFD
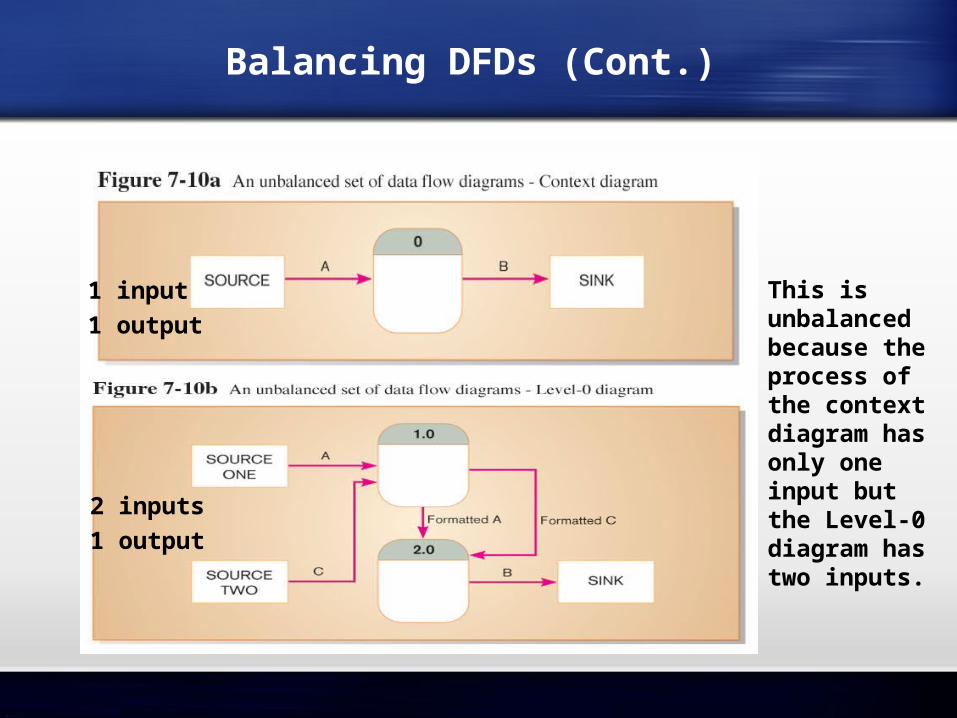
Balancing DFDs (Cont.)
This is unbalanced because the process of the context diagram has only one input but the Level-0 diagram has two inputs.
1 input1 output
2 inputs1 output

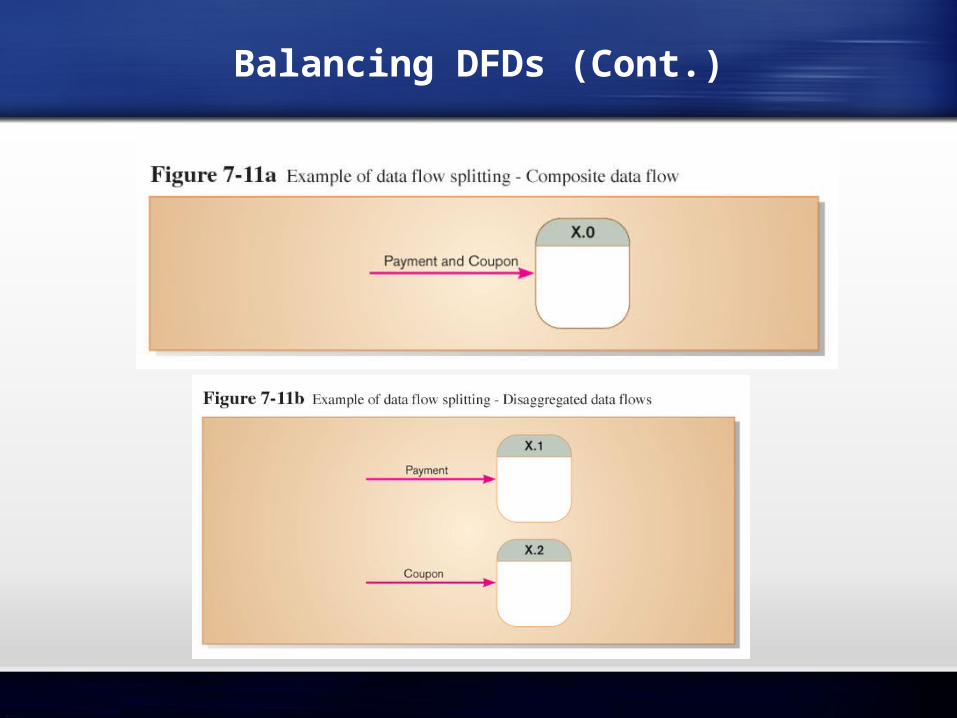
Balancing DFDs (Cont.)
• Data flow splitting is when a composite data flow at a higher level is split and different parts go to different processes in the lower level DFD.
• The DFD remains balanced because the same data is involved, but split into two parts.
Balancing DFDs (Cont.)
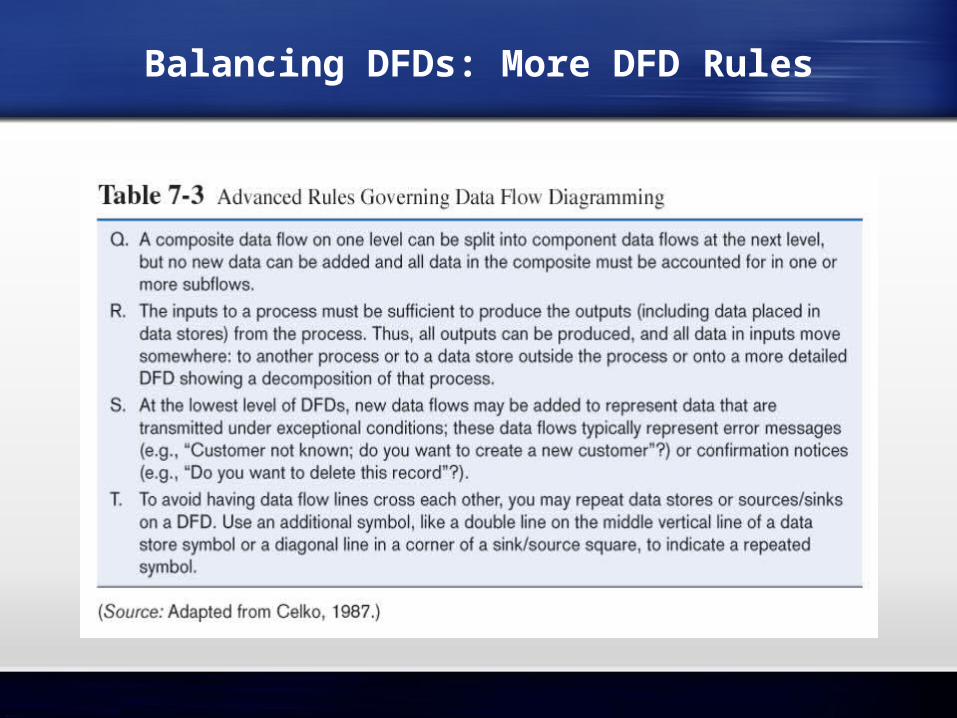
Balancing DFDs: More DFD Rules
Four Different Types of DFDs
• Current Physical– Process labels identify technology (people
or systems) used to process the data.– Data flows and data stores identify actual
name of the physical media. • Current Logical
– Physical aspects of system are removed as much as possible.
– Current system is reduced to data and processes that transform them.
Four Different Types of DFDs (Cont.)
• New Logical– Includes additional functions.– Obsolete functions are removed.– Inefficient data flows are reorganized.
• New Physical– Represents the physical implementation
of the new system.

Guidelines for Drawing DFDs (Cont.)
• Completeness– DFD must include all components necessary for
system.– Each component must be fully described in the
project dictionary or CASE repository.• Consistency– The extent to which information contained on one
level of a set of nested DFDs is also included on other levels.
• Timing– Time is not represented well on DFDs.
• Iterative Development– Analyst should expect to redraw diagram several
times before reaching the closest approximation to the system being modeled.
Summary
• In this chapter you learned how to: Understand logical process modeling via data flow
diagrams (DFDs). Draw data flow diagrams of well structured process
models. Decompose data flow diagrams into lower-level diagrams. Balance high-level and low-level data flow diagrams. Explain differences between current physical, current
logical, new physical, and new logical data flow diagrams. Use data flow diagrams for analyzing information
systems.