structures right, customers delight - asq · pdf file•in 1945 by mr. jcb joseph cyril...
TRANSCRIPT

1
Structures Right, Customers Delight
ASQ South Asia Team Excellence Award
• In 1945 by Mr. JCB Joseph Cyril Bamford
• From a small garage in Uttoxeter, England
• Innovation started this Business which continues to be our
lifeblood
Company Introduction
2

2
….. to Global Presence
22 Plants, 750+Dealers, 2000+
Outlets, 150+Countries, 12,000+
Employees 3
5 Factories
BLB / Pune / Jaipur
5000+ Employees
8 Product Lines
48 Products
63 Dealers
650 Outlets
66+ Export Countries
Introduction – JCB India
4
Heavy Line
World’s Largest Backhoe Plant
Ballabgarh
Pune
Jaipur
India’s Largest Facility

3
Section 1:
Project & Team Selection
5
Infrastructure Deficit
PRODUCT
PROCESS
PERFORMANCE
PEOPLE
PROSPERITY
Uptime & Productivity
Safety & Environment
Quality & Reliability
Personal Touch
Growing Entrepreneurship
Growing Customer Expectations Opportunity
High Level Context
6

4
Group Service
Report
Product
Defects
A,S,D-Review
Closure &
Monitoring
Product
Warranty Cost
Closure &
Monitoring
Subsystem
Review
1.1.1-1 Who was responsible for selecting project
Online Complaints
Techweb
CRM
Care link
Warranty
T3, T12
Telematics
Live Link
Customer Visits
FOCUS Program
Voice of Customer
Group Service
Report
7
Product
Warranty Cost
Closure &
Monitoring
Subsystem
Review
1.1.1-2 What background information on the company was provided to better understand the context of the project ? 1.2.1-1 How was the gap brought to the attention of the project identification group ?
Group Service
Report
Product
Defects
A,S,D-Review
Closure &
Monitoring
Product
Warranty Cost
Closure &
Monitoring
Subsystem
Review
Online Complaints
Techweb
CRM
Care link
Warranty
T0, T3, T12
Telematics
Live Link
Customer Visits
FOCUS Program
Voice of Customer
~ 40%
8 Application Challenges in India : Almost double duty cycles/usage, variety & intensity of applications
Structure
3.2X X 2X 5X Structures

5
~ 40%
1.2.1-2 What was the gap for problem solving ?
1.2.1-3 What area of the organization had the gap ?
Problem Statement Backhoe Structures warranty cost( ~ 40 % of overall
warranty) is single largest contributor to customer
dissatisfaction
Goal Reduce the Structures warranty cost by 68% from
Current Value by Dec-2014
Backhoe
Structures
Gap to be addressed
Organization Focus Area
Specific Areas for Problem Solving
9
Quadrant 1
Quadrant 2
Quadrant 4
Quadrant 3
Qsmart
Real time defects per unit
CareLink: Call Centre data
LiveLink: Real Time Machine alerts
Customer Visits: Feedback, Expectations
Product Rating Chart
Usage Hours
Internal
External Direct Customer
Benchmark Data
1.2.2-1 What Data is generated to help select the project?
Dealer Conference Usage Hour
T0,T3,T12 Data Product Rating Chart
External Through Dealer
Techwebs : Online Compliants
SAP / Dealer Business Mgmt
System, (DBMS) T0,T3,T12 Defects and Cost
10

6
1.2.2-2 What methods or tools were used to assess or prioritize the need for
the project?
S. No. Sub-System
Warranty Cost
(SAP/DBMS)
(A)
Avg Downtime
(LiveLink)
(B)
Voice of Customer
(Carelink Surveys)
(C)
Total
Score
(A*B*C)
01 Structures 5 5 5 125
02 Transmission 3 5 4 60
03 Hydraulics 3 4 4 48
04 Engine 3 4 3 36
05 Hose 3 2 2 12
06 Electrical 2 2 3 12
07 Cab 2 2 1 4
08 Paint 2 2 1 4
Selection Prioritization Matrix
Rating Warranty Cost Downtime days VoC
5 >4000/- >10 5
4 3000-4000 5-10 4
3 2000-3000 3-5 3
2 1000-2000 1-2 2
1 <1000/- <1 1
Rating
Criteria
High Priority
Low Priority 11
1.2.2-3 Why was this method used to select the project ?
Enhanced Product Reliability
Improved Perceived Value
Brand Quality Image
Increased Market Share
A: Warranty Cost
Uptime & Productivity
Higher MTTR
Customer Satisfaction
Loyal, Repeat Customers
B: Machine Down
Time
C: Voice of
Customer
Severity
Severity
Occurrence
Detection
Selection Prioritization Matrix is a combination of Performance Data & Customer Perception
12

7
JCB’s Strategic Vision
1.2.3 -1 What goals(organizational an/or local), performance measures, and/ or strategies were the project expected to impact?
1.2.3 -2 What was the relationship between the stated measures and perceived gap in 1.2.1?
1.2.3-3 What was the project objective statement that expresses where the organization wanted to be at the end of the project ?
Project Impact Linked to Business Strategies
13
14
Suppliers Input Process Output Customer
Laser Cutting
Sub-assembly Welding
Machining
Heat Treatment
Welded sub-assembly
Laser cut parts
Bosses
Machined parts
Bent parts
Weld Shop
Tacking
Pre-weld
Manual/Robotic weld
Post-weld
Inspection
WA Mainframe
WA Boom
WA Dipper
WA Loader arm
WA Buckets
Finance
Assembly Shop
Product Support
Dealers
End Users
1.3.1-1 How were the stakeholder groups identified?
1.3.1-2 What or who were the stakeholder groups?
Problem Solving- 6σ
Iden
tifi
ed
Skill
Metallurgy
Weld Process/Robotics
Finite Element Analysis
Machining
Jig/Fixture Design
CMM Operation
Program Management
Stakeholders were
identified through
SIPOC
Purchase
Design
Materials
Weld Shop
Assembly
Product Support
Finance
Global & India EXEC
Supplier Quality
General Manager
General Manager
General Manager
Vice President
Vice President
General Manager
AVP
Directors & EVPs
General Manager
Function Who
Sta
keh
old
ers
Users Customers
SIP
OC
Inputs

8
Core Team
15
P.M
ah
ara
na
CM
Mani
P.Y
adav
H.M
alik
R. M
ishra
D. S
eth
i
L.P
andey
A.A
rora
A.G
auta
m
S.C
houdhary
V.V
allia
pan
T. S
harm
a
Monid
eepa
1.3.2-1 What knowledge or skill sets were determined to be necessary for successful completion of the project?
1.3.2-2 To what extent did the existing stakeholder group have the required knowledge or skill?
1.3.2-3 What additional knowledge and skills were brought into make the project successful ?
Additional Skills & Knowledge
1. FEA: India Design Centre
2. Weld SME- Mr. Seth Adams,
3. Stake holder Management :
Ms. Monideepa Roy
Additional Skills
I
L
U
O
Training required
Can complete task under supervision
Can complete task without supervision
Can train others
Legends
16
Skill Matrix for Project Team
Skills Where Are We
Nam
e
L. Pan
dey
V. V
alliap
pan
R.M
ishra
P.M
ahar
ana
S. C
hau
dhar
y
T. Shar
ma
P. Y
adav
A. G
auta
m
C.M
Man
i
H. M
alik
D. Seth
i
A. A
rora
Po
siti
on
Pro
ject
Le
ad
er,
AV
P
We
ld E
xp
ert
, D
GM
Su
pp
lie
r Q
uali
ty ,M
CM
M E
xp
ert
, D
M
Mach
inin
g E
xp
ert
,GM
Me
tall
urg
ist,
AG
M
Mast
er
Bla
ck
be
lt
Pu
rch
ase
, SM
We
ld S
ho
p,
DG
M
We
ld S
ho
p, M
De
sign
, SM
Pro
du
ct
Su
pp
ort
, SM
Metallurgy O U L L L O L L L L U I
Wedling Process
and RoboticsL O L U L L L L U U U L
Jig-Fixture
DesigningL U L U L L L L U L L L
Machining U L L U O U U U U U U L
CMM Operation L U U O U L L L L I L L
Problem Solving -
6 SigmaU U I I U L O L L I L L
Finite Element
AnalysisI I I I I I I I I I L I
O L I I U U L U L L L U
U U L L O U U L L L U L
O L L L U L L L U L L L
* Domain Experts available within the team
Skills
Time Mangement
Stra
tegi
cT
ech
inca
l
Program
Management
Change Management
* Domain Experts available
* New Skill - External support taken from JCB
Design Center ,
* Exisitng skill - Team is well equipped
* Domain Expert available within Team
* Domain Expert available but additional
support taken from JCB Group Weld Expert
* Domain Expert available within Team but
external support taken from Adroit -Pune.
* Exisitng skill - Team is well equipped
* Domain Expert available within Team
* Exisitng skill - Team is well equipped
* Domain Expert available within Team
Where Are We
Ver-01
9
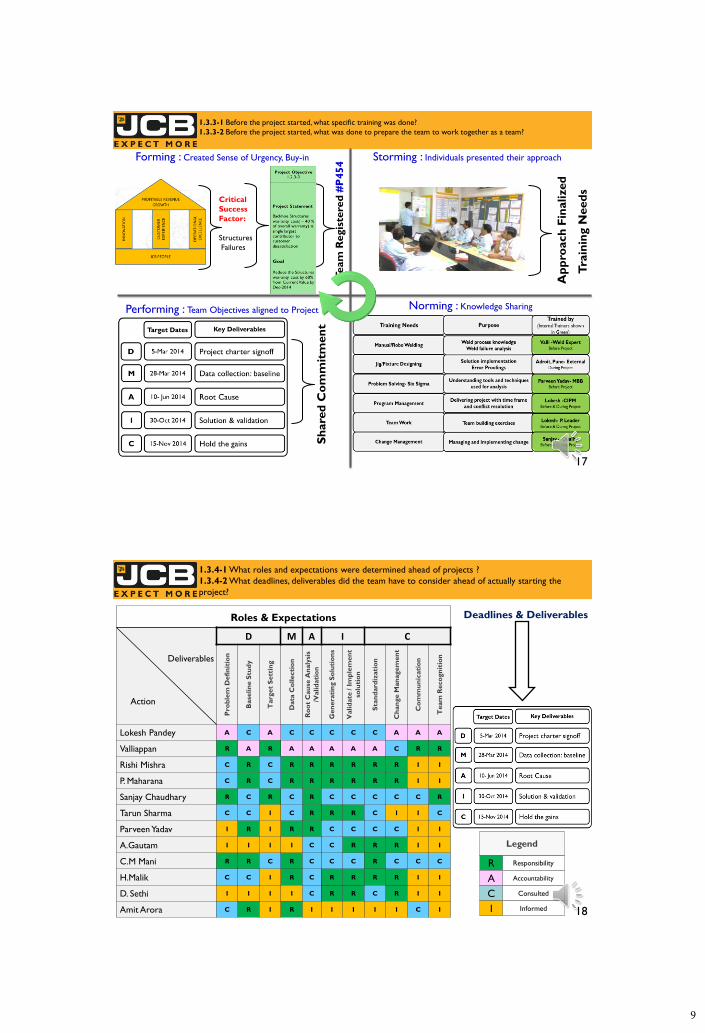
1.3.3-1 Before the project started, what specific training was done?
1.3.3-2 Before the project started, what was done to prepare the team to work together as a team?
Forming : Created Sense of Urgency, Buy-in
Critical
Success
Factor:
Structures
Failures
Team
Regis
tere
d #
P454 Storming : Individuals presented their approach
Ap
pro
ach
Fin
alized
Tra
inin
g N
eed
s
Norming : Knowledge Sharing Performing : Team Objectives aligned to Project
Sh
are
d C
om
mit
men
t
17
Roles & Expectations
D M A I C
Pro
ble
m D
efi
nit
ion
Base
lin
e S
tud
y
Targ
et
Sett
ing
Data
Co
llecti
on
Ro
ot
Cau
se A
naly
sis
/Valid
ati
on
Gen
era
tin
g S
olu
tio
ns
Valid
ate
/ I
mp
lem
en
t
solu
tio
n
Sta
nd
ard
izati
on
Ch
an
ge M
an
agem
en
t
Co
mm
un
icati
on
Team
Reco
gn
itio
n
Lokesh Pandey A C A C C C C C A A A
Valliappan R A R A A A A A C R R
Rishi Mishra C R C R R R R R R I I
P. Maharana C R C R R R R R R I I
Sanjay Chaudhary R C R C R C C C C C R
Tarun Sharma C C I C R R R C I I C
Parveen Yadav I R I R R C C C C I I
A.Gautam I I I I C C R R R I I
C.M Mani R R C R C C C R C C C
H.Malik C C I R C R R R R I I
D. Sethi I I I I C R R C R I I
Amit Arora C R I R I I I I I C I
1.3.4-1 What roles and expectations were determined ahead of projects ?
1.3.4-2 What deadlines, deliverables did the team have to consider ahead of actually starting the
project?
Deliverables
Responsibility R
Accountability A
Consulted C
Informed I
Legend
Deadlines & Deliverables
Action
18

10
19
Team Routines & Communication
Activity Routine How Recorded Responsibility
Project Team Meeting Weekly Project Tracker
Timeline/ Milestone Chart Project Leader
Project Review Meeting Monthly Objectives vs Achievements Project Leader
Management Review Meeting Monthly Project Template Project Sponsor
Specific Functional/Stakeholder
Reviews Monthly Functional Trackers Project Leader
Change Management Meeting Fortnightly Change Review MoM GM- Quality
Shop floor/ Supplier Gemba As Required MoM through e-mail Project Members
Tracker Photo ???
Team Meeting Field Tracker Project Review Gemba
1.3.4-3 Before the project started, what team routines, including communication were established?
20
Section 2:
Current Situation &
Root Cause Analysis

11
2.1.1-1 What specific goals and /or measures was the team trying to achieve with the project?
2.1.1-2 What additional potential benefits, other than the specific goals and/ or measures, was the
project expected to impact?
Problem Statement
Backhoe Structures warranty cost( ~ 40 % of
overall warranty) is single largest contributor to
customer dissatisfaction.
Specific Goal
Reduce the Structures warranty cost by 68%
(50% of best achievement so far) from Current
Value by Dec-2014
Project Scope
In Scope:- All structural parts in Backhoe
machine
Out of Scope – Other JCB Models
D
M
A
I
C
Target Dates Key Deliverables
10- Jun 2014
28-Mar 2014
5-Mar 2014
15-Nov 2014
30-Oct 2014
Hold the gains
Solution & validation
Root Cause
Data collection: baseline
Project charter signoff
Additional Potential Benefits
Area Tangible Benefits
Reliability (T12) + 25%
Part Inventory - 20%
MTTF + 40%
Market Share <2%
Intangible Benefits
Customer Delight
Skill Development
Team Morale
21 Confidential absolute values not shared
2.2.1 -1 What methods and / or tools were used to identify possible RCs/ Improvement opportunities?
2.2.1 -2 Why were these methods and / or tools selected (to identify possible Rcs/ Improvement opportunities?
2.2.1 -3 How was the team prepared to use these methods/tools [used to identify the possible root
causes/improvement opportunities]?
Identified Tools/Methods Purpose of Tools/Methods How team was trained on these
tools/methods
Scoping Tree
Pareto Chart
Cause and Effect Diagram
o To generate list of possible
causes against all failure
modes
o To identify all types of
Failure mode
Trained by Black Belt on
- When to use
- How to use
o To finding out major
contributing failure modes
Case Studies/ Examples –
Reviewed
Basic training on “Welding
Process & Potential Failure
Modes”
22

12
A S D
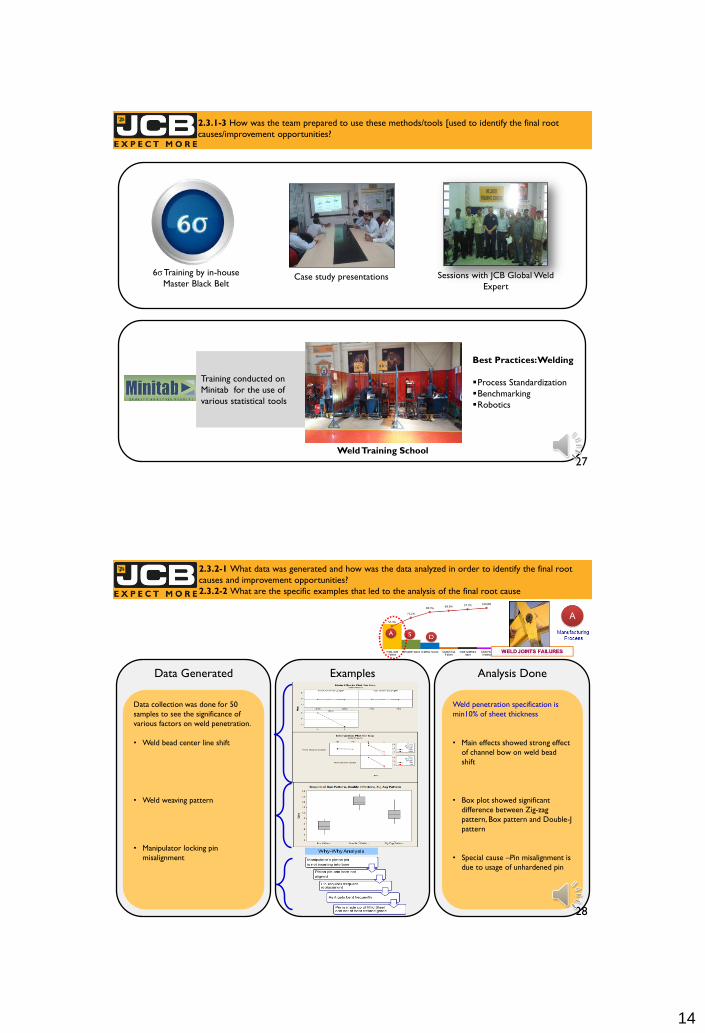
2.2.2-1 What data was generated and how was the data analyzed to identify the possible root cause
/Improvement opportunities?
Data Generated Data Analyzed Top Failure Modes-
Identified
DATA Sources:
External Data – T3,T12
Warranty Cost Structure Failures Mode
Scoping Tree
Weld
joint
Gaps/Fit
-ups
Sheet
Material
Moving
Parts Joint
Weld
esthetic
Child Part
missing
A
Butt T-
Joint
D
Manufacturing
Process
S
Supplier
Design
Pareto Chart-Cost-wise T0,T3,T12 Data
S
D
A
23
2.2.2-2 What were the possible root causes ?
Failed Part Analysis
Less weld penetration
Spec- 10%
Actual- 4%
Loader Arm Knee Joint
Cause & Effect Validation
Matrix Main Cause Probable Causes Conformance Requirement Checking Method Confirmation of potectial causeStatus
Weld sequence adherence As per SOP Audit 100% compliance OK
Robotic programing skil l Certified programmer Verification Skill Level OK OK
Weld Parameter - Current,
Voltage, Gas flowTo meet the processs spec
Iteration with different
parameters
Current process
parameters gives
satisfactory results
OK
Weld Parameter - Wire
Speed, Gas FlowTo meet the processs spec
Iteration with different
parameters
Validated during welding
and meets the specOK
Spatters on Nozzle Functioning of cleaning unit Visual verification
No spatters. Cleaning
unit functioning as per
desired frequency
OK
Manipulator Locking pin Mis
alignmentPin to align with part bore Visual verification
3 out of 50 parts pin not
qualifyingNOT OK
Robot Tool Centering Point
outTCP should be zero-zero
Position validation thro "I"
mark for all axis with
respect to the Reference
Meets the Zero position
every time
OK
Weld Bead center l ine shiftAs per weld specification
requiredTeach pendent
20 out of 50 nos - Bead
center l ine shift noticed
in cut section review
NOT OK
Backing strip positionDistribution of total length in
3 equal division (8mm) Positon found ok in the tiralsNo shift observed OK
Spatters in searching area at
Knee joint
Searching area must be
spatter free
No spatters found during
vlaidation
Function a sper desired
frequencyOK
Part Cleaniness Free from Oily and Rusty Clean parts observedNo oily and rusted
surfaceOK
Properties To meet the speciifcation Meets the specTested with external lab
and meets the specOK
Height of inter lever boss 7.5 ± 0.5 mm 7~8 mm No abnormality found OK
Height variation in rear
channel and front
channel
Within 1mm With in 1mm With in 1mm OK
Weld weaving pattern To cover the fit up gap Un covered noticed End gap noticed at Joint
in 3 out of 50 piecesNOT OK
Weaving pattrenTo meet the process
specificationMeeting the process spec
Z pattern meets the
process specOK
Man
Material
Machine
Method
Cause & Effect Diagram- Less Weld
Penetration
----- Possible Root Causes -----
24

13
Front
Channel
Rear
Channel
25
Knee Joint – 6 mm plates joined by
Square butt joint with backing strip
2.2.2-2 What were the possible root causes ?
Possible Cause #1 Weld bead center line shift
Bow in plate can lead to weld bead shift
Weld Zig-Zag Pattern
Possible Cause #2 Weld weaving pattern
Possible Cause #3 Pin
misalignment leads to shifting of channel
2.3.1-1 What methods and / or tools were used to identify final RCs/ Improvement opportunities?
2.3.1-2 Why were these methods and / or tools selected (to identify final Rcs/ Improvement opportunities?
• Weld bead center line
shift
• Weld weaving pattern
• Manipulator locking
pin misalignment
Final Root Causes Reason
To establish effects of various
factors on weld bead center line
shift
Factors:
• Channel Length-Front
• Channel Length-Rear
• Channel Bow
Response: Channel root gap
To establish difference between
various Weaving pattern for weld
penetration
To find the root cause for
locking pin misalignment
Tools Identified
Box Plot
Why-Why
Analysis
Main Effect
26
14
2.3.1-3 How was the team prepared to use these methods/tools [used to identify the final root
causes/improvement opportunities?
Case study presentations Sessions with JCB Global Weld
Expert
6σ Training by in-house
Master Black Belt
Training conducted on
Minitab for the use of
various statistical tools
Best Practices: Welding
Process Standardization
Benchmarking
Robotics
Weld Training School
27
2.3.2-1 What data was generated and how was the data analyzed in order to identify the final root
causes and improvement opportunities?
2.3.2-2 What are the specific examples that led to the analysis of the final root cause
Data Generated Examples Analysis Done
Data collection was done for 50
samples to see the significance of
various factors on weld penetration.
• Weld bead center line shift
• Weld weaving pattern
• Manipulator locking pin
misalignment
Weld penetration specification is
min10% of sheet thickness
• Main effects showed strong effect
of channel bow on weld bead
shift
• Box plot showed significant
difference between Zig-zag
pattern, Box pattern and Double-J
pattern
• Special cause –Pin misalignment is
due to usage of unhardened pin
28

15
2.3.2-3 What was (were) the final root cause(s) identified?
2.3.3-1 How were the final root cause validated?
2.3.3-2 What evidence showed that the final cause were validated prior to solution development?
Failure Modes Final Root Causes Final Root cause
Validation Evidence of RC Validation
• Weld bead centre line shift due to
Channel bow
• Ineffective weld weaving pattern
• Manipulator locking pin
misalignment
• 2p test showed that channel
bow has got significant effect
on center line shift
• Fit up gap process capability
• Box Plot showed difference
between Zig-Zag , Box &
Double J pattern
• Special cause – Pin Hardness
issue verified
Weld Joint failure
• Incorrect bore ID tolerance with
respect to International
standard(40micron instead of
30micron)
• Bore ID capability study
• Rig Validation for 100 hrs
Part failed at 85hrs during
accelerated rig testing
• High stress area during harsh
application
• FEA showed stress
concentration zones at failed
area.
Sheet Material Failure
D
Moving Parts Joint failure
S
A
Similarly, for other failure modes root causes were validated
29
2.4.1-1 How was the correctness of the initial project scope, deliverables, and timing confirmed,(or What
changes were made)?
2.4.1-2 How were stakeholders involved and /or communicated with during root cause phase of the project?
Scope (No Change) Deliverables & Timelines (No Change)
In Scope:- All structural parts in Backhoe
machine
Out of Scope – Other JCB Models
Stakeholder Involvement
30

16
2.4.1-3 What stakeholder resistance was identified and /or addressed in this phase of project?
2.4.1-4 How was the appropriateness of the initial team membership and management routines confirmed(or
what changes were made) ?
Resistance
From
Resistant
To
Type of
Resistance How Identified How Addressed
Weld Shop High Interest &
Medium Power
Cut Section Analysis
( Destructive Tests)
Passive Project Team
Meeting
Convinced stakeholder that
NDT not possible
Made aware of impact on
project goals
Stakeholder Resistance
Team Routines & Communication ( Coaching Sessions added )
Activity Routine How Recorded Responsibility
Project Team Meeting Weekly Project Tracker
Timeline/ Milestone Chart Project Leader
Project Review Meeting Monthly Objectives vs Achievements Project Leader
Management Review Meeting Monthly Project Template Project Sponsor
Specific Functional/Stakeholder
Reviews Monthly Functional Trackers Project Leader
Change Management Meeting Fortnightly Change Review MoM GM- Quality
Shop floor/ Supplier Gemba As Required MoM through e-mail Project Members
Coaching Sessions to help
individuals cross barriers As Required
Informal Meetings with
individuals Functional Heads
31
Section 3:
Solution/Improvement
Development
32

17
3.1.1-1 What methods and / or tools were used to identify possible solutions ?
3.1.1-2 Why were these methods and / or tools selected (to identify possible solution ) ?
3.1.1-3 How was the team prepared to use these methods/tools [used to identify the possible solution ?
Identified Tools/Methods Purpose of Tools/Methods How team was trained on these
tools/method
Brainstorming
Interaction Plot
DOE
Response Optimizer
Finite Element Analysis
o To see the interaction between
factors and conclude its
significance
o To generate best possible
solution model
o To verify significance of Main
and Interaction effects for
solution generation
o To verify and validate solution
o To generate list of possible
solutions Trained by Black Belt on
- When to use
- How to use
Training on Finite Element
Analysis- IDC Pune
33
3.1.2-1 What data was generated and how was
the data analyzed to identify the possible solutions ?
34
Root Cause #1 : Weld bead centre line shift due to
Front Channel bow
Stage of Bow
generation
Straightening process added after profile
cutting to control bow within limits
Bow Capability Study Data Comparison
Process Map
Before: Cpk- 0.8
After Cpk- 2.2

18
3.1.2-1 What data was generated and how was the data analyzed to identify the possible solutions ?
Continued on next slide….. 35
Root Cause #2 : Ineffective weld weaving pattern
Possible Solution Generation: Evaluation of
alternate weaving patterns along with other
optimized weld parameters
Double J Box Weave
Brainstorming
BC
C
A
AB
B
AC
E
876543210
Te
rm
Standardized Effect
2.306
A V oltage
B C urrent
C Trav el speed
E Weav ing pattern
Factor Name
Pareto Chart of the Standardized Effects(response is Average Penetration, Alpha = 0.05)
The generated solution needs to be evaluated for its
feasibility for implementation and suitable outcome
Voltage, V Current, Amp Travel Speed,
cm/min Weaving Pattern
28 280 30 Double J
3.1.2-1 What data was generated and how was the data analyzed to identify the possible solutions ?
3.1.2-2 What were the possible solutions and improvements ?
3.1.2-3 What evidence showed that the solution/improvements were possible instead of final ?
36

19
3.1.2-1 What data was generated and how was the data analyzed to identify the possible solutions ?
37
Root Cause #3 : Manipulator locking pin
misalignment (Special Cause)
Possible Solution Generation:
#1: Include Pin check in Preventive Maintenance plan
#2: Change Pin raw material from EN1A to EN8 with induction hardening
(Hardness: 55-58 HRC) to avoid bending
Brainstorming (With Fixture Expert)
PIN
3.2.1-1 What methods and/ or tools were used to identify the final solutions / Improvements?
3.2.1-2 Why were these methods and/ or tools selected (to identify the final solutions/improvements)?
3.2.1-3 How was the team prepared to use these methods/ or tools (to identify the final solutions)?
3.2.2-1How were the methods and/ or tools used to determine the final solutions/ improvements?
Identified Tools/Methods Tools/Methods Selected How team was trained on these
tools/method
Weld Subject Matter Expert
Benchmarking
o To get expert opinion to
identify best and simpler
solution
o To generate solution in line
with JCB standard
Got Group Weld Expert’s
opinion and deliberation on • Failure Modes
• Possible Causes
• Possible Solutions
Got access to JCB group
standard portal
38
Finite Element Analysis
o To verify and validate solution
20
3.2.2-2 What were the final solutions/ improvements?
Failure Modes Final Root Causes Final Solution
• Weld bead centre line shift
due to Channel bow
• Ineffective weld weaving
pattern
• Manipulator locking pin
misalignment
• Straightening process added after profile cutting to control
bow within limits
• Weld weaving pattern changed from Zig-Zag to Double J
profile
• Locking pin raw material changed from EN1A to EN8 with
induction hardening Weld Joint failure
• Incorrect bore ID tolerance
with respect to International
standard(40µm instead of
30µm)
• Drawing tolerance to be corrected as per International
Standard
• High stress area during harsh
application • Part design changed- Gusset plate added to strengthen
the design
Sheet Material Failure
D
Moving Parts Joint failure
S
A
Similarly, for other failure modes Final Solutions were decided
39
3.2.3-1 How were the final solutions/ improvements validated?
3.2.3-2 What evidence showed that validation was performed prior to implementation?
4%
14%
Failed Part Improved Part
Final Solutions
Straightening process added after profile cutting to
control bow within limits
Weld weaving pattern changed from Zig-Zag to Double
J profile
Locking pin raw material changed from EN1A to EN8
with induction hardening
Validation Results (Before Implementation)
1. Penetration Results
2. Rig Testing (Simulating harsh applications) –
Qualified 500 hr before implementation
40
Validation Plan
• 30 samples were made for validation, with above
corrections.
• 10 samples were checked for weld penetration
• 3 samples were subjected to accelerated testing for
500 hrs(equivalent to 1yr of field hours) at JCB Test
Site
Accelerated Testing @ JCB Test Site Rig Testing

21
3.2.4-1 What additional potential benefits were anticipated from the final solution(s)/improvement(s)?
3.2.4-2 Were the additional potential benefits anticipated prior to implementation?
Additional benefits are same as identified in section : 2.1.1-2
41
Additional Potential Benefits
Area Tangible Benefits
Reliability (T12) + 25%
Part Inventory - 20%
MTTF + 40%
Market Share <2%
Intangible Benefits
Customer Delight
Skill Development
Team Morale
Confidential absolute values not shared
Failure
Modes Final Solution
Validation Plan & Results
(Data Generation) Evidence
• Straightening process added
after profile cutting to
control bow within limits
• Weld weaving pattern
changed from Zig-Zag to
Double J profile
• Locking pin raw material
changed from EN1A to EN8
with induction hardening
• 30 samples were made for validation,
with above corrections.
• 10 samples were checked for weld
penetration
• Drawing tolerance to be
corrected as per
International Standard
• Capability study was done for 30
samples, and Cpk for bore dia was
found to be 1.57
• Part design changed- Gusset
plate added to strengthen the
design
• 30 samples were made for validation,
with new design
• 3 samples were subjected to
accelerated testing for 500
hrs(equivalent to 1yr of field hours)
at JCB Test Site- No Failure
• Field validation done for 100
machines in harsh territory- No
Failure
3.2.5-1 What data was generated and how was the data analyzed to justify why the chosen final
solution(s)/ improvement(s) should be implemented?
3.2.5-2 What evidence showed that justification was performed prior to implementation?
Validation Report
Penetration Results
Capability Study
42

22
3.3.1-1 How was the correctness of the initial or updated project scope, deliverables, and timing confirmed,(or
What changes were made)?
3.3.1-2 How were stakeholders involved and /or communicated with during the solution phase of the project?
Scope (No Change) Deliverables & Timelines (No Change)
In Scope:- All structural parts in Backhoe
machine
Out of Scope – Other JCB Models
Stakeholder Involvement
43
Activity Routine How Recorded Responsibility
Project Team Meeting Weekly Project Tracker
Timeline/ Milestone Chart Project Leader
Project Review Meeting Monthly Objectives vs Achievements Project Leader
Management Review Meeting Monthly Project Template Project Sponsor
Specific Functional/Stakeholder
Reviews Monthly Functional Trackers Project Leader
Change Management Meeting Fortnightly Change Review MoM GM- Quality
Shop floor/ Supplier Gemba As Required MoM through e-mail Project Members
Coaching Sessions to help
individuals cross barriers As Required
Informal Meetings with
individuals Functional Heads
Resistance
From
Resistant
To
Type of
Resistance How Identified How Addressed
Stakeholder Resistance
Team Routines & Communication ( No change )
3.3.1-3 What stakeholder resistance was identified and /or addressed in this phase of project?
3.3.1-4 How was the appropriateness of the initial or updated team membership and management routines
confirmed(or what changes were made) ?
No Resistance
44

23
Section 4:
Solution Implementation &
Verification
45
4.1.1-1 How were the stakeholders involved in planning the solution implementation?
4.1.1-2 How were stakeholders involved in implementing the solution ?
Planning Implementation
• Customer Feedback
• Change plan approval
• Timeline approval
Actual Implementation
• Resource deployment
• Budget deployment
Planning Implementation
• Make implementation plan
• Validate implementation
• Potential Failure Mode and
Effects Analysis
Actual Implementation
• Pilot, production , run @ rate
• Production Part Approval
• Control plan development to
hold the gains
Planning Implementation
• Communicate plan & take
inputs
Actual Implementation
• Supply chain readiness
• Ensure zero obsolescence
• Share cut-in serial no
Planning Implementation
• Manufacturing readiness plan
(in house & suppliers)
• Change plan approval
• Timeline approval
Actual Implementation
• Manufacturing System Design
• Declare readiness
46

24
4.1.2-1 What was done to anticipate resistance before it occurred ?
Mechanism to
anticipate resistance Resistance Anticipated
Change in global designs/ legacy
parts
Increase in cycle time due to
change in weld weaving pattern
Increase in workload due to
additional checks and controls
Salvaging of Old Stock
Steps taken to mitigate resistances
UK Design team involved
India centric duty cycle explained to the group
As market leader, should cater to local needs
Time-Motion studies done to optimize cycle
time
Ultrasonic testing outsourced to third-party
Agreement taken that all changes would cut-in
as running changes
Technical Review of
Solutions done with
Design Team
Weld Shop Team
Quality Team
Product Support
Team
Finance Team
Resistance on the expenditure
needed on tooling and equipments
Detailed Business Case prepared to justify the
expenditure, Agreement taken on payback
period
Design Team
Weld Shop
Materials & Product Support
Finance
Weld Shop
47
4.1.2 -2 What types of resistance were actually encountered during the course of solution implementation?
4.1.2 -3 How was the actual resistance identified ?
4.1.3-1 How was the actual resistance addressed?
4.1.3-2 How did the team know, it was successful in addressing the resistance ?
Prior mitigation plan to counter resistance helped in
minimizing the actual resistances during implementation
S. No. Resistance Raised by Addressing Resistance
01
Complexity encountered in weld and
assembly shop due to additional variant
(H-section change was India specific
change & was not needed for export
machines, because of varied duty cycles)
Weld Shop
Variant management system introduced for
Loader Arm to mitigate evolving complexity
This was agreed by all
Resistance identified in Project Meeting
48

25
4.1.4-1 What was the evidence of stakeholder group buy-in ?
4.1.4-2 What evidence showed that buy-in was obtained prior to implementation ?
Overall Program Sign-off : Phase-in, Phase-out
Product Improvement Plan
Sign-off
49
4.2.1-1 What process or systems were changed or created to implement the solution ?
4.2.1-2 What systems were changed or created to measure and manage the performance of the
implementation?
Weld Joint Failure
A
Sheet Material Failure
D
Moving Parts Joint Failure
S
Failure Modes Process Change Measure and Manage
Part Design Changed
Process capability and Control chart
FEA, PFMEA, Control Plan
Drawing Revision
50
• Straightening process added to
control channel bow
• Weaving pattern changed to
double J
• Manipulator pin Drawing revised
to include changed material &
hardness
• X-bar R chart for bow monitored
• Penetration result as per Plan
• Added to Preventive maintenance
plan

26
4.3.1 -1 What were the results?
4.3.1 -2 How did the results compared to the specific project goal / measures from item 2.1.1? 4.3.2-1 What additional benefits were realized from the project?
4.3.2-3 How do the actual additional benefits that were realized compare to the expected additional benefits identified ?
Warranty Cost Reduction
Target: 68% Achieved: 78%
2013 BestAchieved
Target,Dec-14
Achieved
Structures Warranty Cost, INR
50 %
3.2X
2X
X
68 %
78%
0.66X
Additional Potential Benefits
Area
Target
Achieved
Reliability
(T12)
+ 25% +59%
Part Inventory - 20% -24%
MTTF + 40% +55%
Market Share <2% +3.4%
Intangible Benefits
Customer Delight
Skill Development
Team Morale
Tangible Benefits
Deliverables & Timelines
51
Structures
4.3.2-2 How did the team measure any of the additional benefits that were soft?
Measurement for additional intangible/soft benefits
Feature→ Customer Delight Skill Development Team Morale
Score →
Score on 5-point scale,
‘5’ being highest score
Score on 5-point scale,
‘5’ being highest score
Score on 5-point scale,
‘5’ being highest score
Sample Size→ 500 Customers Entire Project Team Entire Project Team
Methodology→
Carelink Survey Self Assessment Engagement Survey
Post-cutin Failures Skill Matrix HR Assessment
Field Visits
52
27
Section 5:
Sustaining and Communicating
Results
53
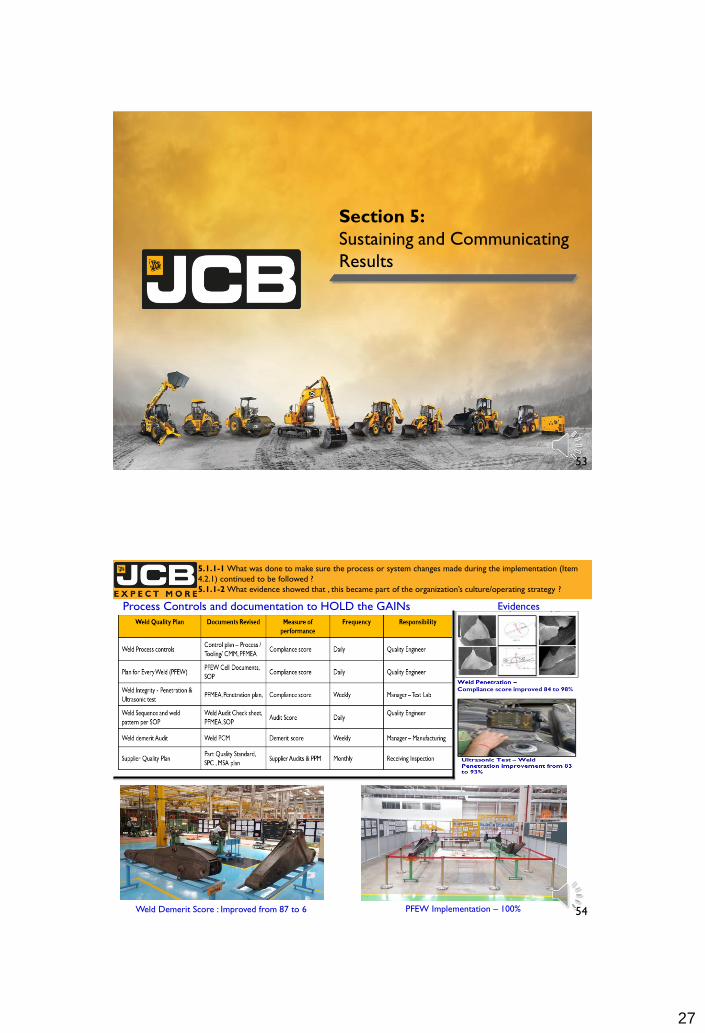
5.1.1-1 What was done to make sure the process or system changes made during the implementation (Item
4.2.1) continued to be followed ?
5.1.1-2 What evidence showed that , this became part of the organization’s culture/operating strategy ?
Process Controls and documentation to HOLD the GAINs
Weld Demerit Score : Improved from 87 to 6
Evidences
PFEW Implementation – 100% 54

28
Command Center : Escalation & Monitoring
5.1.2 -1 What was done to make sure the benefits obtained from the implementation (Item 4.2.1) will be
maintained ?
5.1.2 -2 What evidence showed that , this became part of the organization’s culture/operating strategy ?
Structures Subsystem: Journey Continued…
Online MIS & Touch Points on Lotus Notes
Subsystem Reliability added in Quality Roadmap
55
5.2.1 How did the team communicate the results to the various stakeholder groups?
Shop / Functions
Communication
Team Recognition
Field
Communication
Customer Expression Centre
Customer Communication
Change
Communication
Supplier/Dealer
Communication
56

29
Thank You