structured analysis and structured designdslab.konkuk.ac.kr/class/2019/19se/lecture note... ·...
TRANSCRIPT

Structured Analysis and Structured Design
- Introduction to SASD- Structured Analysis- Structured Design
Lecturer: JUNBEOM [email protected]
http://dslab.konkuk.ac.krVer. 1.5

SASD Process
Konkuk University 2
Activity
Time
Statement of Purpose
System Context Diagram
Event List
Data Dictionary
ERD
DFD
Process Specification
State Transition Diagram
Structured Chart
Environmental Model
Behavioral Model
Implementation Model

Statement of Purpose
• A clear and concise textual description of the purpose for the system to develop
• It should be deliberately vague.
• It is intended for top level management, user management and others who are not directly involved in the system.
Konkuk University 3

System Context Diagram
• Highlights the boundary between the system and outside world.
• Highlights the people, organizations and outside systems that interact with the system under development.
• A special case of DFD
Konkuk University 4

System Context Diagram - Notation
Konkuk University 5
Process : represents the proposed system
Terminator : represents the external entities
Flow : represents the in/out data flows

System Context Diagram – RVC Example
Konkuk University 6
RVC Control
Sensor
Motor
Cleaner

Event List
• A list of the event/stimuli outside of the system to which it must respond.
• Used to describe the context diagram in details.
• Types of events
– Flow-oriented event : triggered by incoming data
– Temporal event : triggered by internal clock
– Control event : triggered by an external unpredictable event
Konkuk University 7
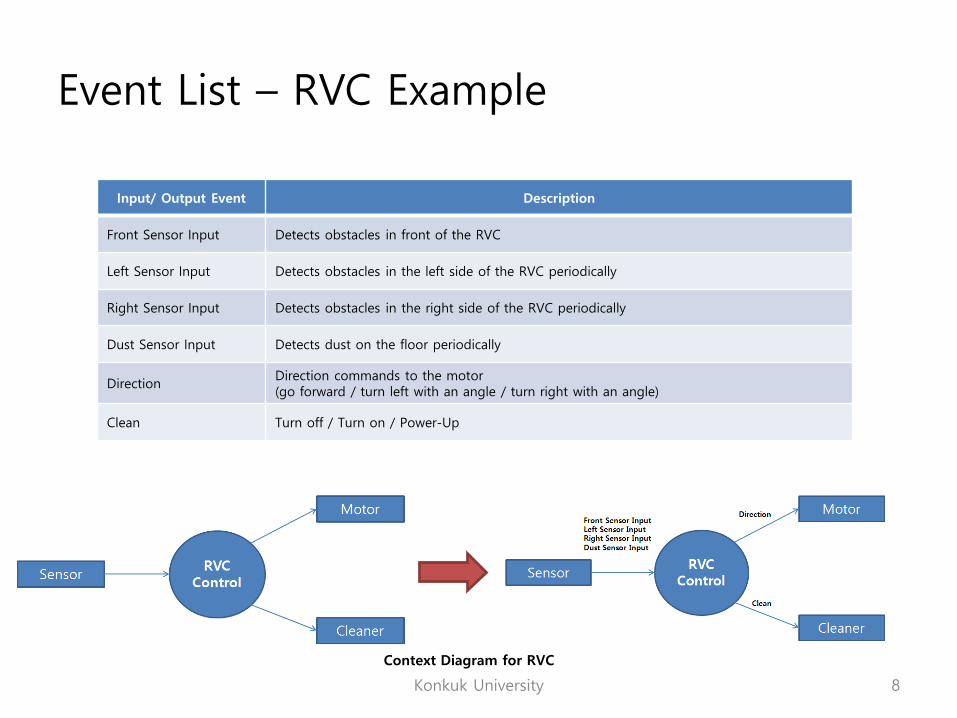
Event List – RVC Example
Konkuk University 8
Input/ Output Event Description
Front Sensor Input Detects obstacles in front of the RVC
Left Sensor Input Detects obstacles in the left side of the RVC periodically
Right Sensor Input Detects obstacles in the right side of the RVC periodically
Dust Sensor Input Detects dust on the floor periodically
DirectionDirection commands to the motor (go forward / turn left with an angle / turn right with an angle)
Clean Turn off / Turn on / Power-Up
Context Diagram for RVC

System Context Diagram – RVC Example
Konkuk University 9
RVC Control
Sensor
Motor
Cleaner
Front Sensor InputLeft Sensor InputRight Sensor InputDust Sensor Input
Direction
Clean

Data Flow Diagram (DFD)
• Provides a means for functional decomposition.
• Composed of hierarchies(levels) of DFDs.
• Notation (A kind of CDFD)
Konkuk University 10
Data Process
Control Process
Terminator
Data Store
Data Flow
Control Flow

DFD Level 0 – RVC Example
Konkuk University 11
RVC Control
0
Front Sensor Motor
Cleaner
Direction
Clean
Left Sensor
Right Sensor
Dust Sensor
Front Sensor Input
Left Sensor Input
Right Sensor Input
Dust Sensor Input
Digital Clock
Tick

DFD Level 0 – RVC Example
Konkuk University 12
Input/ Output Event
Description Format / Type
Front Sensor Input Detects obstacles in front of the RVC True / False , Interrupt
Left Sensor Input Detects obstacles in the left side of the RVC periodically True / False , Periodic
Right Sensor Input Detects obstacles in the right side of the RVC periodically True / False , Periodic
Dust Sensor Input Detects dust on the floor periodically True / False , Periodic
DirectionDirection commands to the motor (go forward / turn left with an angle / turn right with an angle)
Forward / Left / Right / Stop
Clean Turn off / Turn on / Power-Up On / Off / Up
(A kind of) Data Dictionary

DFD Level 1 – RVC Example
Konkuk University 13
Obstacle & Dust
Detection1
Front Sensor Input
Left Sensor Input
Right Sensor Input
Dust Sensor Input
Tick
Obstacle & DustLocation
Cleaner & MotorControl
2
Direction
Clean

DFD Level 2 – RVC Example
Konkuk University 14
DetermineObstacleLocation
1.5
Front Sensor Input
Left Sensor Input
Right Sensor Input
Dust Sensor Input
Tick
ObstacleLocation
Front Sensor
Interface1.1
LeftSensor
Interface1.2
RightSensor
Interface1.3
DustSensor
Interface1.4
Tick
Tick
Front Obstacle
Left Obstacle
Right Obstacle
DetermineDust
Existence1.6
Dust Existence
DustExistence

DFD Level 2 – RVC Example
Konkuk University 15
ObstacleLocation
DustExistence
Main Control
2.1
Motor Command
Cleaner Command
MotorInterface
2.2
CleanerInterface
2.3
Tick
Direction
Clean

DFD Level 3 – RVC Example
Konkuk University 16
ObstacleLocation
DustExistence
Controller2.1.1
Motor Command
Cleaner Command
TickMove
Forward2.1.2
Turn Left2.1.3
Turn Right2.1.4
Motor Command
Motor Command
Enable
Disable
Trigger
TriggerTick
Tick

DFD Level 4 – RVC Example
Konkuk University 17
Move Forward
Turn RightTurn Left
/ Enable “Move Forward”, Cleaner Command (On)
Tick [F && !R]/ Disable “Move Forward”, Cleaner Command (Off),Trigger “Turn Right”
Tick / Enable “Move Forward”, Cleaner Command (On)
Tick [F && !L]/ Disable “Move Forward”, Cleaner Command (Off),Trigger “Turn Left”
Tick / Enable “Move Forward”, Cleaner Command (On)
Stop
Tick [F && L && R]/ Disable “Move Forward”, Cleaner Command (Off),
Many problems in this model:1. “Stop” state2. Do not consider “Dust”3. …
State Transition Diagram for Controller 2.1.1
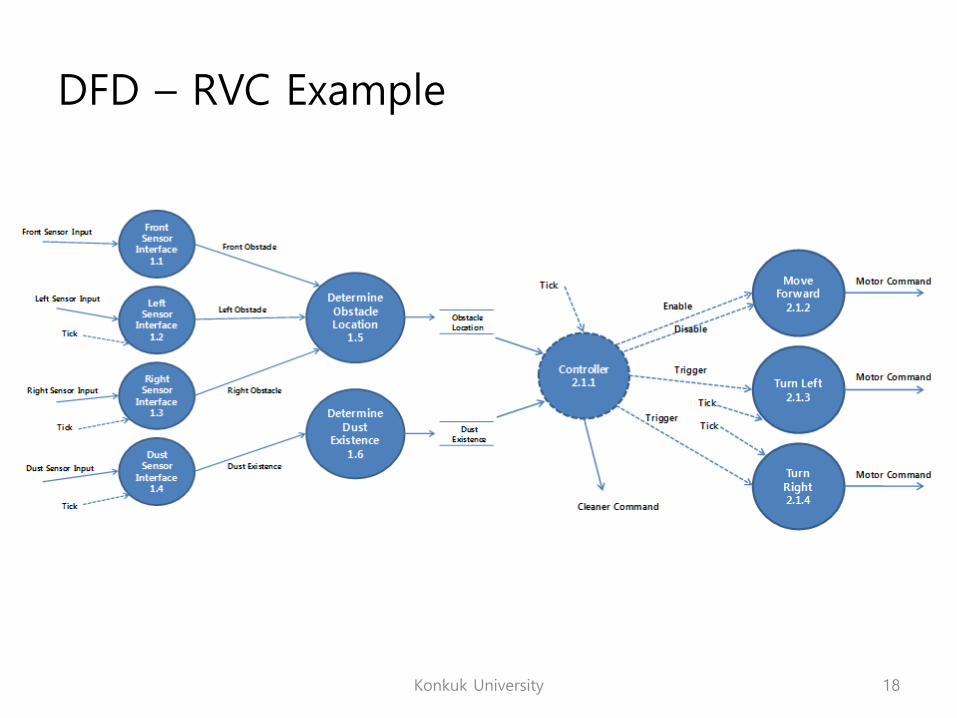
DFD – RVC Example
Konkuk University 18

Process Specification
• Shows process details which are implied but not shown in a DFD.
• Specifies the input, output, and algorithm of a module in a DFD.
• Normally written in pseudo-code or table format.
• Example – “Apply Payment”
For all payments
If payment is to be applied today or earlier and has not yet been applied
Read account
Read amount
Add amount to account’s open to buy
Add amount to account’s balance
Update payment as applied
Konkuk University 19
Zhou Qun, Kendra Hamilton, and Ibrahim Jadalowen (2002)

Process Specification – RVC Example
Konkuk University 20
Reference No. 1.2
Name Left Sensor Interface
Input Left Sensor Input (+Data structure if possible) , Tick
Output Left Obstacle (+Data structure)
Process Description“Left Sensor Input” process reads a analog value of the left sensorperiodically, converts it into a digital value such as True/False, andassigns it into output variable “Left Obstacle.”

Data Dictionary
• Defines data elements to avoid different interpretations.
• Not used widely in recent years.
• Example [Yourdon 1989]
A: What’s a name?
B: Well, you know, it’s just a name. It’s what we call each other.
A: Does that mean you can call them something different when you are angry or happy?
B: No, of course not. A name is the same all the time.
A: Now I understand. My name is 3.141592653.
B: Oh your name is PI…But that’s a number, not a name. But what about your first and last name. Or, is your first name 3 and your last name 141592653?
Konkuk University 21

Data Dictionary
• Example– Element Name = Card Number
– Definition = *Uniquely identifies a card*
– Alias = None
– Format = LD+LD+LD+LD+SP+LD+LD+LD+LD+SP+ LD+LD+LD+LD+SP+LD+LD+LD+LD
– SP = “ ” *Space*
– LD = {0-9} *Legal Digits*
– Range = 5191 0000 0000 0000 ~ 5191 9999 9999 9999
Konkuk University 22

State Transition Diagram
• Shows the time ordering between processes.
• More primitive than the Statechart diagram in UML.
• Different from the State transition diagram used in DFD.
• Not widely used.
• Notation
Konkuk University 23
TransitionsObjects

State Transition Diagram - Example
Konkuk University 24

Structure Charts
• Structured Design (SD)
• Functional decomposition (Divide and Conquer)
– Information hiding
– Modularity
– Low coupling
– High internal cohesion
• Needs a transform analysis.
Konkuk University 25

Structured Charts – Transform Analysis
Konkuk University 26
Afferent Flow(Input)
Efferent Flow(Output)
Central Transformation(Control)

Structured Charts – Transform Analysis
Konkuk University 27
Input(Afferent Flow)
Process(Central Transformation)
Output(Efferent Flow)
Control
ProcessInput Output
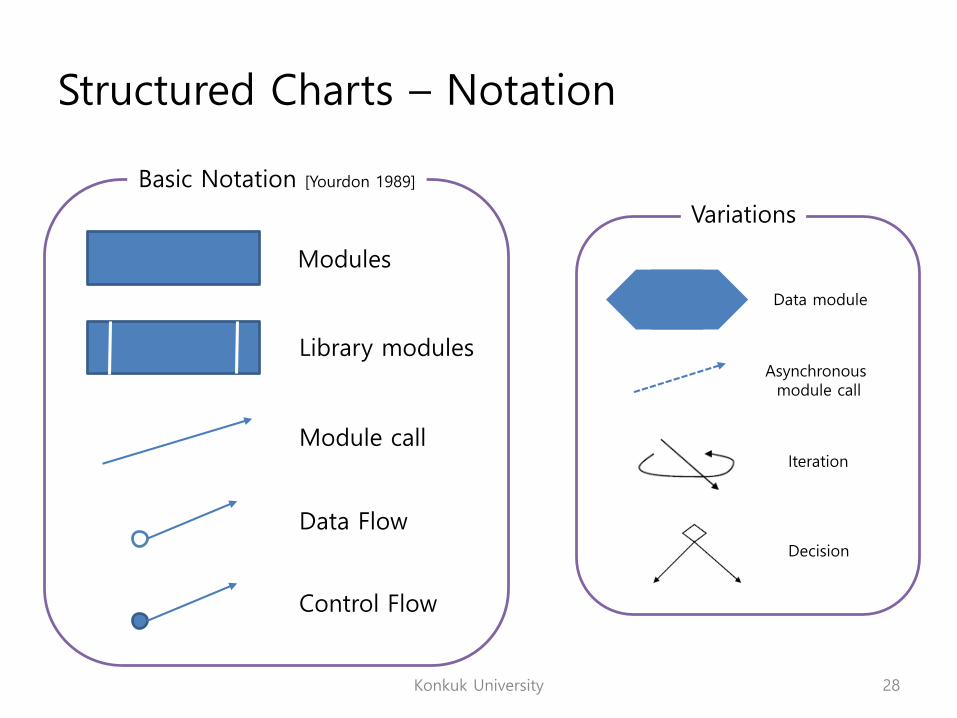
Structured Charts – Notation
Konkuk University 28
Modules
Library modules
Module call
Data Flow
Control Flow
Basic Notation [Yourdon 1989]
Asynchronous module call
Data module
Iteration
Decision
Variations

Structured Charts – RVC Example (Basic)
Konkuk University 29
DetermineObstacle Location
Determine Dust Existence
Controller
Front SensorInterface
Left SensorInterface
Right SensorInterface
Dust SensorInterface
Move Forward Turn Left Turn Right
Main
Obstacle Location Dust Existence
EnableDisable
Trigger Trigger

Structured Charts – RVC Example (Advanced)
Konkuk University 30
DetermineObstacle Location
Determine Dust Existence
Controller
Front SensorInterface
Left SensorInterface
Right SensorInterface
Dust SensorInterface
Move Forward Turn Left Turn Right
Main
Obstacle Location
Dust Existence
EnableDisable
Trigger
Trigger

Summary
• SASD is a process-driven software analysis technique.
• SASD has a long history in the industry and it is very mature.
• It provides a good documentation for requirements.
• In recent years, it is widely used for developing real-time embedded system’s software.
Konkuk University 31
SASD

What is a good analysis & design?
• There are no explicit criteria for analysis & design
• The judgement of analyst & designer is a key of design– System context and event analysis
– DFD divide and design
– Behavior analysis for state transition diagram
Konkuk University 32

Statement of Purpose
Konkuk University 33
Simple Vending Machine (SVM)
- A vending machine sells two beverages.- It reads a credit card only and provides selected beverage.- It checks temperature and serves the drink cold or hot.- If balance of a credit card is not enough to buy the beverage, a machine refuse the demand.

System Context Diagram
Konkuk University 34
SVM Control
Sensor Beverage
Screen
Button
Reader
Beverage
Display
Temperature sensor input
Beverage1 inputBeverage2 input
Card reader input
Event List- Temperature sensor input // reads temperature- Button input // identify button- Card reader input // checks card- Beverage // provides beverage- Display // display machine information
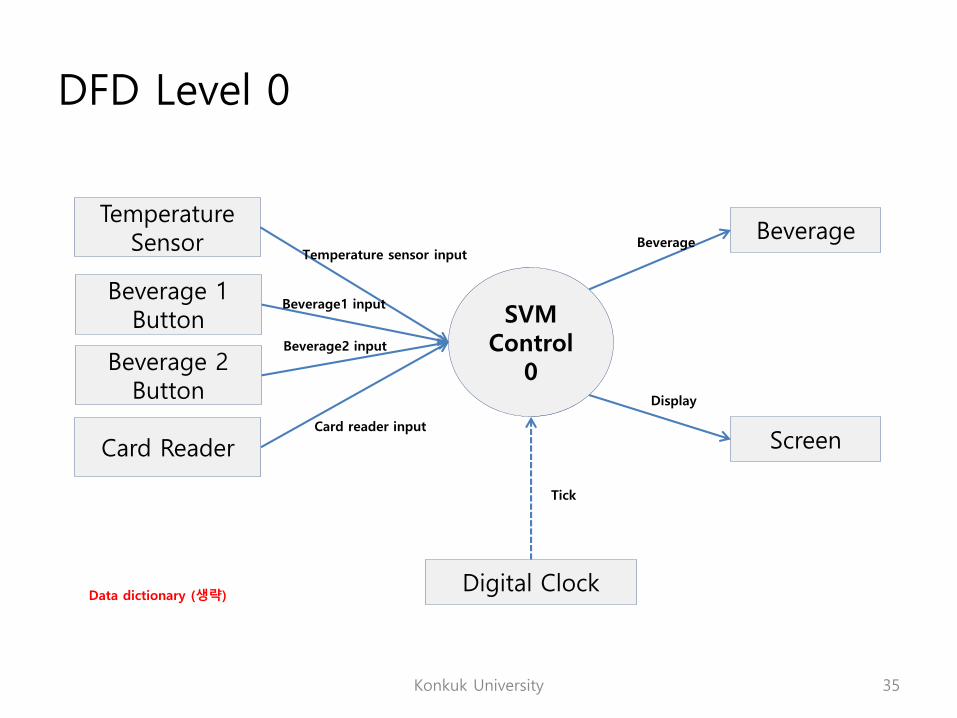
DFD Level 0
Konkuk University 35
SVM Control
0
Temperature Sensor Beverage
Screen
Beverage 1 Button
Card Reader
Beverage
Display
Temperature sensor input
Beverage1 input
Card reader input
Beverage 2 Button
Beverage2 input
Digital Clock
Tick
Data dictionary (생략)

DFD Level 1
Konkuk University 36
Beverage
Display
Temperature sensor input
Beverage1 input
Card reader input
Beverage2 input
Tick
Input Control
1
Beverage Request& Card Data
Beverage & Screen Control
2
Process Specification- Input Control- Beverage & Screen Control

DFD Level 2
Konkuk University 37
Temperature sensorinput
Beverage1 input
Tick
Temperature sensor
interface1.1 Temperature
Beverage Kind
Button 1 interface
1.2
Button 2 interface
1.3
Card Reader interface
1.4
Beverage2 input
Card input
Temperature Degree
1.5
BeverageKind1.5
CardInformation
1.6
Temperature
Card Data
Process Specification- Temperature sensor interface- Button 1 interface- Button 2 interface- Card Reader interface- Temperature Degree- Beverage kind- Card information

DFD Level 2
Konkuk University 38
Beverage Command
Display Command
Main Control
2.1
Temperature
Beverage Kind
Card Data
Beverage Interface
2.2
Display Interface
2.3
Process Specification- Main Control- Beverage Interface- Display Interface

DFD Level 3 (Controller)
Konkuk University 39
Beverage CommandDisplay Command
Enable
Controller2.1.1
Temperature
Beverage Kind
Card Data
Idle2.1.2
Disable Hot/12.1.3
Cold/12.1.4
Hot/22.1.5
Cold/22.1.6
Beverage CommandDisplay Command
Beverage CommandDisplay Command
Beverage CommandDisplay Command
Beverage CommandDisplay Command
Tick
Trigger
Trigger
Trigger
Trigger
Refuse2.1.7
Beverage CommandDisplay Command

DFD Level 4 – State Transition Diagram
Konkuk University 40
/Enable “Idle”
Idle
Refuse
Tick [card.balance < 100 ]/Disable “Idle”Trigger “Refuse”
Tick/Enable “Idle”
Hot 1Hot 2 Cold 1
Cold 2
Tick/Enable “Idle”
Tick [card.balance > 100 && B1 && C]/Disable “Idle”Trigger “Hot/1”
Tick [card.balance > 100 && B2 && C]/Disable “Idle”Trigger “Hot/2”
Tick [card.balance > 100 && B2 && H]/Disable “Idle”Trigger “Cold/1”
Tick [card.balance > 100 && B2 && H]/Disable “Idle”Trigger “Cold/2”
Tick/Enable “Idle”
Tick/Enable “Idle”
Tick/Enable “Idle”
Tick/Enable “Idle”

Practice – Assignment #1
• Complete the RVC analysis in more details.
– Consider the “Dust,” “Stop” …
– You may have several controller
– 9/23 자정: ecampus 과제란 업로드
Konkuk University 41

Practice – Assignment #2
• Performing structured analysis for printer management controller
– 컨트롤러는 요청을 제어하여 프린터에 작업 부여
– 3개의 프린터 (2대 black, 1대 color)
– 프린터는 토너와 용지의 잔량을 감지 (sensor)
– 10/6 자정: ecampus 과제란 업로드
Konkuk University 42

References
• Modern Structured Analysis, Edward Yourdon, 1989.
• Introduction to System Analysis and Design: a Structured Approach, Penny A. Kendall, 1996.
• Zhou Qun, Kendra Hamilton, and Ibrahim Jadalowen (2002). Structured Analysis and Structured Design (SASD) - Class Presentaionhttp://pages.cpsc.ucalgary.ca/~jadalow/seng613/Group/
Konkuk University 43