structure of plankton communities in the dogger bank area (north
TRANSCRIPT

Vol. 95: 115-131, 1993 MARINE ECOLOGY PROGRESS SERIES Mar. Ecol. Prog. Ser.
Published May 19
Structure of plankton communities in the Dogger Bank area (North Sea)
during a stratified situation
Torkel Gissel Nielsen', Bo ~ s k k e g a a r d ~ , Katherine ~ i c h a r d s o n ~ , Flemming Bo Pedersen4, Lotte Hansen2
'National Environmental Research Institute. Department of Marine Ecology and Microbiology. Frederiksborgvej 399, PO Box 358. DK-4000 Roskilde. Denmark
*Marine Biological Laboratory, University of Copenhagen, Strandpromenaden 5, DK-3000 Helsinger, Denmark
3Danish Institute for Fisheries and Marine Research, Charlottenlund Castle, DK-2920 Charlottenlund, Denmark
'Institute of Hydrodynamics and Hydraulic Engineering (ISVA), Technical University of Denmark, Building 115, DK-2800 Lyngby, Denmark
ABSTRACT: Plankton dynamics and hydrography were invest~gated in the Dogger Bank area, southern North Sea, In May 1990 after the onset of stratification Greatest phytoplankton biomass and production rates were observed withln a subsurface maximum around the pycnochne. At all 51 stations investigated, fluorescence maxima were found at depths >l5 m and often at depths >30 m. Small flagellates (5 to 7 pm) dominated the phytoplankton. The vertical distributions of the smaller heterotrophs (bacteria, heterotrophic nanoflagellates and cihates) were closely related to the fluorescence distribution. Carbon budgets established for the southern North Sea suggest that, on and south of the Dogger Bank, ca 15 % of phytoplankton production was channelled directly into the larger zooplankton (copepods), while north of the Dogger Bank, ca 30 % was ingested by copepods. The production of the phytoplankton fraction >l 1 pm (i.e. potential copepod prey items) could not alone account for the daily carbon demand of the copepods. The carbon budgets suggest that ciliates could potentially have been of nutritional importance to the copepod populat~on. Calculations showed that copepods possessed the ability to clear a substantial fraction of ciliate production. The high biomass of bacteria, heterotroph~c flagellates and c~liates, as well as the fact that primary production of the larger (I.e. grazable) phytoplankton did not appear to be sufficient to meet copepod energy requirements, suggest the importance of the microbial loop in carbon cycling in the North Sea during the stratified period.
INTRODUCTION
The North Sea is one of the most investigated marine areas in the world and, due to the region's importance with respect to fisheries, it has the longest known records of fisheries yield. It was on the basis of these data that the North Sea ecosystem model was devel- oped (Steele 1974). The backbone of this model is the assumption that herbivorous copepods are responsible for the transfer of energy both to the higher trophic levels in the pelagial and to the bottom through sedi- mentation of faecal pellets.
Since 1974, however, our understanding of planktonic ecology has changed significantly and there is now evi-
dence that herbivorous copepods may not always be the main vehicle of carbon transfer within the marine food web in the North Sea (e.g. Nielsen & Richardson 1989). During the last decade, the importance of autotrophic and heterotrophic microorganisms in the planktonic food web has generally been recognized (reviewed by Fenchel 1988). To date, however, few studies have examined the role of these organisms in the food webs of the open North Sea. Nielsen & Richardson (1989) con- cluded that the 'microbial loop' was not a significant route for carbon transfer under winter and spring bloom conditions in the open North Sea but suggested, on the basis of biomass ratios of bacteria to phytoplankton, that the microbial loop may be significant during summer.
O Inter-Research 1993

116 Mar. Ecol. Prog. Ser. 95: 115-131, 1993
the approxi-
However, no comprehensive studies of the role of rnicro- organisms in the energy transfer in the open North Sea during a non-winter (i.e. stratified) situation have yet been carried out.
As a further development, the important influence that oceanographic features can have on plankton pro- duction and on the structure of the food chain in a given area has also been recognized (see review by Cushing 1989).
Large-scale examples of oceanographic discontinu- ities causing enhanced biological activity are the coastal upwelling systems along the west coasts of Africa (Andrews & Hutchings 1980) and South Amer- ica (e.g. Peterson et al. 1988). On a smaller scale, patches of elevated phytoplankton biomass and pro- duction are often measured in association with 'fronts' (transition zones between different water masses). Such associations have often been observed in the North Sea and in the neighbouring seas (Holligan et al. 1984: English Channel; Pingree et al. 1978: off Flam- borough Head (NE England); Richardson et al. 1985: Irish Sea; Richardson 1985: North Sea/Skagerrak front: Richardson et al. 1986, I ~ r b o e et al. 1988: Buchan front (off NE Scotland); Nielsen & Richardson 1989: Dogger Bank). Although fewer studies of copepod pro- duction in the North Sea have been carried out, it too has been shown to peak in frontal waters (Kiarboe & Johansen 1986, Kiarboe et al. 1988).
The Dogger Bank is a shallow region in the south- central North Sea which is well known for its produc- tive fisheries. From about May until September, the major part of the North Sea is thermally stratified and the transition between thermally stratified and isother- mal water lies at or near the Dogger Bank (Pingree & Gnffiths 1978). In view of the many observations of enhanced primary production in frontal regions, it
seems possible that the Dogger Bank region may be more productive than surrounding waters. However, a thorough understanding of plankton dynamics in this part of the North Sea is still lacking. Studies carried out during the winter 1987-88 (K. Richardson, M. R. Heath, D. Baird, A. Christofferson & D. Seaton unpubl. data) concluded that, because of the shallow depth (average depth ca 25 m), primary production at the Dogger Bank is high throughout the winter. This pro- duction is the basis for the maintenance of the zoo- plankton production observed in the southeastern North Sea during winter (Hay et al. 1991). The shal- lowness of the Bank also causes the spring phyto- plankton bloom to be initiated here months before thermal stratification triggers the spring bloom in the northern North Sea (Nielsen & Richardson 1989).
The purpose of the present investigation was to describe the structure and dynamics of the planktonic community in relation to hydrographic conditions in the Dogger Bank area during summer stratification.
MATERIALS AND METHODS
Sampling. The study was conducted during a cruise with RV 'Dana' (Danish Fisheries Ministry) from May 25 to June 4 , 1990. In all, 51 stations in the southern North Sea were visited. Vertical profiles of temperature, salin- ity and fluorescence were measured throughout the water column at each station. Additional measurements of biological parameters were carried out at 12 stations (Fig. 1). The present paper focuses on the composition and dynamics of the plankton community along 2 tran- sects: one across the Dogger Bank (Transect 1) and one parallel to the northern edge of the Bank (Transect 2). Each transect was completed within 1 d.

Nielsen et al.: Plankton community structure 117
Temperature and salinity were recorded throughout the water column using a Niel Brown Mark 111 CTD System. Samples for calibration of the salinity probe were taken at various depths at randomly selected sta- tions. From the CTD and fluorescence profiles, 5 depths were selected so that the surface, pycnocline and bottom water was sampled. Measurements of all parameters and rates were carried out on water origi- nating from the same Niskin water bottle.
Nutrients. Samples for the determination of nutrients (NO2-, NO3- and were measured using an auto- mated nutrient analyzer (Dansk Havteknik) following methods described by Grasshoff (1976). The biological variables measured included chlorophyll a (chl a), pri- mary production, and abundance and production of bacteria, autotrophic and heterotrophic nanoflagel- lates, rnicrozooplankton and copepods.
Chlorophyll a. Chl a fluorescence was measured with a Q-instruments fluorometer (Hundahl & Holck 1980) mounted on the CTD system. A linear regression was calculated between the fluorescence and chl a from several calibration samples covering the area investigated (n = 59, r2 = 0.78). This relationship was used in the conversion of the fluorescence profiles to chl a. Chl a analyses were made by filtering water samples onto GF/C filters and immediately extracting the filter in 90 % acetone. The concentration of chl a, with correction for phaeopigments, was measured spectrophotometrically following the Lorenzen method (Strickland & Parsons 1972). The relative size distribu- tion of chl a in the surface water (2.5 m) was measured fluorometrically. Duplicate samples were filtered on 25 mm GF/F, 3 pm Nuclepore and 11 pm and 50 pm Nitex fllters and extracted in 96 % ethanol according to l ~ r b o e & Nielsen (1990). The phytoplankton biomass was converted to carbon from the chl a measurements using a conversion factor of 50 (Parsons et al. 1984).
Primary production. Samples for the determination of primary production were taken in the surface and in the fluorescence peak and transferred to 25 m1 acid- washed Pyrex bottles. The experimental methods used are described in Nielsen & Richardson (1989) with the exception that post-incubation filtration was carried out through 11, 3 and 0.2 pm filters. Light attenuation in the water column was measured using a Q Instru- ment quantameter. In situ primary production at 1 m intervals throughout the water column was estimated according to Richardson & Christoffersen (1991).
Bacteria. The abundance of bacteria was quantified by the acridine orange technique (Hobbie et al. 1977). At least 600 cells were counted on each filter using an Olympus BH-2 epifluorescence microscope. Bacterial volume was calculated from length and width measure- ments of at least 75 cells per station. The biovolumes were converted to carbon using a conversion factor of
0.35 pg C pm-3 (Bjmnsen 1986). Bacterial production was measured using 2 methods: incorporation of 3H- thymidine (Fuhrman & Azam 1980) and "-leucine (Kuchman et al. 1985). Immediately after sampling, trip- licate samples (10 rnl) were incubated with 5 nM methyl 3H-thymidine (20 pCi nmol-l, New England Nuclear) or 10 nM 3H-leucine (153 pCi nmol-l, New England Nu- clear) for 30 min at in situ temperature (+ 1 "C). Blanks were prepared by the addition of formalin prior to the addition of the isotope. The incubations were stopped by the addition of buffered formalin (1 % final concen- tration) and samples were filtered onto 0.2 pm cellulose nitrate filters. The filters were washed 10 times with 5 % ice-cold TCA and counted by liquid scintillation count- ing. The incorporated 3H-thymidine was converted to cell production using a conversion factor of 1.1 X 10¹⁸ cells mol-' thymidine incorporated (Riemann et al. 1987). The incorporated 3H-leucine was converted to carbon according to Simon & Azam (1989). Bacterial substrate consumption was estimated from the produc- tion rate assuming a growth yield of 40 % (Bjsrnsen & Kuparinen 1991).
Nanoflagellates. The abundances of autotrophic and heterotrophic nanoflagellates were determined by epi- fluorescence microscopy on preparations stained with proflavine hemisulfate (Haas 1982). Samples were fixed by the addition of glutaraldehyde (0.5% final concentration). After filtration, the filters were dried, mounted in paraffin oil and stored at 6 "C. Discrimina- tion between autotrophic and heterotrophic flagellates was facilitated using green excitation to reveal pure chlorophyll autofluorescence. The diameters of 50 cells were measured on each preparation and cell volumes were calculated assuming spherical shape. Biovolume was converted to bionlass using a conversion factor of 0.12 pg C pm-3 (Fenchel 1982). The consumption and production of heterotrophic flagellates and microzoo- plankton were estimated assuming a clearance rate of 105 body volumes h- ' (Fenchel 1986) and a growth yield of 40 %.
Ciliates and heterotrophic dinoflagellates. Samples for the determination of biomass were taken at 5 depths at all stations. The samples (300 ml) were fixed in l % Lugol's solution and counted after overnight settlement using a Leitz inverted microscope. Identification of cili- a t e ~ to species or morphological types was based on Leegaard (1915), Kahl(1932) and Lynn et al. (1988). The dinoflagellates were identified according to Dodge (1985). The ratio between autotrophic and heterotrophic dinoflagellates was determined using epifluorescence as described for the nanoflagellates. Biovolumes were estimated from measurements of linear dimensions and assuming simple geometrical shapes. The biovolumes were converted to carbon using conversion factors of 0.071, 0.1 1 and 0.13 for ciliates (Fenchel & Finlay 1983),

Mar. Ecol. Prog. Ser. 95: 115-131, 1993
Station No.
-10 N miles
Fig. 2. Schematic presentation of the water column structure along Transect 1 (Stns 20 to 30, see Fig. 1). Isolines indicate temperature and arrows the prevailing currents and mixing processes. Modified from Bo Pedersen (1993)
athecate and thecate dinoflagellates (Edler 1979) respectively. The consumption and production of ciliates and heterotrophic dinoflagellates was estimated as for the heterotrophic flagellates.
Mesozooplankton. The vertical distribution of meso- zooplankton was investigated using a submersible pump (3000 1 min-') raised through the water column at 10 m min-l. Sampling was carried out in 3 depth strata: below, within and above the pycnocline. The samples were successively filtered through 200, 100 and 30 pm mesh nets and the retained fractions were fixed in buffered formalin (2% final concentration). Back in the laboratory, zooplankters in subsamples were counted and identified. In the case of copepods, at least 500 individuals were staged and sexed in each fraction. Abundance data for copepods were converted to biomass by means of length-weight regressions cited in Kierrboe & Nielsen (1990).
Copepod egg production was determined according to Kiwrboe et al. (1985). Adult females were sampled using a 200 pm WP-2 net. Immediately after collection, fertilized females were added to 600 m1 bottles (1 to 5 females per bottle) containing 180 pm prescreened surface water. The bottles (5 to 8 per species) were incubated in a thermostated room on a rotating wheel (0.5 rpm) at in situ temperature (k2 "C) for 24 h. At the end of the experiment, the spawned eggs were counted. Production of the copepods was calculated from the specific egg production rates assuming equal specific egg production and juvenile growth rates (Berggreen et al. 1988). Ingestion was calculated from the production rate assuming a gross effiency of 33 % (Peterson 1988).
RESULTS
During the study period, southeasterly winds domi- nated (5 to 10 m S-' with peaks of up to 15 to 18 m S-'). A detailed description of the hydrographic conditions during this cruise appears elsewhere (Bo Pedersen 1993). However, a schematic diagram roughly depict- ing the prevailing currents and mixing processes (according to Bo Pedersen 1993) at and in the proxim- ity of the Dogger Bank is shown in Fig. 2.
At the deep stratified stations north of the Dogger Bank, tidal activity results in turbulence restricted to the lower part of the bottom layer. At the shallow northern edge of the Bank, the tidal mixing results in a total vertical mixing of the bottom layer (20 to 45 m). Along the northern slope, tidally mediated bottom tur- bulence results in a mixing of nutrient-rich cold bottom water (7.4 "C) with nutrient-depleted warm surface water (11.5"C). This mixing creates water with a den- sity between that of the surface and bottom waters which intrudes between these layers. This nutrient- enriched intrusion layer is then dispersed over the region north of the Bank (Fig. 2).
Hydrography and nutrient distribution
Isopleths of temperature, sigma-t, fluorescence, nitrate and phosphate along Transects 1 and 2 are shown in Figs. 3 & 4 . The water within the region investigated was almost vertically and horizontally iso- haline. As a result, the sigma-t distribution is mainly controlled by the water temperature. Both north and
Nielsen et al.: Plankton community structure 119
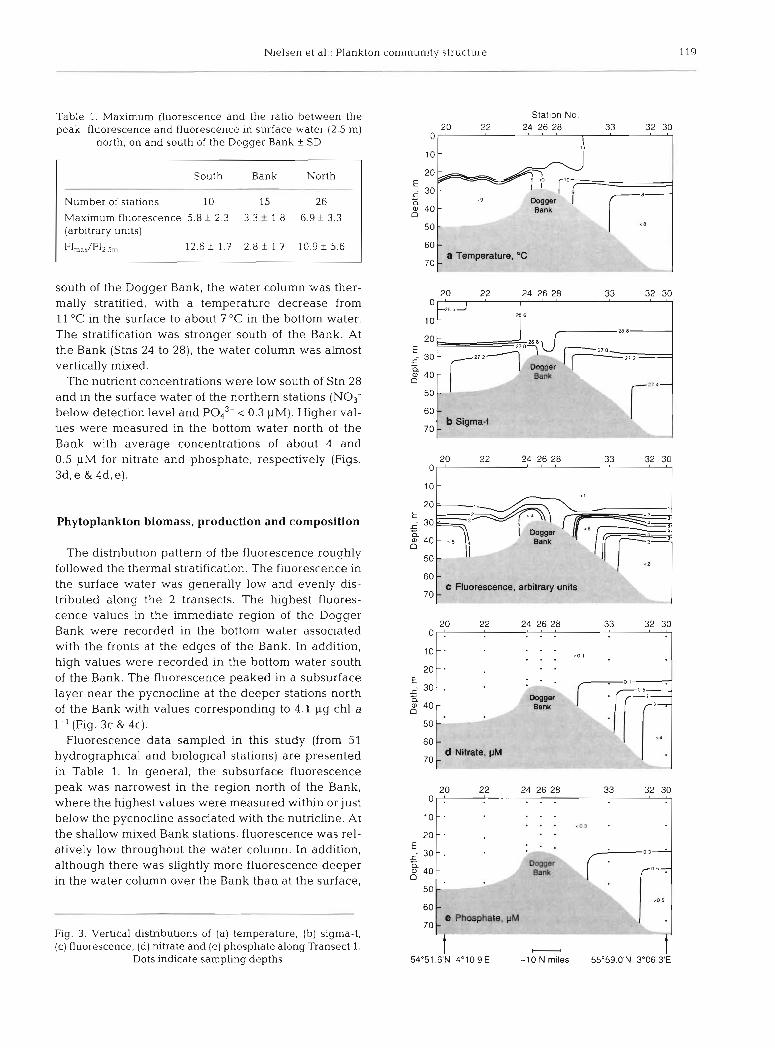
Table 1. Maximum fluorescence and the ratio between the peak fluorescence and fluorescence in surface water (2.5 m)
north, on and south of the Dogger Bank f SD
Statton No. 20 22 24 26 28 33 32 30
01 ' l 1
South Bank North
Number of stations 10 15 26
Maximum fluorescence 5.8 f 2 3 3 3 + 1.8 6.9 f 3.3 (arbitrary units)
Flmax/Fl2 ~ r n 12.6 f 1.7 2.8 f 1.7 10.9 + 5.6
south of the Dogger Bank, the water column was ther- mally stratified, with a temperature decrease from 11 "C in the surface to about 7 "C in the bottom water. The stratification was stronger south of the Bank. At the Bank (Stns 24 to 28), the water column was almost vertically mixed.
The nutrient concentrations were low south of Stn 28 and in the surface water of the northern stations (NO3- below detection level and Pod3- 0.3 PM). Higher val- ues were measured in the bottom water north of the Bank with average concentrations of about 4 and 0.5 pM for nitrate and phosphate, respectively (Figs. 3d, e & 4d, e) .
Phytoplankton biomass, production and composition
The distribution pattern of the fluorescence roughly followed the thermal stratification. The fluorescence in the surface water was generally low and evenly dis- tributed along the 2 transects. The highest fluores- cence values in the immediate region of the Dogger Bank were recorded in the bottom water associated with the fronts at the edges of the Bank. In addition, high values were recorded in the bottom water south of the Bank. The fluorescence peaked in a subsurface layer near the pycnocline at the deeper stations north of the Bank with values corresponding to 4.1 pg chl a 1-' (Fig. 3c & 4c).
Fluorescence data sampled in this study (from 51 hydrographical and biological stations) are presented in Table 1. In general, the subsurface fluorescence peak was narrowest in the region north of the Bank, where the highest values were measured within or just below the pycnocline associated with the nutricline. At the shallow mixed Bank stations, fluorescence was rel- atively low throughout the water column. In addition, although there was slightly more fluorescence deeper in the water column over the Bank than at the surface,
Fig. 3 . Vertical distnbutions of (a) temperature, (b) sigma-t, (c) fluorescence, (d) rutrate and (e) phosphate along Transect 1.
Dots indicate sampling depths
60 1 C Fi~~rescence. arbitrary units - -
l - 54"51.6'N 4'10.9'E
l -10 N miles 55"59.ON 3'06.3'E

Mar. Ecol. Prog. Ser. 95: 115-131, 1993
Station No. 85 86 87 88
70 c Fluorescence,
I I 56"05.5'N 3'06.9'E -10 N miles 56"19.6'N 4"07.6'E
the differences in fluorescence throughout the water column were much smaller here than in the other regions examined. South of the Bank, the highest val- ues of fluorescence were recorded in the bottom water below the pycnocline.
Total water column primary production ranged from approximately 200 to over 700 mg C m-' d-l, with the greatest values being recorded on Transect 2 (Stn 88) and the lowest at the Dogger Bank stations along Tran- sect 1. The distribution of primary production through- out the water column along the transects followed the same general pattern as the distribution of phytoplank- ton biomass (Fig. 5a). High production (> l0 pg C 1-' d-l) was associated with the bottom fronts at the north- ern and southern edges of the Bank. High production was measured throughout the water column at Stn 28 associated with the mixing of nutrient-rich bottom and surface water.
Although biomass distributions indicated the pres- ence of a subsurface phytoplankton peak along Tran- sect 2, the primary production associated with this peak was not as great as that along Transect 1 (Figs. 4c & 6a). On Transect 2, the primary production peaked in the upper 10 to 15 m (>l0 kg C 1-' d-l) of the water col- umn at Stns 84 & 85, while the highest production (>l5 pg C 1-' d-') was measured within the subsurface peak on the westernmost stations along this transect (Fig. 6b).
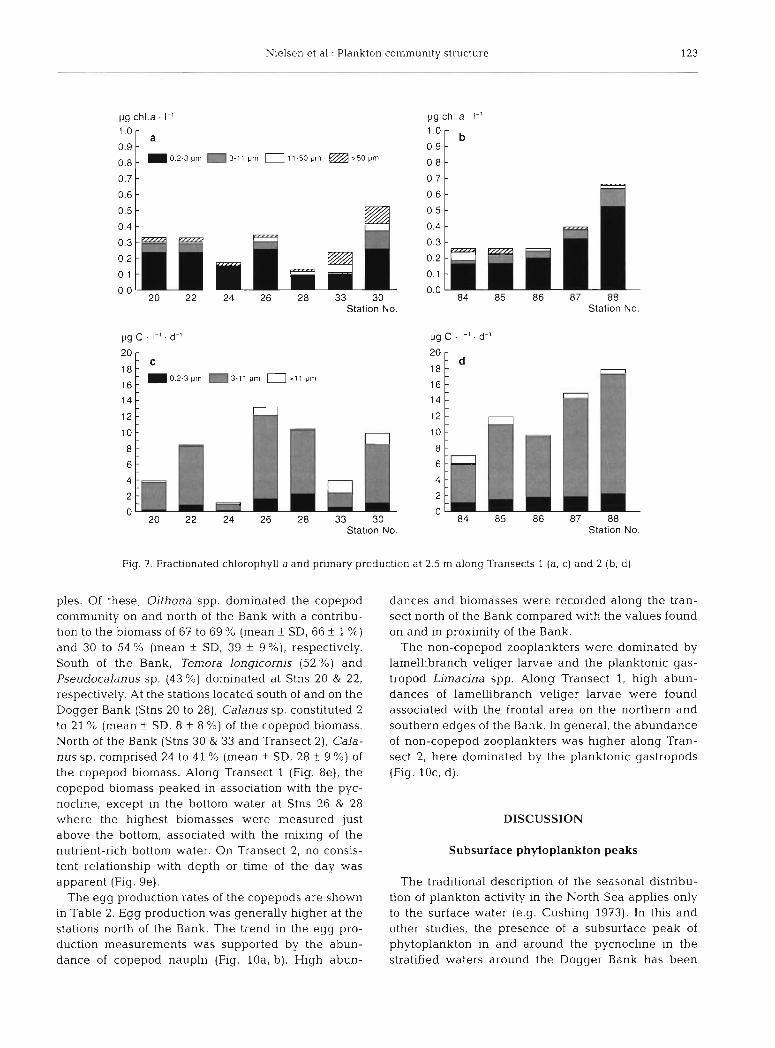
The size-fractionated chl a and primary production showed that the major part of the biomass and produc- tion could be attributed to the < 11 pm phytoplankton fraction (Fig. 7) . The observed patterns in the size-frac- tionated chl a and primary production were supported by the microscopic analysis of the plankton which revealed that the plankton flora was dominated by a mixture of c 10 pm flagellates. The numerically domi- nant groups/species were: chrysophyceae [Apendin- eLla spinefera (10 pm), Emiliana huxleyi (3 to 5 pm), Pseudopedinella elastica, P. pyriformis (5 to 7.5 pm)], Cryptophyceae [Plagioselmis prolonga, Teleaulax ac- uta (3 to 10 km)], Dinophyceae [Heterocapsa minima (6 to 10 pm) and Prorocentrurn balticum (5 to 7 pm)] and Prymnesiophyceae [Chrysochromulina spp. (5 to 10 pm), Imantonia rotundata (2 to 3 pm) and Phaeocys- tis pouchetti ( 5 km)]. Few diatoms [Chaetoceros sp. (5 to 10 pm), Nitzschia sp. and Thalassiosira sp.] were identified.
The vertical distribution of the obligate autotrophic ciliate Mesodinium rubrum along the 2 transects paral- leled the distribution of the fluorescence. Low abun-
Fig. 4. Vertical distributions of (a) temperature. (b) sigma-t, (c) fluorescence, (d) nitrate and (e) phosphate along Tran-
sect 2. Dots indicate sampling depths
Nielsen et al.: Plankton community structure 121
dance of this organism was observed above the pycno- cline and on the Bank (mean f SD, 58 + 48 cells 1-l). High abundances were observed in the bottom waters at Stns 20 and 22 and in association with the intrusion layer north of the Bank (mean f SD, 420 f 147 and 246 f 88 cells 1-' respectively).
Bacterial biomass and production
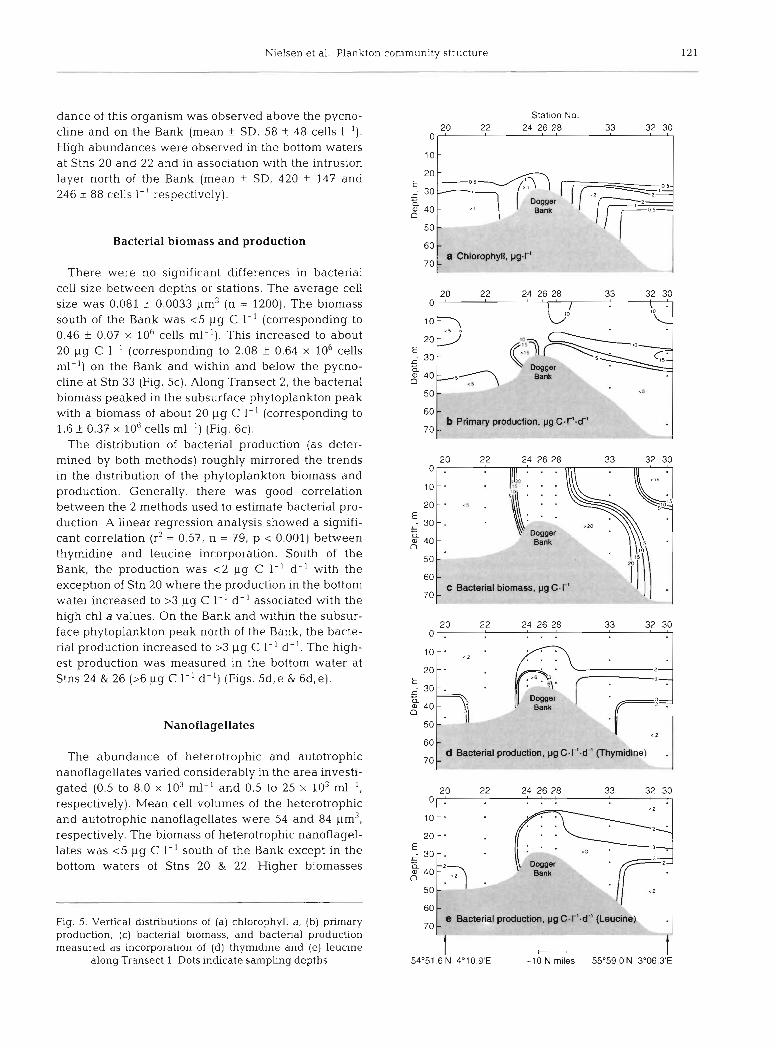
There were no significant differences in bacterial cell size between depths or stations. The average cell size was 0.081 _+ 0.0033 pm3 (n = 1200). The biomass south of the Bank was < 5 pg C 1-' (corresponding to 0.46 + 0.07 X 10⁶ cells ml-l). This increased to about 20 pg C l-' (corresponding to 2.08 f 0.64 X 10⁶ cells ml-l) on the Bank and within and below the pycno- cline at Stn 33 (Fig. 5c). Along Transect 2, the bacterial biomass peaked in the subsurface phytoplankton peak with a biomass of about 20 pg C 1-' (corresponding to 1.6 k 0.37 X 10⁶ cells ml-l) (Fig. 6c).
The distribution of bacterial production (as deter- mined by both methods) roughly mirrored the trends in the distribution of the phytoplankton biomass and production. Generally, there was good correlation between the 2 methods used to estimate bacterial pro- duction. A Linear regression analysis showed a signifi- cant correlation (r2 = 0.57, n = 79, p < 0.001) between thymidine and leucine incorporation. South of the Bank, the production was < 2 pg C 1-' d-' with the exception of Stn 20 where the production in the bottom water increased to >3 pg C 1-' d- ' associated with the high chl a values. On the Bank and within the subsur- face phytoplankton peak north of the Bank, the bacte- rial production increased to >3 pg C 1-' d-l . The high- est production was measured in the bottom water at Stns 24 & 26 (>6 pg C 1-' d-l) (Figs. 5d,e & 6d,e).
Nanoflagellates
The abundance of heterotrophic and autotrophic nanoflagellates varied considerably in the area investi- gated (0.5 to 8.0 X 10³ ml-' and 0.5 to 25 X 103 rnl-l, respectively). Mean cell volumes of the heterotrophic and autotrophic nanoflagellates were 54 and 84 p n 3 , respectively. The biomass of heterotrophic nanoflagel- lates was <5 pg C 1-' south of the Bank except in the bottom waters of Stns 20 & 22. Higher biomasses
Fig. 5. Vertical distributions of (a) chlorophyll a, (b) primary production, (c) bacterial biomass, and bacterial production measured as incorporation of (d) thyrnidine and (e) leucine
along Transect 1. Dots indicate sampling depths
Station No. 24 26 28
10
a Chlorophyll. pg-I-' 70
b Primary production. pg C.1-'.d-' 70
24 26 28 32 30
. . .20 .
Dogger Bank
Bacterial bio~ mass, pg C.
Bank
d Bacterial production, pg C. l-'.d.' (Thymidhe)
I
e Bacterial production, pg C.T'.d" (Leucine) 70 60 l
I - ( 1 54"51.6'N 4°10.9'E
I -1 0 N miles 55"59.0'N 3"06.3'E

122 Mar. Ecol. Prog. Ser. 95: 115-131, 1993
Station No. 84 85 86 87 88
0 '
10
b Pr~mary producti
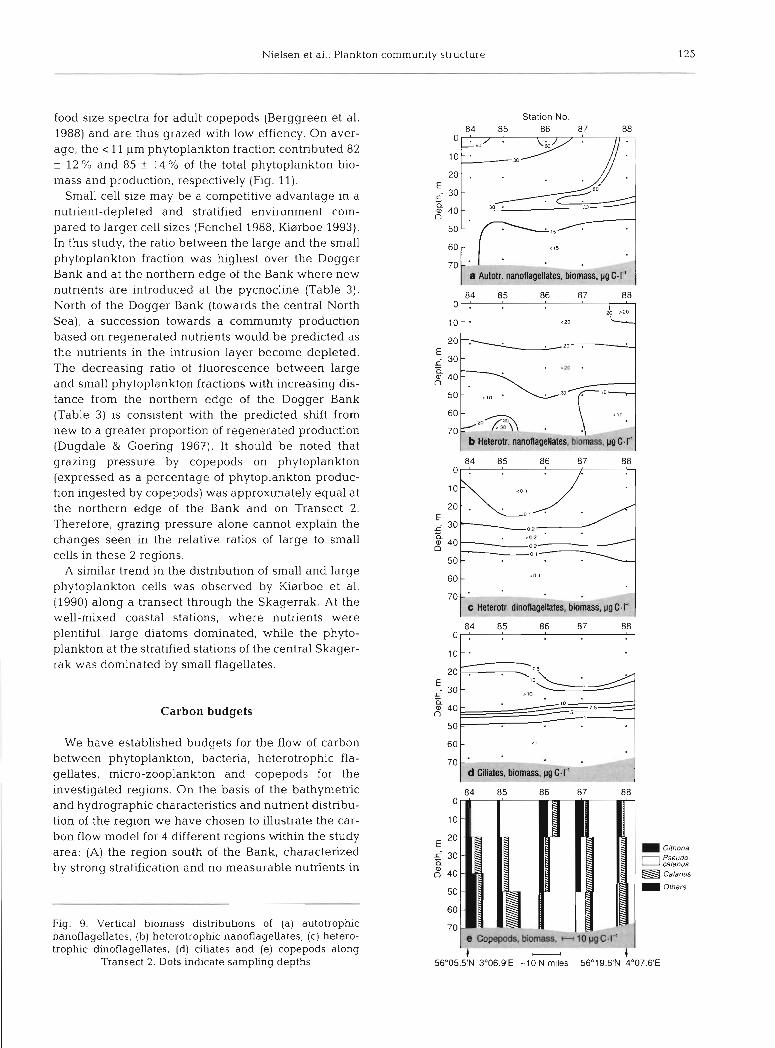
(> 20 pg C 1-l) were found north of the Bank associated with the pycnocline (Figs. 8b & 9b). The distribution pattern of the autotrophic flagellates resembled that of the fluorescence. Low biomasses were recorded south of the Bank; higher biomasses were recorded north of the Bank associated with the subsurface phytoplank- ton peak (Figs. 8a & 9a).
Heterotrophic dinoflagellates and ciliates
Small Gymnodinium spp. (7 to 10 pm) dominated the heterotrophic dinoflagellate biomass. Larger less abundant species such as G, dominans, G. glaucum and G. spirale were also identified in most samples. In the bottom samples, few thecate dinoflagellates were observed. Of those observed, Protoperidinium bipes was most abundant. The abundance of heterotrophic dinoflagellates ranged from 0.4 to 27 X 103 cells 1-l. The vertical distribution of the heterotrophic dinoflagel- lates paralleled the fluorescence distribution, with the highest biomasses being recorded in the bottom water south of the Bank, in the frontal zones on the edges of the Bank and within the subsurface plankton peak north of the Bank (Figs. 8c & 9c).
Ciliates constituted the major part of the microzoo- plankton on all sampling occasions. A total of 20 species or morphotypes were identified. Abundances ranged from 0.5 X 10³ to 5.8 X 10³ cells 1-'. Naked oligotrichs dominated (Lohmaniella oviformis, L. spiralis, Laboea coronata, Strombidium ovale, S, emergens and Tontonia spp.). Tintinnids (dominated by Stenosomella sp. and Tintinnopsis sp.) comprised 0 to 25 % (mean k SD, 2.3 k
4.8 %) of the biomass north of Stn 26. However, a greater contribution by tintinnids was found south of Stn 26 (0 to 62 %) (mean* 1 SD, 18.4 f 18.8 %).
The vertical distribution of the ciliate biomass is shown in Figs. 8d & 9d. High biomasses (>l0 pg C 1 - l )
were measured on the Bank and in association with the subsurface plankton peak north of the Bank. South of the Bank, in the bottom and surface waters of the deeper northern stations, the biomass was consider- ably lower (1 to 5 pg C 1-').
Mesozooplankton
+ - I 56"05.5'N 3O06.9.E -10 N miles 56'19.6'N 4"07.6'E
Copepods dominated the mesozooplankton and a total of 11 species or genera were identified in the sam-
Fig. 6. Vertical distribution of (a) chlorophyll a, (b) primary production, (c) bacterial biomass, and bacterial production measured as incorporation of (d) thymidine and (e) leucine
along Transect 2. Dots indicate sampling depths
Nielsen et al.: Plankton cornmunlty structure 123
vg ch1.a . I-' pg ch1.a I-'
Stat~on No. Station No.
vg C . I-' . d-'
20 r
pg C . I-' . d-'
Stat~on No. Station No
Fig. 7 . Fractionated chlorophyll a and pnmary production at 2.5 m along Transects 1 (a , c) and 2 (b , d )
ples. Of these, Oithona spp. dominated the copepod community on and north of the Bank with a contribu- tion to the biomass of 67 to 69 % (mean + SD, 66 f 1 %)
and 30 to 54 % (mean + SD, 39 f g%) , respectively. South of the Bank, Temora longicornis (52 %) and Pseudocalanus sp. (43 %) dominated at Stns 20 & 22, respectively. At the stations located south of and on the Dogger Bank (Stns 20 to 28), Calanus sp. constituted 2 to 21 % (mean f SD, 8 k 8 %) of the copepod biomass. North of the Bank (Stns 30 & 33 and Transect 2), Cala- nus sp. comprised 24 to 41 % (mean + SD, 28 + 9 %) of the copepod biomass. Along Transect 1 (Fig. 8e), the copepod biomass peaked in association with the pyc- nocline, except in the bottom water at Stns 26 & 28 where the highest biomasses were measured just above the bottom, associated with the mixing of the nutrient-rich bottom water. On Transect 2, no consis- tent relationship with depth or time of the day was apparent (Fig. 9e).
The egg production rates of the copepods are shown in Table 2. Egg production was generally higher at the stations north of the Bank. The trend in the egg pro- duction measurements was supported by the abun- dance of copepod nauplii (Fig. IOa, b) . High abun-
dances and biomasses were recorded along the tran- sect north of the Bank compared with the values found on and in proximity of the Bank.
The non-copepod zooplankters were dominated by lamellibranch veliger larvae and the planktonic gas- tropod Limacina spp. Along Transect 1, high abun- dances of lamellibranch veliger larvae were found associated with the frontal area on the northern and southern edges of the Bank. In general, the abundance of non-copepod zooplankters was higher along Tran- sect 2, here dominated by the planktonic gastropods (Fig. 10c, d).
DISCUSSION
Subsurface phytoplankton peaks
The traditional description of the seasonal distribu- tion of plankton activity in the North Sea applies only to the surface water (e.g. Cushing 1973). In this and other studies, the presence of a subsurface peak of phytoplankton in and around the pycnocline in the stratified waters around the Dogger Bank has been

124 Mar. Ecol. Prog. Ser. 95: 115-131, 1993
Station No. 20 22 24 26 28 33 32 30
0 :
'0 - <," .
54"51 6'N 4"10.9'E -10 N miles 55"59 0'N 3"06.3'E
identified (e.g. Riegman et al. 1990). The geographic and temporal boundaries and the impact on the distri- bution and production of the zooplankton of these subsurface phytoplankton peaks are, as yet, not well described. Thus, it is not possible to quantify the importance of these subsurface phytoplankton popula- tions to the total production of the North Sea.
However, the presence of active subsurface phyto- plankton populations and their potentially significant contribution to the total production have recently been realised for a number of seas bordering the North Sea. The presence of an active subsurface phytoplankton layer has been demonstrated by Richardson (1985), Kierrboe et al. (1990) and Bjnrnsen et al. (1993) in the Skaggerak and by Nielsen et al. (1990) and Kaas et al. (1991) in the Kattegat.
In a study of the seasonal distribution and production of phytoplankton in the southern Kattegat, Richardson & Christoffersen (1991) documented the quantitative importance of subsurface blooms over an annual cycle. In that study, it was estimated that subsurface phyto- plankton populations accounted for approximately 30 % of the annual primary production compared with a contribution of approximately 19 % from the spring bloom.
At all the CTD stations investigated during this study, fluorescence maxima at depths greater than 15 m were observed (Table 1). At many stations, this maximum was recorded at depths of between 30 and 40 m. Light penetration to 30 m was 1.5 to 5.0 % of sur- face values and primary production determinations made on samples taken from these depths show that these subsurface peaks were comprised of actively photosynthesizing phytoplankton. Primary production estimates for the entire water column suggest that pho- tosynthesis in subsurface peaks could account for up to 70 % of total water column production at this time.
Size distribution of the phytoplankton and structure of the food web
Most investigations of North Sea plankton dynamics focus on the link between the phytoplankton and the larger copepods. During this study, small phytoplank- ton (< 11 pm) dominated the phytoplankton biomass. Microscopic examination showed that 5 to 7 pm auto- trophic flagellate species dominated the phytoplank- ton. Particles of this size approach the lower limit of the
Fig. 8. Vertical biornass distributions of (a) autotrophic nanoflagellates, (b) heterotrophic nanoflagellates, (c) het- erotrophic dinoflagellates, (d) ciliates and (e) copepod bio-
mass along Transect 1. Dots indicate sampling depths
Nielsen et al.: Plankton community structure 125
food size spectra for adult copepods (Berggreen et al. 1988) and are thus grazed with low effiency. On aver- age, the < 11 pm phytoplankton fraction contributed 82 f 12 % and 85 f 14 % of the total phytoplankton bio- mass and production, respectively (Fig. 11).
Small cell size may be a competitive advantage in a nutrient-depleted and stratified environment com- pared to larger cell sizes (Fenchel 1988, Kiarboe 1993). In this study, the ratio between the large and the small phytoplankton fraction was highest over the Dogger Bank and at the northern edge of the Bank where new nutrients are introduced at the pycnocline (Table 3). North of the Dogger Bank (towards the central North Sea), a succession towards a conlmunity production based on regenerated nutrients would be predicted as the nutrients in the intrusion layer become depleted. The decreasing ratio of fluorescence between large and small phytoplankton fractions with increasing dis- tance from the northern edge of the Dogger Bank (Table 3) is consistent with the predicted shift from new to a greater proportion of regenerated production (Dugdale & Goering 1967). It should be noted that grazing pressure by copepods on phytoplankton (expressed as a percentage of phytoplankton produc- tion ingested by copepods) was approximately equal at the northern edge of the Bank and on Transect 2. Therefore, grazing pressure alone cannot explain the changes seen in the relative ratios of large to small cells in these 2 regions.
A similar trend in the distribution of small and large phytoplankton cells was observed by Ki~rboe et al. (1990) along a transect through the Skagerrak. At the well-mixed coastal stations, where nutrients were plentiful, large diatoms dominated, while the phyto- plankton at the stratified stations of the central Skager- rak was dominated by small flagellates.
Carbon budgets
We have established budgets for the flow of carbon
l between phytoplankton, bacteria, heterotrophic fla- gellates, micro-zooplankton and copepods for the investigated regions. On the basis of the bathymetric and hydrographic characteristics and nutrient distribu- tion of the region we have chosen to illustrate the car- bon flow model for 4 different regions within the study area: (A) the region south of the Bank, characterized by strong stratification and no measurable nutrients in
Fig. 9. Vertical biomass distributions of (a) autotrophic nanoflagellates, (b) heterotrophic nanoflagellates, (c) hetero- trophic dinoflagellates, (d) ciliates and (e) copepods along
Transect 2. Dots indicate sampling depths
Station No. 84 85 86 87 88
I a Autotr. nanoflagellates, biomass, pg C.1.' I
70 b Heterotr. nanoflagellates, biom&s, pg C.1'
< O I
c Heterotr. dinoflagellates,
0
10
E 20 0,lhona 5- 30 a
Pseudo- , I Ca1enus
d 40 m Calanus
50 Orhers
60
70
I m I 56"05.5'N 3"06.9'E -10 N miles 56'19.6'N 4"07.6'E

Mar. Ecol. Prog Ser. 95: 115-131, 1993
Table 2. Egg production (egg female-' d-', mean f SD) of the dominating copepods along the 2 transects. No. of experiments in parenthesis; 'no measurements
Transect 1 Station
Species 20 22 24 26 28 33 30
Calanus finmarchcus 8.6 + 9.5 8.9 k 1.7 9.8 9.4 + 2.0 18 f 4.2 20.8 f 10.2 (4) (4) (1) (6) (4) (5)
Centropages hamatus 13.8 f 0 25.0 + 7.1 (2) (2)
Centropages typicus 19.6 + 1.4 (2)
Paraca lan~~s parvus 2 .82 1.2 4 .0 f 1.9 7 . 9 f 2 . 1 5 . 0 f 1.1 (4) (4) (4) (4 )
Temora longicornis 1 .O 6.0 + 2.1 7.3 + 2.6 (1) (3) (4)
Transect 2 Station
Species 84 85 86 87 88
Calanus finmarchicus 24.1 f 9.8 12.7 f 0.6 10.6 f 12.3 9.1 + 3.6 23.3 t 13 (5) (7) (6) (7) (6)
Paracalanus parvus 2.4 f 1.7 1.8 f 0.5 2.6f 1.3 0.6 f 0.3 2.4 f 1.7 (5) (5) (5 ) (5) (51
Temora longicomis 4.6 + 1.6 9.3 f 9.4 4 -t 2 3 . 9 1.5 (2) (4 (2) (2)
Acartia sp. 2.0 & 0 (21
the bottom water (Stns 20 & 22); (B) the Dogger Bank, we belive that the exercise is useful as a starting-point characterized by a shallow and mixed water column in an examination of the potential for heterogeneity in (Stns 24 to 28); (C) the northern edge of the Bank char- patterns of carbon flow in the North Sea. acterized by the upwelling of nutrient rich bottom The carbon budget seems to balance well between water (Stns 30 & 33); and (D) the deep stratified sta- bacterioplankton and heterotrophic nanoflagellates in tions some distance from the Bank, i.e. Transect 2 (Stns all areas, except on the northern edge of the Bank (Fig. 84 to 88) (Fig. 11). l l c ) , where bacterial production alone appears to be
We recognize that the established carbon budgets insufficient to satisfy the calculated carbon demand of represent 'snapshots' of highly dynamic plankton com- the nanoflagellates. Bacterio- and picoplankton pro- munities which are composed of rapidly fluctuating duction together would, however, be able to provide populations of microorganisms and more stable popu- the major part of the heterotrophic nanoflagellate car- lations of mesozooplankton, and that the few data in bon demand. Heterotrophic nanoflagellate production each region are insufficient to test the significance of alone could supply only 12 to 43 % of the carbon the differences observed between regions. However, demand of the microzooplankton in the study area.
However, if the phytoplankton of < 11 pm
Table 3. Fraction of phytoplankton biomass and production due to cells 'Onsidered together with the heter'- > l 1 pm expressed as a percentage of the total phytoplankton biomass trophic nanoflagellate production, the
and production carbon budget seems to balance. The bacterial abundances and produc-
tion found during this investigation are slightly higher than the ranges measured by Van Duyl et al. (1990) in the Dogger Bank area. However, the bacterial abun- dances found during our investigation fall within the range for the North Sea pre- sented in a review by Billen et al. (1990).
Region 1 2 3 4
(Stns 20, 22) (Stns 24-28) (Stns 30, 33) (Stns 84-88)
Biomass 11 16 38 11
Primary production
6 5 20 6

Nielsen et al.. Plankton community structure 127
Number. I-' pg C . I - ' Number. I-'
Oflhona m Paracalanus m Pseudocalanus
20 m Calenus lemora Olhers
Station No. Station No.
Number I-' Number - I-'
C
Gastropods Lamellibranch larvae
. m Polychaete larvae Echinoderm larvae
Harpacticoids E] Append~cularia
0 Others
Station No. Stat~on No
Fig. 10. Average abundances (bars indicating number I - ' ) and biomasses (solid line showing pg C I - ' ) of (a, b) copepod nauplu and (c, d) other zooplankters through the water column along the 2 transects
Our measurements of the abundance of auto- and increased and peaked on the Bank where the bacterial heterotrophic nanoflagellates are also higher than the biomass was higher than the phytoplankton biomass measurements and values cited in Van Duyl et al. and the bacterial production comprised 55 to 78% of (1990). However comparable heterotrophic flagellate the primary production. During their Febuary-March abundances have been found in the central North Sea cruise in 1988, Nielsen & Richardson (1989) observed in May-June (Nielsen & Richardson 1989). the opposite trend. North and east of the Dogger Bank
To our knowledge, no other data on the abundance (i.e. in pre-spring bloom and post-bloom situations), of ciliates and heterotrophic dinoflagellates are avail- high ratios between bacterial biomass and production able for the North Sea. The abundance of ciliates is and phytoplankton biomass and production were within the range reported from other marine areas recorded while the lowest ratio was observed on the (Pierce & Turner 1992). The abundance of hetero- Dogger Bank where the spring bloom was initiated. trophic dinoflagellates is comparable to the range given by (lgg1) from Table 4 . Bacterial biornass (BB) and production (measured as 3H-thyrmdine the North Atlantic. (BP,) and 3H-leucine (BP,) mcorporation) expressed as a percentage of
The high biomasses of bacteria and phytoplankton biomass (PB) and production (PP) in the 4 regions described
protozooplankton observed suggest a in Fig. 11
potential importance of the microbial loop I I in the carbon dynamics in the North s e a I Region I during this investigation (Fig. 11). The ratios between bacterial biomass and pro-
1 2 3 4 (Stns 20, 22) (Stns 24-28) (Stns 30, 33) (Stns 84-88)
duction and phytoplankton biomass and production are shown in Table 4. The low- est ratios were found north and south of
BB 1 0 0 / p ~ 24 142 4 0 66 BP, X 100/PP 26 78 62 4 8 gp, 100/pp 13 55 43 33
the Dogger Bank while the ratios

Nielsen et al.: Plankton community structure 129
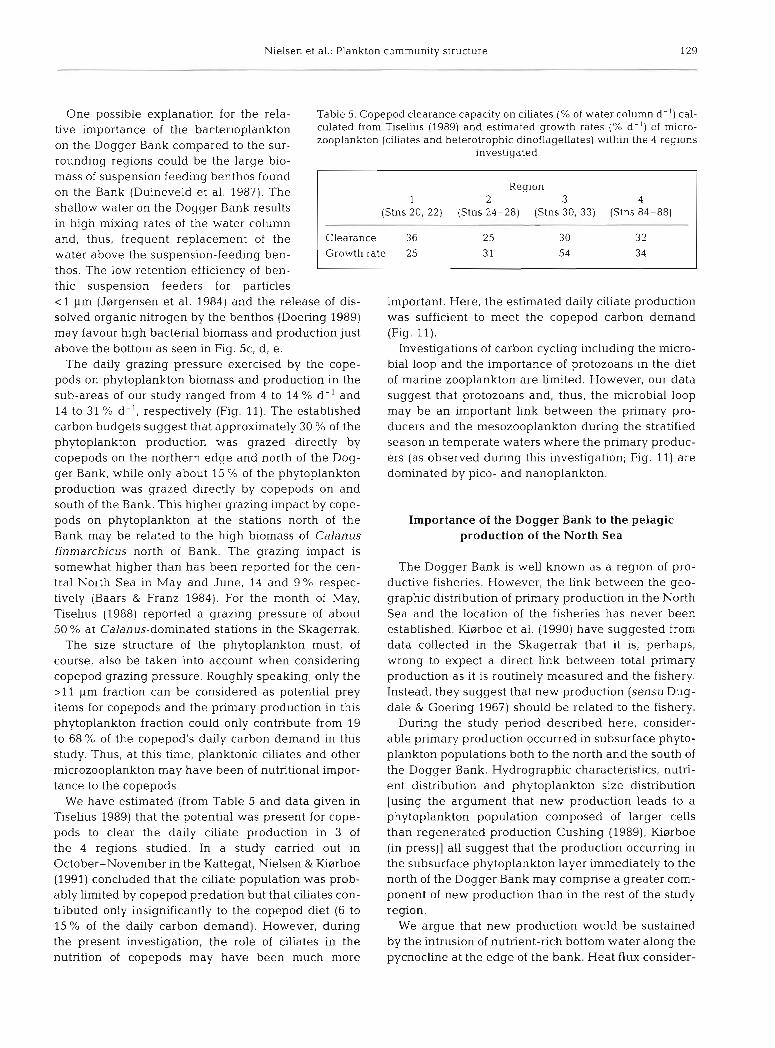
One possible explanation for the rela- Table 5. Copepod clearance capacity on ciliates (% of water column d- ' ) cal- tive importance of the bacterioplankton culated from Tiselius (1989) and estimated growth rates (% d- ' ) of micro-
on the Dagger Bank to the sur- zooplankton (ciliates and heterotrophic dinoflagellates) within the 4 regions investigated
rounding regions could be the large bio- mass of suspension feeding benthos found on the Bank (Duineveld et al. 1987). The shallow water on the Dogger Bank results in high mixing rates of the water column and, thus, frequent replacement of the water above the suspension-feeding ben-
Region 1 2 3 4
(Stns 20, 22) (Stns 24-28) (Stns 30, 33) (Stns 84-88)
Clearance 36 25 30 32 Growth rate 25 3 1 54 34
thos. The low retention efficiency of ben- thic suspension feeders for particles < 1 pm (Jsrgensen et al. 1984) and the release of dis- important. Here, the estimated daily ciliate production solved organic nitrogen by the benthos (Doering 1989) was sufficient to meet the copepod carbon demand may favour high bacterial biomass and production just (Fig. 11). above the bottom as seen in Fig. 5c, d, e . Investigations of carbon cycling including the micro-
The daily grazing pressure exercised by the cope- bial loop and the importance of protozoans in the diet pods on phytoplankton biomass and production in the of marine zooplankton are limited. However, our data sub-areas of our study ranged from 4 to 14 % d-' and suggest that protozoans and, thus, the microbial loop 14 to 31 % d- l , respectively (Fig. 11). The established may be an important link between the primary pro- carbon budgets suggest that approximately 30 % of the ducers and the mesozooplankton during the stratified phytoplankton production was grazed directly by season in temperate waters where the primary produc- copepods on the northern edge and north of the Dog- ers (as observed during this investigation; Fig. 11) are ger Bank, while only about 15 % of the phytoplankton dominated by pico- and nanoplankton. production was grazed directly by copepods on and south of the Bank. This higher grazing impact by cope- pods on phytoplankton at the stations north of the Importance of the Dogger Bank to the pelagic Bank may be related to the high biomass of Calanus production of the North Sea finmarchicus north of Bank. The grazing impact is somewhat higher than has been reported for the cen- The Dogger Bank is well known as a region of pro- tral North Sea in May and June, 14 and 9 % respec- ductive fisheries. However, the link between the geo- tively (Baars & Franz 1984). For the month of May, graphic distribution of primary production in the North Tiselius (1988) reported a grazing pressure of about Sea and the location of the fisheries has never been 50 % at Calanus-dominated stations in the Skagerrak. established. Kisrboe et al. (1990) have suggested from
The size structure of the phytoplankton must, of data collected in the Skagerrak that it is, perhaps, course, also be taken into account when considering wrong to expect a direct link between total primary copepod grazing pressure. Roughly speaking, only the production as it is routinely measured and the fishery. > l 1 pm fraction can be considered as potential prey Instead, they suggest that new production (sensu Dug- items for copepods and the primary production in this dale & Goering 1967) should be related to the fishery. phytoplankton fraction could only contribute from 19 During the study period described here, consider- to 68 % of the copepod's daily carbon demand in this able primary production occurred in subsurface phyto- study. Thus, at this time, planktonic ciliates and other plankton populations both to the north and the south of microzooplankton may have been of nutritional impor- the Dogger Bank. Hydrographic characteristics, nutri- tance to the copepods. ent distribution and phytoplankton size distribution
We have estimated (from Table 5 and data given in [using the argument that new production leads to a Tiselius 1989) that the potential was present for cope- phytoplankton population composed of larger cells pods to clear the daily ciliate production in 3 of than regenerated production Cushing (1989), Kisrboe the 4 regions studied. In a study carried out in (in press)] all suggest that the production occurring in October-November in the Kattegat, Nielsen & Kisrboe the subsurface phytoplankton layer immediately to the (1991) concluded that the ciliate population was prob- north of the Dogger Bank may comprise a greater com- ably limited by copepod predation but that ciliates con- ponent of new production than in the rest of the study tributed only insigruficantly to the copepod diet (6 to region. 15% of the daily carbon demand). However, during We argue that new production would be sustained the present investigation, the role of ciliates in the by the intrusion of nutrient-rich bottom water along the nutrition of copepods may have been much more pycnocline at the edge of the bank. Heat flux consider-

130 Mar. Ecol. Prog. Ser. 95: 115-131, 1993
ations (Becker 1981) suggest that thermal stratification of the North Sea to the north of the Dogger Bank can be expected from approximately May to September. Thus, assuming that there is always nutrient-rich bot- tom water to the north of the Dogger Bank and that our hypothesis concerning the occurrence of new produc- tion in the intrusion layer north of Dogger Bank is cor- rect, the potential would seem to exist for new produc- tion to occur associated with the Bank edge throughout the summer months.
Richardson et al. (unpubl. data) have shown that pri- mary production during the winter in the Dogger Bank region is higher (November to March) than for all other regions of the North Sea. Nielsen & Richardson (1989) have demonstrated that the spring bloom was already underway over the Dogger Bank in February 1988. The FLEX experiment carried out in 1976 suggested that the spring bloom does not begin in the deeper northern North Sea (Fladen Ground) until mid-April (Williams & Lindley 1980). Nielsen & Richardson also demonstrated that the importance of the microbial loop was minimal in the region of the Dogger Bank during the spring bloom. This and the carbon budget consid- erations they presented suggest that the primary pro- duction occurring there during the winter can be con- sidered as having a large component of 'new' production.
We suggest that the potential for the occurrence of a food chain based largely on 'new' production may be present during most, if not all, of the year in the region of the Dogger Bank. As it is 'new' production (sensu Dugdale & Goering 1967) which sustains the short, classical food chain necessary to support a large fish- ery (e.g. Ryther 1969, Cushing 1989), we believe that this potential for 'new' production in the region of the Dogger Bank may explain this region's importance to the fishery.
Acknowledgements. We thank Alice Christoffersen and Jack Melbye for technical assistance, Naja Vsrs for identification of the flagellates, Thomas Kierboe, Mike St. John, Peter Munk and 2 anonymous reviewers for critically reading the manu- script and the crew of RV 'Dana' for help with sampling.
LITERATURE CITED
Andrews, LV R. H., Hutchings, L. (1980). Upwelling in the southern Benguela Current. Prog. Oceanogr. 9: 1-81
Baars, M. A., Frantz, H. G. (1984). Grazing pressure of cope- pods on the phytoplankton stock of the central North Sea. Neth. J . Sea. Res. 18: 120-142
Becker. G. A. (1981). Beitrage zur Hydrographie und Warme- bilanz der Nordsee. Dt. hydro. 2. 5(34): 1-262
Berggreen, U., Hansen, B., Kierboe, T (1988). Food size spec- tra, ingestion and growth of the copepod Acartia tonsa implications for determination of copepod production. Mar. Biol. 99: 341-352
Billen, G., Joris, C., Meyer-Reil, L., Lindenbloom, H. (1990). Role of bacteria in the North sea ecosystem. Neth. J . Sea Res. 26(2-4): 265-293
Bjornsen, P. K. (1986). Automatized determination of bacterio- plankton biomass by image analysis. Appl. environ. Microbiol. 51. 1199-1204
Bjsrnsen, P. K., Kaas. H., Kaas, H., Nielsen, T. G., Olesen. M., Richardson, K. (1993). Dynamics of a subsurface phyto- plankton maximum in the Skagerrak. Mar. Ecol. Prog Ser (in press)
Bj@rnsen, P. K., Kuparinen, J . (1991). Growth and herblvory by heterotrophic dinoflagellates in the Southern Ocean, studies by microcosm experiments. Mar. Biol. 109: 397-405
Bo Pedersen. F. (1993). The oceanographic and biological tidal cycle in shallow sea fronts in the North Sea and in the English Channel. Estuar. coast. Shelf Sci. (in press)
Cushing, D. H. (1973). Productiv~ty of the North Sea. In Gold- berg, E. D. (ed) North Sea Science. MIT Press, Cambridge, MA, p. 249-267
Cushing, D. H. (1989). A Uference in structure between ecosystems in strongly stratified waters and in those that are only weakly stratified. J . Plankton Res. 1 l (1) 1-13
Dodge, J . D. (1985). Marine dinoflagellates of the British Isles. Her Majesty's Stationery Office, London
Doering, P. H. (1989). On the contribution of the benthos to pelagic production. J. mar. Res. 47: 371-383
Dugdale, R. C. Goering, J. J (1967). Uptake of new and regen- erated forms of nitrogen in primary productivity. Lirnnol. Oceanogr 12: 196-206
Duineveld, G C. A., Kiinitzer, A., Heyman, R P. (1987). Amphiura fhformis (Ophiuroidae: Echnodermata) in the North Sea. Distribution, present and former abun- dance and size composition. Neth. J. Sea Res. 21(4): 317-329
Edler, L. (1979). Recommendations for marine biological stud- ies in the Baltic Sea. The Baltic Marine Biologist Publica- tions No. 5: 1-38
Fenchel, T. (1982). Ecology of heterotrophic microflagellates. IV. Quantitative occurrence and importance as bacterial consumers. Mar. Ecol. Prog. Ser. 9: 35-42
Fenchel, T. (1986). Protozoan filter feeding. Prog. Protistol. 1:63-113
Fenchel, T. (1988). Marine plankton food chains A. Rev. ecol. Syst. 19: 19-38
Fenchel, T., Finlay, B. (1983). Respiration rates in hetero- trophic free-living protozoa. Microb. Ecol. 9: 99-122
Fuhrmann, J., Azam, F. (1980). Bacterioplankton secondary production estimates for coastal waters of British Colom- bia, Antarctica and California. Appl. environ Microbiol. 39(6): 1085-1095
Grasshoff, K. (1976). Methods of seawater analysis. Wein- heim, New York
Haas, L. W. (1982). Improved eplfluorescence microcopy for observing planktonic micro-organisms. Annls Inst. oceanogr.. Paris 58 (suppl.): 261-266
Hay, S. J . , Kierboe, T., Matthews, A. (1991). Zooplankton bio- mass and production in the North Sea during the Autumn Circulation Experiment, October 1987-March 1988. Cont. Shelf. Res. ll(12): 1453-1476
Hobbie, J . E., Daley, R. J., Jaspers, S (1977). Use of nuclepore filters for counting bacteria by epifluorescence. Appl. environ. Microbiol. 33: 1225-1228
Holligan, P. M., Harris, R. P., Newell, R . C. , Harbour, D. S., Head, R . N., Linley, E . A. S., Lucas, M. I . , Tranter, P. R. G., Weekley. C. M. (1984). Vertlcal distribution and partition- ing of organic carbon in mixed, frontal and strahfied

Nlelsen et al.. Plankton community structure 131
waters of the Enghsh Channel. Mar. Ecol. Prog. Ser. 14: 111-127
Hundahl, H., Holck, J . (1980) A new in situ fluorometer for detection of Rodamine B and chlorophyll. Report No. 42. Inst. of Physical Oceanography, Univ. of Copenhagen, p. 145-154
Jsrgensen, C. B.. Kisrboe, T., Mahlenberg, F., Riisgdrd, H. U. (1984). Ciliary and mucus-net filter feeding, with special reference to fluid mechanical characteristics. Mar. Ecol. Prog. Ser. 15: 283-292
Kaas. H., Larsen, J., Mahlenberg. F., Richardson, K. (1991). The Chrysochromulina polylepis bloom in the Kattegat (Scandinavia) May-June 1988. Distribution, primary pro- duction and nutnent dynamics in the late stage of the bloom. Mar. Ecol Prog. Ser. 79: 151-161
Kahl, A. (1932). Urtiere oder protozoa. 1. Wimpertiere oder Cihata (Infusoria) 3. Spirotricha. In: Dahl, F. (ed.) Die Tier- welt Deutschlands und der angrenzenden Meeresteile. Gustav Fishers Verlag, Jena
Qarboe, T. (1993). Turbulence, phytoplankton cell size, and the structure of pelagic food webs. Adv. mar. Biol 29: in press
Qerboe, T., Johansen, K. (1986). Studies of a larval herring (Clupea herrengus L.) patch in the Buchan area. IV. Zoo- plankton distribution and productivity in relation to hydrodynamic features. Dana 6: 37-51
Gorboe. T.. Kaas. H., Kruse, B., Mahlenberg, F., Tiselius, P., Ertebjerg, G. (1990). The structure of the pelagic food web in relation to water column structure in the Skager- rak. Mar. Ecol. Prog. Ser. 59: 19-32
Kisrboe, T., Mehlenberg, F., Riisgaard, H. U. (1985). In situ feeding rates of planktonic copepods: a comparison of four methods. J. exp. mar. Biol. Ecol. 88: 67-81
Kiarboe, T., Munk, P., bchardson, K., Christensen, V., Paulsen, H. (1988). Plankton dynamics and herring larval growth, dnft and survival in a frontal area. Mar. Ecol. Prog Ser. 44: 205-219
h s r b o e , T., Nielsen, T. G. (1990). Effect of wind stress on ver- tical water column structure, phytoplankton growth, and productivity of planktonic copepods. In: Barnes, M.,Gib- son, R N. (eds.) Trophic Interactions in the marine envi- ronment. Proc. 24th Europ. Mar. Biol. Symp. Aberdeen Univ. Press, Aberdeen, p 28-40
Kirchman, D., K'Nees, E., Hodson, R. (1985). Leucine incorpo- ration and its potential as a measure of protein synthesis by bacteria in natural aquatic systems. Appl. environ. Microbial. 49(3) : 599-607
Leegaard. C. (1915). Untersuchungen iiber einige Plankton- ciliaten des Meeres. Nyt. Mag. Naturvid. 53: 1-37
Lessard. E. J. (1991). The trophic roles of heterotrophic dinoflagellates in diverse marine environments. Mar. Microb. Food Webs 5(1): 1-10
Lynn, D. J.. Montagnes, D. J. S., Small, E. B. (1988). Taxo- nomic description of some conspicuous species in the fam- ily Strombldiidae (Ciliophora: Oligotrichida) from the Isles of Shoals, Gulf of Maine. J . mar. biol. Ass. U . K. 62(2): 252-259
Nielsen, T. G., IOsrboe, T (1991). Effect of a storm event on the structure of the pelagic food web with special empha- sis on planktonic cillates. J . Plankton Res. 13(1): 35-51
Nielsen, T. G. , IOsrboe, T., Bjornsen, P. K. (1990). Effects of a Chrysochromulina polylepis subsurface bloom on the planktonic community. Mar. Ecol. Prog. Ser. 62: 21-35
Nielsen, T. G.. hchardson, K. (1989). Food chain structure of the North Sea plankton communities: seasonal variations
This amcle waspresented by ?: Kisrboe, Charlottenlund, Denmark
in the structure of the microbial loop. Mar. Ecol. Prog. Ser. 56- 75-87
Parsons, T R. , Takahasi, M., Hargrave, B. (1984). Biological oceanographic processes. Pergamon Press, New York
Peterson, W. T (1988). Rates of egg production by the cope- pod Calanus marshallae in the laboratory and in the sea off Oregon. Mar. Ecol. Prog. Ser. 47: 229-237
Peterson. W. T., Arcos, D. F., McManus, G. B., Dam, H. G.. Johnson. T., Tiselius. P. (1988). The nearshore zone during coastal upwelling: daily variability and coupling between primary and secondary production off Chile. Prog. Oceanogr. 20: 3-40
Pierce, R. W., Turner, J. T. (1992). Ecology of planktonic cili- a t e ~ in marine food webs. Rev. aquat. Sci. 6(2): 139-181
Plngree, R. D., Griffiths. D. K. (1978). Tidal fronts on the shelf seas around the British Isles. J , geophys. Sci. 83. 4615-4622
Pingree, R. D., Holligan, P. M, , MardseU, G. T. (1978). The effects of vertical stability on phytoplankton distribution in the summer on the northwest European shelf. Deep Sea Res. 25: 1011-1028
hchardson, K. (1985) Plankton distribution and activity in the North Sea/Skagerrak frontal area in Apnl 1984. Mar. Ecol. Prog. Ser. 26: 233-244
hchardson. K., Christoffersen, A. (1991) Seasonal distribution and production of phytoplankton in the southern Kattegat. Mar. Ecol. Prog. Ser. 78: 217-227
Richardson, K., Heath, M. R., Pihl, N. J . (1986). Studies of a larval herring (Clupea harrengus L.) patch in the Buchan area. I. The distribution of larvae in relation to hydro- graphic features. Dana 6: 1-10
Richardson. K.. Lavin-Peregrina, M. F.. Mitchelson, E. G.. Simpson, J . H. (1985). Seasonal distribution of chlorophyll a in relation to physical structure in the western Irish Sea. Oceanol. Acta 8: 77-86
Riegman, R. , Malschaert, H.. Colijn, F. (1990). Primary pro- duction of phytoplankton at a frontal zone located at the northern slope of the Dogger Bank (North Sea). Mar. Biol. 105: 329-336
Riemann, B., Bjmnsen, P. K. , Newell, S., Fallon, R. (1987). Cal- culation of cell production of coastal marine bacteria based on measured incorporation of (3H) thymidine. Llm- nol. Oceanogr. 32(2): 431-476
Ryther, J . H. (1969) Photosynthesis and fish production in the sea. Sclence 166: 72-76
Simon. M-. Azam. F. (1989). Protein content and protein syn- thesis rates of planktonic marine bacteria. Mar. Ecol. Prog. Ser. 51: 201-213
Steele. J . H. (1974). The structure of marine ecosystems. Har- vard University Press. Cambridge
Strickland, J. D., Parsons, T. R. (1972). A practical handbook of seawater analysis. Bull. Fish. Bd Can. 167
Tiselius. P (1988). Effects of diurnal feeding rhythms, species composition and vertical migration on the grazing impact of calanoid copepods in the Skagerrak and Kattegat. Ophelia 28: 215-230
Tiselius, P. (1989) Contribution of aloricate ciliates to the diet of Acartia clausi and Centropages hamatus in coastal water Mar Ecol. Prog. Ser. 56: 49-56
Van Duyl, F. C.. Bak, R. P. M,, Kop, A. J. , Nieuwland, G. (1990). Bactena, auto-and heterotrophc nanoflagellates and their relations in mixed,frontal and stratified waters of the North Sea. Neth. J . Sea. Res. 26(1):97-109
Williams, R., Lindley, J . A. (1980). Plankton of the Fladen Ground During FLEX 76 I . Spring development of the plankton community. Mar. Biol. 57: 73-78
Manuscript first received: March 24, 1992 Revised version accepted: February 17, 1993