structure formation and cosmology with high-z clustersxvieaa/rosati/rosati_2.pdf · outline...
TRANSCRIPT

Outline
Structure Formation and Cosmology with high-z Clusters
Piero Rosati (ESO)
L1 : Introduction, observational techniques• Observational definition, observable physical properties• Methods for cluster searches - Cluster surveys• Multi-wavelength observations of distant clusters
L2: Clusters as Cosmological Tools• Constraining cosmological parameters with clusters • The new population of high-z clusters
XVI IAG/USP Advanced School on Astrophysics, Itatiba, Brazil - Nov 5-9 2012

Role of Clusters in Cosmology
• Clusters arise from the gravitational collapse of rare peaks of primordial density perturbations in the hierarchical formation of cosmic structure
• Clusters are so large and massive that their evolution is dominated by gravity thus avoiding complex gas physics except for the cores
• Their abundance and spatial distribution keeps the imprint of original conditions, background cosmology and law of gravity
• Their space density in the local Universe can be used to measure the amplitude of the density perturbations on ~10 Mpc scales (M<10Mpc = !av·4/3" (10 Mpc)3 ! 1015 M! #M h-2)

Rosati, Borgani & Norman 03
(Left) Locally, one can determine the !8-"m relation (!8"m0.5 # 0.5), because only the amplitude on
a given scale R # (M/ "m $crit)1/3 can be measured. (Right) the degeneracy can be broken measuring the evolution of n(M), due to the dependence of the growth factor primarily on "m , weakly on "% at z<~1
Constraining Cosmological Parameters with the Cluster Mass Function
r.m.s density fluctuation within a top-hat sphere of 8h-1Mpc radius& Amplitude of P(k)
Same local space density
"m=1
"m=0.3"%=0, 0.7
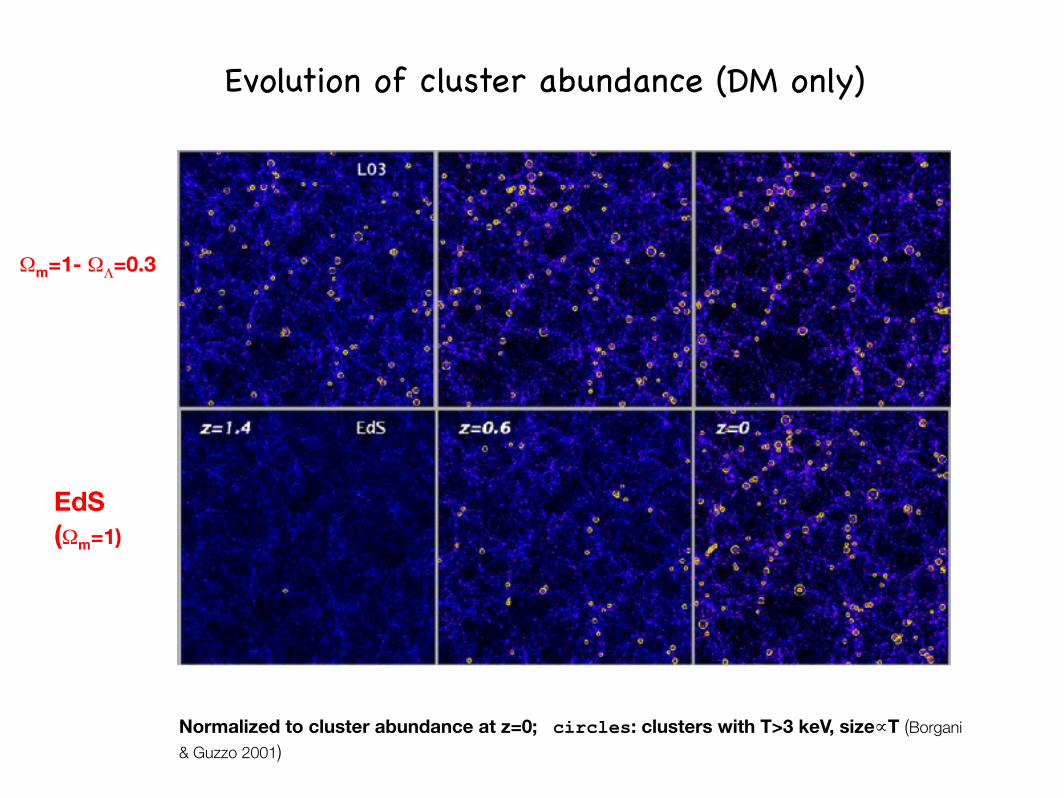
Normalized to cluster abundance at z=0; circles: clusters with T>3 keV, size!T (Borgani
& Guzzo 2001)
Evolution of cluster abundance (DM only)
"m=1- "%=0.3
EdS("m=1)
Theory vs Observations
• Current numerical simulation accurately reproduce the behaviour of the dominant (80-90% in mass) dark component (pure gravitational interactions)
• Current models finds it difficult to accurately predict the observed behaviour of the baryonic component mostly in the cores
• Galaxy formation alters the state of the cluster’s ICM in a way difficult to model: – cold and hot phases of the baryonic component are interlinked via
“feedback” from stellar and black hole accretion (AGN) processes – relations to derive masses from observations of baryons (hot gas,
galaxies) are affected by this difficult physics ! Linking cluster masses in simulations with observations is the main
source of uncertainty when using clusters for precision cosmology
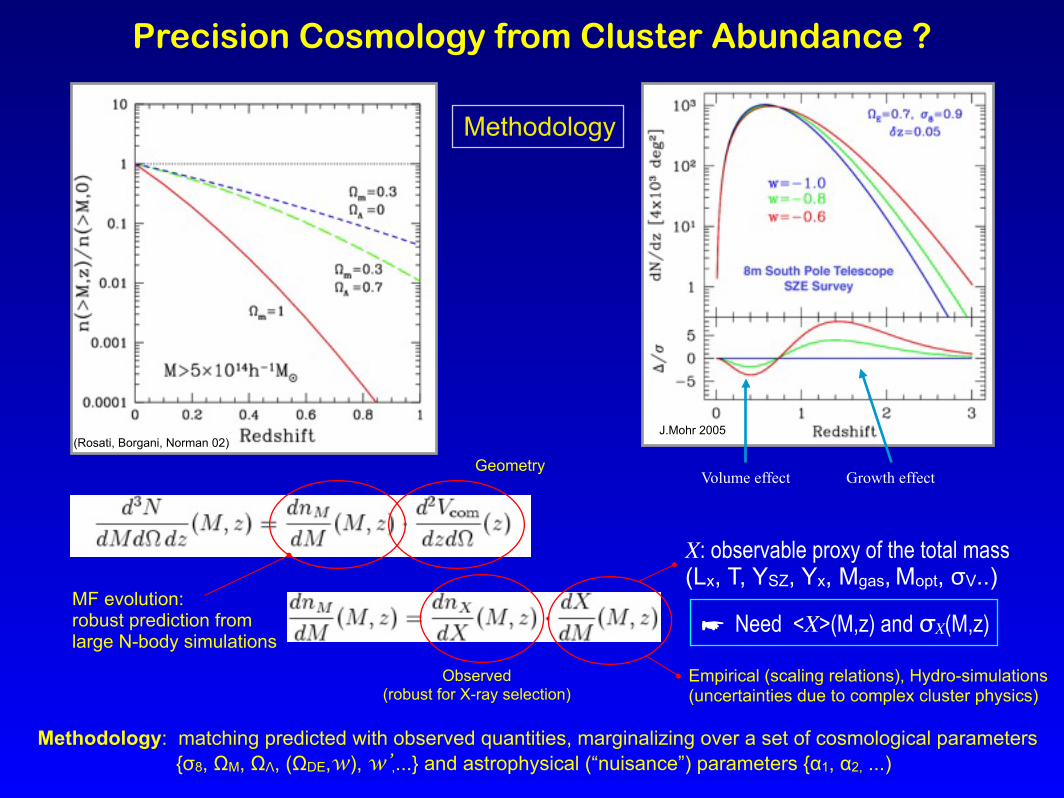
Precision Cosmology from Cluster Abundance ?
Volume effect Growth effect
J.Mohr 2005(Rosati, Borgani, Norman 02)
Methodology: matching predicted with observed quantities, marginalizing over a set of cosmological parameters {!8, "M, "#, ("DE,w), w’,...} and astrophysical (“nuisance”) parameters {$1, $2, ...)
MF evolution:robust prediction from large N-body simulations
Geometry
Observed (robust for X-ray selection)
Empirical (scaling relations), Hydro-simulations(uncertainties due to complex cluster physics)
X: observable proxy of the total mass(Lx, T, YSZ, Yx, Mgas, Mopt, !V..)
Need <X>(M,z) and σX(M,z)
Methodology

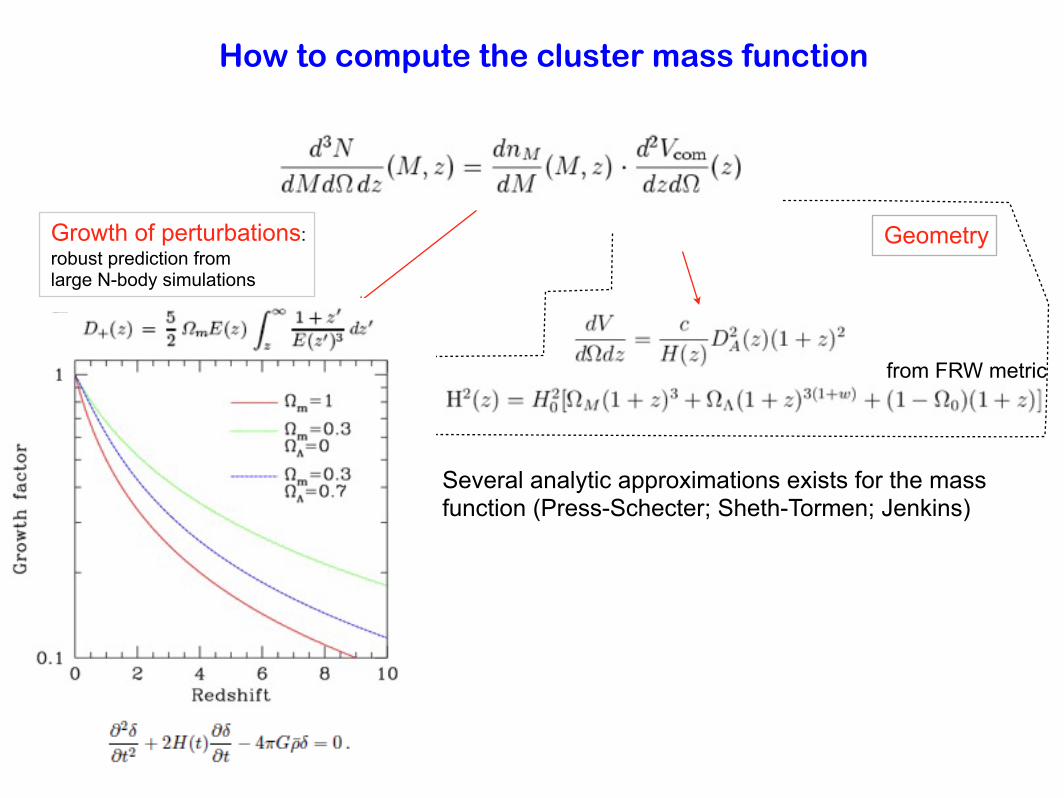
from FRW metric
Growth of perturbations:robust prediction from large N-body simulations
Geometry
How to compute the cluster mass function
Several analytic approximations exists for the mass function (Press-Schecter; Sheth-Tormen; Jenkins)
(Springel et al. 2005)
Borgani 06
from FRW metric
Growth of perturbations:robust prediction from large N-body simulations
Geometry
How to compute the cluster mass function
Several analytic approximations exists for the mass function (Press-Schecter; Sheth-Tormen; Jenkins)
(Springel et al. 2005)
Borgani 06

from FRW metric
Growth of perturbations:robust prediction from large N-body simulations
Geometry
How to compute the cluster mass function
Several analytic approximations exists for the mass function (Press-Schecter; Sheth-Tormen; Jenkins)
(Springel et al. 2005)
The redshift distribution of clusters per unit solid angle is obtained by integrating the MF weighted by the survey selection function f(M,z)
Selection fnctGeometry Growth
Borgani 06

How to determine the mass function from observations
Observed space density of clusters (i.e. XLF) LX-M relation
(Reiprich&Boehringer 02)
Empirical (scaling relations), Hydro-simulations(uncertainties due to complex cluster physics)
X: observable proxy of the total mass(Lx, T, YSZ, Yx, Mgas, Mopt, !V..)
Need <X>(M,z) and !X(M,z)
Observed (e.g. X-ray Luminosity Fnct)
X-ray selection has provided the best way so far to trace the evolution of the space density of clusters of a given mass, i.e. to estimate the evolution of the cluster mass function
Mass calibration is critical:Lx-M, T-M, Yx-M, ...

Cluster scaling relations
• Astrophysics: deviations from self-similar model, impact of galaxy formation on ICM
• Cosmology: calibration of “mass-proxy” (observable)-mass relation
Mass ! Thermodynamical quantities
The simple self-similar model (Kaiser 1986) assumes that gravitational collapse is scale free (in an EdS universe) and that the density and T distribution of ICM are independent of cluster mass.
To link the observations to theoretical models is convenient to define the cluster mass as M! : the matter contained in a spherical region of radius r =R! whose mean density is "#$c(z), so that M!(<r)= 4/3% R!3 " $c(z)
The virial mass is obtained taking !178
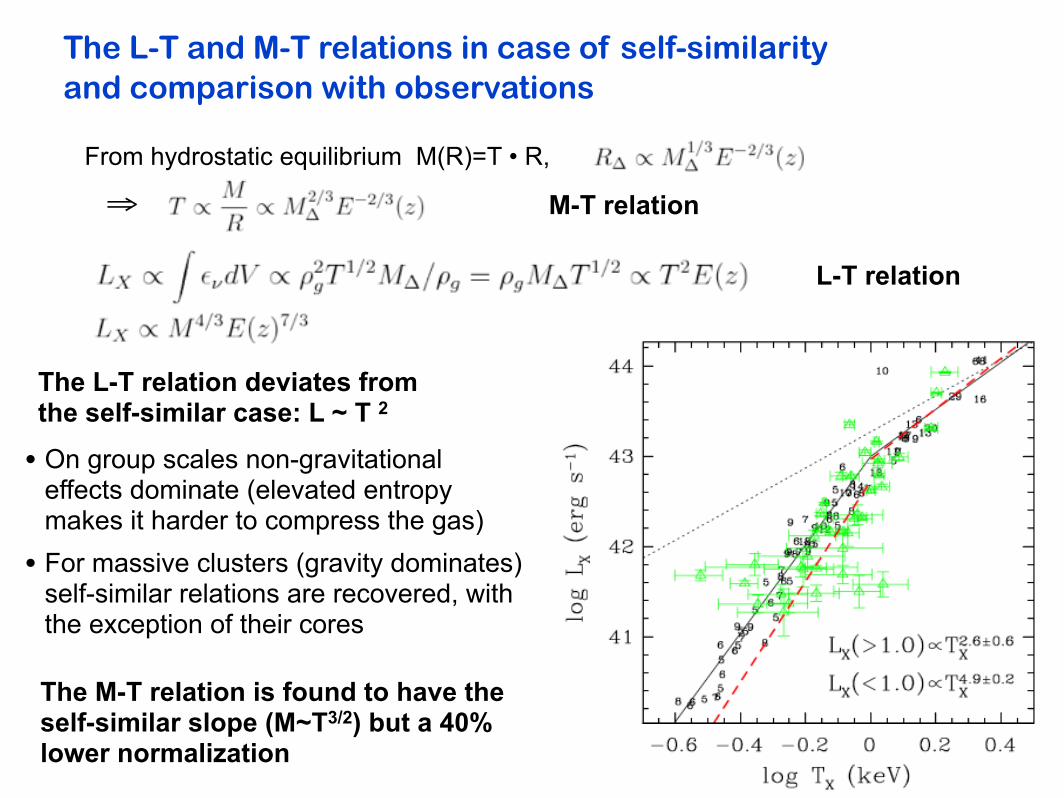
The L-T and M-T relations in case of self-similarityand comparison with observations
From hydrostatic equilibrium M(R)=T • R,
"
The L-T relation deviates from the self-similar case: L ~ T 2
• On group scales non-gravitational effects dominate (elevated entropy makes it harder to compress the gas)
• For massive clusters (gravity dominates) self-similar relations are recovered, with the exception of their cores
The M-T relation is found to have the self-similar slope (M~T3/2) but a 40% lower normalization
M-T relation
L-T relation
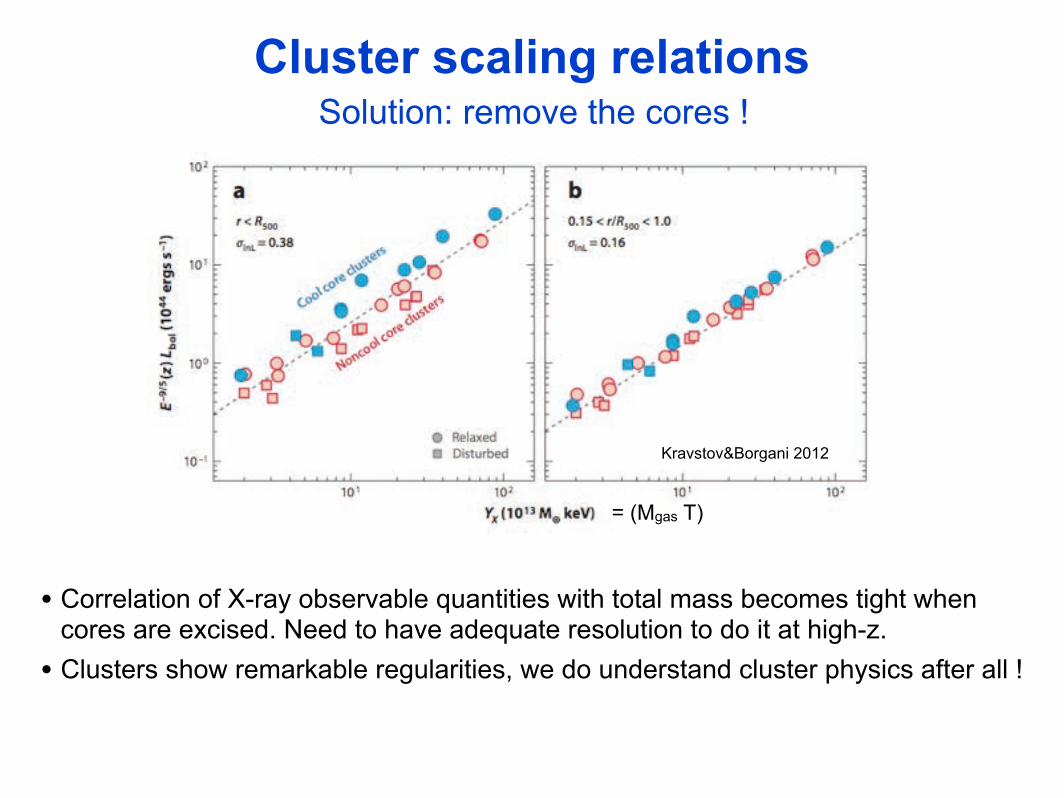
Cluster scaling relations
= (Mgas T)
Kravstov&Borgani 2012
Solution: remove the cores !
• Correlation of X-ray observable quantities with total mass becomes tight when cores are excised. Need to have adequate resolution to do it at high-z.
• Clusters show remarkable regularities, we do understand cluster physics after all !
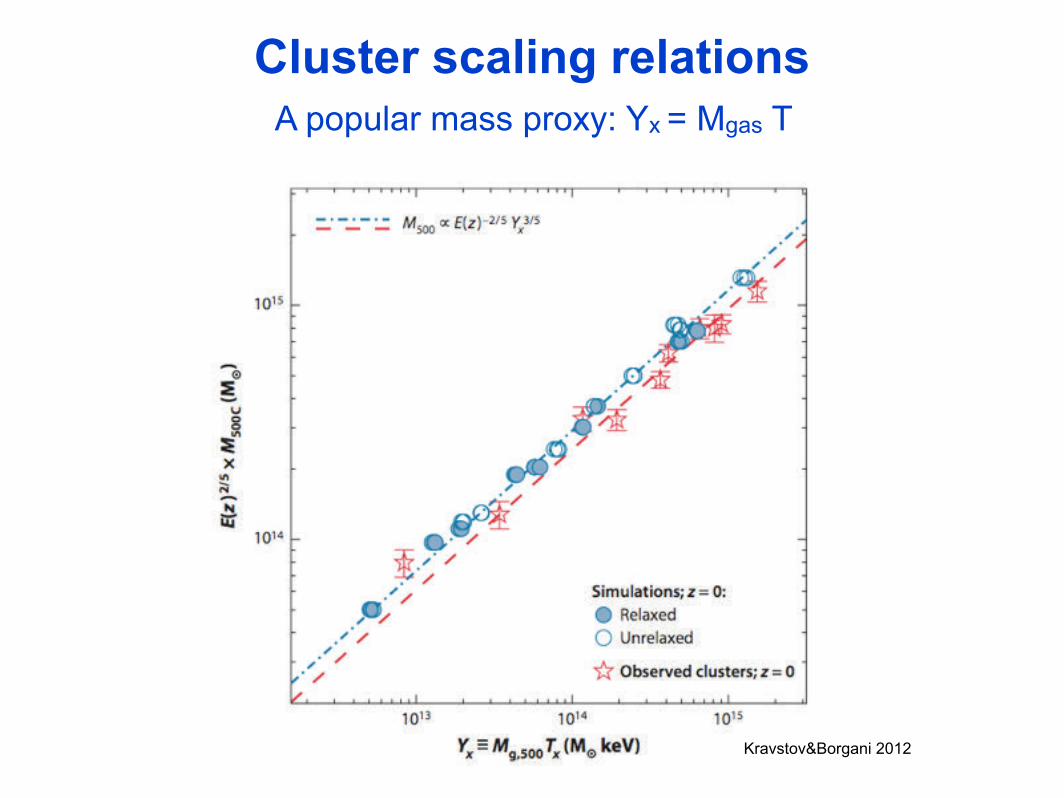
Cluster scaling relationsA popular mass proxy: Yx = Mgas T
Kravstov&Borgani 2012

Cluster abundance from X-ray Luminosity Function
The cluster XLF is modelled as a Schechter function:
A binned representation used to derive the LF from a flux-limitedcluster sample is:
S(f) is the sky coverage depending on the flux

X-ray Surveys Selection Functions
• Area and Depth determine the sensitivity to distant clusters and the probed range of the XLF, i.e. the expected f(M,z) distribution for given evolution of the mass function
• Complementary surveys need to be used to adequately range the demographics of the entire cluster population (as a funct. of M,and z)
(RBN 2002)
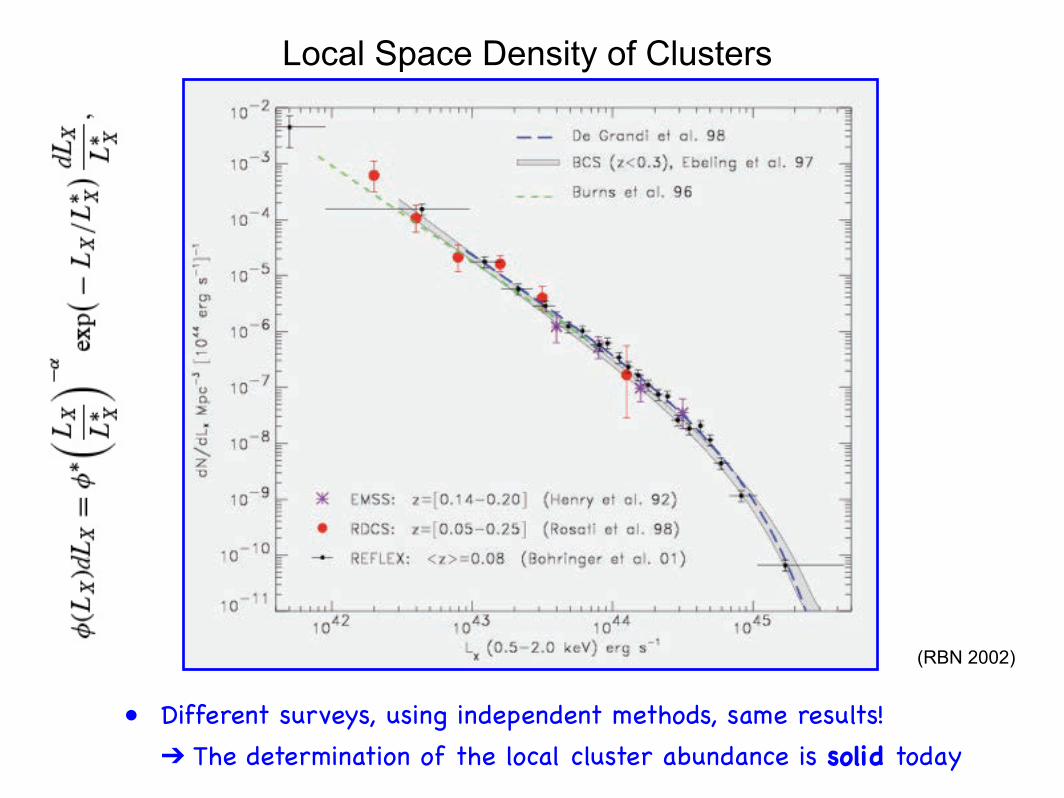
Local Space Density of Clusters
• Different surveys, using independent methods, same results!" The determination of the local cluster abundance is solid today
(RBN 2002)

Summary of Cluster XLFs of Distant Clusters
• The determination of the cluster space density out to z=0.9, for systems at (0.1-5)L*, is rather solid today
(Mullis et al. 04)
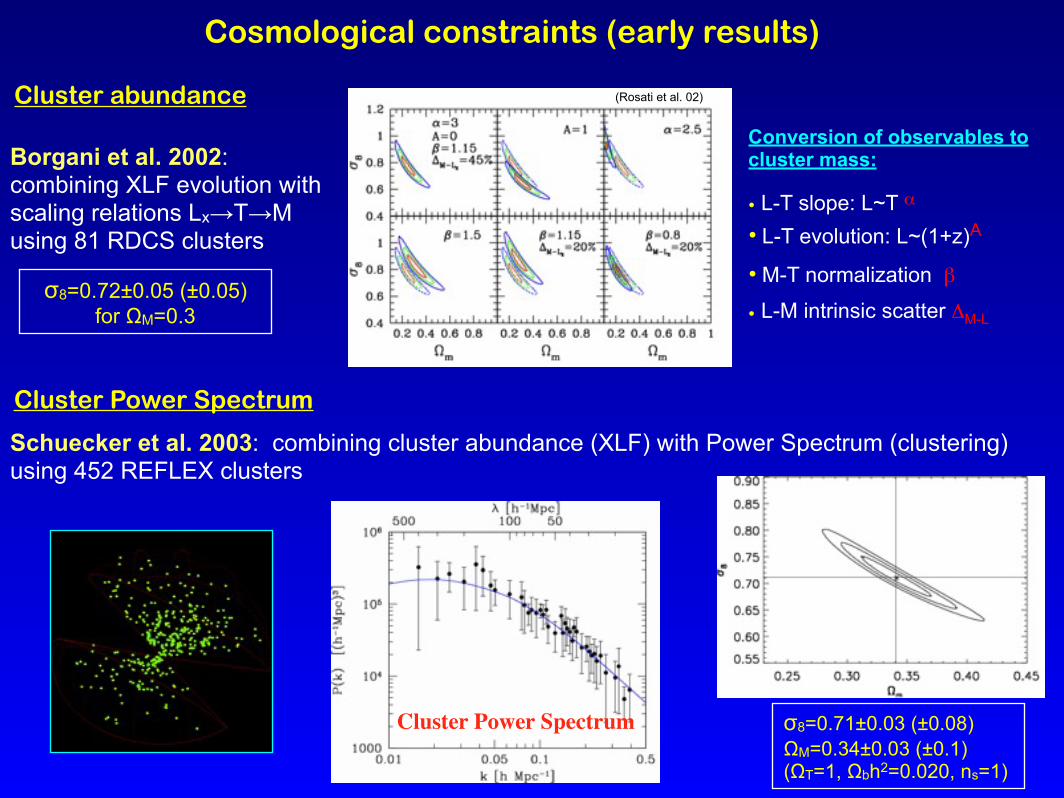
Cosmological constraints (early results)
Schuecker et al. 2003: combining cluster abundance (XLF) with Power Spectrum (clustering) using 452 REFLEX clusters
"8=0.71±0.03 (±0.08) "M=0.34±0.03 (±0.1)("T=1, "bh2=0.020, ns=1)
Cluster Power Spectrum
Cluster Power Spectrum
(Rosati et al. 02)
!8=0.72±0.05 (±0.05) for &M=0.3
Conversion of observables to cluster mass:
• L-T slope: L~T #
• L-T evolution: L~(1+z)A
• M-T normalization '
• L-M intrinsic scatter (M-L
Cluster abundance
Borgani et al. 2002: combining XLF evolution withscaling relations Lx'T'M using 81 RDCS clusters

Vikhlinin et al. 09
Cosmological constraints from Cluster evolution(latest work)
• X-ray clusters samples have not changes in the last 10-15 years (still ROSAT based, sample size~100)
• All studies in last decade have focused on mass calibration, i.e. reducing systematics:
- follow-up Chandra and XMM observations and weak lensing of 50-100 clusters out to z~1.4
- large investments of cosmological simulations and theoretical studies to model scaling relations, and quantify systematics (robustness of mass proxies)
• Vikhlinin et al. 09: 85 ROSAT clusters at z<0.9 with follow-up Chandra data for robust mass proxies (Mgas, YX)
(49)(36)

Also: Allen et al. 08 ; Henry et al. 09; ....
Vikhlinin et al. 09
Mantz et al. 09
Cosmological constraints from Cluster evolution(latest work)
• X-ray clusters samples have not changes in the last 10-15 years (still ROSAT based, sample size~100)
• All studies in last decade have focused on mass calibration, i.e. reducing systematics:
- follow-up Chandra and XMM observations and weak lensing of 50-100 clusters out to z~1.4
- large investments of cosmological simulations and theoretical studies to model scaling relations, and quantify systematics (robustness of mass proxies)
• Vikhlinin et al. 09: 85 ROSAT clusters at z<0.9 with follow-up Chandra data for robust mass proxies (Mgas, YX)
• Cosmological constraints from clusters to date provide useful complementary probes, not highly competitive today but they are based on ~102 clusters only!
• High yield, large area surveys are needed to explore and control multi-parameter systematics
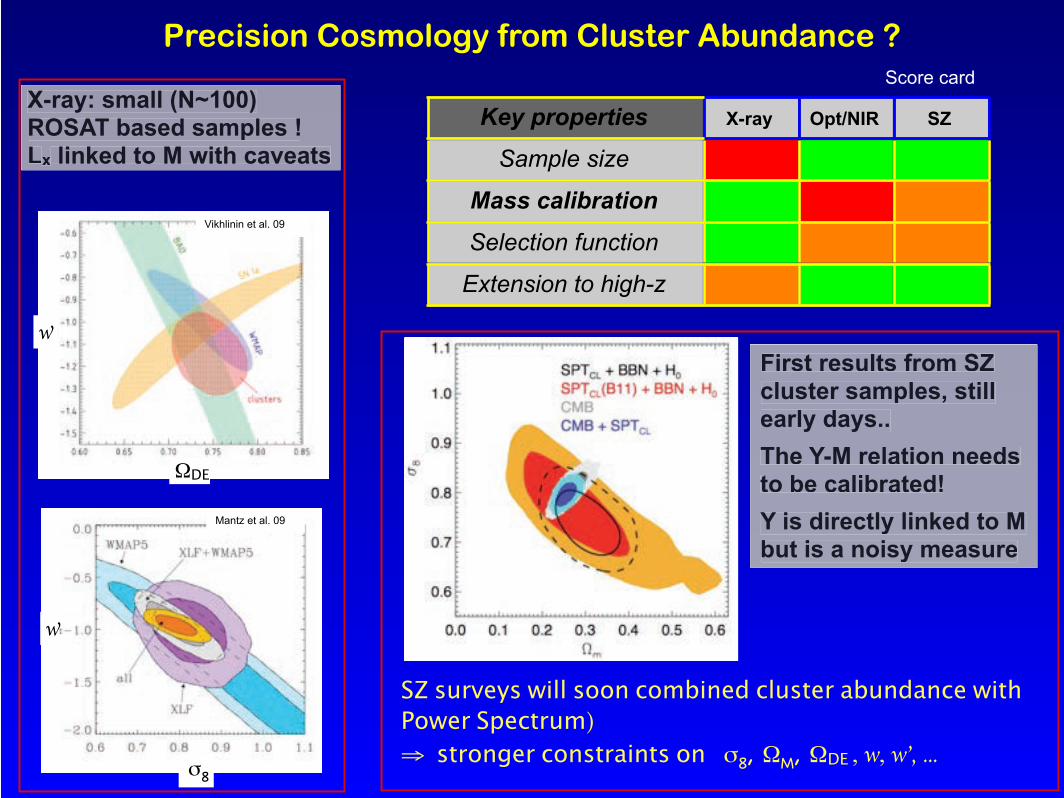
Precision Cosmology from Cluster Abundance ?
Key properties X-ray Opt/NIR SZ
Sample size
Mass calibration
Selection function
Extension to high-z
Score card
Mantz et al. 09
!8
!
Vikhlinin et al. 09
"DE
!
X-ray: small (N~100) ROSAT based samples !Lx linked to M with caveats
SZ surveys will soon combined cluster abundance withPower Spectrum)) stronger constraints on !8, "M, "DE , w, w", ...
First results from SZ cluster samples, still early days.. The Y-M relation needs to be calibrated!Y is directly linked to M but is a noisy measure
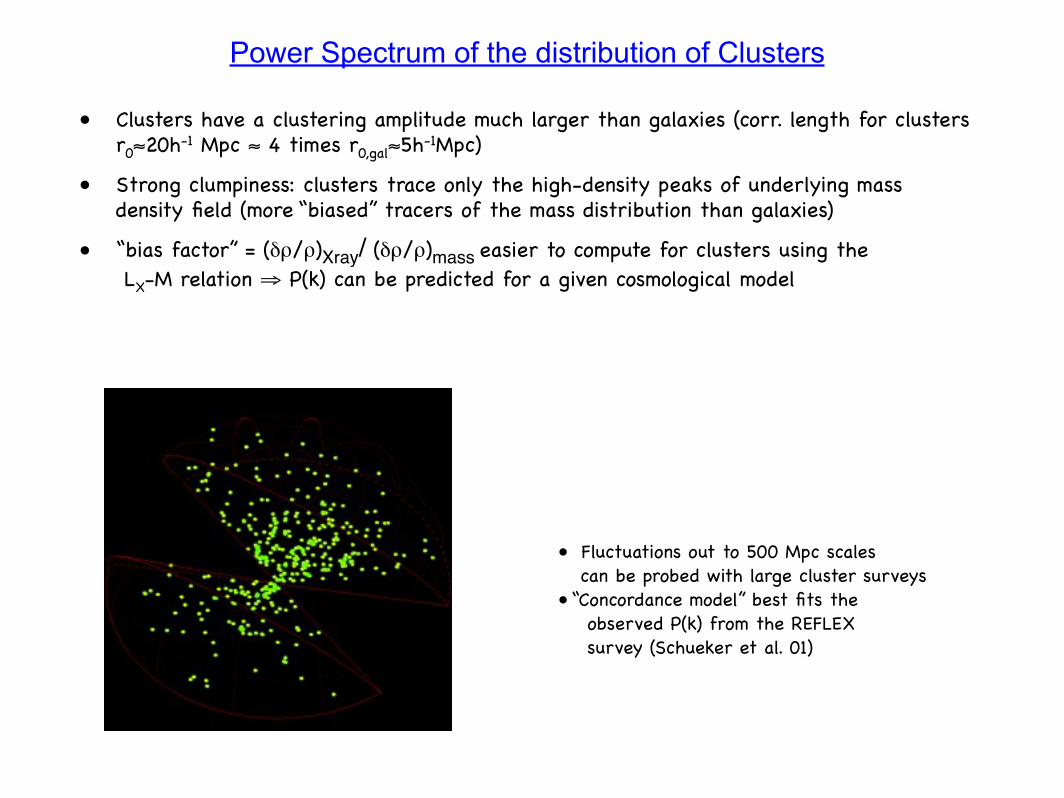
Power Spectrum of the distribution of Clusters
• Clusters have a clustering amplitude much larger than galaxies (corr. length for clusters r0#20h-1 Mpc # 4 times r0,gal#5h-1Mpc)
• Strong clumpiness: clusters trace only the high-density peaks of underlying mass density field (more “biased” tracers of the mass distribution than galaxies)
• “bias factor” = (*$/$)Xray/ (*$/$)mass easier to compute for clusters using the LX-M relation ) P(k) can be predicted for a given cosmological model
• Fluctuations out to 500 Mpc scales can be probed with large cluster surveys • “Concordance model” best fits the observed P(k) from the REFLEX survey (Schueker et al. 01)
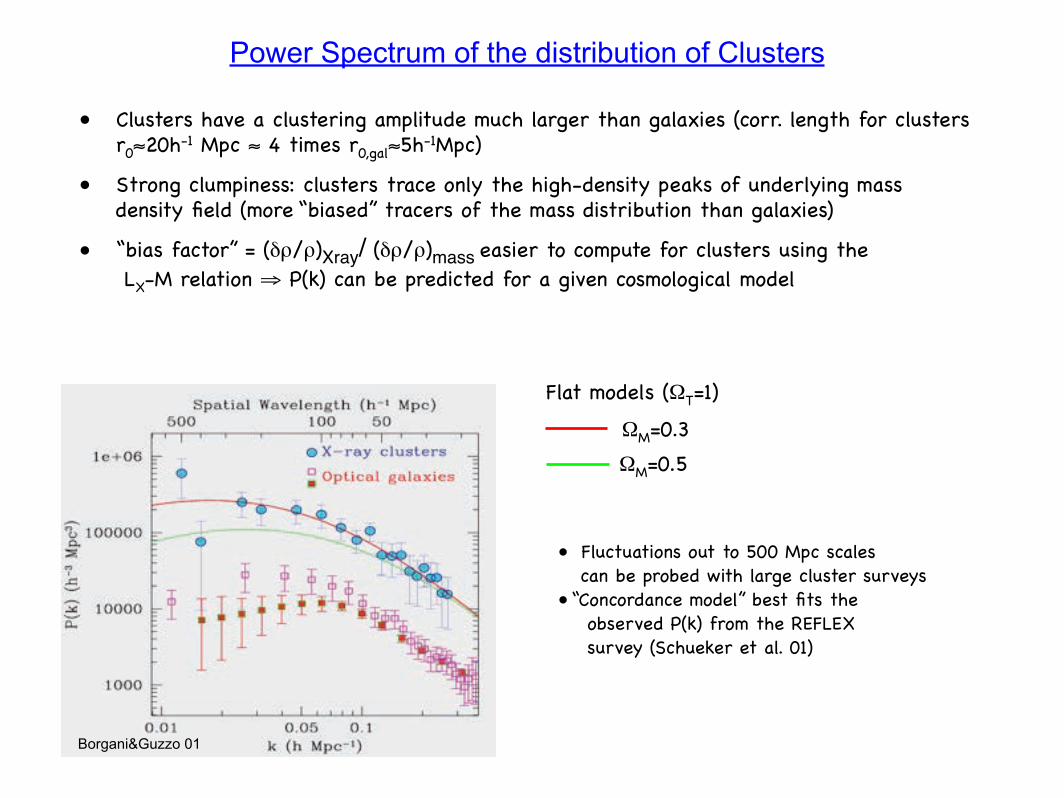
Power Spectrum of the distribution of Clusters
• Clusters have a clustering amplitude much larger than galaxies (corr. length for clusters r0#20h-1 Mpc # 4 times r0,gal#5h-1Mpc)
• Strong clumpiness: clusters trace only the high-density peaks of underlying mass density field (more “biased” tracers of the mass distribution than galaxies)
• “bias factor” = (*$/$)Xray/ (*$/$)mass easier to compute for clusters using the LX-M relation ) P(k) can be predicted for a given cosmological model
"M=0.3"M=0.5
Flat models ("T=1)
• Fluctuations out to 500 Mpc scales can be probed with large cluster surveys • “Concordance model” best fits the observed P(k) from the REFLEX survey (Schueker et al. 01)
Borgani&Guzzo 01
1015M!
P(k)1021M!
1012M!
109M!
1018M!
(Tegmark + Schuecker 04)

Ettori et al. 08
21
1) fbar = b • !b
/ !M , fbar= fgas+fstar , fstar=0.16 h70-1 fgas , fgas=0.11 h70-1.5
" !M = b !b / fgas(1+fstar/fgas )= 0.9*0.044/0.11(1+0.16) = 0.27 (±0.05)
2) fgas " DA(z,h,!M,!!) , if fgas(z)=const " fgas is like a standard rod
Constraining !M and other parameters with the cluster gas fraction(White et al. 1993, Ettori et al. , Allen et al.)
Allen et al. 08Allen et al. 08
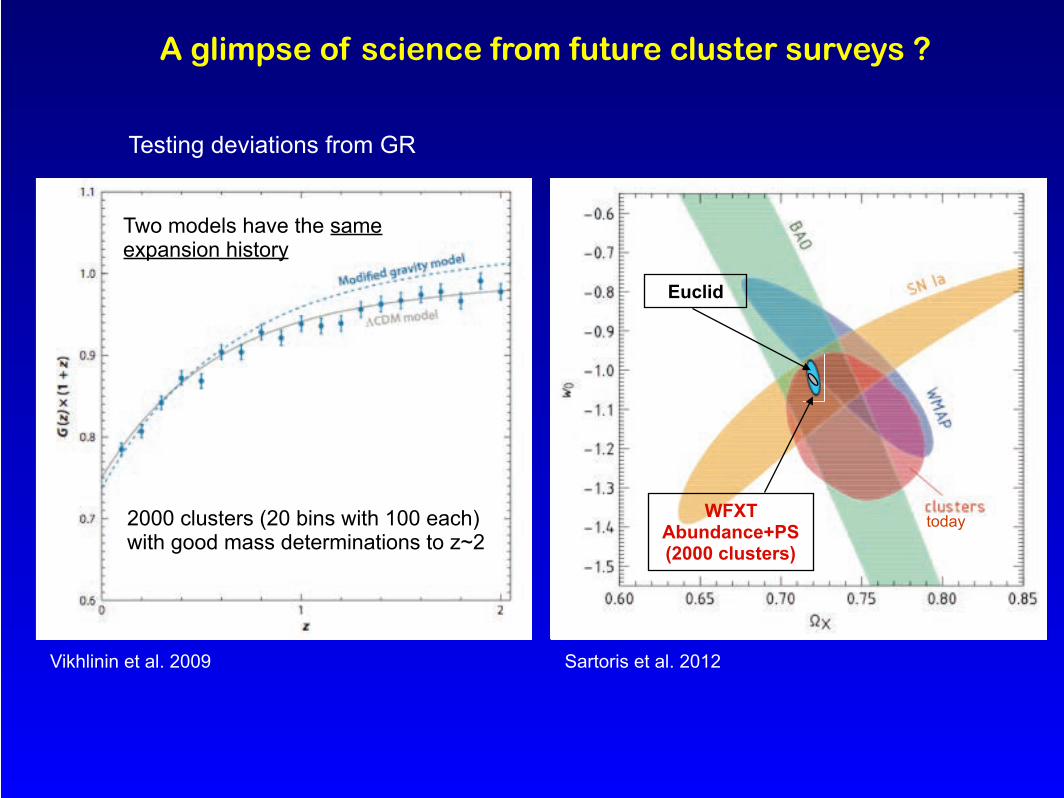
A glimpse of science from future cluster surveys ?
2000 clusters (20 bins with 100 each)with good mass determinations to z~2
Vikhlinin et al. 2009
Testing deviations from GR
Two models have the sameexpansion history
WFXTAbundance+PS(2000 clusters)
Euclid
today
Sartoris et al. 2012

• The most distant clusters provide a strong leverage:
! on Dark Energy (w, w’ ) probing growth rate at z>1in principle even a single very massive cluster at z>1 could create tension with LCDM scenario
! on the formation of stellar populations in massive galaxies, mass assembly history, ICM enrichment and energy input
‣ Tremendous progress over the last 5 years thanks to a combination of
‣ NIR: wide area Spitzer/IRAC +Optical
‣ SZ: SPT: 2500 deg2 (Mlim~2x10¹⁴ M!); ACT: 455 deg2 (Mlim ~2x higher)
‣ X-ray (serendipitous) surveys (almost only XMM)
The special role of most distant clusters
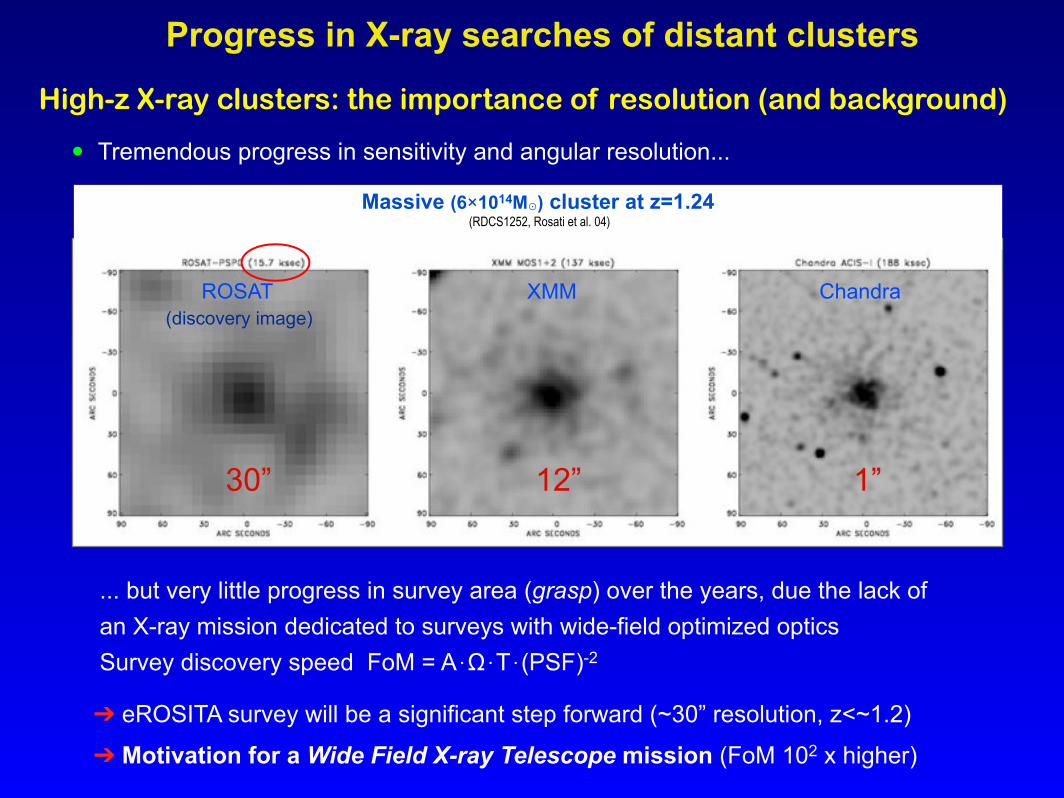
High-z X-ray clusters: the importance of resolution (and background)
• Tremendous progress in sensitivity and angular resolution...
... but very little progress in survey area (grasp) over the years, due the lack of an X-ray mission dedicated to surveys with wide-field optimized optics Survey discovery speed FoM = A⋅&⋅T⋅(PSF)-2
ROSAT XMM Chandra
Massive (6!1014M⊙) cluster at z=1.24 (RDCS1252, Rosati et al. 04)
30” 12” 1”
! eROSITA survey will be a significant step forward (~30” resolution, z<~1.2)
! Motivation for a Wide Field X-ray Telescope mission (FoM 102 x higher)
(discovery image)
Progress in X-ray searches of distant clusters
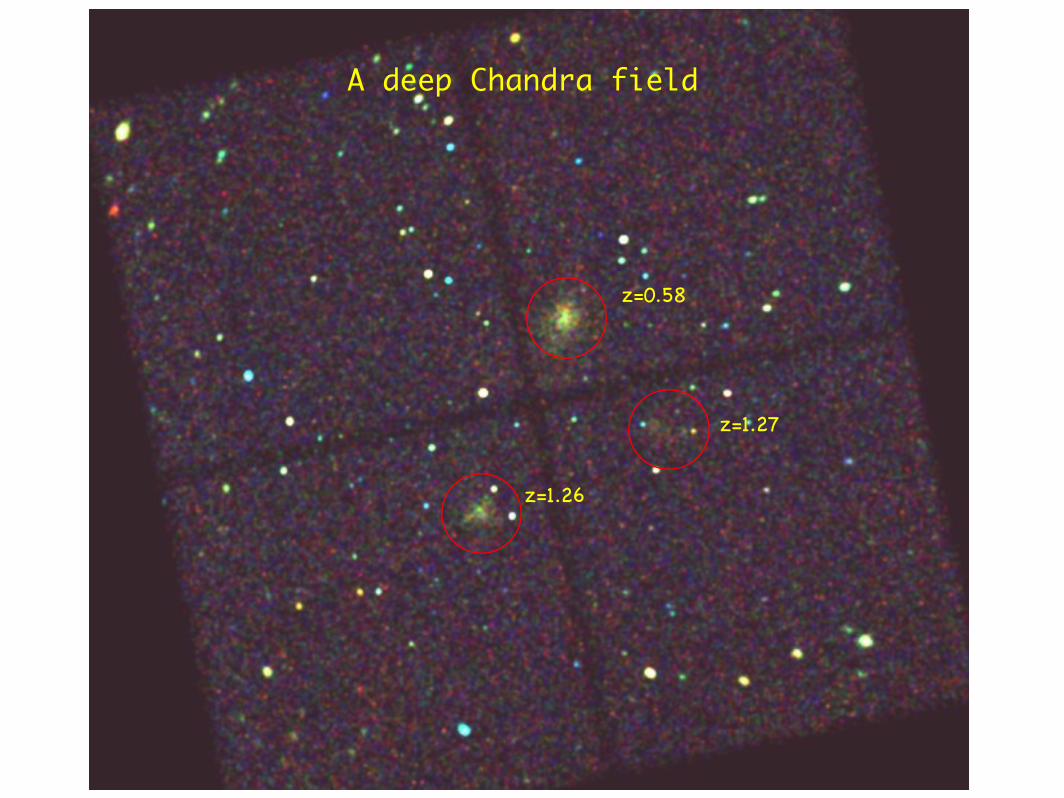
A deep Chandra field
z=0.58
z=1.27
z=1.26
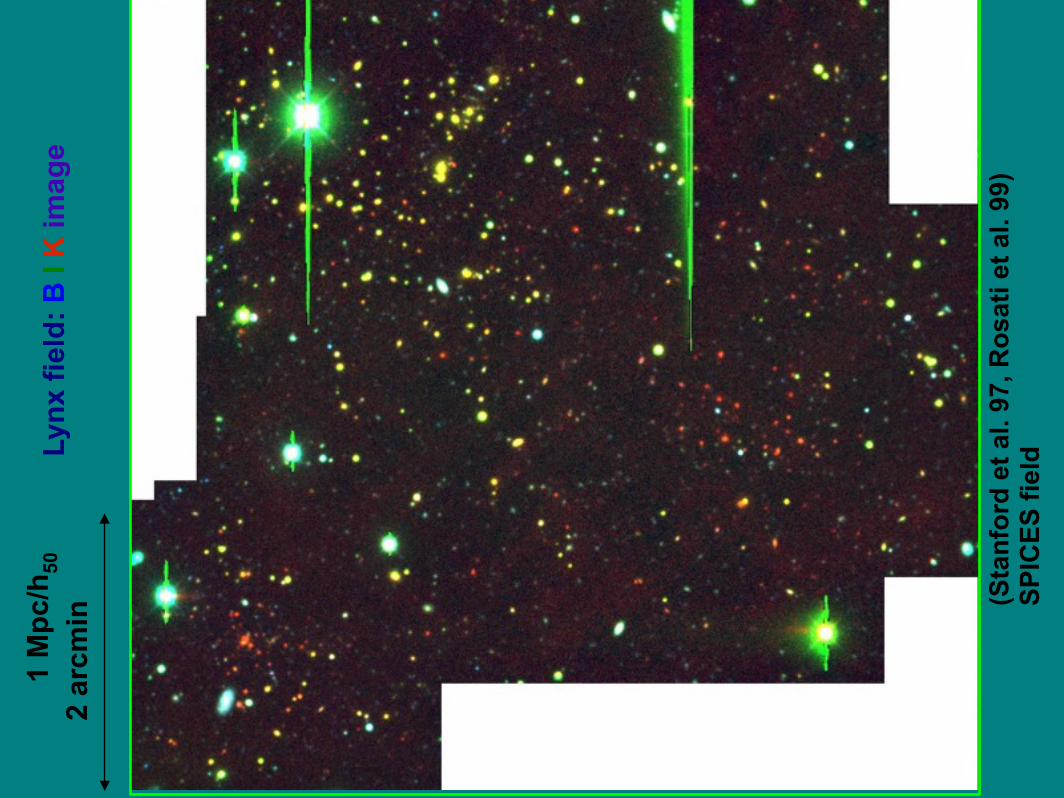
Lynx
fiel
d: B
I K
imag
e2
arcm
in1
Mpc
/h50
(Sta
nfor
d et
al.
97, R
osat
i et a
l. 99
)SP
ICES
fiel
d
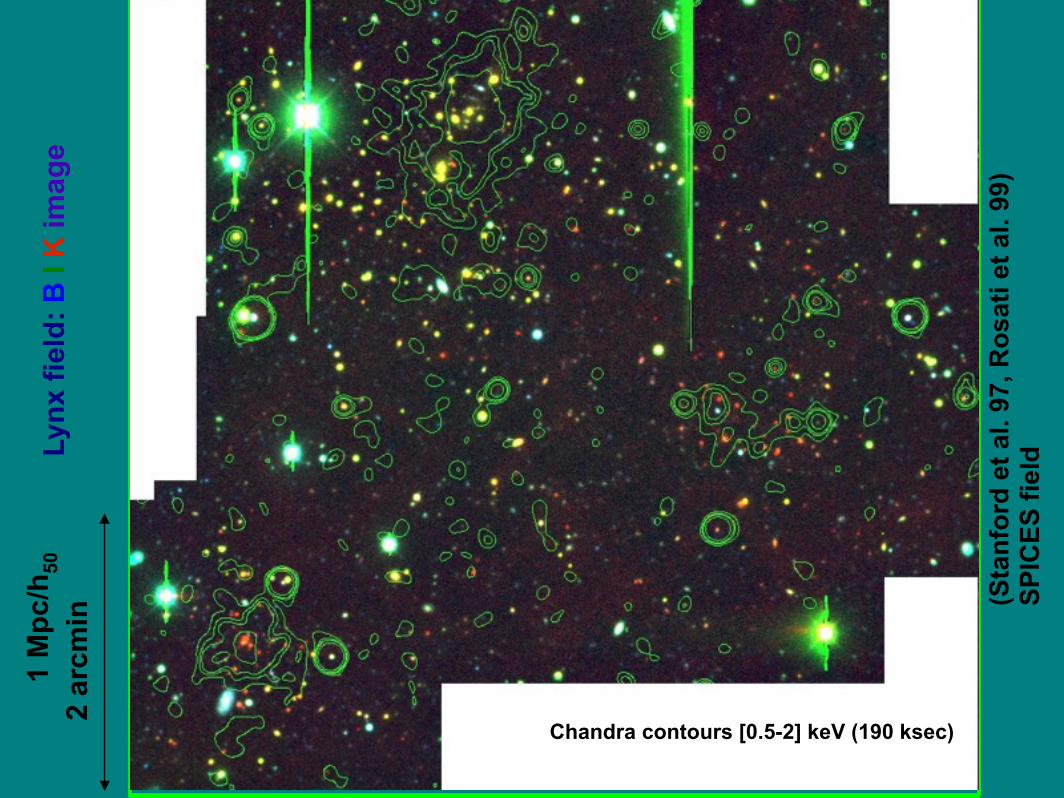
Chandra contours [0.5-2] keV (190 ksec)
Lynx
fiel
d: B
I K
imag
e2
arcm
in1
Mpc
/h50
(Sta
nfor
d et
al.
97, R
osat
i et a
l. 99
)SP
ICES
fiel
d
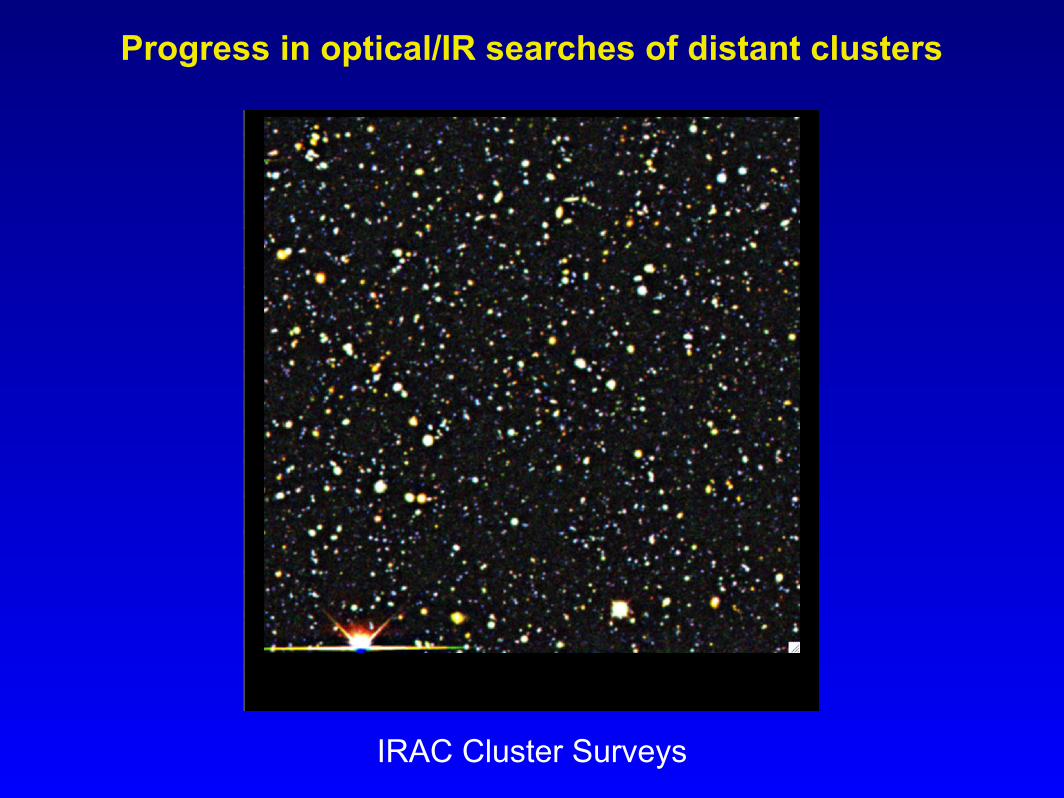
Optical !Alone!
IRAC Cluster Surveys
Progress in optical/IR searches of distant clusters

Optical +
Mid-IR
Brodwin et al. (2011)
<z> = 1.487!IRAC Cluster Surveys
Progress in optical/IR searches of distant clusters
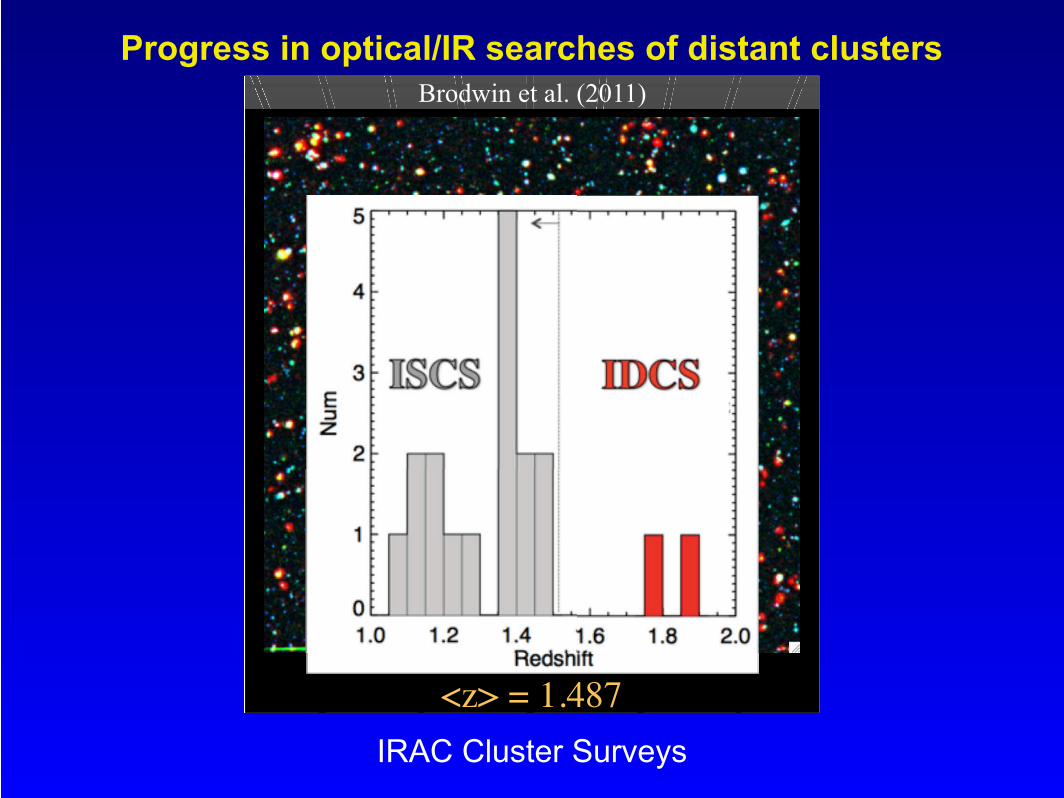
Optical +
Mid-IR
Brodwin et al. (2011)
<z> = 1.487!IRAC Cluster Surveys
Progress in optical/IR searches of distant clusters

Progress in SZ detections
The highest SZ cluster confirmed so far: z=1.31
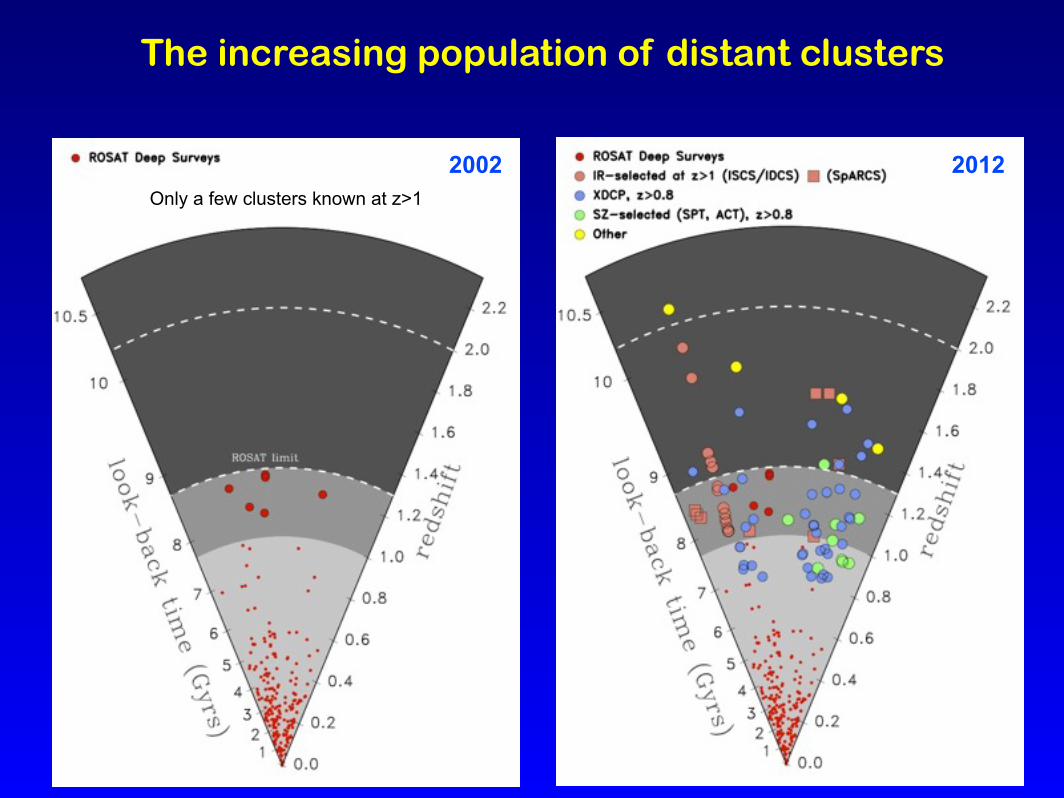
2002 2012
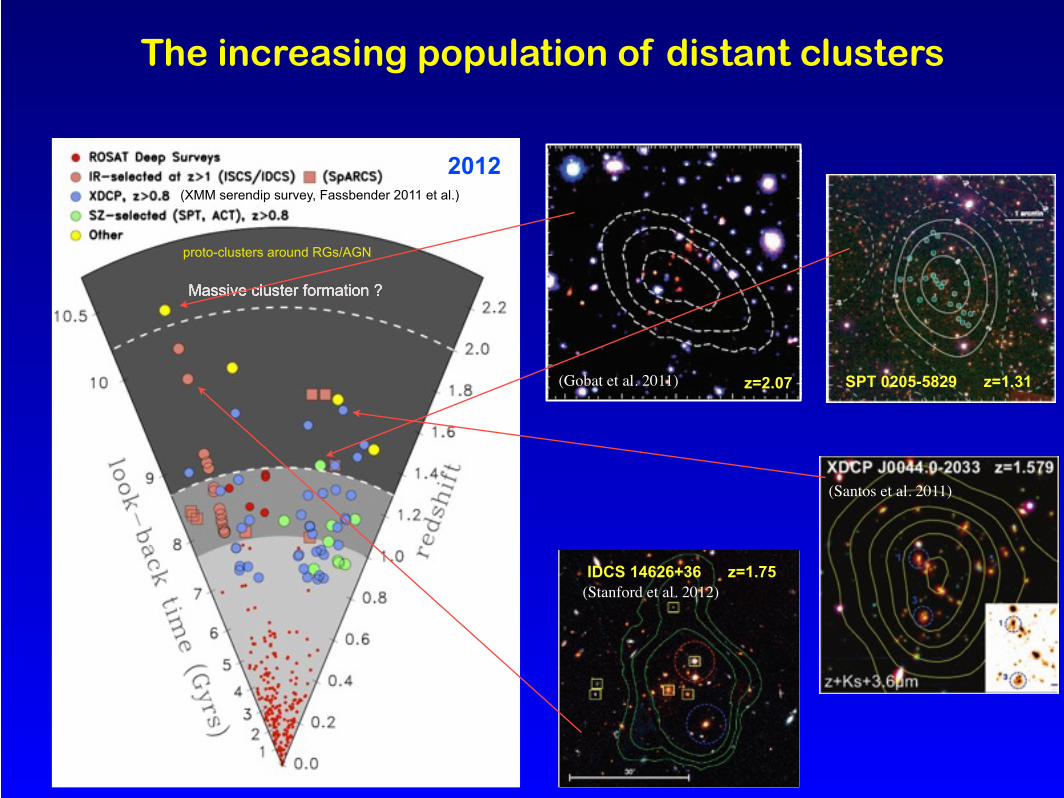
The increasing population of distant clusters
Only a few clusters known at z>1
20022012
The increasing population of distant clusters
Massive cluster formation ?
proto-clusters around RGs/AGN
z=2.07(Gobat et al. 2011)
(Santos et al. 2011)
SPT 0205-5829 z=1.31
IDCS 14626+36 z=1.75(Stanford et al. 2012)
(XMM serendip survey, Fassbender 2011 et al.)

ROSAT
XMM
SPT (2500 deg 2)SPT (78 deg 2)
(Vanderlinde+ 11)
(Credit: B.Sartoris)
Cluster detection and abundance at high-z
• The completion of the SPT (and ACT) survey will cover enough volume to unveil most massive clusters at z>1, but we are still in need of X-ray follow-up! (several Chandra/XMM Ms invested)
• XMM serendip surveys, IR (Spitzer) and radio source driven searches will continue to unveil less massive clusters out to z~2, critical to study progenitors of lower-z massive clusters
SPT (Vanderlinde+ 10)
RDCS
XDCP
X-ray
SZ
/
(ROSAT)
(XMM)
Lim
iting
Mas
s (1
015 M
⊙/h
70)
Mass detection limit

XMM2235 at z=1.39 (Mullis et al. 05)
ACS(i+z) - WFC3(J+H) - HAWKI-Kscolor composite
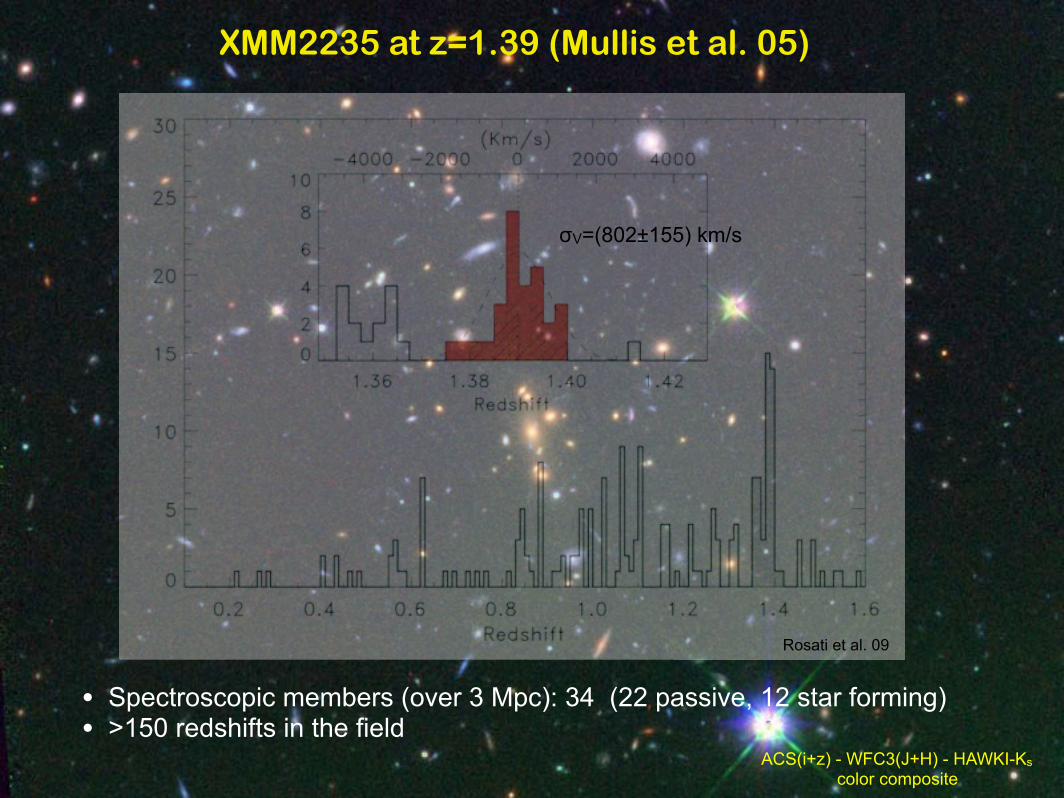
• Spectroscopic members (over 3 Mpc): 34 (22 passive, 12 star forming)• >150 redshifts in the field
XMM2235 at z=1.39 (Mullis et al. 05)
!V=(802±155) km/s
Rosati et al. 09
ACS(i+z) - WFC3(J+H) - HAWKI-Kscolor composite

Core
• Global fit:
• Core fit (r=7.5”=60 kpc):
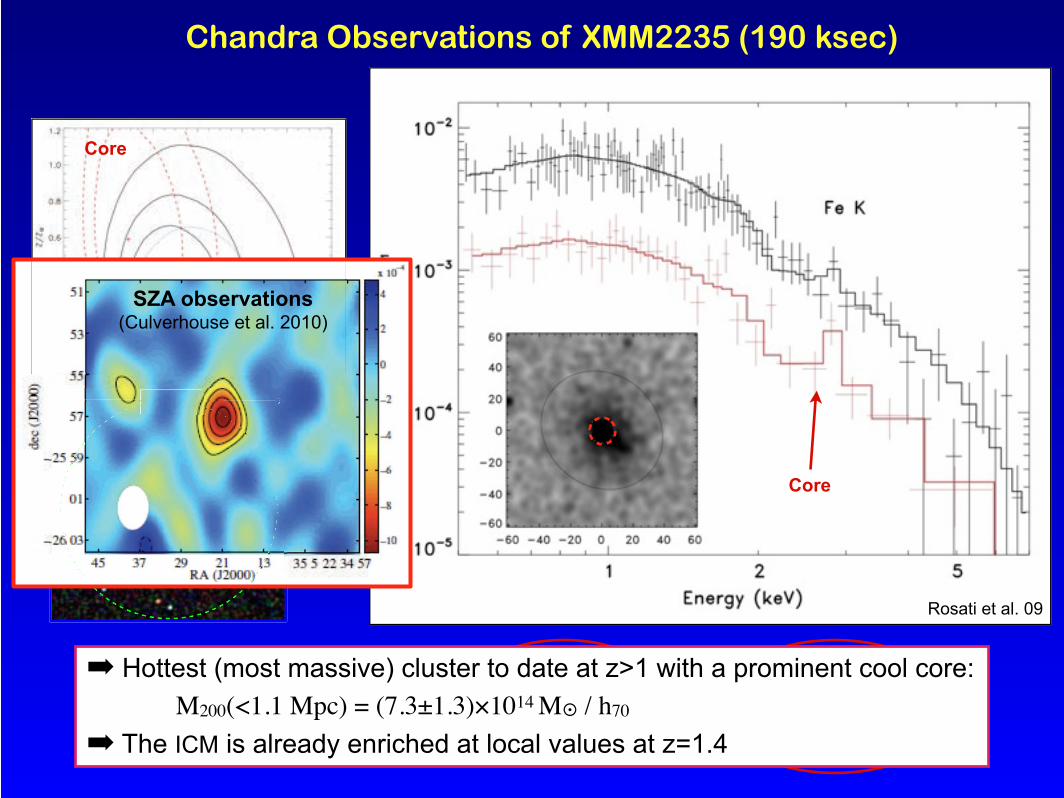
Chandra Observations of XMM2235 (190 ksec)
Core
2 Mpc
Rosati et al. 09

Core
• Global fit:
• Core fit (r=7.5”=60 kpc):
Chandra Observations of XMM2235 (190 ksec)
! Hottest (most massive) cluster to date at z>1 with a prominent cool core:M200(<1.1 Mpc) = (7.3±1.3)!1014 M! / h70
! The ICM is already enriched at local values at z=1.4
Core
2 Mpc
Rosati et al. 09
Core
• Global fit:
• Core fit (r=7.5”=60 kpc):
Chandra Observations of XMM2235 (190 ksec)
! Hottest (most massive) cluster to date at z>1 with a prominent cool core:M200(<1.1 Mpc) = (7.3±1.3)!1014 M! / h70
! The ICM is already enriched at local values at z=1.4
Core
2 Mpc
Rosati et al. 09
2 Mpc
SZA observations(Culverhouse et al. 2010)
X-ray
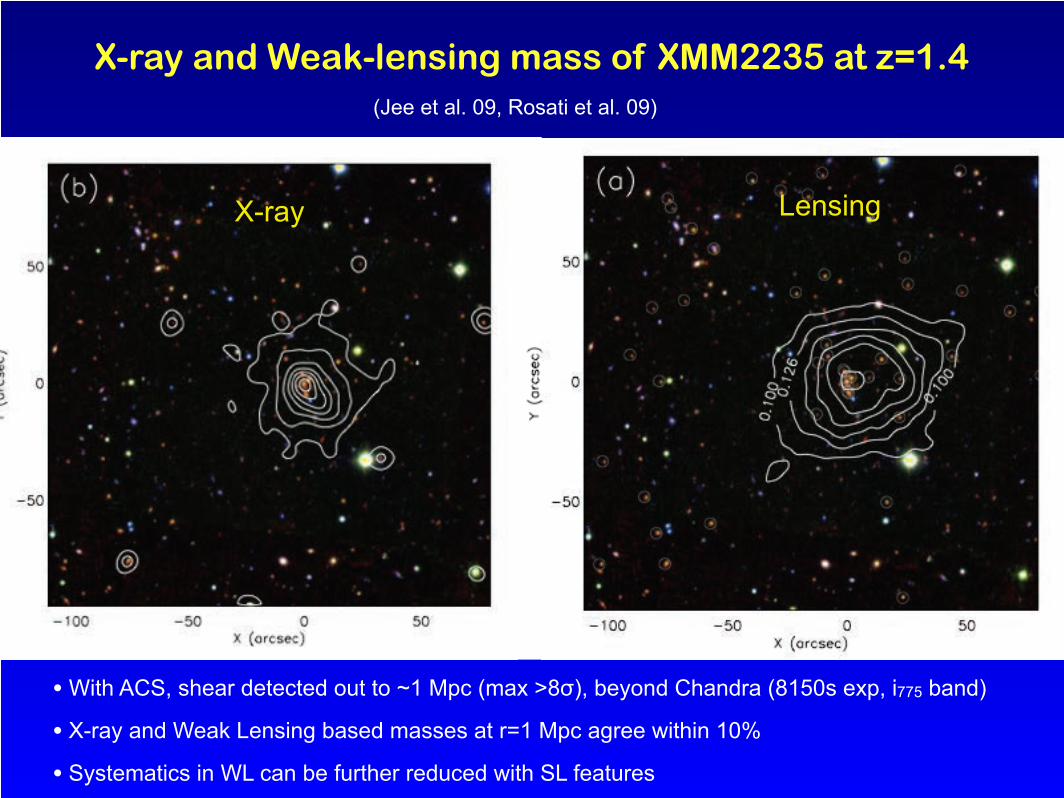
X-ray and Weak-lensing mass of XMM2235 at z=1.4
• With ACS, shear detected out to ~1 Mpc (max >8"), beyond Chandra (8150s exp, i775 band)
• X-ray and Weak Lensing based masses at r=1 Mpc agree within 10%
• Systematics in WL can be further reduced with SL features
Lensing
(Jee et al. 09, Rosati et al. 09)

• XMM2235 is in a surprisingly advanced evolutionary state at 2/3 TU:
‣ Old stellar pops, almost complete stellar mass assembly, early ICM metal enrichment, prominent cool core
• Accurate mass profile, very robust mass determination (multiple mass probes): M200(<1.1 Mpc) = (7.1±1.3)!1014 M! / h70
• Such massive cluster is a rare event (p(5 %) in the X-ray survey volume, is there any tension with )CDM ?" this stimulated a number of papers exploring also “exotic solutions”
• non-gaussian fluctuations (Jimenez&Verde 09, Sartoris et al. 10, Hoyle et al. 10, Chongchitnan&Silk 2012)
• interacting dark energy (Baldi & Pettorino 10, Mortonson et al. 10)
• Holz&Perlmutter 10, Harrison&Coles 2011
‣ Recent discovery of more M~1015 M! clusters in SZ surveys (SPT) at z≳1
Anatomy of a massive cluster at z=1.4Too big ? too early ?

Early work by N.Bahcall in the mid-nineties MS1054 at z=0.83to argue for a low &M Universe
The most massive distant clusters in the Universe and their impact on Cosmology

The most massive distant clusters in the Universe and their impact on Cosmology
• selection function and completeness not critical• weak and strong lensing very effective, all mass probes available• high-end of cluster mass function from simulation at z>1 still uncertain..
Probability of finding at least one cluster in XDCP (50 deg2 to 10-14 erg/cm2/s) using #CDM cluster MFN(>M,>z) (Sartoris et al. 11, Jee+ 09)
Accurate (<~10% errors) M200 measurements needed !
p(NCL*1)
P=11%w="0.8
Consistencywith )CDM
p(NCL*1)
Tension with )CDM
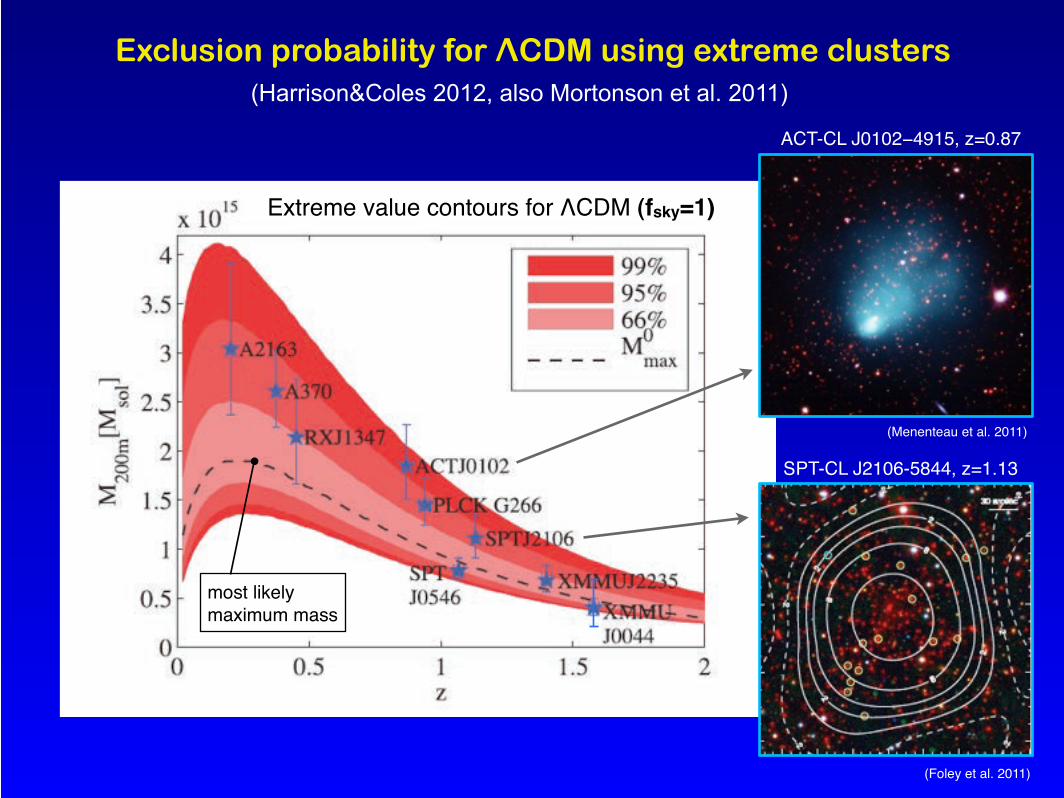
(Harrison&Coles 2012, also Mortonson et al. 2011)
Exclusion probability for !CDM using extreme clusters
SPT-CL J2106-5844, z=1.13
ACT-CL J0102!4915, z=0.87
(Menenteau et al. 2011)
(Foley et al. 2011)
Extreme value contours for "CDM (fsky=1)
most likely maximum mass

"M
Bary
on fra
ctio
n
"$
Clustering, +CL(r), or P(k): !8, "M, "%N(M,z) from evolution of cluster abundance:!8, "M, "% (w)
Parameter Accuracy *
!8 3-5%
"M 5-10%
"$ , ! 40-60%
* with current (ROSAT) samples
%8= 0.92 ± 0.10 " 0.77±0.05 " 0.81±0.02
WMAP1 WMAP3 WMAP7 +BAO + H0
Gas fraction, fB, fB(z)"Mh ("%,w)
Note: !8 =0.7-0.8 consistently from clusters
Clusters as Cosmological Probes

Independent Probes of cosmological parameters
• Geometrical methods: • Type Ia Supernovae: comoving distance-redshift relation• Cosmic Microwave Background angular spectrum• Baryon Acoustic Oscillations (modulation of P(k)) from galaxy redshift surveys (galaxy clustering), act as standard rod
• Dynamical methods: • Number density of clusters: measure combination of growth factor, D(a), and expansion history (volume evolution)• Weak lensing tomography: trace the evolution of the growth rate, fg(a)=dln(D)/dln(a), of DM perturbations• Redshift-space distortions: measure the growth rate (derivative of growth factor) from z-distortions due to peculiar motions

Clusters are powerful probes of structure formation and cosmological models
1) Sensitive probe of the dark sector of the Universe (DM+DE) !
REFLEX collaboration
Mass function and distribution of DM halos (~ Gpc scale)
(Springel et al. 2005)
&M
&"
CDM23%
Dark Energy73%
4%
Test #CDM and GR: geometry vs growth
!Structure of DM halos
("1 Mpc scale)
•Test #CDM predictions on DM density profiles•Collision-less nature of DM?
high-z
low-z
Millennium simulations(Springel et al. 2005)
low-mass
highmass