structure, diversity, and regeneration of tropical dry deciduous forest
TRANSCRIPT
-1
Structure, diversity, and regeneration of tropical dry
deciduous forest of northern India
R. SAGAR and J.S. SINGH*
Department of Botany, Banaras Hindu University, Varanasi 221-005, India; *Author for corre-
spondence (e-mail: [email protected]; fax: +91-542-2368174)
Received 30 June 2003; accepted in revised form 12 January 2004
Key words: Density–diameter curve, Forest structure, PCA ordination, Permanent plot, Plant
diversity
Abstract. This study examined the impact of disturbance on the pattern of diversity, forest
structure and regeneration of tree species in the Vindhyan dry tropical forest of India. A total of
1500 quadrats distributed over five, 3-ha permanent plots in five sites, differing in degree of
disturbance, were used to enumerate and measure the tree species. A total of 65 species with
136,983 individuals were enumerated in the total 15-ha area for stems ‡ 30 cm height. The number
of species and number of stems ranged from 12 to 50 and 8063–65331 per 3-ha area. The number of
species and stems for trees ‡10 cm dbh ranged from 3 to 28 species, with a mean value of 16 species
ha�1, and from 16 to 477 stems, with a mean value of 256 stems ha�1, respectively. The adult based
PCA ordination indicated uniqueness of sites in terms of species composition and habitat
characteristics. PCA ordination also showed uniqueness of sites in terms of seedling composition,
but the seedling and adult distributions were not spatially associated. The distinct species
composition at the different sites and at the two life-cycle stages on the same site is indicative of
marked spatio-temporal dynamics of the dry tropical forest. The density–diameter semi-logarithmic
curves ranged from a near linear to an overall concave appearance with a limited plateau in the
mid-diameter ranges. The a-diversity and its components decreased with increasing disturbance
intensity, reflecting enhanced utilization pressure with increasing disturbance. The site-wise and
species-wise regression analyses of the number of individuals in different stages of the species
revealed that both the level of disturbance and the nature of species strongly affect the regeneration.
In conclusion, although the forest is relatively species-poor, the differential species composition on
different sites and the temporal dynamics lend a unique level of diversity to the tropical dry
deciduous forest.
Introduction
The dry tropical, subtropical and woodlands once covered more than half ofthe world’s tropics (Janzen 1988), but have decreased considerably during thelast decennia. On a global basis, 52% of the total forests are tropical (Singhand Singh 1988). In India, tropical forests account for ca. 86% of the totalforest land (Singh and Singh 1988). These forests, however, are stronglyimpacted by anthropogenic activities (Champion and Seth 1968; Singh et al.1991). Because of high anthropogenic pressures in the past several decades, thedry deciduous forest cover in most parts of central India is being converted intodry deciduous scrub, dry savanna and dry grasslands which are progressively
Biodiversity and Conservation 14: 935–959, 2005. � Springer 2005
DOI 10.1007/s10531-004-0671-6
species poor. This situation calls for in-depth study of these forests with respectto species diversity, structure and regeneration.
The density–diameter (d–d) distribution of stems has been used repeatedly torepresent the population structure of the forests (UNESCO/UNEP/FAO1978). The population structure of a species in a forest can convey its regen-eration behaviour (Saxena and Singh 1984); these data have also been used byseveral workers to interpret the successional patterns (Shugart and West 1980).The population structures, characterized by the presence of sufficient popula-tion of seedlings, saplings and adults, indicate a successful regeneration offorest species (Saxena and Singh 1984), and the presence of saplings under thecanopies of adult trees also indicates the future composition of a community(Austin 1977). According to West et al. (1981), the information on the d–ddistribution can be a basis for making inferences about stand history as well asfor developing strategies to achieve a desired condition of composition and sizeclasses.
The long-term permanent plot studies can potentially provide informationabout spatio-temporal forest composition, structure and dynamics (Ayyappanand Parthasarathy 1999). Such large-scale permanent plot studies are impor-tant for conservation and management of tropical forests (Field andVazquezyanes 1993). The large-scale permanent plot studies have drawnincreasing attention over the last two decades, and about 11 large scale (‡16 ha) permanent inventory plots have been established in the major tropicalforest formations of the world (Condit 1995).
There is a lack of information from large-scale permanent inventory plotsfrom dry tropical forests of India although these forests account for 46% of theforest land in India (Singh and Singh 1988). The present study is based on five,3-ha permanent plots located at five sites in the Sonebhadra district of theVindhyan region, and documents the diversity patterns, composition andregeneration of the dry tropical forest. The permanent plots were established tofacilitate inventory of trees and to provide a basis for long-term study on forestdynamics.
Materials and methods
Study site
The region is undergoing rapid changes in vegetation and is experiencing large-scale anthropogenic forcing in the form of mining, thermal power generation,cement industry, etc. (Jha and Singh 1990). The human population of Sone-bhadra district increased from 683,249 in 1981 to 930,953 in 1991 (about 36.25%increase in 10 years). Similarly, the cattle population has also increased from132,904 in 1988 to 276,586 in 1997 (about 108% increase in a 9-year interval)(Rajya Niyojan Sansthan 2000). This has led to illegal tree felling, widespreadlopping and enhanced extraction of non-timber resources. These forests have
936
been traditionally managed by the Uttar Pradesh Forest Department throughselection felling, i.e. harvesting of individuals above a certain diameter andleaving a few mother trees for regeneration. The interval and diameter for har-vest varied according to species. No tree less than 10 cm diameter was felled. Thediameter considered suitable for felling was >30 cm for Boswellia serrata,>50 cm for Shorea robusta, >70 cm for Sterculia urens and >60 cm for otherspecies. The rotation period for felling was 30 years except for the fast growingHolarrhena antidysenterica for which it was 10 years. Leaving 15–40 mothertrees per ha, beyond recommended diameter for felling, of Shorea robusta,Terminalia tomentosa, Anogeissus latifolia, Lagerstroemia parviflora, Adinacordifolia, Acacia catechu, Hardwickia binata, Miliusa tomentosa and Chlorox-ylon swietenia, was the practice (Upadhyay and Srivastava 1980; Harikant andGhildiyal 1982).
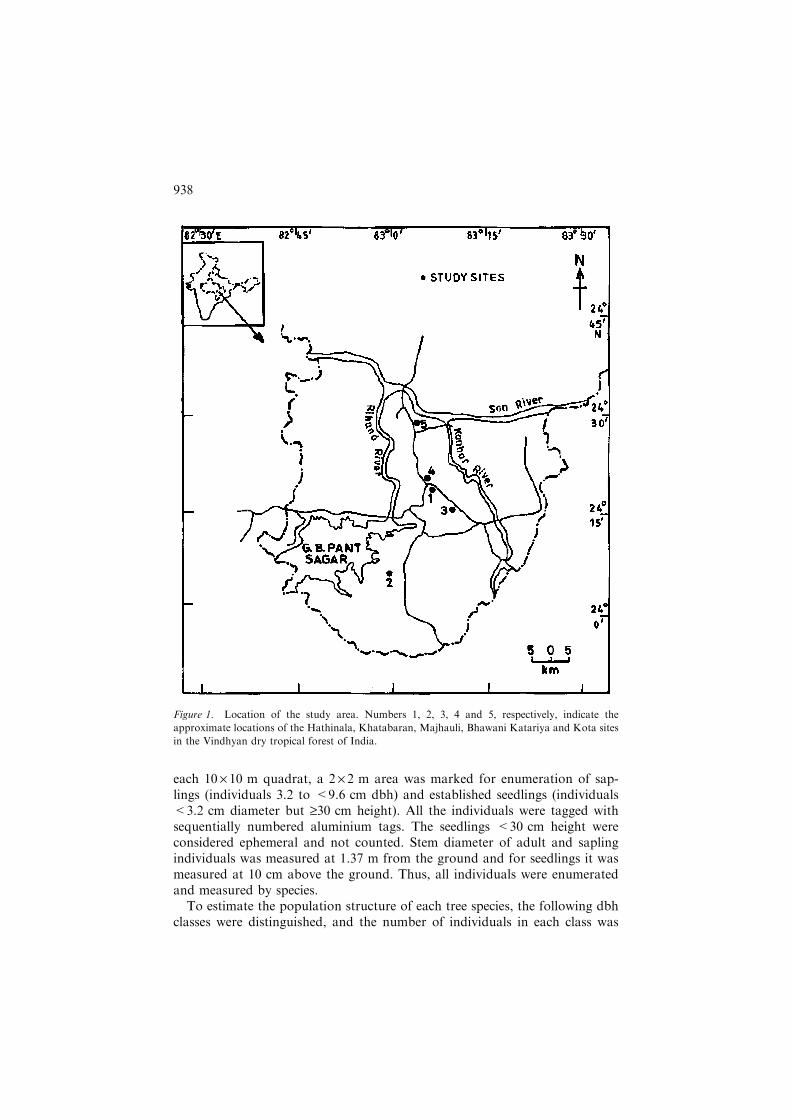
The study was conducted on five sites, viz. Hathinala, Khatabaran, Maj-hauli, Bhawani Katariya and Kota (24�6¢52¢¢–24�26¢16 N and 83�1¢86¢¢–83�9¢60¢¢ E) in the Vindhyan dry tropical forest of India (Sonebhadra district)in the years 1998–2000 (Figure 1). The sites were selected on the basis ofsatellite images and field observations to represent the entire range of condi-tions in terms of canopy cover and disturbance regimes. The elevation abovemean sea level ranges between 313 and 483 m. The climate is tropical withthree seasons in a year, i.e. summer (March–mid-June), rainy (mid-June–September) and winter (October–February). The annual rainfall varies between850 and 1300 mm, of which about 86% is received from southwest monsoonduring June–August. The soils are Ultisols, sandy loam in texture and reddishto dark grey in colour, and are extremely poor in nutrients (Singh et al. 1989).The topography is relatively flat on Kota and Khatabaran sites, gentle atBhawani Katariya and undulating at Hathinala and Majhauli sites. Physico-chemical characteristics of soils at the sites are reported by Sagar et al. (2003).Sand content ranged from 57.7 to 87.0%, water holding capacity from 30.6 to53.9%, total soil N from 0.10 to 0.15%, and soil organic C from 1.18 to 2.79%.
The five sites were categorized in a disturbance gradient by estimated relativeimpact of the composite elements of disturbance (viz. distance from road,agricultural land, inhabitation and market, visual estimate of cutting andlopping intensity, grazing and browsing intensity, soil erosion and rockiness).The total score for disturbance was: 22, Hathinala; 28, Khatabaran; 30,Majhauli; 96, Bhawani Katariya; and 106, Kota (Sagar et al. 2003; Sagar andSingh 2003).
Sampling and data analysis
At each of the five sites, three 1-ha contiguous permanent plots, having sameintensity of disturbance, were established. Each plot was divided into100 quadrats, each 10 · 10 m in size. In each quadrat, dbh (diameter at breastheight) of each adult individual (‡9.6 cm dbh) was measured. In the centre of
937
each 10 · 10 m quadrat, a 2 · 2 m area was marked for enumeration of sap-lings (individuals 3.2 to <9.6 cm dbh) and established seedlings (individuals<3.2 cm diameter but ‡30 cm height). All the individuals were tagged withsequentially numbered aluminium tags. The seedlings <30 cm height wereconsidered ephemeral and not counted. Stem diameter of adult and saplingindividuals was measured at 1.37 m from the ground and for seedlings it wasmeasured at 10 cm above the ground. Thus, all individuals were enumeratedand measured by species.
To estimate the population structure of each tree species, the following dbhclasses were distinguished, and the number of individuals in each class was
Figure 1. Location of the study area. Numbers 1, 2, 3, 4 and 5, respectively, indicate the
approximate locations of the Hathinala, Khatabaran, Majhauli, Bhawani Katariya and Kota sites
in the Vindhyan dry tropical forest of India.
938
tallied. A, established seedling; B, sapling; C, 9.6–19.0 cm; D, 19.1–28.5 cm; E,28.6–38.1 cm; F, 38.2–47.7 cm; G, 47.8–57.2 cm; H,‡57.3 cm.
The number of individuals per hectare in a dbh class was plotted against themid-diameter point of that dbh range to get the d–d curve.
The sites were ordinated using relative density of the species by principalcomponent analysis (PCA) with Biodiversity pro ver (2) software (1997). Therelationships of PCA axes with soil nutrients as well as disturbance intensitywere determined using SPSS statistical software package (SPSS 1997).
The a-diversity (exp H¢) and its components, i.e. species richness (Margalefindex) and evenness (Whittaker index) were calculated for each 1 ha-plot.b-Diversity was also calculated for each plot to represent the degree of habitatheterogeneity. These diversity indices were calculated using the followingequations:
SR ¼ S� 1
lnðNÞ ðMargalef 1958Þ
Ew ¼S
lnNi � lnNs
ðWhittaker 1972Þ
N1 ¼ eH0(Hill 1973), where H0 ¼
PSi ¼ 1pi ln pi (Shannon and Weaver
1949)
bw ¼Sc�SðWhittaker 1972Þ
In the above equations, SR = Margalef index of species richness,S = number of species, N = total number of individuals, Ew = Whittakerindex of evenness, Ni = number of individuals of most abundant species,Ns = number of individuals of least abundant species, pi is the proportion ofindividuals belonging to species i, H¢ = Shannon–Wiener index, ln = naturallog (i.e. base 2.718), bw Whittaker index of b-diversity, Sc = total number ofspecies, �S = average number of species per sample and N1 is the number ofequally common species which would produce the same diversity as H¢. N1 hasbeen used because the units (number of species) are more clearly understand-able (Krebs 1989). Furthermore, the diversity of different sites was comparedusing a k-dominance plot, in which percentage cumulative abundance isplotted against log species rank (Platt et al. 1984).
Data were subjected to ANOVA to see the effect of degree of disturbance ontotal number of species, evenness, a-diversity and stem density. Relationshipsbetween number of individuals of adults versus seedlings, and saplings versusadults and seedlings versus saplings were examined through regression analy-sis. For these analyses data only for those species were used which were rep-resented in both the concerned life-cycle stages. All statistical analyses weredone using the SPSS package (SPSS 1997).
939
Results
Species composition and forest structure
A total of 65 species (Appendix 1) with 136983 stems (Table 1) was recordedfrom the five areas, each of 3 ha. The number of species and number of indi-viduals varied from 12 to 50 and 8063–65332 per site (Appendix 1). Table 2shows the total number of species in different categories (established seedlings,saplings and adults) at the five study sites. The total number of speciesoccurring as adults, saplings and established seedlings were highest at the leastdisturbed Hathinala site and lowest at the drastically disturbed Kota site. Thenumber of species which occurred only as adults, and only as seedlings washighest for the Khatabaran and Hathinala sites, respectively.
Diospyros melanoxylon was most abundant at the Bhawani Katariya andKhatabaran sites. Among all species, D. melanoxylon had the highest numberof individuals in the lower diameter class (<9.6 cm) on the above two sites aswell as on the Majhauli site. H. antidysenterica was the most abundant speciesat the Kota site, while T. tomentosa was predominant at the Majhauli andHathinala sites. H. binata was the most abundant species in the upper diameterstratum (‡9.6 cm) of the Kota and Bhawani Katariya sites. The upper stratumwas dominated by S. robusta, Tectona grandis and Acacia catechu at Majhauli,
Table 1. Summary of stem inventory in different stages from five 3-ha permanent plots in the dry
tropical forest of India.
Site Seedlings Saplings Adults Total
Hathinala 60900 3175 1257 65332
Khatabaran 5975 1250 838 8063
Majhauli 19650 6525 1187 27362
Bhawani Katariya 8500 2125 646 11271
Kota 21125 3725 105 24955
Total 116150 16800 4033 136983
The adults (individuals ‡9.6 cm dbh) were enumerated in 300, 10· 10 m quadrats and established
seedlings (‡30 cm height but <3.2 cm diameter) and saplings (‡3.2 to <9.6 cm dbh) were enu-
merated in 300, 2· 2 m quadrats at each of the five dry tropical forest sites. The established seedling
and sapling stems were scaled up in same unit as adults.
Table 2. Total number of species in different life-cycle stages on the five sites.
Category Hathinala Khatabaran Majhauli Bhawani Katariya Kota Total for five sites
Adult (‡9.6 cm) 31 30 23 22 7 49
Sapling 22 8 18 17 6 36
Seedling 47 17 27 19 7 57
Only as adult 3 15 5 4 3 7
Only as sapling 0 0 0 0 1 0
Only as seedling 16 2 9 1 2 14
940
Khatabaran and Hathinala sites, respectively. Bridelia retusa was most abun-dant in the lower stratum of Hathinala site. Across all sites, 9% of species werecommon (A. catechu, Anogeissus latifolia, D. melanoxylon, H. antidysenterica,L. parviflora and Lannea coromandelica) (Appendix 1).
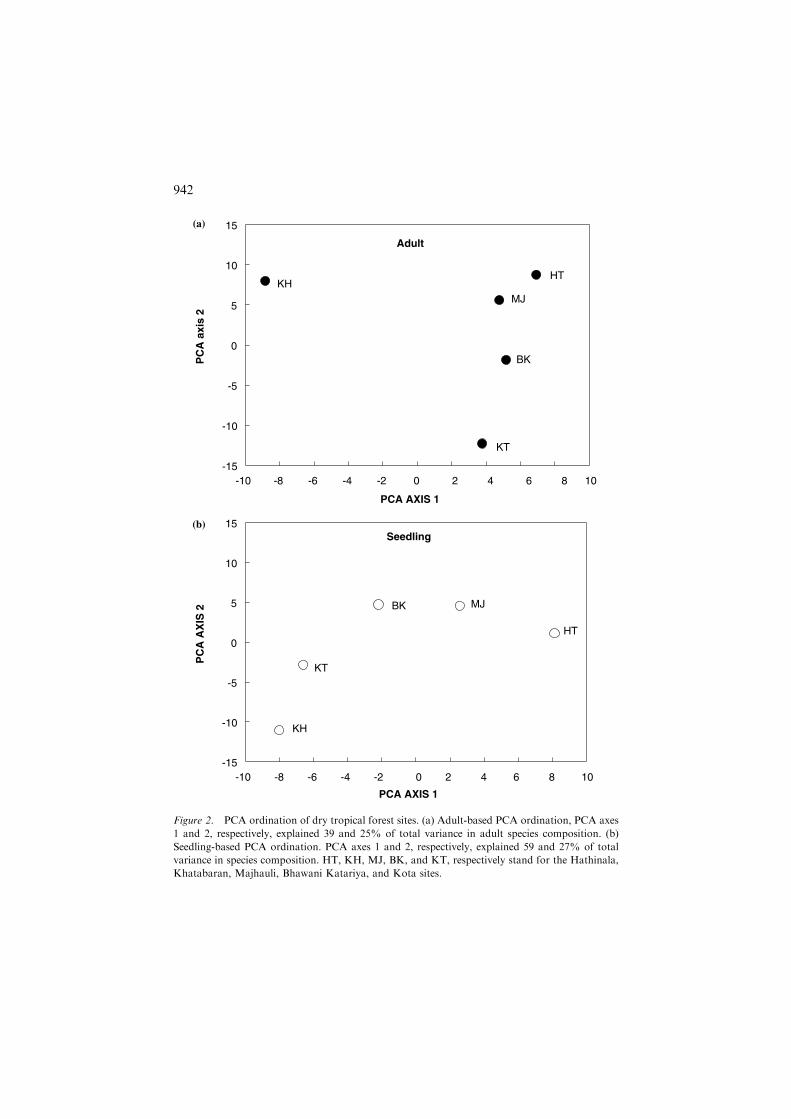
The PCA ordination of the five sites on the basis of relative density of speciesin the adult tree population is illustrated in Figure 2a. The PCA axes 1 and 2accounted for 39 and 25% variation, respectively. The PCA axis 1 was relatedwith soil nitrogen (r =�0.881, p = 0.049) and PCA axis 2 represented thedisturbance gradient (r =�0.943, p = 0.016). The PCA ordination for sitesusing species composition and relative abundance of established seedlings isgiven in Figure 2b. The PCA axis 1 for seedling communities accounted for59% variation in species composition while PCA axis 2 accounted for 27%variation.
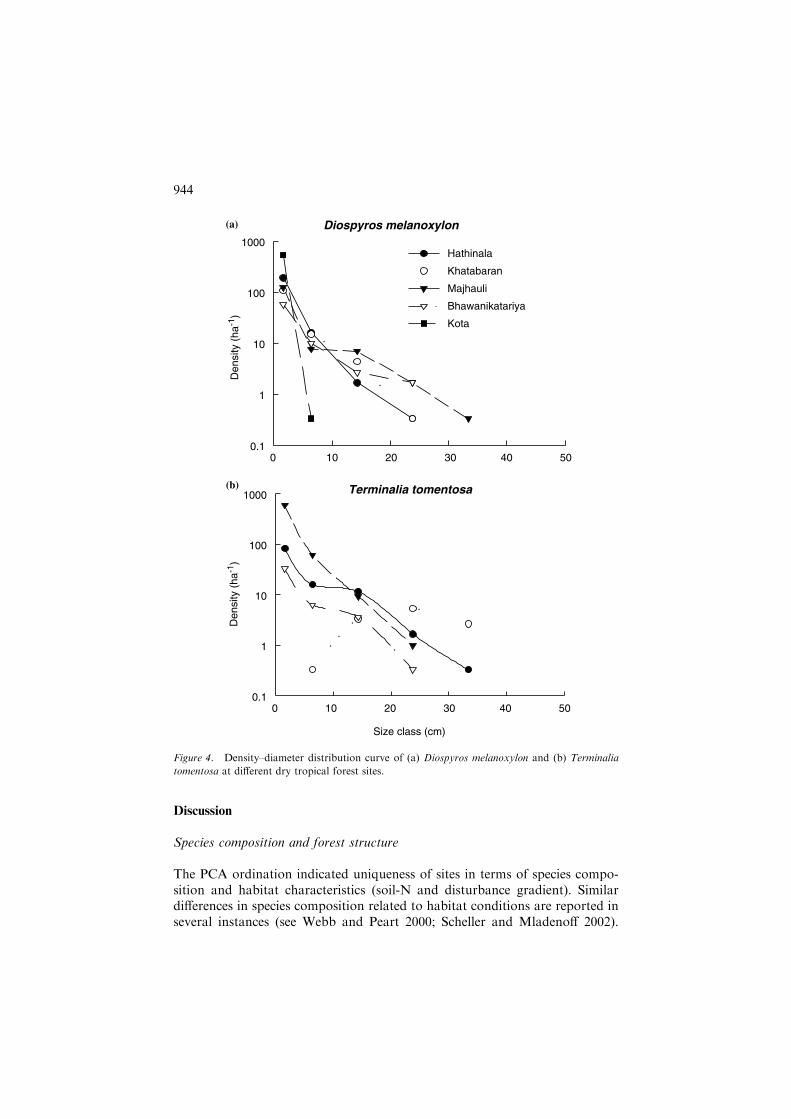
Figure 3 shows the semi-logarithmic d–d distribution curves for the five sitesand for the entire study area. The number of stems decreased rapidly at firstand then more slowly with an increase in the diameter class. The general lookof the curve was in between rotated sigmoid and concave. The d–d curves fortwo species (T. tomentosa and D. melanoxylon) are plotted for each site inFigure 4 to show that the shape of the curve for a species changed on differentsites.
Species diversity
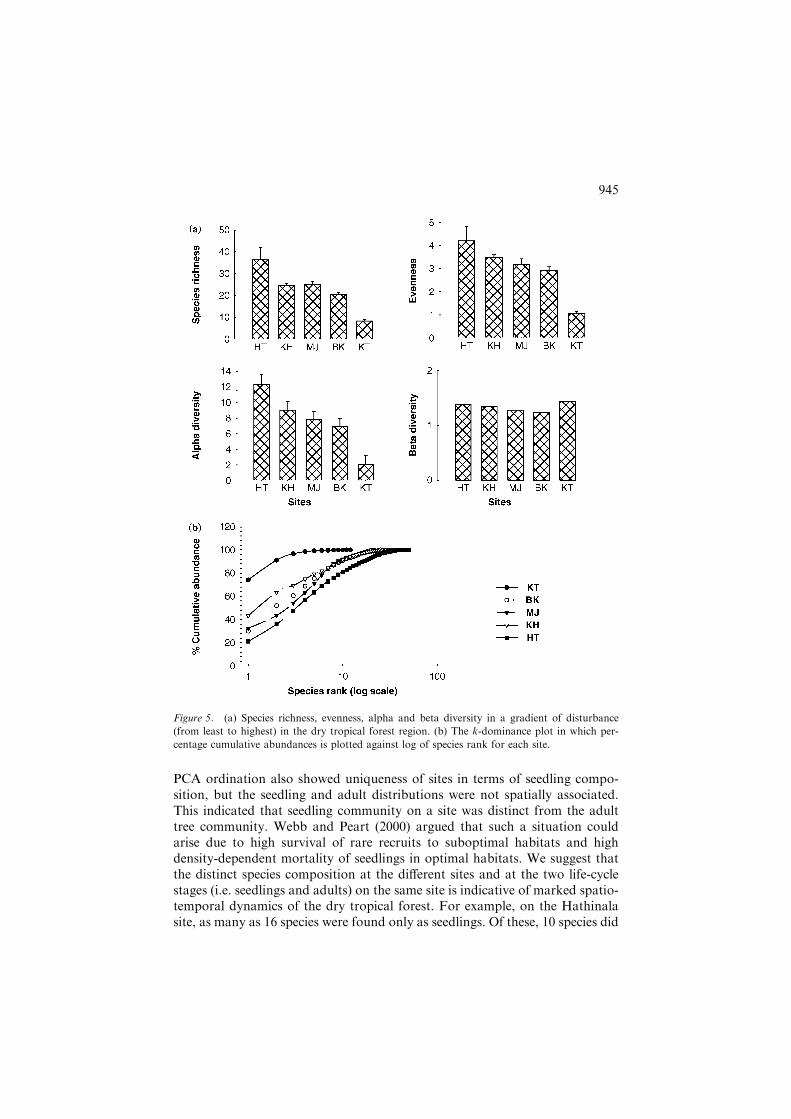
ANOVA revealed that differences in the total number of species (F4,10 = 14.62,p = 0.000), evenness (F4,10 = 13.39, p = 0.001), a-diversity (F4,10 = 28.92,p = 0.000) and stem density (F4,10 = 9.54, p = 0.002) due to sites (and distur-bance intensity) were significant. The species richness, evenness and a-diversitydeclined with disturbance intensity, whereas b-diversity, which accounted forchanges in species composition within site, did not exhibit any pattern withdisturbance, except that it had the maximum value for the highly perturbedKota site (Figure 5a). Figure 5b shows the k-dominance of species rank plot.The bottom curve (Hathinala site) represented the highest diversity, while theuppermost curve (Kota site) represented the lowest diversity.
Analysis of diversity patterns at different diameter classes showed thatMargalef index of species richness and a-diversity were highest for the inter-mediate diameter class (9.6–19.1 cm dbh) for three out of five sites (Table 3).The least disturbed Hathinala site exhibited maximum diversity for establishedseedlings. Opposite to this, the highly stressed Kota site exhibited an increasingtrend of diversity with increasing diameter class except for species richness. Thetotal number of species declined from lower diameter class to higher diameterclass except for Bhawani Katariya site (Table 3). The mean number of stemsha�1 also declined with increasing diameter thresholds (Table 4). Evidently,species and individuals which could attain a large size (high diameter) were fewin number, indicating a small structure.
941
PCA AXIS 1
-10 -8 -6 -4 -2 0 2 4 6 8 10
PC
A a
xis
2
-15
-10
-5
0
5
10
15
PCA AXIS 1
-10 -8 -6 -4 -2 0 2 4 6 8 10
PC
A A
XIS
2
-15
-10
-5
0
5
10
15
KHHT
MJ
BK
KT
KH
KT
BK MJ
HT
Adult
Seedling
(a)
(b)
Figure 2. PCA ordination of dry tropical forest sites. (a) Adult-based PCA ordination, PCA axes
1 and 2, respectively, explained 39 and 25% of total variance in adult species composition. (b)
Seedling-based PCA ordination. PCA axes 1 and 2, respectively, explained 59 and 27% of total
variance in species composition. HT, KH, MJ, BK, and KT, respectively stand for the Hathinala,
Khatabaran, Majhauli, Bhawani Katariya, and Kota sites.
942

Regeneration
The number of individuals at the seedling, sapling and adult (‡9.6 cm dbh)stages occurring on different sites were related with each other (Figure 6,Table 5). These relationships were explored also across species, by pooling thedata for five sites (15-ha area) (Figure 7, Table 6). Species which did not haveindividuals at any one of the stages were excluded from these analyses. It wasevident that the Kota and Hathinala sites were outliers, as the exclusion of datafrom these sites resulted in a significant improvement in the r2 values. Similarly,exclusion of certain species significantly improved the relationships betweenseedlings and adult, and between adult and saplings.
0 10 20 30 40 50 60 700.1
1
10
100
1000
10000
0 10 20 30 40 50 60 70
Den
sity
( h
a-1)
0.1
1
10
100
1000
10000
0 10 20 30 40 50 60 700.1
1
10
100
1000
10000
0 10 20 30 40 50 60 700.1
1
10
100
1000
10000
0 10 20 30 40 50 60 700.1
1
10
100
1000
10000
0 10 20 30 40 50 60 700.1
1
10
100
1000
10000
Den
sity
(ha
-1)
Den
sity
(ha
-1)
Size class (cm)Size class (cm)
Hathinala Khatabaran
Majhauli Bhawani katariya
All sitesKota
(a) (b)
(c) (d)
(e) (f)
Figure 3. Density–diameter distribution curve for all species within the Vindhyan dry tropical
forest of India. (a) Hathinala, (b) Khatabaran, (c) Majhauli, (d) Bhawani Kataria, (e) Kota, (f) all
sites.
943
Discussion
Species composition and forest structure
The PCA ordination indicated uniqueness of sites in terms of species compo-sition and habitat characteristics (soil-N and disturbance gradient). Similardifferences in species composition related to habitat conditions are reported inseveral instances (see Webb and Peart 2000; Scheller and Mladenoff 2002).
Size class (cm)
0 10 20 30 40 500.1
1
10
100
1000
0 10 20 30 40 50
Den
sity
(ha
-1)
0.1
1
10
100
1000Hathinala
Khatabaran
Majhauli
Bhawanikatariya
Kota
Den
sity
(ha
-1)
(a)
(b)
Diospyros melanoxylon
Terminalia tomentosa
Figure 4. Density–diameter distribution curve of (a) Diospyros melanoxylon and (b) Terminalia
tomentosa at different dry tropical forest sites.
944
PCA ordination also showed uniqueness of sites in terms of seedling compo-sition, but the seedling and adult distributions were not spatially associated.This indicated that seedling community on a site was distinct from the adulttree community. Webb and Peart (2000) argued that such a situation couldarise due to high survival of rare recruits to suboptimal habitats and highdensity-dependent mortality of seedlings in optimal habitats. We suggest thatthe distinct species composition at the different sites and at the two life-cyclestages (i.e. seedlings and adults) on the same site is indicative of marked spatio-temporal dynamics of the dry tropical forest. For example, on the Hathinalasite, as many as 16 species were found only as seedlings. Of these, 10 species did
Figure 5. (a) Species richness, evenness, alpha and beta diversity in a gradient of disturbance
(from least to highest) in the dry tropical forest region. (b) The k-dominance plot in which per-
centage cumulative abundances is plotted against log of species rank for each site.
945
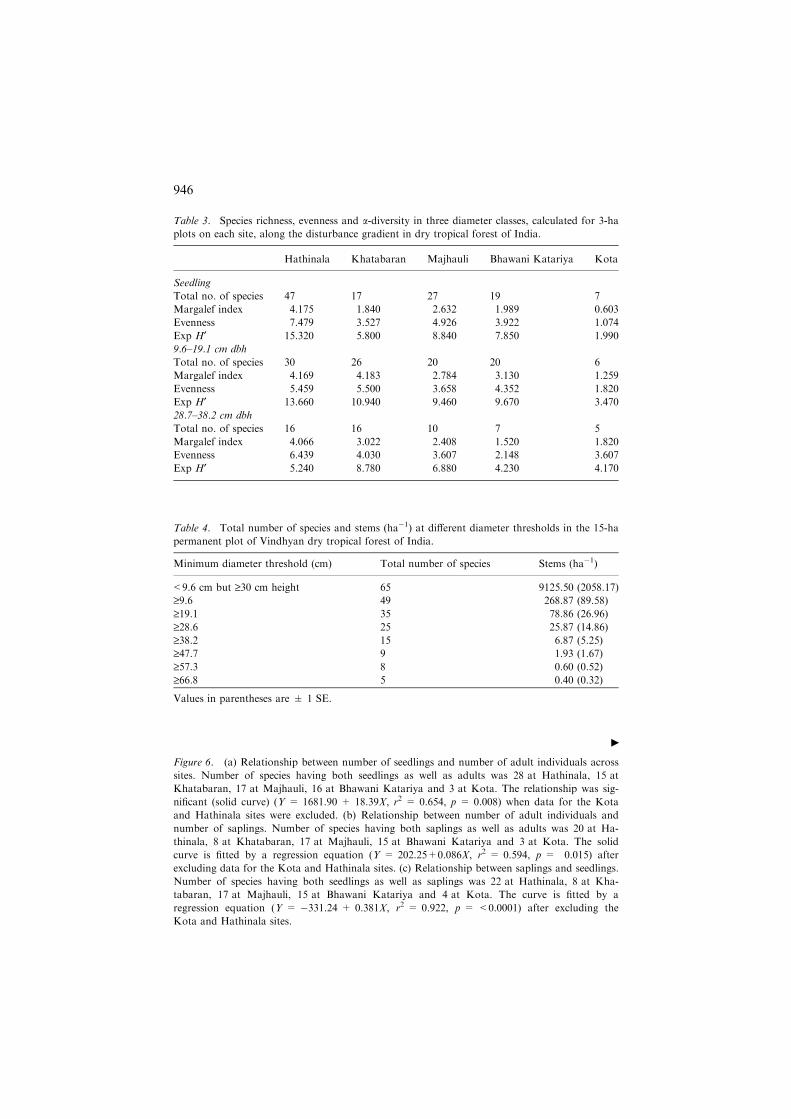
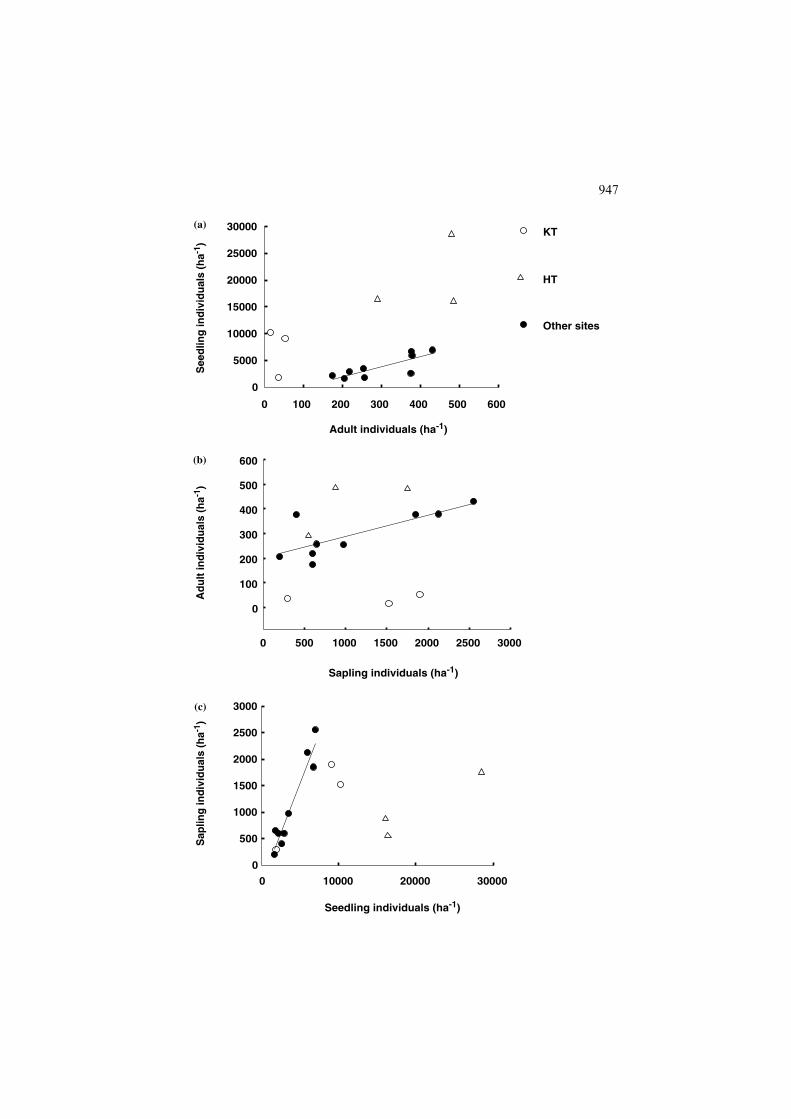
Figure 6. (a) Relationship between number of seedlings and number of adult individuals across
sites. Number of species having both seedlings as well as adults was 28 at Hathinala, 15 at
Khatabaran, 17 at Majhauli, 16 at Bhawani Katariya and 3 at Kota. The relationship was sig-
nificant (solid curve) (Y = 1681.90 + 18.39X, r2 = 0.654, p = 0.008) when data for the Kota
and Hathinala sites were excluded. (b) Relationship between number of adult individuals and
number of saplings. Number of species having both saplings as well as adults was 20 at Ha-
thinala, 8 at Khatabaran, 17 at Majhauli, 15 at Bhawani Katariya and 3 at Kota. The solid
curve is fitted by a regression equation (Y = 202.25+0.086X, r2 = 0.594, p = 0.015) after
excluding data for the Kota and Hathinala sites. (c) Relationship between saplings and seedlings.
Number of species having both seedlings as well as saplings was 22 at Hathinala, 8 at Kha-
tabaran, 17 at Majhauli, 15 at Bhawani Katariya and 4 at Kota. The curve is fitted by a
regression equation (Y = �331.24 + 0.381X, r2 = 0.922, p = <0.0001) after excluding the
Kota and Hathinala sites.
c
Table 3. Species richness, evenness and a-diversity in three diameter classes, calculated for 3-ha
plots on each site, along the disturbance gradient in dry tropical forest of India.
Hathinala Khatabaran Majhauli Bhawani Katariya Kota
Seedling
Total no. of species 47 17 27 19 7
Margalef index 4.175 1.840 2.632 1.989 0.603
Evenness 7.479 3.527 4.926 3.922 1.074
Exp H¢ 15.320 5.800 8.840 7.850 1.990
9.6–19.1 cm dbh
Total no. of species 30 26 20 20 6
Margalef index 4.169 4.183 2.784 3.130 1.259
Evenness 5.459 5.500 3.658 4.352 1.820
Exp H¢ 13.660 10.940 9.460 9.670 3.470
28.7–38.2 cm dbh
Total no. of species 16 16 10 7 5
Margalef index 4.066 3.022 2.408 1.520 1.820
Evenness 6.439 4.030 3.607 2.148 3.607
Exp H¢ 5.240 8.780 6.880 4.230 4.170
Table 4. Total number of species and stems (ha�1) at different diameter thresholds in the 15-ha
permanent plot of Vindhyan dry tropical forest of India.
Minimum diameter threshold (cm) Total number of species Stems (ha�1)
<9.6 cm but ‡30 cm height 65 9125.50 (2058.17)
‡9.6 49 268.87 (89.58)
‡19.1 35 78.86 (26.96)
‡28.6 25 25.87 (14.86)
‡38.2 15 6.87 (5.25)
‡47.7 9 1.93 (1.67)
‡57.3 8 0.60 (0.52)
‡66.8 5 0.40 (0.32)
Values in parentheses are ± 1 SE.
946
Adult individuals (ha-1)
0 100 200 300 400 500 600
See
dlin
g in
div
idu
als
(ha-1
)
0
5000
10000
15000
20000
25000
30000 KT
HT
Other sites
Sapling individuals (ha-1)
0 500 1000 1500 2000 2500 3000
Ad
ult
ind
ivid
ual
s (h
a-1)
0
100
200
300
400
500
600
Seedling individuals (ha-1)
0 10000 20000 30000
Sap
ling
ind
ivid
ual
s (h
a-1)
0
500
1000
1500
2000
2500
3000
(a)
(b)
(c)
947
not occur on any of the remaining four sites. On the other hand, at theKhatabaran site as many as 15 species occurred only as adult trees. Of these,three species did not occur on any of the other sites. At both the sites, speciescomposition would change in the future perhaps more rapidly at the Hathinalasite due to high rate of recruitment of species which were not present on the sitein the recent past. Khatabaran forest would decline in species compositionbecause more than 50% of the species currently occurring as adults are notregenerating.
The d–d distribution curves for different forests differ in their slope (Rollet1974). The semi-logarithmic d–d curves for all species at different sites rangedfrom near linear to overall concave appearance. The d–d curve plotted frompooled data for all sites also had a generally concave shape. However, all thecurves had a less- to well-developed plateau near the mid-diameter range. Theplateau resulted into a rotation from a concave form at the left to a convexform at the middle part of the curve. The steeper part at the left end of thesecurves shows under-representation of saplings/small dbh individuals, indicat-ing slow growth of seedlings into saplings or a marked mortality of saplingsdue to canopy-understorey competition. It is also less labour-intensive and easyto harvest saplings/small trees illegally for fuel wood. The appearance of
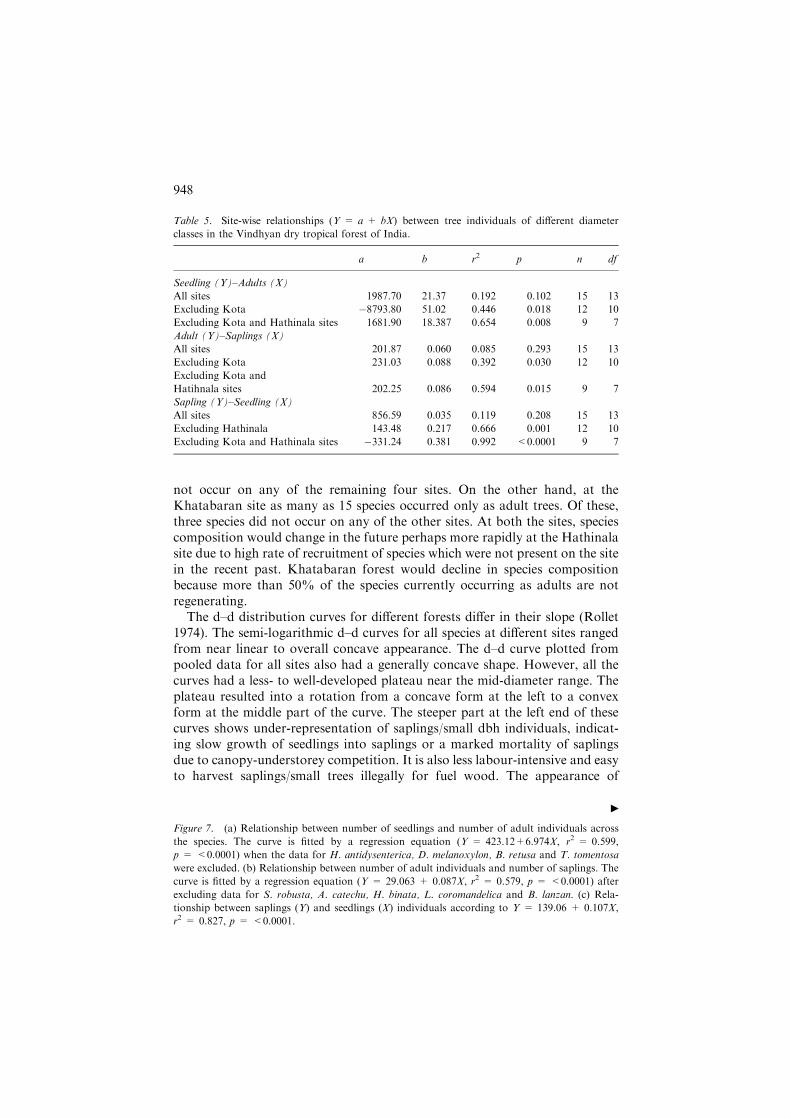
Table 5. Site-wise relationships (Y = a + bX) between tree individuals of different diameter
classes in the Vindhyan dry tropical forest of India.
a b r2 p n df
Seedling (Y)–Adults (X)
All sites 1987.70 21.37 0.192 0.102 15 13
Excluding Kota �8793.80 51.02 0.446 0.018 12 10
Excluding Kota and Hathinala sites 1681.90 18.387 0.654 0.008 9 7
Adult (Y)–Saplings (X)
All sites 201.87 0.060 0.085 0.293 15 13
Excluding Kota 231.03 0.088 0.392 0.030 12 10
Excluding Kota and
Hatihnala sites 202.25 0.086 0.594 0.015 9 7
Sapling (Y)–Seedling (X)
All sites 856.59 0.035 0.119 0.208 15 13
Excluding Hathinala 143.48 0.217 0.666 0.001 12 10
Excluding Kota and Hathinala sites �331.24 0.381 0.992 <0.0001 9 7
Figure 7. (a) Relationship between number of seedlings and number of adult individuals across
the species. The curve is fitted by a regression equation (Y = 423.12+6.974X, r2 = 0.599,
p = <0.0001) when the data for H. antidysenterica, D. melanoxylon, B. retusa and T. tomentosa
were excluded. (b) Relationship between number of adult individuals and number of saplings. The
curve is fitted by a regression equation (Y = 29.063 + 0.087X, r2 = 0.579, p = <0.0001) after
excluding data for S. robusta, A. catechu, H. binata, L. coromandelica and B. lanzan. (c) Rela-
tionship between saplings (Y) and seedlings (X) individuals according to Y = 139.06 + 0.107X,
r2 = 0.827, p = <0.0001.
c
948

Adult individuals (ha-1)
0 100 200 300 400 500 600 700
See
dlin
g in
div
idu
als
(ha-1
)
0
5000
10000
15000
20000
25000
30000
ha
dm
br
tt
Sapling individuals (ha-1)
0 500 1000 1500 2000 2500 3000 3500
Ad
ult
ind
ivid
ual
s (h
a-1)
0
100
200
300
400
500
600
700sr
ac
hb
lcbl
Seedling individuals (ha-1)
0 5000 10000 15000 20000 25000 30000
Sap
ling
ind
ivid
ual
s (h
a-1)
0
500
1000
1500
2000
2500
3000
3500
(a)
(b)
(c)
949
concavity beyond intermediate dbh classes is evidently because of decreasingremoval rate across successively larger dbh classes as argued by West et al.(1981). According to West et al. (1981), the plateau in the d–d curve is pro-duced by increased growth rate or an actual decrease in mortality rate in theintermediate diameter classes. Such a rotated sigmoid curve with an over allconcave appearance seems to be typical of deciduous forests (Leak 1973)particularly for small stands, free from gaps or pockets of even-aged trees (Goffand West 1975; Ranney 1978). The relatively straight-line d–d curve for theMajhauli site, as also for Hathinala and Kota sites, would indicate a prepon-derance of populations containing small mean tree diameters. The paucity ofold trees indicates heavy removal of mature trees in the past.
In this study, population structure of individual species varied across sites.For example, the d–d curve for D. melanoxylon was concave at Hathinala andBhawani Katariya sites, sigmoid at Khatabaran and Majhauli sites and linearat Kota site. The d–d curve of T. tomentosa was sigmoid at Bhawani Katariyaand Hathinala sites, and linear and convex for Majhauli and Khatabaran sites,respectively. The shape of the curves for individual species has been interpretedas indicating their shade tolerance–intolerance abilities (West et al. 1981;Saxena et al. 1984). According to West et al. (1981), the curves for shade-intolerant trees were convex or relatively straight, and for shade-tolerant spe-cies it would be concave. The present study indicates that the shape of the curveis not associated with shade-tolerance behaviour of a species, as the samespecies showed different shapes at different sites, but may be due to differentlevels of anthropogenic disturbance and species composition at different sites.
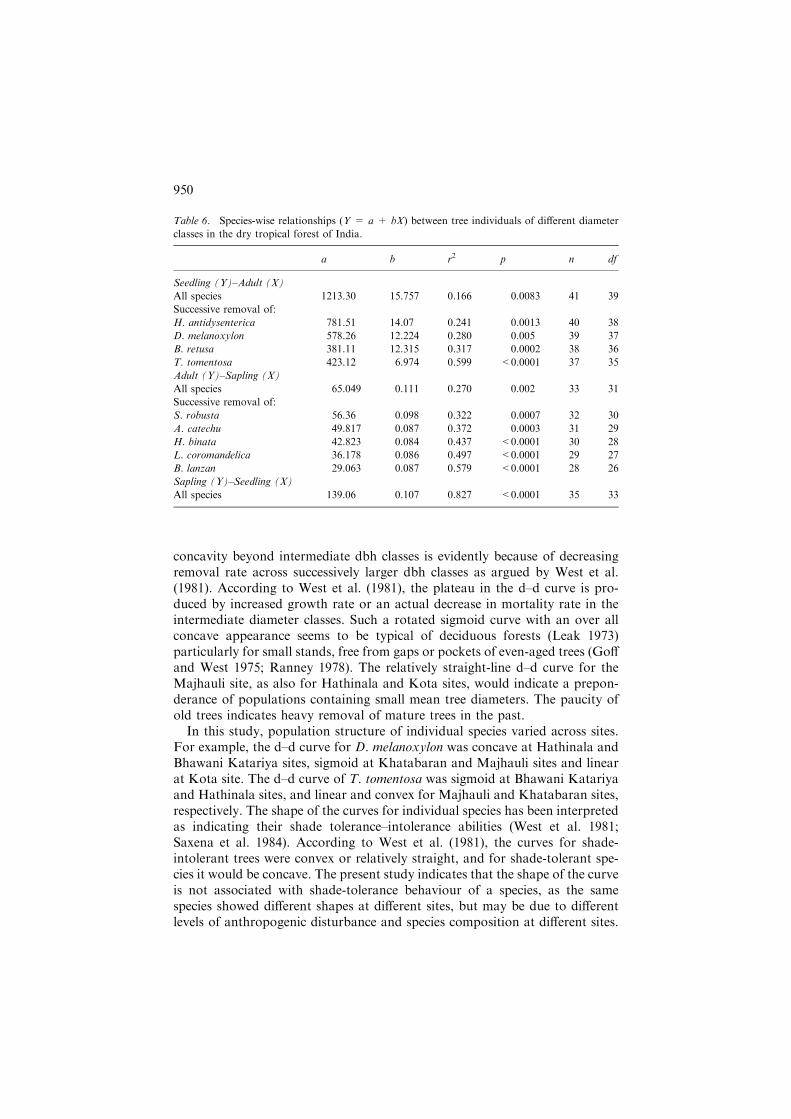
Table 6. Species-wise relationships (Y = a + bX) between tree individuals of different diameter
classes in the dry tropical forest of India.
a b r2 p n df
Seedling (Y)–Adult (X)
All species 1213.30 15.757 0.166 0.0083 41 39
Successive removal of:
H. antidysenterica 781.51 14.07 0.241 0.0013 40 38
D. melanoxylon 578.26 12.224 0.280 0.005 39 37
B. retusa 381.11 12.315 0.317 0.0002 38 36
T. tomentosa 423.12 6.974 0.599 <0.0001 37 35
Adult (Y)–Sapling (X)
All species 65.049 0.111 0.270 0.002 33 31
Successive removal of:
S. robusta 56.36 0.098 0.322 0.0007 32 30
A. catechu 49.817 0.087 0.372 0.0003 31 29
H. binata 42.823 0.084 0.437 <0.0001 30 28
L. coromandelica 36.178 0.086 0.497 <0.0001 29 27
B. lanzan 29.063 0.087 0.579 <0.0001 28 26
Sapling (Y)–Seedling (X)
All species 139.06 0.107 0.827 <0.0001 35 33
950
Species diversity
Tropical forests are structurally complex plant communities (Phillips andGentry 1994; Condit et al. 1996). One of the characteristic features of theseforests is their high species richness (Ayyappan and Parthasarathy 1999). Weenumerated 49 species in the Vindhyan dry tropical forest from the 15-ha areadistributed over five sites. The values reported from large scale permanent plotinventories in wet tropical forests (for trees ‡10 cm dbh) were 996 species in a52 ha plot of Lambir National Park, Malaysia (Condit et al. 2000); 660 speciesin a 50 ha plot of Pasoh forest reserve, Malaysia (Kochummen et al. 1990), 229species in a 50 ha Barro Colorado Island, Panama (Condit et al. 1996); 153species in a 30 ha plot at Varagalaiar, Anamalais, Western Ghat, India (Ay-yappan and Parthasarathy 2001), 164 species in a 25 ha plot of SinharajaBiosphere reserve, Sri Lanka (Condit et al. 2000).
The species richness of individual sample plots (1 ha) in the present study fortrees ‡10 cm dbh ranged from 3 to 28 species, with a mean value of 16 speciesha�1 . This is low when compared with the range across the tropics, 20 speciesha�1 in Varzea forest of Rio Xingu, Brazil (Campbell et al. 1992) to as high as307 species ha�1 in Amazonian Ecuador (Valencia et al. 1994).
A total of 4033 stems were recorded in the 15 ha area with a mean value of268.9 stems ha�1 ; on hectare basis this number ranged from 16 to 485. The treedensity (ha�1) in some large scale permanent plot studies were: 537.6 tree inCosta Rica (Lieberman et al. 1996), 530 in Malaysia (Manokaran and La-Frankie 1990), 424.8 in BCI Panama and from 300 to 635 trees in the WesternGhats, India (Condit et al. 1996; Pascal and Pelissier 1996; Ghate et al. 1998;Ayyappan and Parthasarathy 1999, 2001).
The decreasing trend of a-diversity and its components along the pertur-bation intensity, as noted in this study, reflects enhanced utilization pressure(Bhat et al. 2000). Increasing disturbance can also lead to decreased resourceavailability (Brokaw 1985). The k-dominance measures intrinsic diversity(Lambshead et al. 1983). Platt et al. (1984) opined that diversity can only beunambiguously assessed when the k-dominance curves from the communitiesto be compared do not overlap. In this situation the lowest curve will representthe most diverse community. Thus in the present study, diversity was maxi-mum for the least disturbed Hathinala site and minimum for the highly dis-turbed Kota site. The curves for Khatabaran, Majhauli and Bhawani Katariyashowed intermediate diversity in consonance with intermediate level of dis-turbance; however, according to Platt et al. (1984), these sites cannot be dis-criminated among themselves, because their curves intersect each other.
Regeneration
In nature, species diversity is maintained through regeneration of componentspecies. We assumed that the adult individuals on a site or of a species
951
constitute the reproductive pool. Therefore, under normal conditions in aforest one would expect a significant relationship between number of adultindividuals and number of seedlings. This study indicated that the relation-ship between the number of seedlings and adult individuals attained statisticalsignificance only when data for the Kota site was removed. With furtherexclusion of the Hathinala site, there was a significant increase in the r2 value.On both these sites, particularly on the Hathinala site, the number of seed-lings were disproportionally higher compared to the adult individuals, indi-cating massive seed production and/or high seedling establishment, whichcould lead to higher recruitment of adults if anthropogenic pressure iscontrolled.
It is further assumed that the saplings on a site or of a species is theimmediate source of the adult individuals. Therefore, under normal conditionsthere should be a significant relationship between number of saplings andnumber of adult individuals. This study showed that the relationship betweennumber of saplings and adult individuals was significant, only when data forthe Kota site was removed. With further removal of the Hathinala site therewas a significant increase in the r2 value. While on the Kota site, saplings werenot successfully converting into adult trees, presumably due to biotic removal,on the Hathinala site the success of saplings was much greater compared toother sites due to minimum anthropogenic pressure.
Under normal conditions one would expect a significant relationship be-tween saplings and seedlings, as the latter constitute a source of the former.This study showed that the relationship between number of saplings andseedlings was significant only when data for the Hathinala site were removed.With further exclusion of Kota site, there was a significant increase in the r2
value. Apparently on these sites, the success of seedling conversion to saplinghas relatively been lower. Illegal harvest of saplings and density-dependentmortality of seedlings could be possible reasons for low recruitment of saplings.The above analyses indicate that both the least disturbed as well as the mostdisturbed sites did not fall within the pattern exhibited by the sites withintermediate level of disturbance. Perhaps both these situations (i.e. least andheavy disturbance) are unusual for the dry deciduous forest, which has had along evolutionary history of moderate human pressure (Murphy and Lugo1986).
On the species basis, pooling of data for all the five sites, the study indicatedthat the relationship between the number of seedlings and adult individuals wassignificant, although the r2 value was low when all species having both adultsand seedlings were used. With the removal of H. antidysenterica, D. mela-noxylon, B. retusa and T. tomentosa there was a significant increase in the r2
value. Of these species, D. melanoxylon and H. antidysenterica are excellentcoppicers, B. retusa and T. tomentosa are conserved for seed production(Upadhyay and Srivastava 1980; Harikant and Ghildiyal 1982). These specieswere particularly preponderant in the seedling population at Hathinala orKota sites. The study further indicated that the relationship between number of
952
saplings and adult individuals was significant when data for all species wereused, but with low r2 value. With the exclusion of S. robusta, A. catechu,H. binata, Lannea coromandelica and Buchanania lanzan, there was a significantincrease in the r2 value. These species are economically valuable and enjoyrelatively greater protection. In these species greater number of saplings suc-cessfully progressed to adult stage, compared to the other species. It is alsointeresting to note that species which were highly prolific in seedling produc-tion were different from species which showed disproportionately higher sap-ling success. It is also evident that although the number of saplings was a directfunction of the number of seedlings across all species, there was considerablemortality of seedlings.
Thus, the study indicates that both the level of disturbance and the nature ofspecies strongly affect regeneration. Although the forest is relatively species-poor, the differential species combinations on different sites and the temporaldynamics lend a unique level of diversity to the tropical dry deciduous forest. Itis also evident that large areas need be maintained for conservation of thespatio-dynamic nature of the dry deciduous forest.
Conservation needs
The study points out an urgent need for the conservation of biodiversity of thenorthern dry tropical forest of India. The marked spatio-temporaldynamics and demographic instability both at site and species levels indicatethat fragmentation will likely to enhance the loss of species diversity. Strictmeasures, therefore, are needed to curb fragmentation, and the existingfragments need to be connected through afforestation of indigenous species.The free-range grazing in the forest needs to be banned. Thus strongerprotection and regulatory measures are required. It has been argued thatdry forests have the potential to recover to a mature state more quicklythan do wet forests, and hence are more resilient (Ewel 1977; Murphy andLugo 1986). However, such measures will fail unless fuel and fodderrequirements of the local inhabitants are met. Singh and Singh (1989, 1992)estimated that the wood extracted from these forests meets 81–100% energyneeds of the local populations, and as much as 38% of the total woodextracted is marketed for buying food grain and other requirements (Singhand Singh 1992). These forests support 80–95% of the fodder needs (Singhand Singh 1992). Systematic fuel-wood plantations of fast growing trees onthe village commons and setting aside selected forest compartments forraising high density short rotation energy plantations, and developing villagepastures with a mixture of grasses and legumes with scattered native foddertrees (such as H. binata, Dalbergia sissoo and Holoptelia integrifolia), couldbe a viable strategy for easing the anthropogenic pressure on these forests.In addition, the existing vegetation on various sites may be enriched by seed-ing and planting of field-collected or nursery-raised seedlings of desired
953
native species through aggressive forestry. Further, there is a need to integratethe livelihood of local human populations with conservation measures throughparticipatory forest management such that the local inhabitants are able toappropriate a large share of benefits from conservation of these forests.
Acknowledgement
Funding support from the Ministry of Environment & Forests, Government ofIndia, is acknowledged. One of us (J.S.S.) is supported by the CSIR EmeritusScientist Scheme.
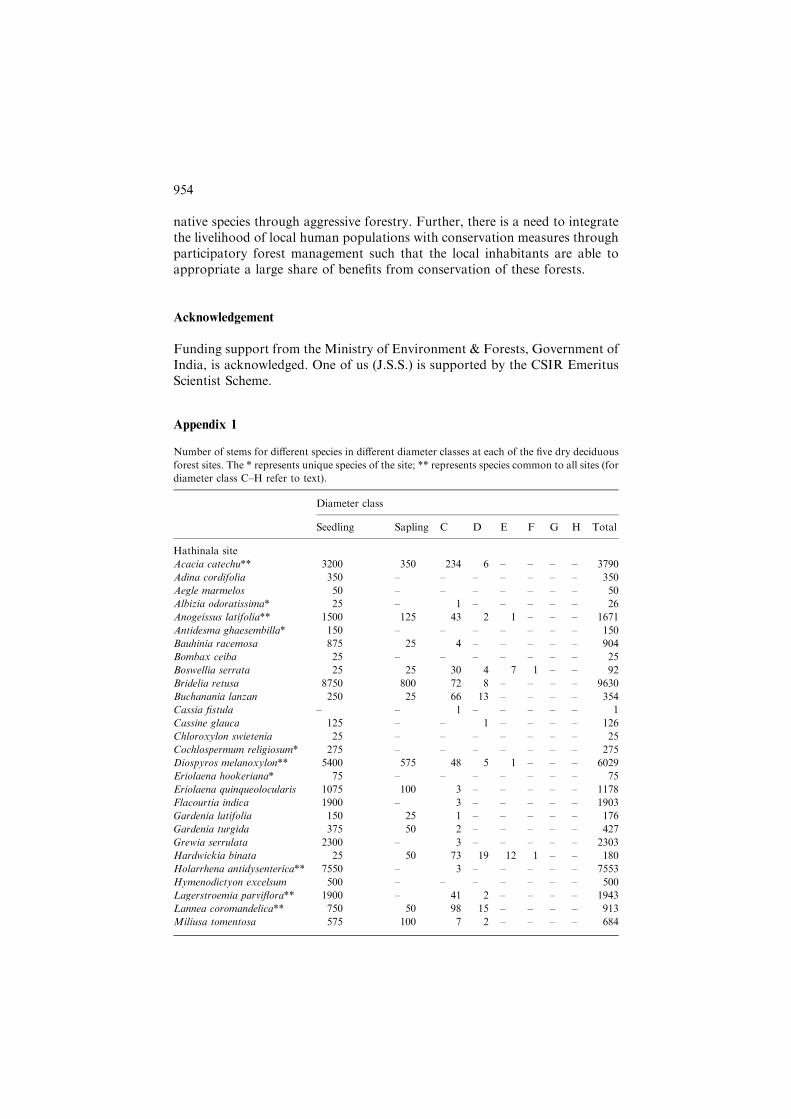
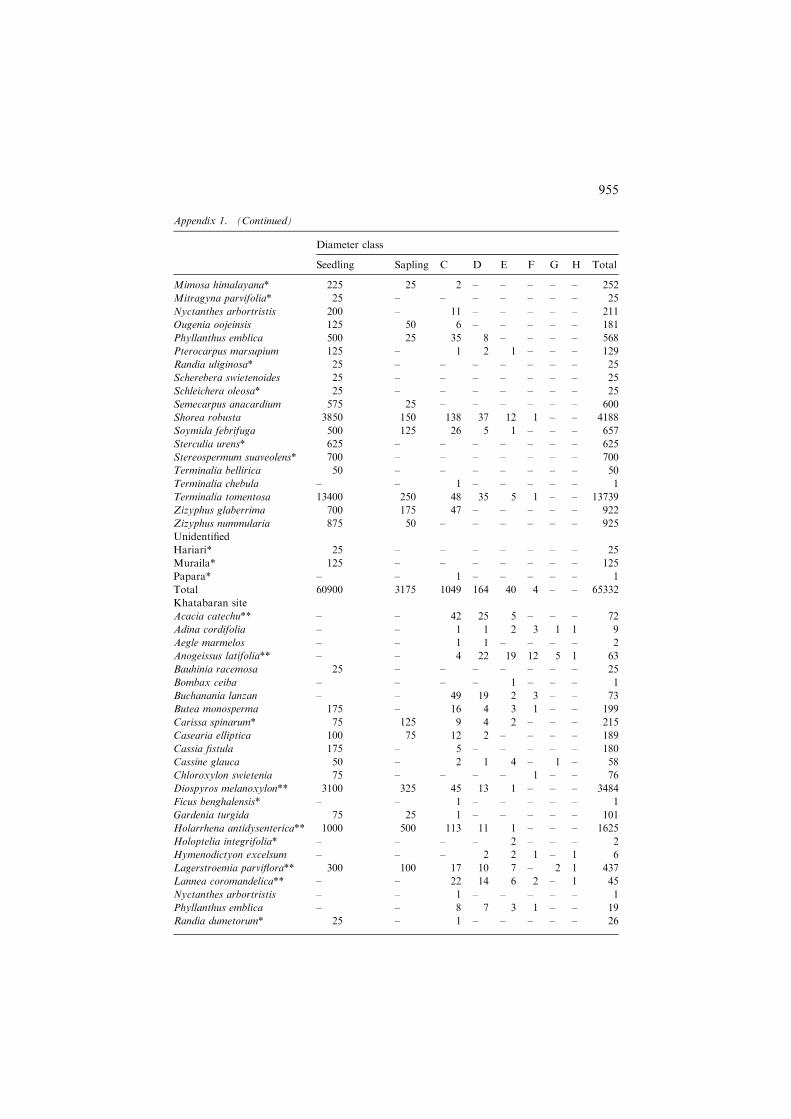
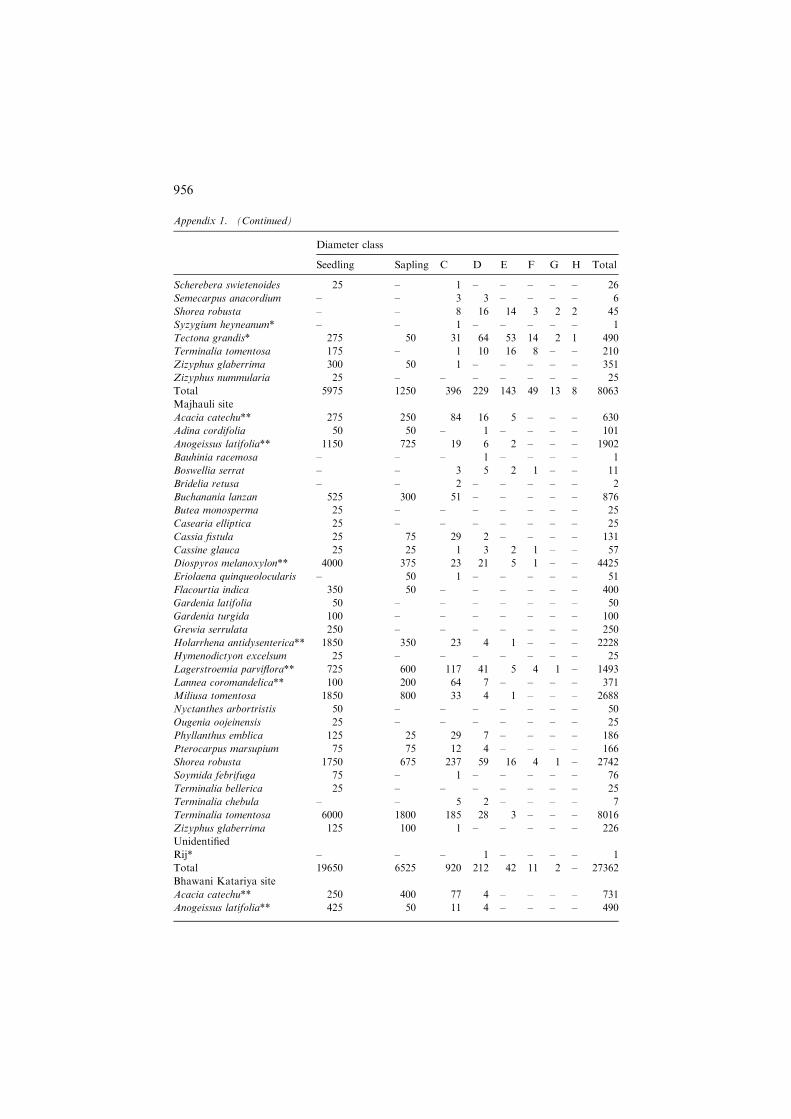
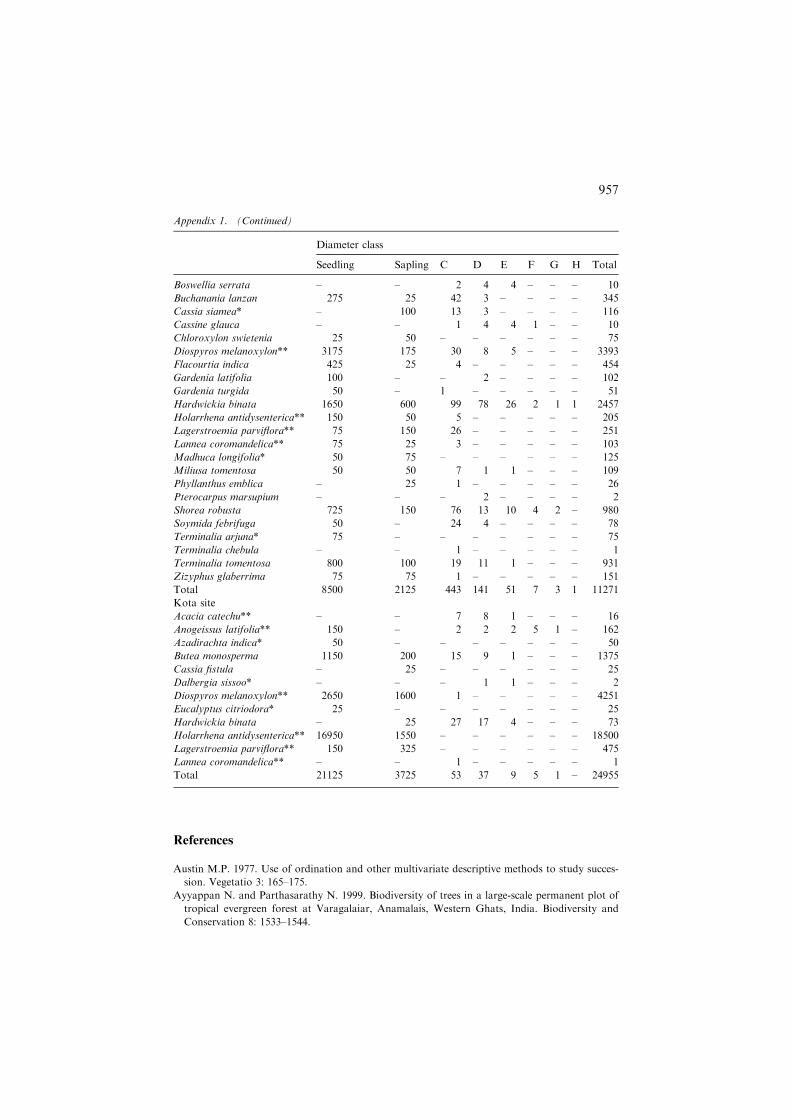
Appendix 1
Number of stems for different species in different diameter classes at each of the five dry deciduous
forest sites. The * represents unique species of the site; ** represents species common to all sites (for
diameter class C–H refer to text).
Diameter class
Seedling Sapling C D E F G H Total
Hathinala site
Acacia catechu** 3200 350 234 6 – – – – 3790
Adina cordifolia 350 – – – – – – – 350
Aegle marmelos 50 – – – – – – – 50
Albizia odoratissima* 25 – 1 – – – – – 26
Anogeissus latifolia** 1500 125 43 2 1 – – – 1671
Antidesma ghaesembilla* 150 – – – – – – – 150
Bauhinia racemosa 875 25 4 – – – – – 904
Bombax ceiba 25 – – – – – – – 25
Boswellia serrata 25 25 30 4 7 1 – – 92
Bridelia retusa 8750 800 72 8 – – – – 9630
Buchanania lanzan 250 25 66 13 – – – – 354
Cassia fistula – – 1 – – – – – 1
Cassine glauca 125 – – 1 – – – – 126
Chloroxylon swietenia 25 – – – – – – – 25
Cochlospermum religiosum* 275 – – – – – – – 275
Diospyros melanoxylon** 5400 575 48 5 1 – – – 6029
Eriolaena hookeriana* 75 – – – – – – – 75
Eriolaena quinqueolocularis 1075 100 3 – – – – – 1178
Flacourtia indica 1900 – 3 – – – – – 1903
Gardenia latifolia 150 25 1 – – – – – 176
Gardenia turgida 375 50 2 – – – – – 427
Grewia serrulata 2300 – 3 – – – – – 2303
Hardwickia binata 25 50 73 19 12 1 – – 180
Holarrhena antidysenterica** 7550 – 3 – – – – – 7553
Hymenodictyon excelsum 500 – – – – – – – 500
Lagerstroemia parviflora** 1900 – 41 2 – – – – 1943
Lannea coromandelica** 750 50 98 15 – – – – 913
Miliusa tomentosa 575 100 7 2 – – – – 684
954
Appendix 1. (Continued)
Diameter class
Seedling Sapling C D E F G H Total
Mimosa himalayana* 225 25 2 – – – – – 252
Mitragyna parvifolia* 25 – – – – – – – 25
Nyctanthes arbortristis 200 – 11 – – – – – 211
Ougenia oojeinsis 125 50 6 – – – – – 181
Phyllanthus emblica 500 25 35 8 – – – – 568
Pterocarpus marsupium 125 – 1 2 1 – – – 129
Randia uliginosa* 25 – – – – – – – 25
Scherebera swietenoides 25 – – – – – – – 25
Schleichera oleosa* 25 – – – – – – – 25
Semecarpus anacardium 575 25 – – – – – – 600
Shorea robusta 3850 150 138 37 12 1 – – 4188
Soymida febrifuga 500 125 26 5 1 – – – 657
Sterculia urens* 625 – – – – – – – 625
Stereospermum suaveolens* 700 – – – – – – – 700
Terminalia bellirica 50 – – – – – – – 50
Terminalia chebula – – 1 – – – – – 1
Terminalia tomentosa 13400 250 48 35 5 1 – – 13739
Zizyphus glaberrima 700 175 47 – – – – – 922
Zizyphus nummularia 875 50 – – – – – – 925
Unidentified
Hariari* 25 – – – – – – – 25
Muraila* 125 – – – – – – – 125
Papara* – – 1 – – – – – 1
Total 60900 3175 1049 164 40 4 – – 65332
Khatabaran site
Acacia catechu** – – 42 25 5 – – – 72
Adina cordifolia – – 1 1 2 3 1 1 9
Aegle marmelos – – 1 1 – – – – 2
Anogeissus latifolia** – – 4 22 19 12 5 1 63
Bauhinia racemosa 25 – – – – – – – 25
Bombax ceiba – – – – 1 – – – 1
Buchanania lanzan – – 49 19 2 3 – – 73
Butea monosperma 175 – 16 4 3 1 – – 199
Carissa spinarum* 75 125 9 4 2 – – – 215
Casearia elliptica 100 75 12 2 – – – – 189
Cassia fistula 175 – 5 – – – – – 180
Cassine glauca 50 – 2 1 4 – 1 – 58
Chloroxylon swietenia 75 – – – – 1 – – 76
Diospyros melanoxylon** 3100 325 45 13 1 – – – 3484
Ficus benghalensis* – – 1 – – – – – 1
Gardenia turgida 75 25 1 – – – – – 101
Holarrhena antidysenterica** 1000 500 113 11 1 – – – 1625
Holoptelia integrifolia* – – – – 2 – – – 2
Hymenodictyon excelsum – – – 2 2 1 – 1 6
Lagerstroemia parviflora** 300 100 17 10 7 – 2 1 437
Lannea coromandelica** – – 22 14 6 2 – 1 45
Nyctanthes arbortristis – – 1 – – – – – 1
Phyllanthus emblica – – 8 7 3 1 – – 19
Randia dumetorum* 25 – 1 – – – – – 26
955
Appendix 1. (Continued)
Diameter class
Seedling Sapling C D E F G H Total
Scherebera swietenoides 25 – 1 – – – – – 26
Semecarpus anacordium – – 3 3 – – – – 6
Shorea robusta – – 8 16 14 3 2 2 45
Syzygium heyneanum* – – 1 – – – – – 1
Tectona grandis* 275 50 31 64 53 14 2 1 490
Terminalia tomentosa 175 – 1 10 16 8 – – 210
Zizyphus glaberrima 300 50 1 – – – – – 351
Zizyphus nummularia 25 – – – – – – – 25
Total 5975 1250 396 229 143 49 13 8 8063
Majhauli site
Acacia catechu** 275 250 84 16 5 – – – 630
Adina cordifolia 50 50 – 1 – – – – 101
Anogeissus latifolia** 1150 725 19 6 2 – – – 1902
Bauhinia racemosa – – – 1 – – – – 1
Boswellia serrat – – 3 5 2 1 – – 11
Bridelia retusa – – 2 – – – – – 2
Buchanania lanzan 525 300 51 – – – – – 876
Butea monosperma 25 – – – – – – – 25
Casearia elliptica 25 – – – – – – – 25
Cassia fistula 25 75 29 2 – – – – 131
Cassine glauca 25 25 1 3 2 1 – – 57
Diospyros melanoxylon** 4000 375 23 21 5 1 – – 4425
Eriolaena quinqueolocularis – 50 1 – – – – – 51
Flacourtia indica 350 50 – – – – – – 400
Gardenia latifolia 50 – – – – – – – 50
Gardenia turgida 100 – – – – – – – 100
Grewia serrulata 250 – – – – – – – 250
Holarrhena antidysenterica** 1850 350 23 4 1 – – – 2228
Hymenodictyon excelsum 25 – – – – – – – 25
Lagerstroemia parviflora** 725 600 117 41 5 4 1 – 1493
Lannea coromandelica** 100 200 64 7 – – – – 371
Miliusa tomentosa 1850 800 33 4 1 – – – 2688
Nyctanthes arbortristis 50 – – – – – – – 50
Ougenia oojeinensis 25 – – – – – – – 25
Phyllanthus emblica 125 25 29 7 – – – – 186
Pterocarpus marsupium 75 75 12 4 – – – – 166
Shorea robusta 1750 675 237 59 16 4 1 – 2742
Soymida febrifuga 75 – 1 – – – – – 76
Terminalia bellerica 25 – – – – – – – 25
Terminalia chebula – – 5 2 – – – – 7
Terminalia tomentosa 6000 1800 185 28 3 – – – 8016
Zizyphus glaberrima 125 100 1 – – – – – 226
Unidentified
Rij* – – – 1 – – – – 1
Total 19650 6525 920 212 42 11 2 – 27362
Bhawani Katariya site
Acacia catechu** 250 400 77 4 – – – – 731
Anogeissus latifolia** 425 50 11 4 – – – – 490
956
References
Austin M.P. 1977. Use of ordination and other multivariate descriptive methods to study succes-
sion. Vegetatio 3: 165–175.
Ayyappan N. and Parthasarathy N. 1999. Biodiversity of trees in a large-scale permanent plot of
tropical evergreen forest at Varagalaiar, Anamalais, Western Ghats, India. Biodiversity and
Conservation 8: 1533–1544.
Appendix 1. (Continued)
Diameter class
Seedling Sapling C D E F G H Total
Boswellia serrata – – 2 4 4 – – – 10
Buchanania lanzan 275 25 42 3 – – – – 345
Cassia siamea* – 100 13 3 – – – – 116
Cassine glauca – – 1 4 4 1 – – 10
Chloroxylon swietenia 25 50 – – – – – – 75
Diospyros melanoxylon** 3175 175 30 8 5 – – – 3393
Flacourtia indica 425 25 4 – – – – – 454
Gardenia latifolia 100 – – 2 – – – – 102
Gardenia turgida 50 – 1 – – – – – 51
Hardwickia binata 1650 600 99 78 26 2 1 1 2457
Holarrhena antidysenterica** 150 50 5 – – – – – 205
Lagerstroemia parviflora** 75 150 26 – – – – – 251
Lannea coromandelica** 75 25 3 – – – – – 103
Madhuca longifolia* 50 75 – – – – – – 125
Miliusa tomentosa 50 50 7 1 1 – – – 109
Phyllanthus emblica – 25 1 – – – – – 26
Pterocarpus marsupium – – – 2 – – – – 2
Shorea robusta 725 150 76 13 10 4 2 – 980
Soymida febrifuga 50 – 24 4 – – – – 78
Terminalia arjuna* 75 – – – – – – – 75
Terminalia chebula – – 1 – – – – – 1
Terminalia tomentosa 800 100 19 11 1 – – – 931
Zizyphus glaberrima 75 75 1 – – – – – 151
Total 8500 2125 443 141 51 7 3 1 11271
Kota site
Acacia catechu** – – 7 8 1 – – – 16
Anogeissus latifolia** 150 – 2 2 2 5 1 – 162
Azadirachta indica* 50 – – – – – – – 50
Butea monosperma 1150 200 15 9 1 – – – 1375
Cassia fistula – 25 – – – – – – 25
Dalbergia sissoo* – – – 1 1 – – – 2
Diospyros melanoxylon** 2650 1600 1 – – – – – 4251
Eucalyptus citriodora* 25 – – – – – – – 25
Hardwickia binata – 25 27 17 4 – – – 73
Holarrhena antidysenterica** 16950 1550 – – – – – – 18500
Lagerstroemia parviflora** 150 325 – – – – – – 475
Lannea coromandelica** – – 1 – – – – – 1
Total 21125 3725 53 37 9 5 1 – 24955
957

Ayyappan N. and Parthasarathy N. 2001. Patterns of tree diversity within a large scale permanent
plot of tropical evergreen forest, Western Ghats, India. Ecotropica 7: 61–76.
Bhat D.M., Naik M.B., Patagar S.G., Hegde G.T., Kanade Y.G., Hegde G.N., Shastri C.M., Shetti
D.M. and Furtado R.M. 2000. Forest dynamics in tropical rain forests of Uttra Khannada
district in Western Ghats, India. Current Science 79: 975–985.
Biodiversity Pro 1997. www.sams.ac.uk/dml/projects/benthic/bdpro.
Brokaw N.V.L. 1985. Tree falls, regrowth and community structure in tropical forests. In: Pickett
T.A. and White P.S. (eds), The Ecology of Natural Disturbances and Patch Dynamics. Academic
Press, Orlando, Florida, pp. 53–69.
Campbell D.G., Stone J.L. and Rosas A. Jr. 1992. A comparison of the phytosociology and
dynamics of three floodplain (Varzea) forest of known ages, Rio, Jurua, Western Brazilian
Amazoan. Botanical Journal of the Linnean Society 108: 213–237.
Champion H.G. and Seth S.K. 1968. A Revised Survey of the Forest Types of India. Government
of India Publication, New Delhi, India.
Condit R. 1995. Research in large long-term tropical forest plots. Trends in Ecology and Evolution
10: 18–22.
Condit R., Ashton P.S., Baker P., Bunyavejchewin S., Gunatilleke S. and Gunatilleke N. et al.
2000. Spatial patterns in the distribution of tree species. Science 288: 1414–1418.
Condidt R., Hubbell S.P., La Frankie J.V., Sukumar R., Manokaran N., Foster R.B. and Ashton
P.S. 1996. Species-area and species–individual relationships for tropical trees: a comparison of
three 50-ha plots. Journal of Ecology 84: 549–562.
Ewel J.J. 1977. Differences between wet and dry successional tropical ecosystem. Geo-Eco-Trop 1:
103–117.
Field C.B. and Vazquezyanes C. 1993. Species of the genus Piper provide a model to study how
plants can grow in different kinds of rain-forest habitat. Interciencia 18: 230–236.
Ghate U., Joshi N.V. and Gadgil M. 1998. On the patterns of tree diversity in the Western Ghats of
India. Current Science 75: 594–603.
Goff F.G. and West D.C. 1975. Canopy-understorey interaction effects on forest population
structure. Forest Science 21: 98–108.
Harikant and Ghildiyal M.C. 1982. Working Plan. Renukoot Forest Division South Circle Uttar
Pradesh from 1982–83 to 1991–92. Working Plan Circle (2), Nainital, India.
Hill M.O. 1973. Diversity and evenness: a unifying notation and its consequences. Ecology 54: 427–
432.
Janzen D.H. 1988. Management of habitat fragments in a tropical dry forest: growth. Annals of the
Missouri Botanical Garden 75: 105–116.
Jha C.S. and Singh J.S. 1990. Composition and dynamics of dry tropical forest in relation to soil
texture. Journal of Vegetational Science 1: 609–614.
Kochummen K.M., LaFrankie J.V. Jr. and Manokaran N. 1990. Floristic composition of Pasoh
forest reserves, a lowland rainforest in peninsular Malaysia. Journal of Tropical Forest Science 3:
1–13.
Krebs C.J. 1989. Ecological Methodology. Harper and Row, New York.
Lambshead P.J.D., Platt H.M. and Shaw K.M. 1983. Detection of differences among assemblages
of marine benthic species based on an assessment of dominance and diversity. Journal of Natural
History 17: 859–874.
Leak W.B. 1973. Species and structure of a virgin northern hardwood stand in New Hampshire.
USDA Forest Services. Research. Note NE-181. 4 pp.
Lieberman D., Lieberman M., Peralaba R. and Hartshorn G.S. 1996. Tropical forest structure and
composition on a large scale altitudinal gradients in Costa Rica. Journal of Ecology 84: 137–152.
Manokaran N. and LaFrankie J.V. Jr. 1990. Stand structure of Pasoh forest reserve, a lowland rain
forest in Peninsular Malaysia. Jounal of Tropical Forest Science 3: 14–24.
Margalef D.R. 1958. Information theory in ecology. Genetic Systems 3: 36–71.
Murphy P.G. and Lugo A.E. 1986. Ecology of tropical dry forest. Annual Reviews of Ecology and
Systematics 17: 67–88.
958
Pascal J.P. and Pelissier R. 1996. Structure and floristic composition of a tropical evergreen forest
in a south-west India. Journal of Tropological Ecology 12: 191–214.
Phillips O.L. and Gentry A.H. 1994. Increasing turnover through time in tropical forests. Science
263: 954–958.
Platt H.M., Shaw K.M. and Lambshead P.J.D. 1984. Nematode species abundance patterns and
their use in the detection of environmental perturbations. Hydrobiologia 118: 59–66.
Rajya Niyojan Sansthan. 2000. Sankhykiya Patrika: Janpad Sonebhadra Karyalaya Arth aunam
Sankhya Prabhag Rajya Niyojan Sansthan, Uttar Pradesh, India.
Ranney J.W. 1978. Edges of forest islands: structure, comosition, and importance to regional forest
dynamics. Ph.D. Thesis, Graduate Program in Ecology, University of Tennessee, Knoxville,
Tennessee. Diss. Abstr. Int. vol. 39: 2648–2648-B. Univ. Microfilm no. 782334. 193 pp.
Rollet B. 1974. L’Architecture des Forets Denses Humides Sempervirentes do Plaine. CTFT,
Nogent-sur-Marne, France.
Sagar R., Raghubanshi A.S. and Singh J.S. 2003. Tree species composition, dispersion and
diversity along a disturbance gradient in a dry tropical forest region of India. Forest Ecology and
Management 186: 61–71.
Sagar R. and Singh J.S. 2003. Predominant phenotypic traits of disturbed tropical dry deciduous
forest vegetation in northern India. Community Ecology 4(1): 63–71.
Saxena A.K. and Singh J.S. 1984. Tree population structure of certain Himalayan forest associa-
tions and implications concerning their future composition. Vegetatio 58: 61–69.
Saxena A.K., Singh S.P. and Singh J.S. 1984. Population structure of forests of Kumaun Himalaya:
implications for management. Journal of Environmental Management 190: 307–324.
Scheller R.M. and Mladenoff D.J. 2002. Understory species patterns and diversity in old-growth
and managed northern hardwood forests. Ecological Applications 12: 1329–1343.
Shannon C.E. and Weaver W. 1949. The Mathematical Theory of Communication. University of
Illinois Press, Urbana, Illinois.
Shugart H.H. Jr. and West D.C. 1980. Forest succession models. BioScience 30: 308–313.
Singh J.S., Raghubanshi A.S., Singh R.S. and Srivastava S.C. 1989. Microbial biomass acts as a
source of plant nutrients in dry tropical forests and savanna. Nature 338: 499–500.
Singh J.S., Singh K.P. and Agrawal M. 1991. Environmental degradation of the Obra-Renukoot-
Singrauli area, India and its impact on natural and derived ecosystems. Environmentalist 11:
171–180.
Singh K.P. and Singh J.S. 1988. Certain structural and functional aspects of dry tropical forests and
savanna. International Journal of Ecology Environmental Science 14: 31–45.
Singh V.P. and Singh J.S. 1989. Man and forests: a case study from the dry tropics of India.
Environmental Conservation 16: 129–136.
Singh V.P. and Singh J.S. 1992. Energetics and environmental costs of agriculture in a dry tropical
region of India. Environmental Management 16: 495–503.
SPSS. 1997. SPSS Base 7.5. Applications Guide. SPSS Inc., Chicago, Illinois.
UNESCO/UNEP/FAO 1978. Tropical Forest Ecosystems: A State-of-Knowledge Report. UNE-
SCO, Paris, France.
Upadhyay M.D. and Srivastava S.C.N. 1980. Working Plan, Obra Forest Division, South Circle,
Uttar Pradesh from 1980–81 to 1989–90. Working Plan Circle (2). Nainital, India.
Valencia R., Balslev H. and Mino G.C.P.Y. 1994. High tree alpha-diversity in Amazonian Ecua-
dor. Biodiversity Conservation 3: 21–28.
Webb C.O. and Peart D.R. 2000. Habitat associations of trees and seedlings in a Bornean rain
forest. Journal of Ecology 88: 464–478.
West D.C., Shugart H.H. Jr. and Ranney J.W. 1981. Population structure of forest over a large
area. Forest Science 27: 701–710.
Whittaker R.H. 1972. Evolution and measurement of species diversity. Taxon 21: 213–251.
959