structure determination of derivatized disaccharides by
TRANSCRIPT
Louisiana State UniversityLSU Digital Commons
LSU Historical Dissertations and Theses Graduate School
2000
Structure Determination of DerivatizedDisaccharides by Tandem Mass Spectrometry andMolecular Modeling.Sanford Louis MendoncaLouisiana State University and Agricultural & Mechanical College
Follow this and additional works at: https://digitalcommons.lsu.edu/gradschool_disstheses
This Dissertation is brought to you for free and open access by the Graduate School at LSU Digital Commons. It has been accepted for inclusion inLSU Historical Dissertations and Theses by an authorized administrator of LSU Digital Commons. For more information, please [email protected].
Recommended CitationMendonca, Sanford Louis, "Structure Determination of Derivatized Disaccharides by Tandem Mass Spectrometry and MolecularModeling." (2000). LSU Historical Dissertations and Theses. 7378.https://digitalcommons.lsu.edu/gradschool_disstheses/7378
INFORMATION TO USERS
This manuscript has been reproduced from the microfilm master. UMI films the text directly from the original or copy submitted. Thus, som e thesis and dissertation copies are in typewriter face, while others may be from any type of computer printer.
The quality of th is reproduction is dependen t upon th e quality of the copy subm itted. Broken or indistinct print, colored or poor quality illustrations and photographs, print bleedthrough, substandard margins, and improper alignment can adversely affect reproduction.
In the unlikely event that the author did not send UMI a complete manuscript and there are missing pages, these will be noted. Also, if unauthorized copyright material had to be removed, a note will indicate the deletion.
Oversize materials (e.g., maps, drawings, charts) are reproduced by sectioning the original, beginning at the upper left-hand comer and continuing from left to right in equal sections with small overlaps.
Photographs included in the original manuscript have been reproduced xerographically in this copy. Higher quality 6” x 9” black and white photographic prints are available for any photographs or illustrations appearing in this copy for an additional charge. Contact UMI directly to order.
Bell & Howell Information and Learning 300 North Zeeb Road, Ann Arbor, Ml 48106-1346 USA
800-521-0600
Reproduced with permission of the copyright owner. Further reproduction prohibited without permission.

R e p ro d u c e d with perm iss ion of th e copyright ow ner. F u r th e r reproduction prohibited without perm iss ion .
STRUCTURE DETERMINATION OF DERIVATIZED DISACCHARIDES BY
TANDEM MASS SPECTROMETRY AND MOLECULAR MODELING
A Dissertation
Submitted to the Graduate Faculty of the Louisiana State University and
Agricultural and Mechanical College in partial fulfilment of the
requirements for the degree of Doctor o f Philosophy
in
The Department of Chemistry
by
Sanford Mendonca B.S. University o f Bombay, 1988 M.S., University o f Houston, 1995
December 2000
Reproduced with permission of the copyright owner. Further reproduction prohibited without permission.
UMI Number: 9998697
Copyright 2000 by Mendonca, Sanford Louis
All rights reserved.
___ ®
UMIUMI Microform 9998697
Copyright 2001 by Bell & Howell Information and Learning Company. All rights reserved. This microform edition is protected against
unauthorized copying under Title 17, United States Code.
Bell & Howell Information and Learning Company 300 North Zeeb Road
P.O. Box 1346 Ann Arbor, Ml 48106-1346
Reproduced with permission of the copyright owner. Further reproduction prohibited without permission.
Copyright © 2000 Sanford Mendonca All rights reserved
ii
Reproduced with permission of the copyright owner. Further reproduction prohibited without permission.
Dedicated to Monisha, Ninoshka,
Nadia, Natalia and Vinton
iii
Reproduced with permission of the copyright owner. Further reproduction prohibited without permission.
Acknowledgements
I would like to express my sincerest and deepest gratitude to my research advisor Dr.
Roger Laine for his guidance, support and constant encouragement that enabled me to
accomplish my research. I would also like to thank him for taking the time to edit this
dissertation. Dr. Laine is the best advisor anyone could ask for. I feel extremely fortunate
and highly privileged to have had the opportunity to work with not only a very
knowledgeable but also an extremely patient and understanding person. Words cannot
express the gratitude within me for the wonderful years I spent associating with him and
very fondly cherish it. I would also like to thank Dr. Laine’s family for the support given
to me during my graduate career.
I would like to express my sincere thanks to Dr. Alfred French who was introduced to me
by Dr. Laine for spending countless hours with the modeling work described in this
dissertation. I am very grateful to him for being so patient, obliging, for being there when
ever I needed to meet him and for sharing with me his vast resources o f knowledge.
Sincere thanks to Dr. Richard Cole from the University o f New Orleans for helping with
the mass spectrometry work that was carried out in his laboratory.
Sincere thanks to Dr. Patrick Limbach for allowing me unlimited usage of his mass
spectrometry instruments and for various suggestions given to me for my research work.
Thanks to the committee members for participating in my defense.
A special thanks to my wife Monisha for holding the fort at home while I spent my time
in the laboratory. I am extremely blessed to have such a wonderful, caring and loving
wife. We have been through numerous ups and downs in our six wonderful years of
marriage. I am glad I got the opportunity o f sharing my life with her.
iv
Reproduced with permission of the copyright owner. Further reproduction prohibited without permission.

wife. We have been through numerous ups and downs in our six wonderful years of
marriage. I am glad I got the opportunity o f sharing my life with her.
My three children Ninoshka, Nadia, and Natalia who put up with all the difficult times
we had. They are a great blessing in my life and would like to thank God for three little
angels. I would also like to thank God for helping me throughout my graduate career and
enabling me to reach the greatest moment in my life.
Last but not the least my family, my parents who have waited for this day to come. My
brother Vinton for helping me out financially. I could not have asked for a better brother.
V
Reproduced with permission of the copyright owner. Further reproduction prohibited without permission.
Table of Contents
Acknowledgements.............................................................................................. iv
List of Tables.........................................................................................................viii
List of Figures........................................................................................................ ix
List of Schemes..................................................................................................... xiv
A bstract................................................................................................................. xv
Chapter 1. Introduction.................................................................................. 1Carbohydrates...............................................................................1Mass Spectrometry....................................................................... 9Mass Spectrometry of Carbohydrates........................................21Molecular Modeling of Carbohydrates..................................... 29Scope of Work..............................................................................33References.................................................................................... 35
Chapter 2. Synthesis of Sterically Crowded Derivatives of AnomericPairs of Glucose-Glucose D isaccharides................................42Introduction.................................................................................... 42Experimental................................................................................ 45References...................................................................................... 59
C hapter 3. Collision Induced Discrimination of the Glucose l-»4Disaccharide Anomeric Pair with Incremented Alkyl Substitution...................................................................... 61Introduction.................................................................................. 61Experimental............................................................................... 69Results and Discussion................................................................ 71Conclusions....................................................................................125References......................................................................................125
Chapter 4. Conformational Analysis o f Perm ethylated DisaccharidesUsing M M 3....................................................................................133Introduction....................................................................................133Methods..........................................................................................138Results and Discussion..................................................................140Conclusions....................................................................................181References...................................................................................... 198
C hapter 5. Conclusions and Future R esearch............................................202Conclusions....................................................................................202Future Research.............................................................................204
vi
Reproduced with permission of the copyright owner. Further reproduction prohibited without permission.
Chapter 5. Conclusions and Future Research............................................ 202Conclusions.................................................................................... 202Future Research..............................................................................204
Appendix List of Abbreviations....................................................................206
Vita..............................................................................................................................207
vii
Reproduced with permission of the copyright owner. Further reproduction prohibited without permission.
List o f Tables
Table
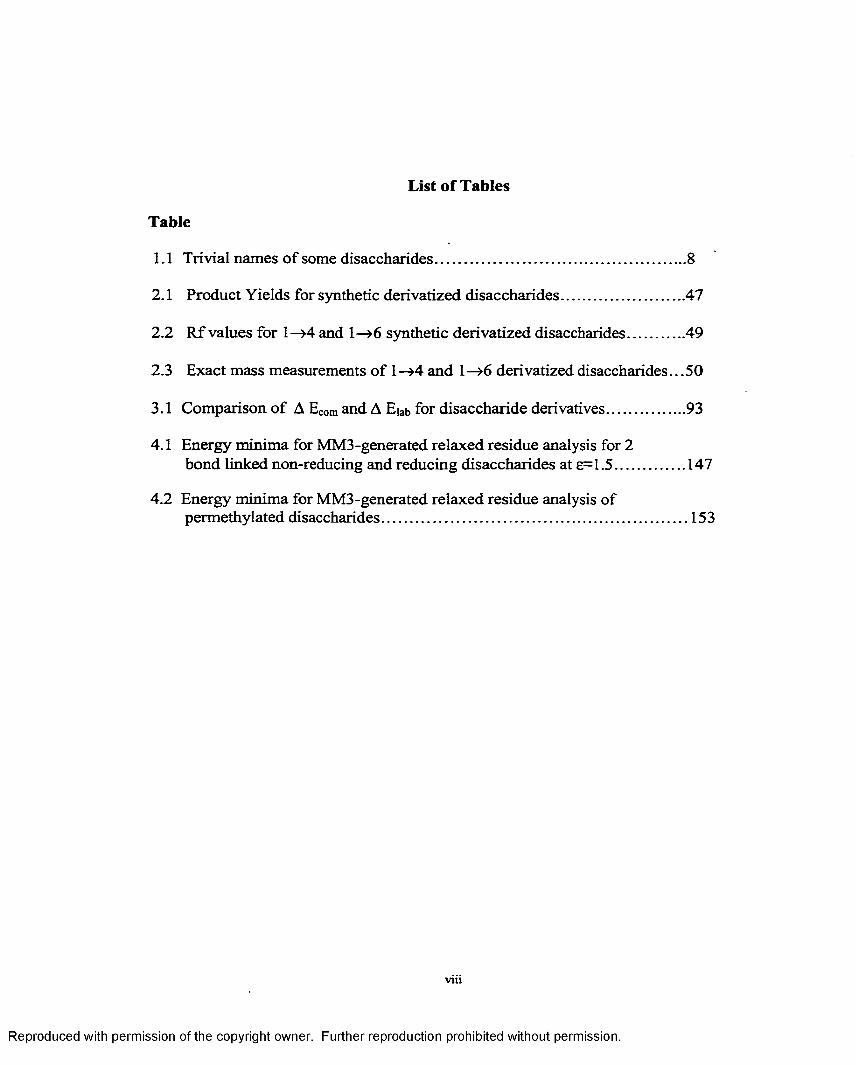
1.1 Trivial names of some disaccharides..............................................................8
2.1 Product Yields for synthetic derivatized disaccharides...............................47
2.2 R f values for 1—>4 and 1—>6 synthetic derivatized disaccharides.............. 49
2.3 Exact mass measurements o f 1—>4 and 1—>6 derivatized disaccharides.. .50
3.1 Comparison o f A ECOm and A Eiab for disaccharide derivatives.................. 93
4.1 Energy minima for MM3-generated relaxed residue analysis for 2bond linked non-reducing and reducing disaccharides at e=1.5..................147
4.2 Energy minima for MM3-generated relaxed residue analysis of permethylated disaccharides............................................................................. 153
viii
Reproduced with permission of the copyright owner. Further reproduction prohibited without permission.
List o f Figures
Figure/
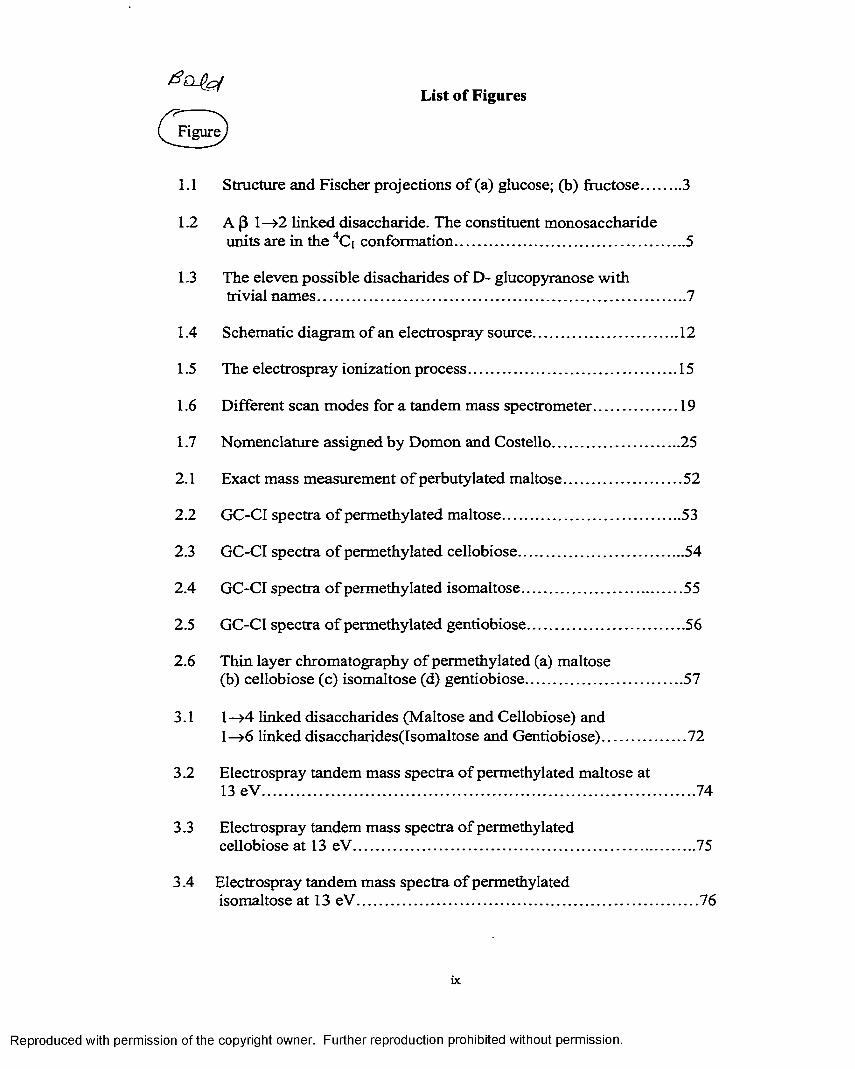
1.1 Structure and Fischer projections o f (a) glucose; (b) fructose............3
1.2 A P 1—>2 linked disaccharide. The constituent monosaccharideunits are in the 4Ci conformation......................................................... 5
1.3 The eleven possible disacharides o f D- glucopyranose withtrivial names............................................................................................ 7
1.4 Schematic diagram of an electrospray source...................................... 12
1.5 The electrospray ionization process...................................................... 15
1.6 Different scan modes for a tandem mass spectrometer.......................19
1.7 Nomenclature assigned by Domon and Costello................................. 25
2.1 Exact mass measurement o f perbutylated maltose............................... 52
2.2 GC-CI spectra o f permethylated maltose..............................................53
2.3 GC-CI spectra o f permethylated cellobiose...........................................54
2.4 GC-CI spectra o f permethylated isomaltose......................................... 55
2.5 GC-CI spectra o f permethylated gentiobiose........................................ 56
2.6 Thin layer chromatography o f permethylated (a) maltose(b) cellobiose (c) isomaltose (d) gentiobiose....................................... 57
3.1 1—>4 linked disaccharides (Maltose and Cellobiose) and1—>6 linked disaccharides(Isomaltose and Gentiobiose)..................... 72
3.2 Electrospray tandem mass spectra of permethylated maltose at13 eV ............................................................................................................ 74
3.3 Electrospray tandem mass spectra o f permethylatedcellobiose at 13 eV......................................................................................75
3.4 Electrospray tandem mass spectra o f permethylatedisomaltose at 13 eV......................................................................................76
ix
Reproduced with permission of the copyright owner. Further reproduction prohibited without permission.
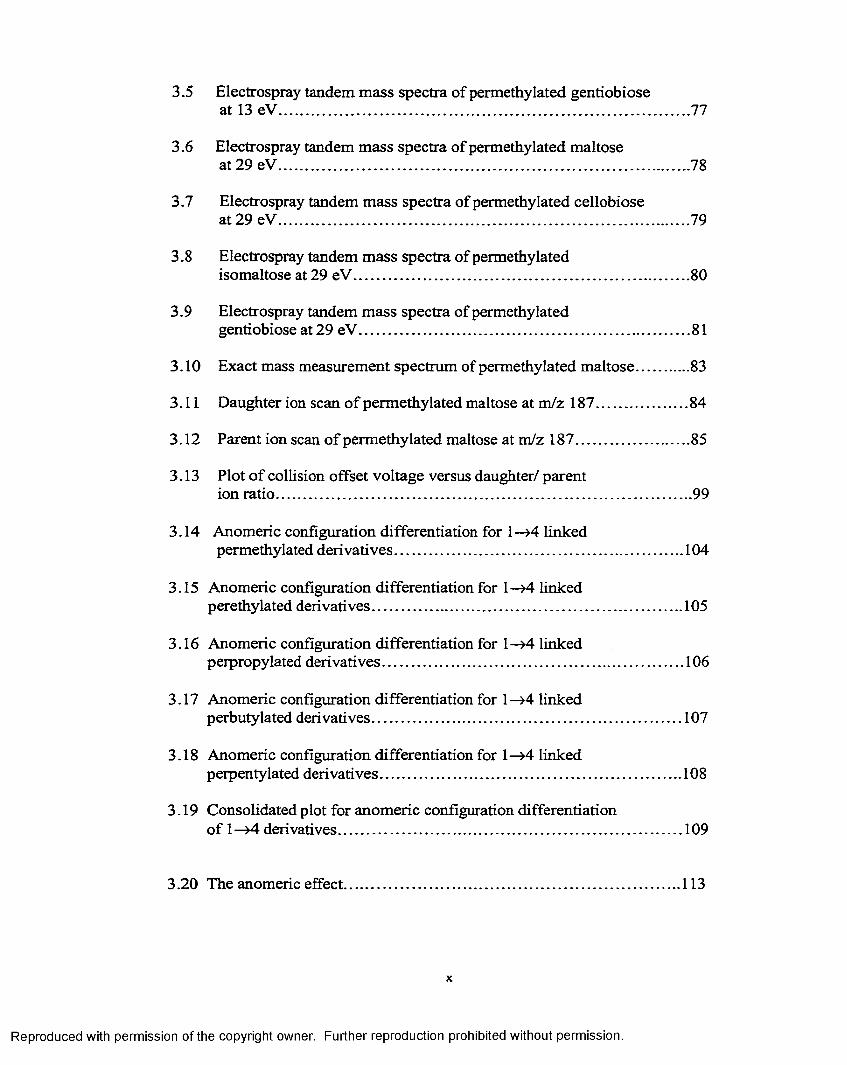
3.5 Electrospray tandem mass spectra of permethylated gentiobioseat 13 eV.......................................................................................................77
3.6 Electrospray tandem mass spectra of permethylated maltoseat 29 eV.......................................................................................................78
3.7 Electrospray tandem mass spectra of permethylated cellobioseat 29 eV.......................................................................................................79
3.8 Electrospray tandem mass spectra of permethylatedisomaltose at 29 eV.................................................................................... 80
3.9 Electrospray tandem mass spectra of permethylatedgentiobiose at 29 eV................................................................................... 81
3.10 Exact mass measurement spectrum of permethylated maltose...............83
3.11 Daughter ion scan o f permethylated maltose at m/z 187........................ 84
3.12 Parent ion scan o f permethylated maltose at m/z 187..............................85
3.13 Plot o f collision offset voltage versus daughter/ parention ratio........................................................................................................99
3.14 Anomeric configuration differentiation for 1 —>4 linked permethylated derivatives........................................................................ 104
3.15 Anomeric configuration differentiation for l-»4 linked perethylated derivatives............................................................................ 105
3.16 Anomeric configuration differentiation for 1—>4 linked perpropylated derivatives..........................................................................106
3.17 Anomeric configuration differentiation for 1—>4 linked perbutylated derivatives............................................................................ 107
3.18 Anomeric configuration differentiation for 1—>4 linked perpentylated derivatives.......................................................................... 108
3.19 Consolidated plot for anomeric configuration differentiationo f 1—>4 derivatives.....................................................................................109
3.20 The anomeric effect................................................................................... 113
X
Reproduced with permission of the copyright owner. Further reproduction prohibited without permission.
3.21 Consolidated plot for anomeric configuration differentiationof 1—>6 derivatives................................................................................ 114
3.22 Plot of effect o f alkyl groups on glycosidic bond cleavage fora -1 —>4 linked derivatives......................................................................117
3.23 Plot of effect of alkyl groups on glycosidic bond cleavage forP~1—>4 linked derivatives......................................................................118
3.24 Plot of effect o f alkyl groups on glycosidic bond cleavage fora-1—>6 linked derivatives......................................................................119
3.25 Plot of effect of alkyl groups on glycosidic bond cleavage for(3-1—>6 linked derivatives......................................................................120
3.26 <j), \jr, Energy plot o f permethylated maltose.................................... 126
3.27 <(>, \\r, Energy plot o f permethylated cellobiose..................................127
4.1 Minimum energy structures of permethylated disaccharides............ 143
4.2 MM3 <{>—ijr map at £ = 1.5 for a ,a - trehalose...................................... 154
4.3 MM3 <J)—\|r map at e = 1.5 for (3,(3- trehalose....................................... 155
4.4 MM3 <j)—'y map at £ = 1.5 for kojibiose.................................................156
4.5 MM3 <J)—\jr map at e = 1.5 for sophorose..............................................157
4.6 MM3 (j>—vj/ map at e = 1.5 for nigerose.................................................158
4.7 MM3 <f>—\|r map at e = 1.5 for laminaribiose.......................................159
4.8 MM3 <|>—'vjr map at e = 1.5 for maltose..................................................160
4.9 MM3 <j)-\|/ map at £ = 1.5 for cellobiose...............................................161
4.10 MM3 <|>—'y\r map at 8 = 3.5 for a ,a - trehalose.......................................162
4.11 MM3 <j>—\|f map at e = 3.5 for (3,(3- trehalose........................................163
4.12 MM3 <J)—Vjr map at e = 3.5 for kojibiose...................................................164
4.13 MM3 <(>—'\\r map at e = 3.5 for sophorose................................................165
xi
Reproduced with permission of the copyright owner. Further reproduction prohibited without permission.
4.14 MM3 <{)—ijf map at e = 3.5 for nigerose...................................................166
4.15 MM3 <{)—V map at e = 3.5 for laminaribiose.......................................... 167
4.16 MM3 <{>—ijr map at e = 3.5 for maltose....................................................168
4.17 MM3 (|)—ijr map at e = 3.5 for cellobiose................................................169
4.18 MM3 <(>—ij/ map at e = 7.5 for oc,a- trehalose........................................170
4.19 MM3 <{>—V{r map at £ = 7.5 for (3,0- trehalose........................................171
4.20 MM3 (J)—'Vj/ map at e = 7.5 for kojibiose................................................ 172
4.21 MM3 <j>—' map at e = 7.5 for sophorose................................................ 173
4.22 MM3 <{>— map at e = 7.5 for nigerose....................................................174
4.23 MM3 <J)—V maP at e = 7.5 for laminaribiose.........................................175
4.24 MM3 (J)—V maP at £ = 7.5 for maltose.................................................. 176
4.25 MM3 <J>—'ip map at 8 = 7.5 for cellobiose.............................................. 177
4.26 MM3 <J>—y map for permethylated oc,a- trehalose................................182
4.27 MM3 (j>—'v|/ map for permethylated (3,(3- trehalose.................................183
4.28 MM3 <|>—•'vjr map for permethylated kojibiose..........................................184
4.29 MM3 <J>— map permethylated sophorose............................................. 185
4.30 MM3 §—\)f map for permethylated nigerose........................................ 186
4.31 MM3 <|)—\|r map for permethylated laminaribiose................................187
4.32 MM3 <j>—'y map for permethylated maltose.............................................188
4.33 MM3 <|)—vjr map for permethylated cellobiose.....................................189
4.34 Difference map for a ,a - trehalose..........................................................190
4.35 Difference map for (3,(3- trehalose............................................................191
xii
Reproduced with permission of the copyright owner. Further reproduction prohibited without permission.
4.3 6 Difference map for kojibiose.............................................................192
4.3 7 Difference map for sophorose.......................................................... 193
4.38 Difference map for nigerose.............................................................194
4.39 Difference map for laminaribiose....................................................195
4.40 Difference map for maltose...............................................................196
4.41 Difference map for cellobiose.......................................................... 197
xiii
Reproduced with permission of the copyright owner. Further reproduction prohibited without permission.

List of Schemes
Scheme
3.1 Mechanistic pathway o f ions formed in the electrosprayionzation process.......................................................................................... 88
3.2 Fragmentation pathway for permethylated isomaltose.............................. 96
3.3 Fragmentation pathway for permethylated maltose....................................97
3.4 Fragmentation pathway for perbutylated maltose.......................................98
xiv
Reproduced with permission of the copyright owner. Further reproduction prohibited without permission.
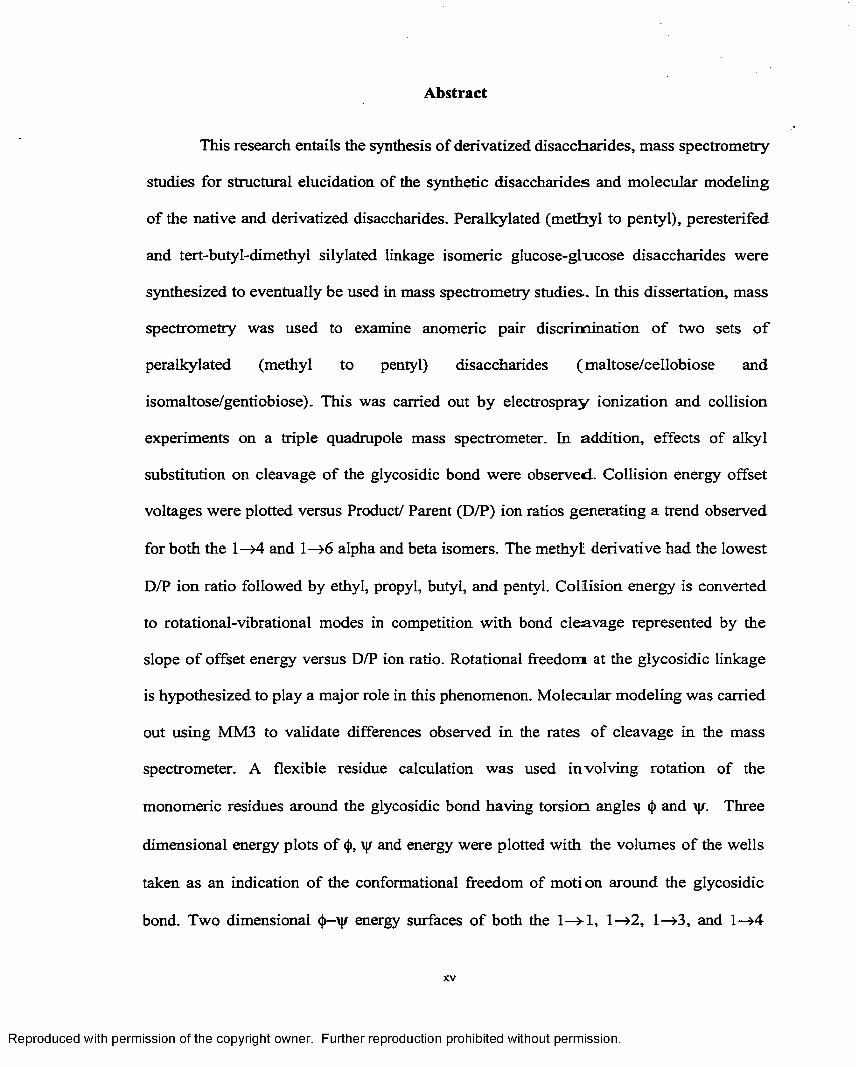
Abstract
This research entails the synthesis of derivatized disaccharides, mass spectrometry
studies for structural elucidation of the synthetic disaccharides and molecular modeling
of the native and derivatized disaccharides. Peralkylated (methyl to pentyl), peresterifed
and tert-butyl-dimethyl silylated linkage isomeric glucose-glucose disaccharides were
synthesized to eventually be used in mass spectrometry studies- In this dissertation, mass
spectrometry was used to examine anomeric pair discrimination o f two sets o f
peralkylated (methyl to pentyl) disaccharides (maltose/cellobiose and
isomaltose/gentiobiose). This was carried out by electrospray ionization and collision
experiments on a triple quadrupole mass spectrometer. In addition, effects of alkyl
substitution on cleavage of the glycosidic bond were observed. Collision energy offset
voltages were plotted versus Product/ Parent (D/P) ion ratios generating a trend observed
for both the 1—>4 and 1—>6 alpha and beta isomers. The methyl! derivative had the lowest
D/P ion ratio followed by ethyl, propyl, butyl, and pentyl. Collision energy is converted
to rotational-vibrational modes in competition with bond cleavage represented by the
slope o f offset energy versus D/P ion ratio. Rotational freedom at the glycosidic linkage
is hypothesized to play a major role in this phenomenon. Molecular modeling was carried
out using MM3 to validate differences observed in the rates of cleavage in the mass
spectrometer. A flexible residue calculation was used involving rotation of the
monomeric residues around the glycosidic bond having torsion angles <{> and \|r. Three
dimensional energy plots o f <{), \|r and energy were plotted with the volumes o f the wells
taken as an indication of the conformational freedom of motion around the glycosidic
bond. Two dimensional <j)— energy surfaces o f both the 1— 1, 1—>2, 1—>3, and 1—>4
X V
Reproduced with permission of the copyright owner. Further reproduction prohibited without permission.
native and permethylated disaccharides were also plotted to study their characteristics.
The calculated freedom of motion volumes for the |3-(1—>4) were smaller than for the a-
(1—>4) bonded glucoses, which may account for the higher rate o f bond cleavage for the
(3-(l—>4) linkage. Additionally an interesting outcome was noted from the difference
maps between the permethylated and native disaccharides, which were plotted to study
the effect o f the methyl groups on the energy surfaces.
xvi
Reproduced with permission of the copyright owner. Further reproduction prohibited without permission.
Chapter 1 Introduction
Carbohydrates
Carbohydrates constitute the most abundant group o f natural products which is
exemplified by the process o f photosynthesis that produces 4x 10¹⁴ kg o f carbohydrates
each year. As their name implies, they were originally believed to consist solely of the
elements carbon and water and were thus commonly designated with the generalized
formula Cx(H20)y. Later it was found that carbohydrates in fact contain hydroxyl and
carbonyl groups and are polyhydroxy aldehydes or ketones. Still later it was recognized
that compounds need not be aldehydes, or ketones, or have the empirical formula o f a
hydrate o f carbon to be a carbohydrate; rather, compounds could be derived from
polyhydroxy aldehydes or ketones and have the properties of a carbohydrate.
The modem definition o f a carbohydrate is that it is a polyhydroxy aldehyde or
ketone or compound that can be derived from them by any of several means including 1.
Reduction to give sugar alcohols (alditols) 2. Oxidation to give sugar acids 3.
Substitution of one or more o f the hydroxyl groups by various chemical groups (for
example hydrogen) to give deoxysugars, amino groups to give amino sugars, thiols or
similar heteroatomic group. 4. Derivatization of the hydroxyl groups by various moieties,
for example, phosphoric acid to give phospho sugars, or sulfuric acid to give sulfo sugars,
or reaction o f the hydroxyl groups with alcohols to give saccharides, oligosaccharides
and polysaccharides. Thus the present day convention [1] is that carbohydrates are a
much larger family o f compounds comprising monosaccharides, oligosaccharides and
polysaccharides with monosaccharides being the simplest ones which cannot be
hydrolysed further to smaller constituent units.
l
Reproduced with permission of the copyright owner. Further reproduction prohibited without permission.
All o f these types o f carbohydrates play important roles, for example, the phospho
esters of carbohydrates are intermediates in the metabolism o f carbohydrates that
produces CO2 + H2O + energy in the process of respiration. The major compound in the
conversion and interchange o f energy is the phospho sugar derivative adenosine
triphosphate (ATP). The sugar alcohols and sugar acids are involved in diverse functions,
for example, the sugar alcohol sorbitol is found in some fruits, where it imparts a
distinctive sweet taste. Sugar acids are found in plant, animal and bacterial
polysaccharides, such as pectin, hyaluronate, alginate, and bacterial capsules where they
impart important functional properties of acids and anions. Carbohydrates may also be
covalently linked to other biopolymers such as lipids called glycolipids and to proteins
called glycoproteins. There is a growing appreciation for their role in protein solubility,
protein folding, protein turnover, cell surface receptors, cell-cell recognition, cellular
differentiation and immunological recognition.
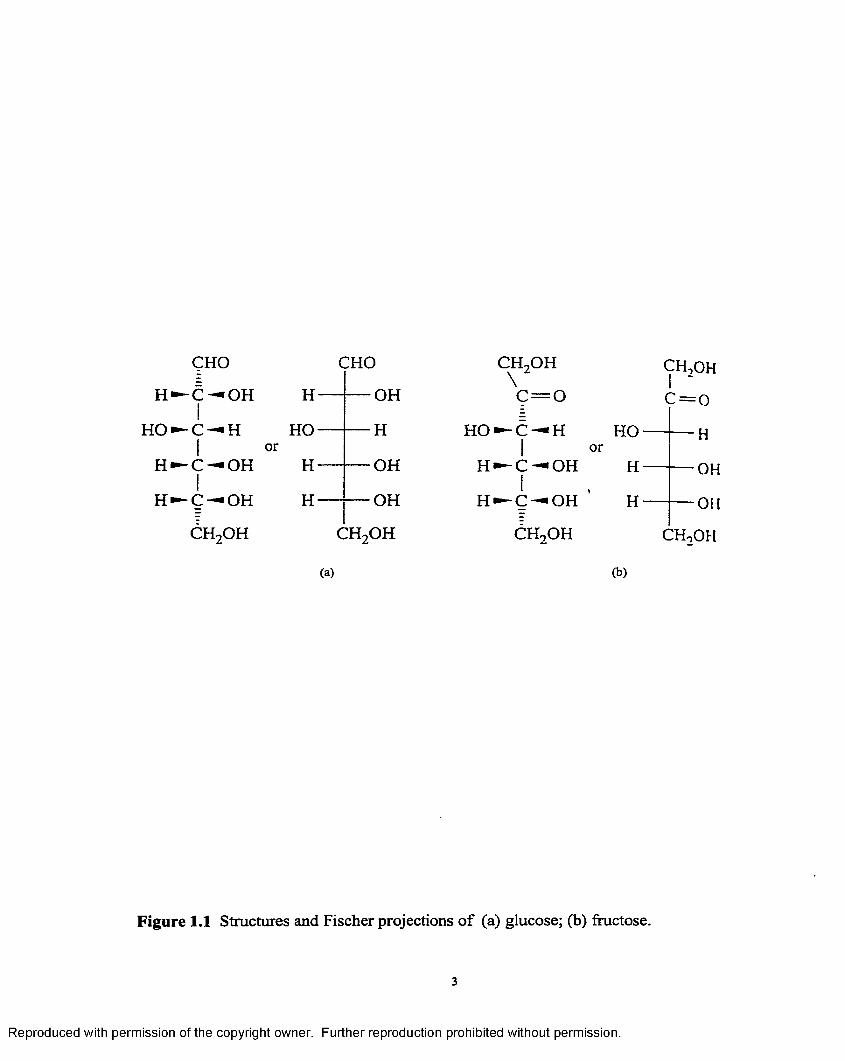
Monosaccharides are carbohydrates that cannot be hydrolysed to simpler
compounds. Examples (shown in figure 1.1) are glucose which is a polyhyroxyaldehyde
(aldose) and polyhydroxy ketone (ketose).
Disaccharides are carbohydrates that can be hydrolysed to two monosaccharides. An
example is sucrose that is easily hydrolysed to glucose and fructose.
Sucrose --------- p- glucose + fructose
Polysaccharides are carbohydrates that can be hydrolysed to many monosaccharide
units. They are naturally occurring polymers of carbohydrates. Examples are starch and
cellulose, both biopolymers of glucose.
Reproduced with permission of the copyright owner. Further reproduction prohibited without permission.
CHO CHO c h 2o h CH-.OH\ "
H — C — OHj
H — OH c = o C- = 0
HO — C — H HO — H HO — C — H H O - — H1 or 1 or
H — C — OH|
H — OH H — C — OH|
H - OH
H — C — OH H — OH H — C — OH\
H - — OH
CH2OH C:h 2o h CH2OH C:h 2o h
(a) (b)
Figure 1.1 Structures and Fischer projections o f (a) glucose; (b) fructose.
3
Reproduced with permission of the copyright owner. Further reproduction prohibited without permission.
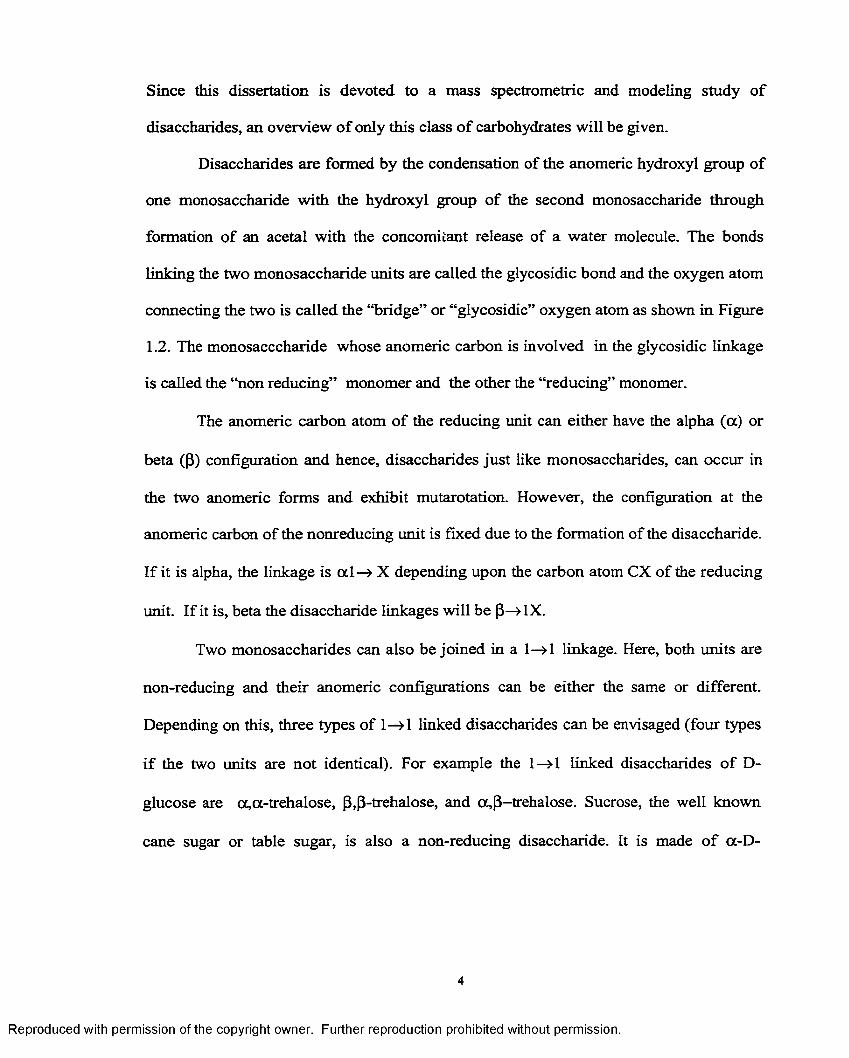
Since this dissertation is devoted to a mass spectrometric and modeling study of
disaccharides, an overview o f only this class o f carbohydrates will be given.
Disaccharides are formed by the condensation of the anomeric hydroxyl group of
one monosaccharide with the hydroxyl group o f the second monosaccharide through
formation o f an acetal with the concomitant release of a water molecule. The bonds
linking the two monosaccharide units are called the glycosidic bond and the oxygen atom
connecting the two is called the “bridge” or “glycosidic” oxygen atom as shown in Figure
1.2. The monosacccharide whose anomeric carbon is involved in the glycosidic linkage
is called the “non reducing” monomer and the other the “reducing” monomer.
The anomeric carbon atom o f the reducing unit can either have the alpha (a) or
beta (P) configuration and hence, disaccharides just like monosaccharides, can occur in
the two anomeric forms and exhibit mutarotation. However, the configuration at the
anomeric carbon of the nonreducing unit is fixed due to the formation of the disaccharide.
If it is alpha, the linkage is a l —» X depending upon the carbon atom CX of the reducing
unit. If it is, beta the disaccharide linkages will be P—»1X.
Two monosaccharides can also be joined in a 1—»1 linkage. Here, both units are
non-reducing and their anomeric configurations can be either the same or different.
Depending on this, three types of 1-»1 linked disaccharides can be envisaged (four types
if the two units are not identical). For example the 1—>1 linked disaccharides o f D-
glucose are oc,a-trehalose, p,p~trehalose, and a ,p —trehalose. Sucrose, the well known
cane sugar or table sugar, is also a non-reducing disaccharide. It is made o f a-D-
Reproduced with permission of the copyright owner. Further reproduction prohibited without permission.
The configuration at this anomeric carbon atom is fixed
“ glycosidic bonds
Nom e during end (oxygen on the anomeric carbon is substituted)
The configuration at this anomeric carbon atom can be either alpha or beta
"bridge11 or "glycosidic" oxygen atom
Reducing end(oxygen on the anomeric carbon is unsubstituted)
Figure 1.2 A |3 1—» 2 linked disaccharide. The constituent monosaccharide units are in the 4Ci conformation.
5
Reproduced with permission of the copyright owner. Further reproduction prohibited without permission.
glucopyranose and (3-D-fructofuranose. Thus disaccharides can be formed irrespective of
whether the constituent monosaccharides are in the pyranose or fiiranose form. The
linkage in this case is 1—>2 and not 1—>1 since one o f the constituent monosaccharide is
an aldose and the other, a ketose.
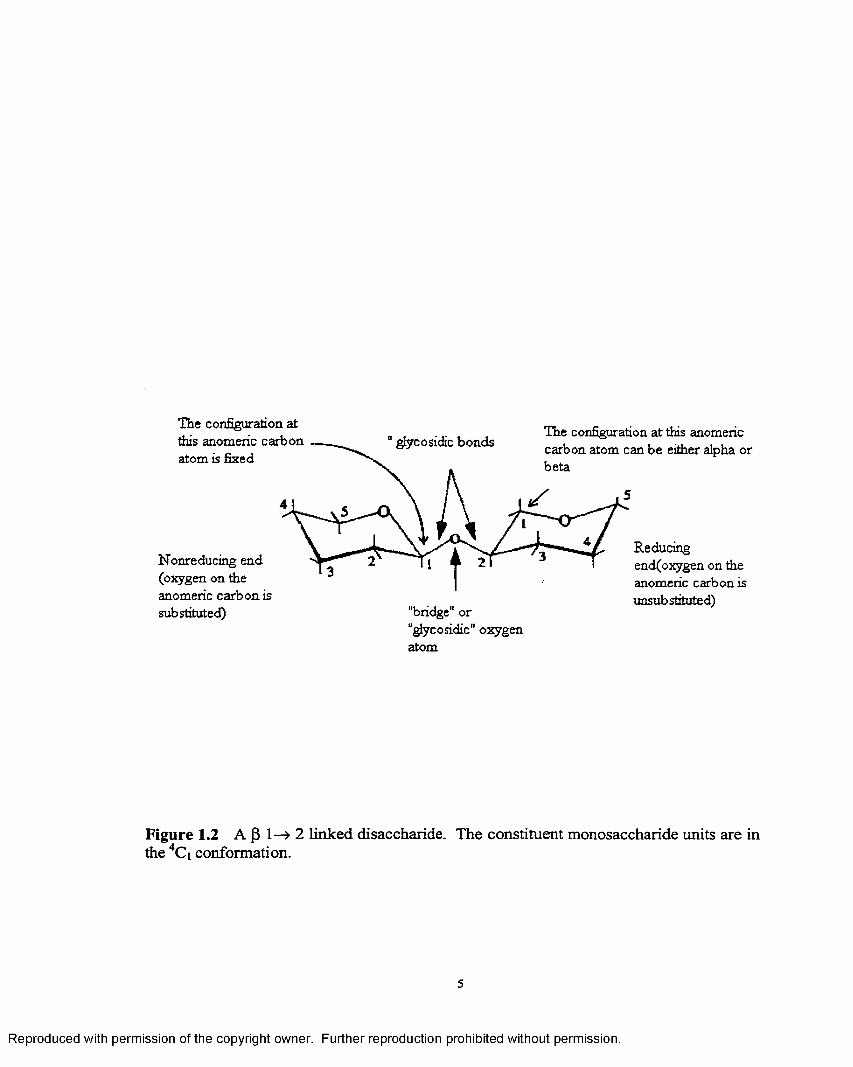
Several disaccharides can be derived from a single monosaccharide due to the
possibility of a number of linkage types in contrast to amino acids and mononucleotides
which can form only one type of dimer. For example, two glucopyranoses can form
eleven different disaccharides, as shown in Figure 1.3. Table 1.1 gives the structures and
trivial names of some disaccharides. When the non-reducing monosaccharide unit is an
aldose, the linkage in the disaccharide is 1—»X (X=l,2...,6). If it is a ketose the linkage in
the disaccharide is 2—>X (X=l,2...,6). If the conformation of the pyranose ring is known,
the orientations i.e. axial or equatorial of the glycosidic bonds can also be incorporated in
the description o f the linkage types in the disaccharides. Accordingly they are termed
G lc-al—>4-Glc for maltose and Glc-pl—>4-Glc for cellobiose. Thus the series of eleven
isomers is composed of eight isomers having glycosidic linkages between C-l of one
residue, in either anomeric configuration, and C-2, C-3, C-4 or C-6 of the other pyranose
residue. The other three isomers are obtained by acetal formation between both C-l
atoms via the glycosidic oxygen atom in a ,a ; a ,(3; (3,(3 configuration. When the two
carbohydrate residues are not identical the situation becomes even more complex since
either residue can occupy the first or second position i.e. reducing or non-reducing
residue. When the formation of a trisaccharide is considered the number of possible
isomers increases dramatically.
6
Reproduced with permission of the copyright owner. Further reproduction prohibited without permission.
H O -*
H O O K cz.1
O H
O KH O H ;
O K
O H
O H
HO-W
H O O K
O HO H
H O H ;
ct.ct-Trehalose (ot,ctl«-*l) Kojibiose (c t l—>2) N igerose (<xl—>3)
H O O K
H O
H jC O HH O '
H O .
'O HH O
HO-O H “ 1 a l — I ( 0 I - M )
H O O H
M altose (o t l-^ 4 ) Isom altose (otl —>6) cc,p-Trehaiose (cc,pi <-*•!)
C ellob iose (P I —>4)
G entiobiose (P I—>6)
Figure 1.3 The eleven possible disaccharides of D-glucopyranose with trivial names
7
Reproduced with permission of the copyright owner. Further reproduction prohibited without permission.
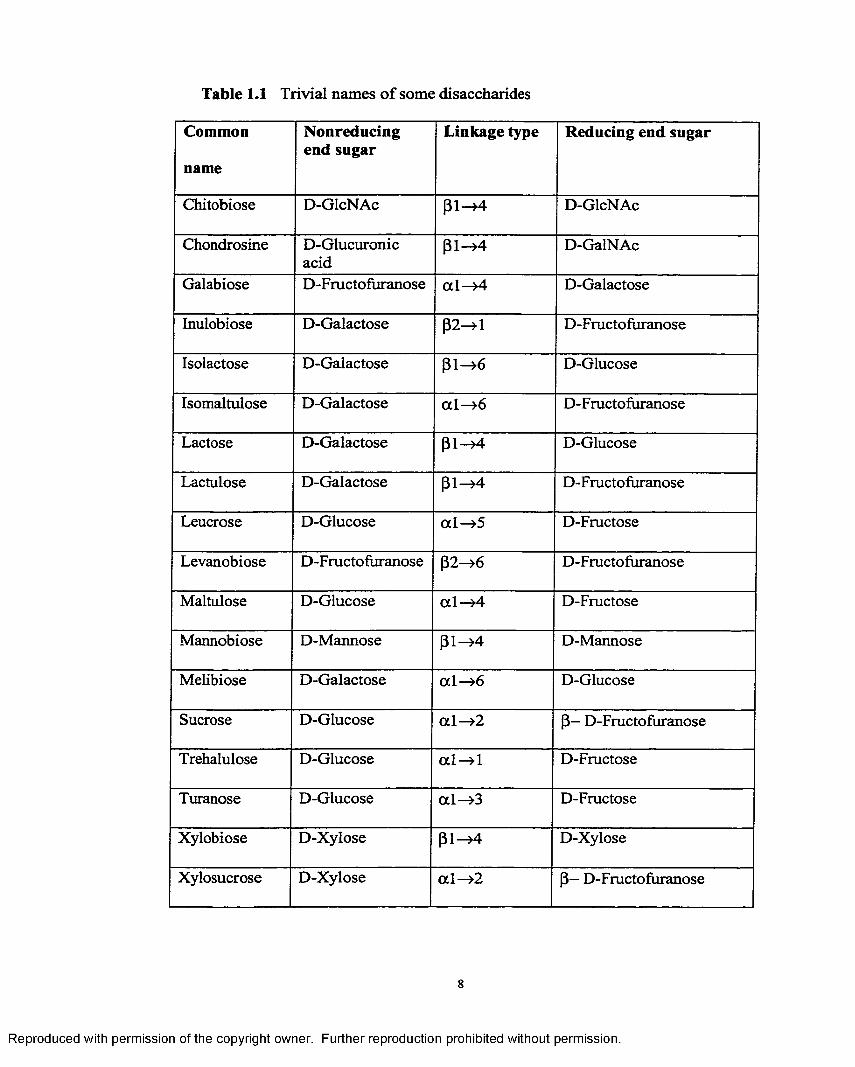
Table 1.1 Trivial names o f some disaccharides
Common
name
Nonreducing end sugar
Linkage type Reducing end sugar
Chitobiose D-GlcNAc {31—>4 D-GlcNAc
Chondrosine D-Glucuronicacid
(31—>4 D-GalNAc
Galabiose D-Fructofiiranose a l —>4 D-Galactose
Inulobiose D-Galactose p2—»1 D-Fructofuranose
Isolactose D-Galactose (31—>6 D-Glucose
Isomaltulose D-Galactose a l-» 6 D-Fructofuranose
Lactose D-Galactose (31—>4 D-Glucose
Lactulose D-Galactose p i—>4 D-Fructofuranose
Leucrose D-Glucose a l —>5 D-Fructose
Levanobiose D-Fructofuranose p2->6 D-Fructofuranose
Maltulose D-Glucose a l —>4 D-Fructose
Mannobiose D-Mannose p i —>4 D-Mannose
Melibiose D-Galactose a l —>6 D-Glucose
Sucrose D-Glucose a l —>2 p— D-Fructofuranose
Trehalulose D-Glucose a l —>1 D-Fructose
Turanose D-Glucose a l-» 3 D-Fructose
Xylobiose D-Xylose p i —>4 D-Xylose
Xylosucrose D-Xylose a l-» 2 P~ D-Fructofuranose
Reproduced with permission of the copyright owner. Further reproduction prohibited without permission.
The relative orientations o f the two monosaccharide units in a disaccharide can be
described by the torsion angles <}> and \j/ around the glycosidic bonds. $ represents the
torsion angle about the C(anomeric)-0 bond whereas \\f about the O-CX’ bond. (CX' is
either C2/, C3' or C4' depending upon the type of linkage). In the case of a non reducing
disaccharide, <])' is used instead o f vj/' since both describe the torsion angles around the
C(anomeric)-0 bonds. In the case of a 1—>6 linked disaccharide, the two
monosaccharides are separated by an additional glycosidic bond and rotation around this
is designated as to. <j) is defined as earlier, \jz and co refer to C l-0-C 6 '-C 5 ' and 0-C6'-C5'-
H5' respectively.
Mass Spectrometry
A mass spectrometer can be divided into three fundamental parts, namely the
ionization source, the analyser, and the detector. Mass spectrometers are used primarily
to provide information concerning the molecular weight of the compound, and to achieve
this, the sample under investigation has to be introduced into the ionization source of the
instrument. In the source, the sample molecules are ionized and these ions are extracted
according to their mass (m) to charge (z) ratios (m/z). The separated ions are detected and
the signal fed to a data system where the results can be studied, processed and printed
out. The whole mass spectrometer (except for atmospheric pressure ionization sources) is
maintained under vacuum to give the ions a good chance o f travelling from one end of
the instrument to the other without interference or hindrance.
A considerable impetus to the development of organic mass spectrometry has
come from advances in sample handling and in methods o f ion formation which have
Reproduced with permission of the copyright owner. Further reproduction prohibited without permission.
both enormously increased the range o f samples amenable to mass spectrometric
analysis. The ionization methods in use are very diverse and constitute the following:
Electron Impact Ionization (El): This source was devised by Dempster and improved by
Bleakney [2] and Nier [3]. Organic molecules in the gas phase are bombarded by
energetic electrons. An energy of 70eV is usually chosen to create reproducible spectra
that contain odd electrons formed by ejection o f an electron from the molecule.
Subsequent fragmentation of the excited molecular ion produces the spectrum of
fragment ions from which the structure o f the original molecule can be deduced. It can be
used for analyzing a wide range of volatile organic compounds.
Chemical Ionization (Cl): It was developed by Munson and Field [4] in which methane
was used as the reagent gas in the positive ion mode, with the major ions reacting as
Bronsted acids. Molecules in the gas phase are ionized in an ion molecule reaction with a
positively or negatively charged reactant ion that itself is formed as a result of electron
ionization or chemical ionization reactions. The protonated or the deprotonated molecule
is usually a prominent ion in the chemical ionization spectrum.
Fast Atom Bombardment: was developed by Barber et al. [5]. It consists in focusing on
the sample a beam o f neutral atoms or molecules that causes desorption of protonated or
deprotonated molecular ions from the sample. The fast atom beams generally used are
generated from xenon or argon atoms.
Field Desorption: This method was introduced by Beckey et al. [6]. The sample is
deposited through evaporation of a solution containing also a salt on a tungsten or
rhenium filament covered with carbon needles. A potential difference is set between the
filament and an electrode. The filament is heated until the sample melts. The ions migrate
10
Reproduced with permission of the copyright owner. Further reproduction prohibited without permission.
and accumulate at the tip o f the needles where they are desorbed and carry along
molecules o f the sample.
Plasma desorption: The sample is deposited on a small aluminized nylon foil and exposed
in the source to the fission fragments of 252C f having an energy of several MeV. The
shock waves resulting from the bombardment o f a few thousand fragments per second
induce the desorption of neutrals and ions. This technique has allowed the observation o f
ions above 10000 Da [7].
Inductively Coupled Plasma: It allows a rapid and simultaneous determination o f several
metal elements with high accuracy and sensitivity [8]. The source is made up o f a flame
in which a solution o f a sample is introduced as a spray. Ar gas is used to support a
plasma. A coil that surrounds the plasma is energized with kilowatt r f power that induces
an electromagnetic field and inductively heats the plasma to temperatures exceeding
10000 K.
Thermospray: This technique developed by Vestal et al. [9] is used to desorb ions from
liquids. A high percentage of the liquid flow is volatilized as it emerges from a heated
metal capillary. Under these conditions the vapor that comes out from the end o f the
capillary has sufficient energy to transform the remainder of the liquid flow into a mist o f
small droplets each with a statistical distribution of excess charge. No external electric
field is applied since at the lower pressure at which thermospray operates a glow
discharge results.
Matrix Assisted Laser Desorption: It involves sample bombardment in a matrix
containing a low concentration o f sample molecules with short, intense pulses from a
laser light to effect both desorption and ionization o f the molecules [10]. The matrix
l i
Reproduced with permission of the copyright owner. Further reproduction prohibited without permission.
+3 to 6 kV, ions +
vE L E C T R O S PR A Y
tMETALLIC CAPILLARY
L E N S
Na (80°C)
I HPU M P
Na (80°C)
Figure 1.4 Schematic diagram of an electrospray source
12
Reproduced with permission of the copyright owner. Further reproduction prohibited without permission.
transforms the laser energy into excitation energy for the sample which leads to
sputtering o f the analyte and matrix from the surface o f the mixture. In this way the
energy transfer is efficient, while the sample molecules are spared from excessive energy
which would lead to their decomposition.
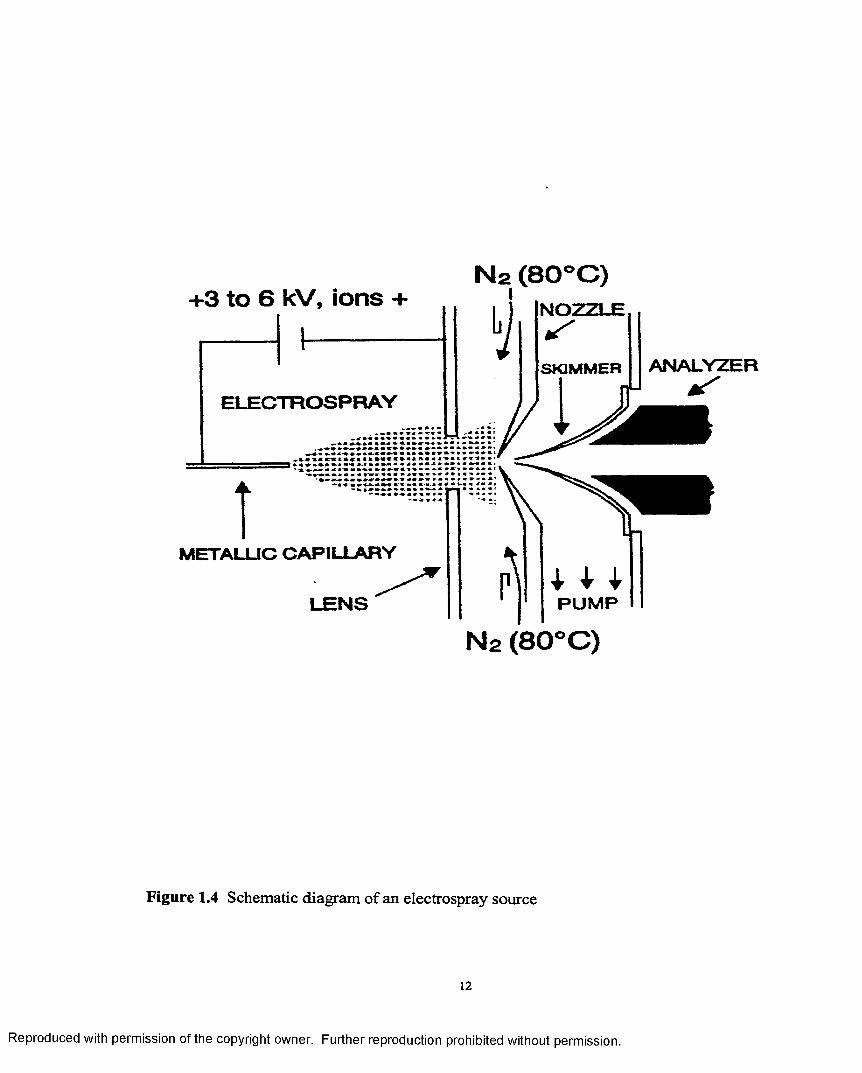
Electrospray: Since this source is used in the experiments described in this thesis a more
detailed coverage will be given. This source was devised by Yamashita and Fenn
[11,12]. A schematic diagram is shown in Figure 1.4. Sample solution at flow rates
between 1 and 20pL/min enters the ES chamber through a stainless steel hypodermic
needle. The needle is maintained at a few kilovolts relative to the walls o f the chamber
and the surrounding cylindrical electrode that helps shape the distribution o f potential and
direct the flow o f bath gas. The resulting field at the needle tip charges the surface of the
emerging liquid, dispersing it by coulombic forces into a fine spray o f charged droplets.
Driven by the electric field, the droplets migrate to the inlet end of the glass capillary at
the end wall o f the chamber. A countercurrent flow o f bath gas typically at 800 torr, and a
flow rate of lOOmL/s hasten evaporation of solvent from each droplet, decreasing its
diameter as it drifts towards the end wall of the chamber. Consequently the charge
density on its surface increases until the so called Rayleigh limit is reached at which the
Coulomb repulsion becomes of the same order as the surface tension. The resulting
instability, sometimes called a “Coulomb explosion” tears the droplet apart producing
charged droplets that also evaporate. This sequence o f events repeats until the radius of
curvature of a daughter droplet becomes small enough that the field due to the surface
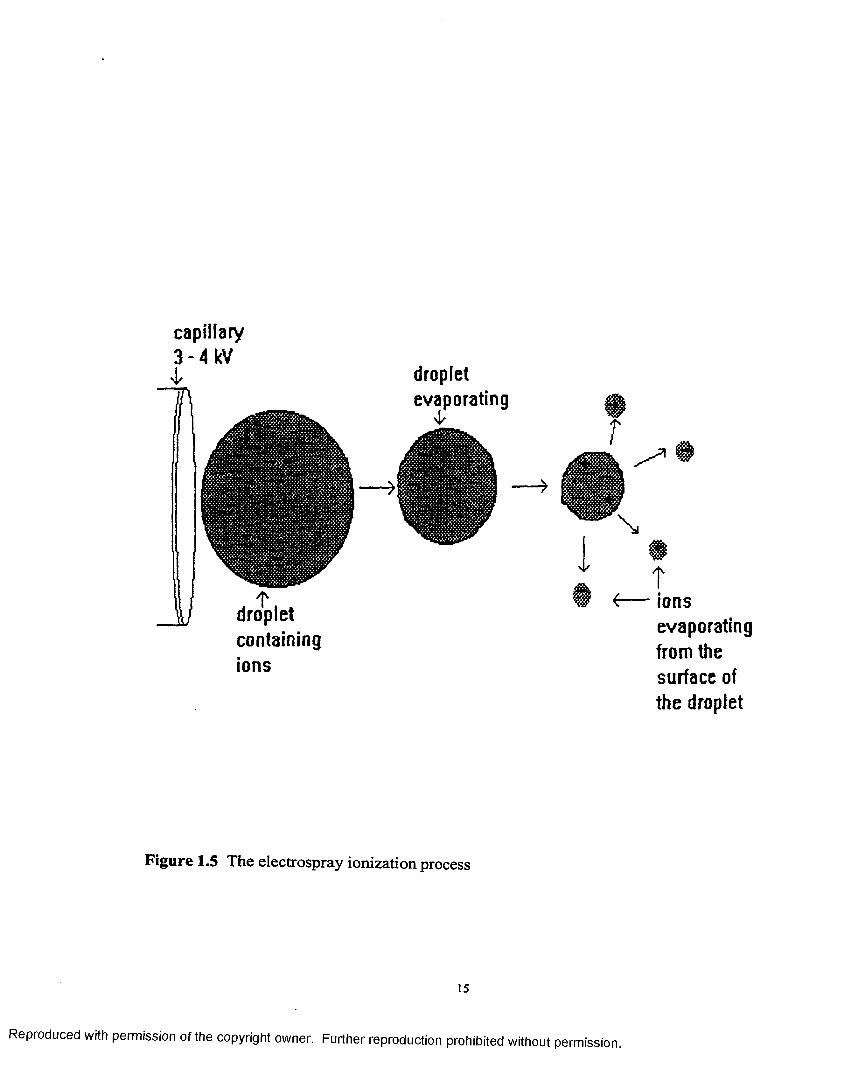
charge density is strong enough to desorb ions from the droplet into the ambient gas. The
desorbing ions include cations (or anions), to which are attached solvent or solute species
13
Reproduced with permission of the copyright owner. Further reproduction prohibited without permission.
that are not themselves ions, thus producing so called quasi-molecular ions for mass
analysis. The sequence is schematically represented in Figure 1.5.
The ions formed using any o f the above sources then pass into the next region of
the mass spectrometer, the analyzer, which is under vacuum. There are five different
types of analysers:
Quadrupole: It was originally developed by Paul and coworkers [13]. It is a device which
uses the stability of the trajectories to separate ions according to their xaJz ratio [14]. A
quadrupole electric field is created by electric potentials applied to four parallel rods of
hyperbolic cross section. At sufficient high translational energies, all ions will pass
through the quadrupole mass filter, but at energies below about lOOeV, mass selectivity
can be obtained using rods o f 20-3 Ocm length. Under such conditions the mass filter acts
as a path stability device if opposite pairs of rods are connected electrically and a DC
voltage U and a r f voltage, Vo coswt, are applied to the rods. For particular fields, ions
having a small range o f m/z values have stable paths through the filter and all other ions
are not transmitted.
Sector: This comprises two kinds (i) Magnetic Sector (ii) Electric Sector
In a magnetic sector when accelerated mi+ ions enter a magnetic field of strength
Bi, the ions follow a circular path o f radius R, perpendicular to the direction of the field
with a velocity vi where R is given by
R=miVi/Be or mtVi=RBe
If B is scanned at a fixed value o f R, then ions of different momenta, and hence of
different mass, can be made to pass through a collector slit to give a mass spectrum [15].
14
Reproduced with permission of the copyright owner. Further reproduction prohibited without permission.
capillary 3 -4 kV
J tdropletcontainingions
dropletevaporating
tonsevaporating from the surface of the droplet
Figure 1.5 The electrospray ionization process
15
Reproduced with permission of the copyright owner. Further reproduction prohibited without permission
The electric sector acts both as a focusing device for diverging ion beams and as a device
for dispersing ions according to their kinetic energies; It is directional focusing in that all
ions of the same energy emanating from the source slit with a small angular divergence
are brought to focus; It is energy dispersing in that ions having greater or lower energies
follow paths of greater or lower radii and are brought to focus at different positions. Since
most ion sources produce beams o f ions with a significant energy spread an electric
sector can be used to reduce the energy spread in the transmitted ion beam.
Quadrupole ion trap (QIT): An ion trap described by Paul and Steinwedel [16,17] is a 3-
D quadrupole in which the ions o f all masses are trapped on a three dimensional eight
shaped trajectory. It consists o f a circular electrode, and 2 end caps. A potential <j)0, the
sum o f a direct and alternative potential is applied to the caps, and — <J)o is applied to the
circular electrode. As the name suggests this instrument operates on the basis of first
storing ions of different masses inside the trap, which are then expelled according to their
masses to obtain a spectrum.
Fourier transform ion cyclotron resonance (FTICR): It was first developed in the mid
1970’s by Comisarow and Marshall [18]. Ions are first generated by a brief electron beam
pulse and stored in the trapped ion cell. After a brief delay the trapped ions are subject to
a short radio frequency pulse that increases linearly in frequency during its lifetime. After
the frequency sweep is discontinued the image current induced by the various ion packets
is amplified, digitized and stored in the memory. The time domain decay signal is then
transformed to yield a frequency domain signal that can be converted to a mass domain
signal.
Reproduced with permission of the copyright owner. Further reproduction prohibited without permission.
Time o f Flight (TOF): analysis was first described by Wiley and Mclaren [19] in 1955
and review papers were published by Cotter [20] and Wollnik [21] in 1983. The packet
o f ions produced by a laser pulse is extracted and accelerated by an electric field pulse of
103-104 V. The accelerated particles then pass into a field free drift tube of l-3m in
length. Since all ions entering the tube have the same kinetic energy, their velocities in
the tube must vary inversely with their masses with the lighter particles arriving earlier
than the heavy ones.
Mass spectrometry has for many years provided a particularly sensitive and
specific method for the identification o f organic compounds [22-24]. Despite the high
information content of MS data, its specificity can be inadequate for structure elucidation
of large molecules; the number o f possible isomers goes up exponentially with increasing
size. For organic mixture analysis information requirements also go up rapidly with
increasing mixture complexity, raising the probability that more than one component will
contribute to an individual mass peak. A method to effect an exponential increase in the
amount o f MS information that can be generated and retain the sensitivity, speed and
accuracy o f MS is the coupling of two (or more) analysers. They have the capability at
their interface to fragment the unique mass ions from MS-1 to yield characteristic product
ions o f many masses to be separated in MS-II. Tandem mass spectrometry [24-31], for
which the acronym “MS/MS’ has been coined [32,33] emulates GC-MS in replacing the
chromatograph by a mass separator. An advantage of this is speed; GC-MS is limited by
the time required for chromatographic separation (usually many minutes), while the
second MS only requires an additional ion transit time of 10‘5-10'3sec. In addition to the
specificity improvements in MS/MS versus MS, the sensitivity attainable in terms of
17
Reproduced with permission of the copyright owner. Further reproduction prohibited without permission.
signal to noise can also be improved substantially. Althougln the signal is reduced by the
inefficiency of post-MS-I fragmentation and MS-II transmission, the noise can be
reduced much more. This can be especially significant for chemical noise arising from
other parts of a large molecule in structure elucidation o r from other components in
complex mixture analysis. The MS/MS information for a giv*cn sample is the ion intensity
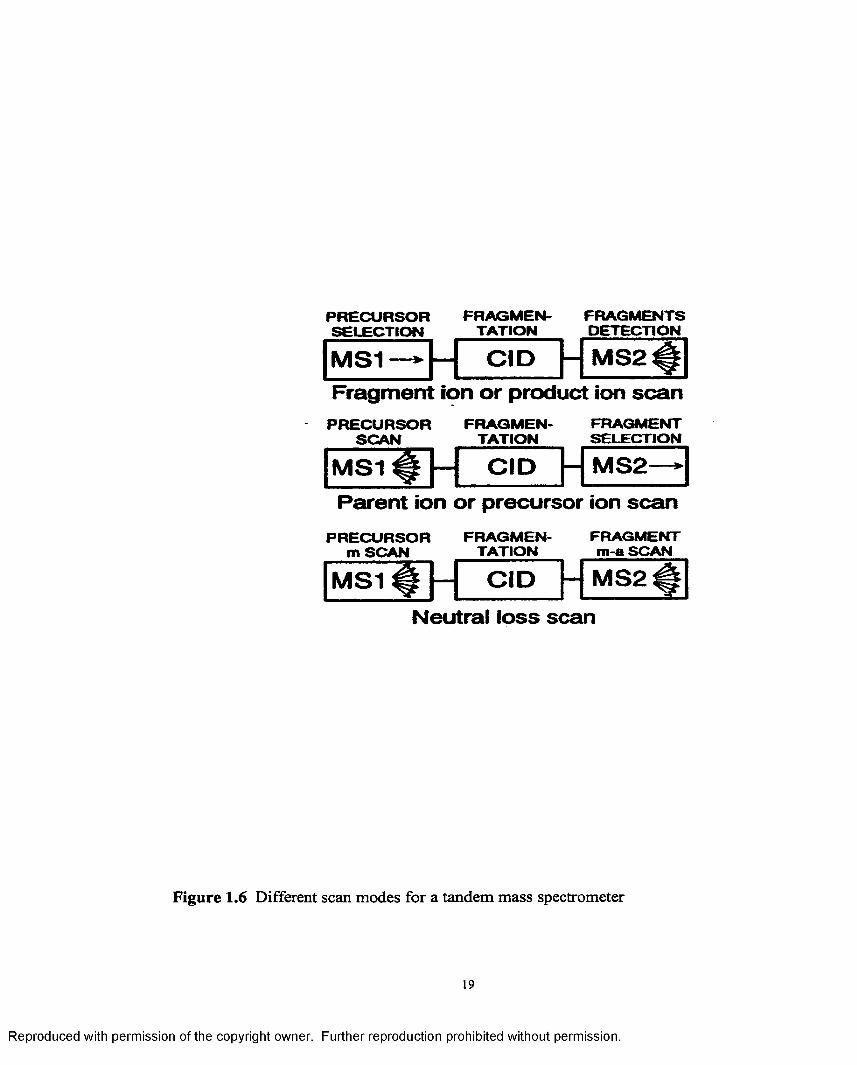
for each combination o f parent and daughter mass. In tandem mass spectrometry three
operational modes are possible considering an instrument that combines in sequence two
mass spectrometers separated by a collision cell represented in Figure 1.6.
1. Product ion scan (daughter scan) consists in selecting a yprecursor ion (or parent ion)
and in determining all o f the product ions (daughter ions) resulting from collision
induced dissociation (CID)
2. Precursor ion scan (parent scan) consists in choosing a product ion (or daughter ion)
and determining the precursor ions.
3. Neutral loss scan consists in selecting a neutral fragment and detecting all the
fragmentations leading to loss of that neutral.
Collision induced dissociation is a method to activate an iom, that is add internal energy
by collision with a neutral target (a gas or a solid). Often the optimum methods o f ion
formation do not impart sufficient energy to cause fragmentation of the molecular ion.
The internal energy o f the ion in these circumstances m ay be increased by collision
activation (CA). Tandem mass spectrometry (MS/MS), in all its configurations, has
emerged as the most important technique for acquiring collision activated dissociation
(CAD) or collision induced dissociation mass spectra. The overall CID process can be
separated into two consecutive steps occurring on
18
Reproduced with permission of the copyright owner. Further reproduction prohibited without permission.
PR E C U R SO R FRAGM EN- FRAGMENTSSELECTION TATION DETECTION
M S 1 - C I D - M S 2Fragm ent ion o r product ion scan
PR E C U R SO R SCAN
FRAGM EN-TATION
FRAGMENTSELECTION
M S 2C I DP aren t ion o r precursor ion scan
PR E C U R SO R m SCAN
FRAGM ENTATION
FRAGMENTm -aS C A N
M S 1 C I D - M S 2
N eu tra l loss scan
Figure 1.6 Different scan modes for a tandem mass spectrometer
19
Reproduced with permission of the copyright owner. Further reproduction prohibited without permission.
well separated time scales. The first is a fast (10'15-10'14 sec) CA step in which some
portion of the initial translational energy o f the accelerated ion is converted into energy of
both the ion and target (the target also acquires translational energy). The second step in
this process is the dissociation of the now energized and typically isolated ion. There are
different methods of ion activation: Collisions of accelerated ions with a stationary gas
phase target in the (a) High energy [32-36] (keV) and (b) low energy [37-39] ranges of
laboratory kinetic energy, surface induced dissociation [40,41], photodissociation [42,43]
and electron impact activation.
Various instruments are used in tandem mass spectrometry. A common
instrument used is the triple quadrupole mass spectrometer which will be described in
detail since it is used in the experiments. Other instruments combine electric and
magnetic sectors (E and B) or E, B, and Q, thus electric, magnetic sectors and
quadrupoles. Time of flight instruments, or a combination o f a magnetic instrument with
a time of flight instrument, are also used.
The triple quadrupole mass spectrometer was developed by Yost and Enke
[28,44], It consists o f three quadrupoles in tandem. The first and third quadrupoles are
regular quadrupole mass filters on which a DC and RE potential is applied. The second
quadrupole is not a mass filter but is a containment device for the ions undergoing
collision activation with a target gas which operates in the RE-only (total ion) mode with
only an RE voltage applied to it. The quadrupoles provide high transmission efficiency
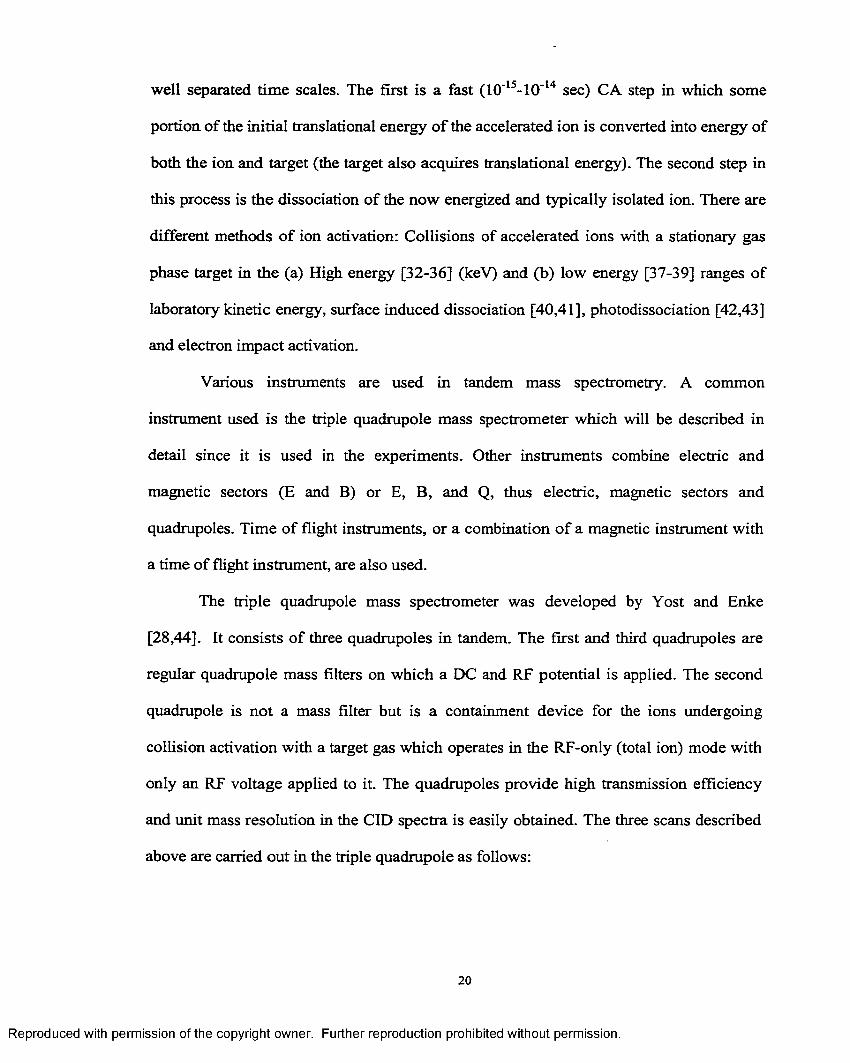
and unit mass resolution in the CID spectra is easily obtained. The three scans described
above are carried out in the triple quadrupole as follows:
Reproduced with permission of the copyright owner. Further reproduction prohibited without permission.
Daughter ion scan: The first quadrupole is set to transmit a selected mass while the last
quadrupole is scanned to produce a spectrum of all the fragment ions from the selected
precursor ion.
Parent ion scan: The last quadrupole is set to transmit the selected fragment ion while the
first quadrupole is scanned to produce a spectrum of all the precursor ions that
fragmented to produce the selected fragment ion.
Neutral loss scan: Both the mass filters are scanned simultaneously with a fixed
difference in mass.
Mass Spectrometry of Carbohydrates
Mass spectrometry was first applied to carbohydrate derivatives in 1958 when
Reed and co-workers [45] reported the mass spectra o f D-glucose, D-galactose, methyl
alpha and beta glucopyranosides and a number of disaccharides. Typically glycans [46]
and glycoconjugates [46-48] were derivatized to increase their volatility and thermal
stability inorder to permit determination of their molecular weights and structures by
electron impact and chemical ionization [46,49]. This is accomplished by either
alkylation of all hydroxy and acetamido functions with methyl groups [50] or
esterification with acetyl groups. Structure determination o f permethylated or
peracetylated small glycans has been accomplished by electron impact ionization [46,47],
Kotchetkov and coworkers [51-53] studied permethylated disaccharides having 1—>2,
1-»4,1—>6 linked hexose residues which led to the nomenclature o f fragment ions from
oligosaccharides [54,55].
Between 1965-1970 Bengt Lindberg at the Karolina Institute in Stockholm
developed the procedure of linkage analysis using Corey/Hakomori methylation and
21
Reproduced with permission of the copyright owner. Further reproduction prohibited without permission.
GC/MS. The saccharide is methylated at the free hydroxyl group followed by hydrolysis
o f the glycosidic bonds to monosaccharides, the carbonyl groups are reduced and finally
the hydroxyl groups liberated are derivatized by acetylation [56]. Separation o f the
resulting partially methylated alditol acetates were carried out by gas chromatography
and identification of the linkage position by EI-MS [57]. The feasibility o f the
technology was demonstrated by Hellerqvist in the structural analysis o f the salmonella
typhimurium liposaccharides [58], which along with a paper by Bjomdal [56] became a
citation classic. The disadvantage of the methylation analysis procedure is that it requires
a long and tedious protocol including several chemical degradation and derivatization
steps, labor extensive, and required large sample amounts. Hence it would be necessary
to develop simple and more sensitive techniques for structural analysis of
oligosaccharides. Much of the relevant literature has been reviewed up through 1974 by
Longren and Svensson [59].
An improvement in the sensitivity o f the Lindberg method was achieved by Laine
et al. using CI-MS which allowed an analysis down to 5-10ug [60]. Chemical ionization
has shown to enhance the abundance of high mass ions in the spectra o f derivatized
carbohydrates and the overall sensitivity is comparable to EL The disadvantage of
chemical ionization is that the procedure becomes very difficult with very small amounts
of sample or if sensitive functional groups are present. Califomium-252 fission fragment
plasma desorption TOF mass spectrometry was developed by Jardine in collaboration
with Brennan [61]. However with the advent of MALDI the popularity of PDMS has
declined. Field desorption (FD) mass spectrometry has been used in the structural
analysis of oligosaccharides [62]. However in some cases complete structural
22
Reproduced with permission of the copyright owner. Further reproduction prohibited without permission.
characterization by FD mass spectrometry is not possible since fragment ions which are
structurally specific are either absent or o f low intensity. Field desorption allows the
detection o f pseudo-molecular [M+H]"*" ions from underivatized saccharides and
derivatized saccharides such as permethylated and peracetylated saccharides [63,64],
This technique has been mainly used for molecular weight determination together with
prominent fragment ions resulting from cleavage of the glycosidic bond. Even though
field desorption played an initial important role [65]. it has been overshadowed by the
ease of maintaining a stable molecular ion beam with FAB for use with sector
instruments. FAB has been exploited to a great extent for the analysis o f carbohydrates
because it is sensitive. It does away with any force o f derivatization, since it is not
dependent on volatility. Underivatized glycoconjugates, which cannot be analyzed by
conventional El mass spectrometry, can be analyzed by this technique, and it gives
molecular weight information.
FAB has been used extensively for determination of the interglycosidic linkages
in both derivatized and underivatized carbohydrates [66-72], FAB MS/MS is the mass
spectrometric technique that is most often used in the analysis of oligosaccharides. This
technique is useful in the case o f pseudomolecular ions (M-H)' [68], (M+H)+[71-74],
(M+alkali metals)+[75,76] of native or derivatized oligosaccharides. Oligosaccharides
show a tendency to yield low intensity pseudomolecular ions: peracetylation or
permethylation is used to increase their hydrophobicity and allow an increase in the
intensity o f these ions [77], The derivatization and/or presence of alkali metals influences
the fragmentation mechanism and the fragmentation pattern.
Reproduced with permission of the copyright owner. Further reproduction prohibited without permission.
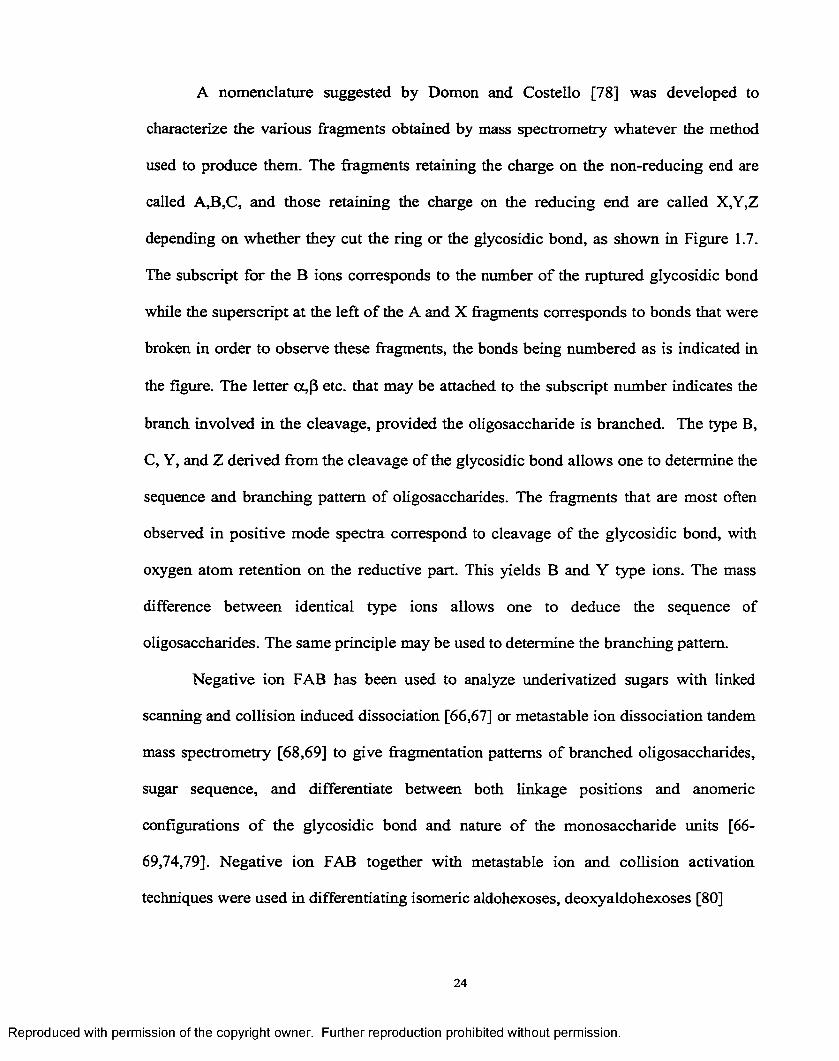
A nomenclature suggested by Domon and Costello [78] was developed to
characterize the various fragments obtained by mass spectrometry whatever the method
used to produce them. The fragments retaining the charge on the non-reducing end are
called A,B,C, and those retaining the charge on the reducing end are called X,Y,Z
depending on whether they cut the ring or the glycosidic bond, as shown in Figure 1.7.
The subscript for the B ions corresponds to the number o f the ruptured glycosidic bond
while the superscript at the left o f the A and X fragments corresponds to bonds that were
broken in order to observe these fragments, the bonds being numbered as is indicated in
the figure. The letter oc,(5 etc. that may be attached to the subscript number indicates the
branch involved in the cleavage, provided the oligosaccharide is branched. The type B,
C, Y, and Z derived from the cleavage of the glycosidic bond allows one to determine the
sequence and branching pattern of oligosaccharides. The fragments that are most often
observed in positive mode spectra correspond to cleavage of the glycosidic bond, with
oxygen atom retention on the reductive part. This yields B and Y type ions. The mass
difference between identical type ions allows one to deduce the sequence of
oligosaccharides. The same principle may be used to determine the branching pattern.
Negative ion FAB has been used to analyze underivatized sugars with linked
scanning and collision induced dissociation [66,67] or metastable ion dissociation tandem
mass spectrometry [68,69] to give fragmentation patterns o f branched oligosaccharides,
sugar sequence, and differentiate between both linkage positions and anomeric
configurations o f the glycosidic bond and nature o f the monosaccharide units [66-
69,74,79]. Negative ion FAB together with metastable ion and collision activation
techniques were used in differentiating isomeric aldohexoses, deoxyaldohexoses [80]
24
Reproduced with permission of the copyright owner. Further reproduction prohibited without permission.
Figure 1.7 Nomenclature suggested by Domon and Costello
25
Reproduced with permission of the copyright owner. Further reproduction prohibited without permission.
and substituted glucose and glucosamine [81]. Leary and co-workers [82,83] used
FAB/MS/MS to determine the linkage position of lithium cationized disaccharides in the
positive ion mode. Laine et al. [84] also used fast atom bombardment and collision
induced dissociation in a study on three linkage isomeric trisaccharides to ascertain
whether the ion patterns could distinguish among the three possible linkage positions o f
the terminal fucose in otherwise identical structures. Molecular modeling was also carried
out to support the suggestion that steric factors and the position of the fucose linkage
relative to GlcNac contributed to bond stability during collision activation. The study
[85,86] was then extended to oligosaccharides terminating in a (3-D- galactose where
linkage discrimination was shown among a permethylated set o f six synthetic
oligosaccharides. Even though FAB has been used extensively in the structural
elucidation o f carbohydrates it has a poor detection limit and sensitivity. These problems
were overcome by matrix assisted laser desorption (MALDI) [87] and electrospray (ESI)
[88] that have dramatically impacted carbohydrate analysis by allowing ion production
for large thermally labile oligosaccharides. Native or derivatized oligosaccharides can be
analyzed by MALDI with great sensitivity [89-91]. In MALDI-TOF the oligosaccharide
ions are normally activated by post source decay [92,93] which is a spontaneous
decomposition of the molecular ion in the first field free region and a subsequent analysis
of the fragment ions by a reflectron instrument. MALDI in conjunction with magnetic
sector instruments provided limited sequence and branching information even though the
ions decomposed spontaneously in the ion source of the mass spectrometer.
Spengler et al. [93] studied native oligosaccharides under post source decay
conditions where glycosidic cleavages predominated under the low energy conditions,
26
Reproduced with permission of the copyright owner. Further reproduction prohibited without permission.
while Lemoine et al. [94] did a study on various permethylated, peracetylated and
reductively aminated oligosaccharides. MALDI in conjunction with magnetic sector
instruments provided limited sequence and branching information even though the ions
decomposed spontaneously in the ion source of the mass spectrometer. Hence high
energy CID spectra of underivatized oligosaccharides ionized by MALDI was carried
out by Green et al. [95] using a sector instrument combined with an orthogonal tandem
time of flight analyzer. This method provided good sequence, branching, and linkage
information. Further work on sequence and linkage information o f underivatized
oligosaccharides was carried out by Librella and coworkers [96] using alkaline
degradation and MALDI ionization Fourier transform mass spectrometry. They also used
MALDI-FTMS to obtain a correlation between the fragment ion yield and degree of
branching for oligosaccharides as well as the relationship between the size o f the alkali
metal ion and yield o f fragment ions [97].
A very viable alternative to structural analysis of oligosaccharides is electrospray
ionization which is regarded as an effective means for their characterization [98,99]. As a
structural analysis technique for carbohydrates and lipids, ESI-MS is useful because
processes such as desalting a sample, adding organic solvents, and applying heat to
evaporate solvents, all of which are considered harsh to protein conformations, do not
seriously affect the mass analysis o f carbohydrates except for binding studies. In the latter
case conformation plays an important role. Further, it has high sensitivity and low
background noise. Electrospray has been used by several groups to characterize native
[100,101] and derivatized [102,103] carbohydrates, where it has the high sensitivity that
is suitable for glycan analysis. It is also useful in the analysis o f carbohydrate mixtures.
27
Reproduced with permission of the copyright owner. Further reproduction prohibited without permission.
This can be applied to studies o f glycan heterogenity associated with specific molecular
weight intervals. Various derivatization techniques have been used such as
peracetylation, permethylation [104,105], reductive animation [106].
Derivatization techniques improve the signal by using more volatile organic
solvents which permit a significant increase in detection sensitivity. For the linkage
analysis o f glucose disaccharide isomers fragmentation rules approximately the same as
those in FAB were reported in 1991. Garuzzo et al. [107] characterized fragmentational
differences among glucopyranose-(3-(l-C—>2,-3 ,-4,-6) of glucose by applying skimmer
collisions (in source fragmentation) in negative ions ESI-MS. Characterization o f
underivatized large neutral oligosaccharide by ESI-MS was reported in 1993 on a
synthetic poly-N-acetyllactosamine type pentasaccharide, which corresponds to the sugar
chain of the glycoconjugate having blood group 6, activity [108]. Fura and Leary [109]
analyzed three isomeric branched trisaccharides coordinated to calcium and magnesium
by electrospray ionization followed by tandem mass spectrometry. Linkage positions o f
the glycosidic bond between the reducing and non reducing rings were determined in all
the three isomers and the linkage of the fucose ring was determined in two of the three
isomers when calcium is used as the coordinating metal. A stereochemical differentiation
was made by Gaucher et al. [110] using ESI-ion trap mass spectrometry between
mannose, glucose, galactose and talose with zinc diethylene triamine. The same
technique was used for structural analysis o f complex linked glycoprotein
oligosaccharides by Harvey et al. [111].
High performance liquid chromatography is a fundamental yet important
technique for the separation of oligosaccharides. However, few studies using LC/MS
28
Reproduced with permission of the copyright owner. Further reproduction prohibited without permission.
have been done for analysis o f carbohydrates [112]. Kohler and Leary [113] used
LC/MS/MS with post column addition of metal chlorides using a triaxial electrospray
probe to accomplish sensitivity enhancement and structural analysis o f carbohydrates. Li
and Her [114] analyzed disaccharides and linear oligosaccharides labeled with a
chromophore by online coupling of HP1C with ESI-CED. This approach was used to
ascertain linkage position and sequence o f linkages o f linear oligosaccharides. Structural
analysis involving sequence and branching of oligosaccahride alditols was carried out by
a combination of HPLC and ESI MS/MS [115] after metal periodate oxidation and
derivatization with 2 aminopyridine.
Molecular Modeling of Carbohydrates
In both the industrial and biological functions o f carbohydrates, the three
dimensional characteristics of carbohydrates are important. For three-dimensional
structure the natural questions that arise are whether the relatively minor changes in the
chemical structure produce meaningful changes in conformation and if so whether the
environment (crystalline, solution or protein) plays a role in bringing about and
stabilizing these changes. To address these questions, it is important to find the amount of
energy required to alter the various geometrical parameters within a molecule. Many of
these stereochemical features are described for carbohydrates in the classic text by
Stoddart [116]. The importance of sterochemistry is underscored by the unique physical
and chemical properties of the individual sugars, many of which are configurational
isomers. Stereochemistry also plays a role in determining the properties of
polysaccharides. Molecular shape is as significant for the properties of an industrially
modified starch as it is for the recognition of one particular blood type and the rejection
29
Reproduced with permission of the copyright owner. Further reproduction prohibited without permission.
of others. Molecular shape is defined by three different types o f molecular parameters:
bond lengths, bond angles and torsion angles. Variations in the molecular geometry o f a
molecule are defined as changes in these parameters: bond stretching or compression,
bond bending or deformation and bond twisting or torsion. Coincident with the increased
interest in carbohydrates, techniques for studying molecular shape have increased. Single
crystal diffraction studies can give a fast and precise description o f molecules in the solid
state. Recent advances in nuclear magnetic resonance provide increased detailed
conformational information about the solid state as well as on solutions. However, the
structural characteristics o f many carbohydrate molecules remain unknown. It is often
difficult to obtain single crystals needed for crystallography, even if the required amount
of pure material is available to attempt crystal growth. Some carbohydrates persist as
syrups, and oligomers and polymers often form microcrystalline particles or fibers that
yield inadequate data for a complete structural determination by diffraction methods
alone. In 1969, D.W. Jones supplemented fiber diffraction data from cellulose with a
computer model, a list o f proposed atomic coordinates that were stored in a digital
computer [117]. He then calculated the diffraction intensities that would arise from the
models and compared them with the observed intensities. The model was repeatedly
readjusted, with intensities calculated and compared at each adjustment, in a trial and
error study. While inconclusive, this was one of the first reports o f computer modeling of
a carbohydrate. More recently the interpretation o f coupling constants and nuclear
overhauser effects from Nmr spectra has been expedited by computer models that provide
a ready source o f distances and angles. Since these early efforts, computer modeling has
become an integral part o f some procedures for structural determination. Theory is better
30
Reproduced with permission of the copyright owner. Further reproduction prohibited without permission.
combined with experiment, so that each can support the other. However, some problems
are not amenable to experiment. Acyclic glucose, for example occurs in such small
concentrations that experimental data are overwhelmed by data from the pyranose forms.
In contrast a model is easily built and studied. A good modeling study provides a
framework for integrating the experimental results from various techniques to provide a
good overall understanding.
Molecular modeling calculations attempt to predict physical properties for
molecular systems based on the numerical solution o f the equations that embody the
physical laws that govern their behavior [118,119]. At the most fundamental level, this
approach involves the direct solution o f Schrodinger’s equation for the nuclear and
electronic degrees o f freedom. Since these studies determine energies directly from first
principles, they are referred to as ab initio or nonempirical calculations. Such calculations
rapidly become impossible in the practical sense for systems containing more than a few
atoms heavier than hydrogen, and it becomes necessary to invoke various additional
approximations to extend these calculations to systems containing more than two dozen
atoms.
Molecular mechanics is one such approach to treat the motions o f atomic nuclei
as classical particles, since most of the quantal character o f molecules resides in their
electronic motions. It is then possible to use the Bom-Oppenheimer approximation to
solve for the electronic energies at fixed nuclear positions, and to treat these electronic
energies as the potential energy field for the nuclear motions. After this separation,
analytic, empirical energy functions may be used to approximate the way in which the
molecular energy changes with the coordinates of the constituent atoms. Any technique
31
Reproduced with permission of the copyright owner. Further reproduction prohibited without permission.
will be called a “molecular mechanics” (mm) calculation if it uses such analytic energy
functions to predict changes in a system’s energy arising from variations in its atomic co
ordinates [118,119]. The empirical energy functions used in mm calculations usually
consist of sums o f terms representing various easily conceptialized contributions to the
total energy of a molecule. For example, such energy functions generally contain terms to
represent the energy of stretching or compressing chemical bonds, bending bond angles
and changing torsion angles which are intramolecular motions o f a molecule. These
functions also generally contain terms to represent Van der Waals (non bonded)
interactions, hydrogen bonding and electrostatic interactions between the various partially
charged atoms and /or dipoles in a molecule. These energy contributions contribute to the
total energy of the molecule and are represented by equation 1.
Etot=Eb+Ea+Etor+Enb+Ehb+Eelst (1)
Eb= bond stretching
Ea= angle bending
EjoP internal rotation
Enb= nonbonded interaction
Ehb— hydrogen bonded interaction
EekF electrostatic interaction
MM3 is one such molecular mechanics program developed by Allinger et al.
[120] that is used for the molecular modeling described in this thesis. It has several
advantages in that it takes into account lone pair effects. It has separate parameters for the
ring oxygen, glycosidic oxygen and anomeric carbon, which differ for the a and P
anomers in the calculation of the energy terms. Further, it compensates for the anomeric
32
Reproduced with permission of the copyright owner. Further reproduction prohibited without permission.
effect, and an attempt is made to account for the bond length distance changes arising
from torsional changes in anomeric (O-C-O-C) sequences. It also has a dilhedral driver
facility that accepts the initial, final and increment size values o f the two torsion angles <()
and \{/.
Scope of Work
The focus o f this dissertation is the investigation and development o f a method to
differentiate stereoisomeric synthetic peralkylated disaccharides using electrospray
ionization in conjunction with tandem mass spectrometry. Molecular modieling of the
permethylated derivatives is carried out to rationalize the fragmentation ratios observed
in the mass spectrometer. Our research is targeted at not only differentiating glucose-
glucose anomers but in understanding the mechanism by which the differentiation is
made and to examine the effects o f the alkyl groups on glycosidic bond cleavage. Studies
to understand carbohydrate structure is important because o f the growing interest in the
biological function attributed to these moieties. Carbohydrates and their glycoconjugates
are found to be crucial participants in the biochemical basis o f cell-cell interaction. The
evidence for these interactions has been growing and is strongly supported b-y the use of
carbohydrate inhibitors, deglycosylating enzymes and site directed mutagenicity of
participating glycans. From these studies carbohydrates appear to serve as the “Velcro”
of adhesion, decoys against bacterial invasion, the modulators of protein structure and
epitopes for molecular targeting and trafficing. Numerous human parasites through
molecular mimicry have capitalized on these intricate functional roles to subvert immune
surveillance, invade and thrive within human cells. Wherever confining membrane
surfaces occur, and signal transduction is carried out, the diversity and specificity of the
33
Reproduced with permission of the copyright owner. Further reproduction prohibited without permission.
carbohydrate molecule are likely to be utilized as a conduit for this communication. Thus
in order to better understand the biological functional roles o f carbohydrates a rapid
method for the anomeric configuration differentiation and an understanding of how the
differentiation is made is important. The anomeric configuration determination is crucial
because prior knowledge of it gives information of which anomer plays a more important
role in its biological functions and thus enable design o f more effective drugs based on
the interactions o f the carbohydrates with receptors like proteins. Further the geometry
and torsion angles about the glycosidic linkage are the most important geometrical
parameters in defining the three dimensional structure o f olgosaccharides. Since the latter
determine their biological functions, the stereochemistry o f this linkage is important.
The disaccharides investigated were the anomers o f the I -A and 1 ->6 linked
disaccharides that were derivatized with alkyl groups ranging from methyl to pentyl. In
Chapter 2 the synthesis of these disaccharides and other linkage isomeric glucose-glucose
disaccharides viz. 1-»1, l->2, l->3 derivatized with the same alkyl groups were
synthesized. Further the l->4 and l->6 linkage disaccharides were esterified with acetyl,
pivaloyl and mesitoyl functional groups and last of all silylated with tert-butyl-
dimethylsilyl groups (TBDMS). A large number of derivatives were synthesized with the
goal o f carrying out electrospray collision induced studies. However, in this thesis, the
results o f the mass spectrometric studies of only the peralkylated I - A and l->6 linkage
isomeric disaccharides will be presented.
In chapter 3, the electrospray collision induced dissociation studies on the
disaccharides mentioned above will be discussed to examine their anomeric configuration
differentiation and the effect o f alkyl groups on glycosidic bond cleavage. The
34
Reproduced with permission of the copyright owner. Further reproduction prohibited without permission.
conformational analysis o f the permethylated disaccharides of the 1-+4 anomeric pairs
will also be discussed to rationalize the mass spectrometric results.
Finally Chapter 4 presents a conformational analysis of both the native and
permethylated 1—>1, 1—>2, 1—>3 and 1—>4 glucose-glucose disaccharides. The 1—>4
anomeric pair is explained here in a different light with a discussion of the 2-dimensional
energy surfaces, the minimum energy structures and the effect of methylation through
difference plots o f the energy surfaces between the methylated and native surfaces.
References
1. McNaught, A. Pure Appl. Chem. 1996, 1919
2. Bleakney, W. Phys. Rev. 1929, 34, 157
3. Nier, A.O. Rev. Sci. Instrum. 1947, 18, 4154
4. Munsun, M.S.B.; Field, F.H. J. Am. Chem. Soc. 1966, 88, 2621
5. Barber, M.; Bardoli, R.S.; Sedgwick, R.D.; Tyler, A.H. J. Chem. Soc. Chem. Commun. 1981, 325
6. Beckey, H.D. Principles o f Field Ionization and Field Desorption in Mass Spectrometry, Permagon Press, Oxford, 1977
7. Mcneal, C.J.; Mcfarlane, R.D. J. Am. Chem. Soc. 1981, 103, 1609
8. Olesik, J.W. Anal. Chem. 1991, 63, 12A
9. Blakney, C.R.; Vestal, M.L. Anal. Chem. 1983, 55, 750
10. Karas, M.; Buchmann, D.; Hillenkamp, F Anal.Chem. 1985, 57, 2935
11. Yamashita, M.; Fenn, J.B. Phys. Chem. 1988, 88, 4451
12. Yamashita, M.; Fenn, J.B. Phys. Chem. 1988, 88, 4671
13. Paul,W.; Steinwedel, H.S. Z, Naturforsch 1953, 8a, 448
14. Ferguson, R.E.; Mckulloh, K.E.; Rosenstock, H.M. J. Chem. Phys. 1965, 42, 100
35
Reproduced with permission of the copyright owner. Further reproduction prohibited without permission.
15. Cooks, R.G.; Beynon, J.H.; Caprioli, R.M.; Lester, G.R. Metastable Ions Elsevier, Amsterdam, 1973
16. Paul, W.; Steinwedel, H.S. US patent 2 939 952 1960
17. Todd, J.F.J. Mass Spectrom Rev 1991,10, 3
18. Comisarow, M.B.; Marshall, A.G. Chem. Phys. Lett. 1974,25,282
19. Wiley, W.C.; Mclaren, J.B Rev. Sci. Instrum. 1955,26, 1150
20. Cotter, R.J. Anal. Chem. 1992, 64, 1027A
21. Wollnik, H. Mass Spectrom. Rev. 1993, 12, 8922
22. Beynon, J.H. Mass Spectrometry and its Applications to Organic Chemistry Elsevier, Amsterdam, 1960
23. Biemann, K. Mass Spectrmetry: Organic Chemical Applications Mcgraw -Hill, 1962
24. Budzikiewicz, H.; Djerassi, C.; Williams, D.W. Mass Spectrometry o f Organic Compounds Holden- Day, San Francisco, 1967
25. Krueger, T.L.; Litton, J.F.; Kondrat, R.W.; Cooks, R.G. Anal. Chem. 1976, 48, 2113
26. Levson, K.; Schwarz, H. Agnew. Chem. Int. Ed. Engl. 1976, 15, 509
27. Kondrat, R.W.; Cooks, R.G. Anal.Chem. 1978, 50, 81A
28. Yost, R.A.; Enke, C.G. Anal. Chem. 1979, 51, 1251A
29. Mclafferty, F.W. Acc. Chem. Res. 1980, 13, 33
30. Mclafferty, F.W.; Bockhoff, F.M. Anal. Chem. 1978, 50, 69
31.Haddon, W.F. High Performance Mass Spectrometry M.L. Gross ed. American Chemical Society: Washington, D.C. 1978, pp 97-119
32. Jennings, K.R. IntJ.M ass Spectrom Ion Phys. 1968, 1, 227
33. Haddon, W.F.; Mclafferty, F.W. J. Am. Chem. Soc. 1968, 90, 9745
34. Mclafferty, F.W.; Bente, P.F.; Komfield, R.; Tsai, S.C.; Howe, I. J. Am. Chem. Soc. 1973,95, 2120
35. Cooks, R.G. Collision Spectroscopy 1978, Plenum, New York
36
Reproduced with permission of the copyright owner. Further reproduction prohibited without permission.
36. Levson, K.; Schwarz, H. Afass Spectrom Rev. 1983, 2, 77
37. Kaplan, F. J. Am. Chem. Soc. 1968,90,4483
38. Dawson, P.H.; French, J.IB.; Buckley, J.A.; Douglas, D.J.; Simmons, D. Org. Mass Spectrom. 1982, 17, 205
39. Herman, Z; Futrell, H. J.; Fredrich, B. Int. J. Mass Spectrom. Ion. Proc. 1984, 58, 181
40. Mabud, Md.A.; Dekrey, M.J.; Cooks, R.G. Int. J. Mass Spectrom. Ion Proc. 1985, 67,285
41. Dekrey, M.J.; Mabud, Md.A.; Cooks, R.G.; Syka, J.E.P. Int. J. Mass Spectrom. Ion Proc. 1985, 67,295
42. Bomse, D.S.; Woodin., R.L.; Beauchamp, J.L. J. Am. Chem. Soc. 1979, 101, 5503
43. Dunbar, R.C. Gas Phase Jon Chemistry Boweres, M.T., ed. Vol.2, Academic Press, New York, 1979
44. Yost, R.A.; Enke, C.G. J. Am. Chem. Soc. 1978, 100,2274
45. Finan, P.A.; Reed, R.J.; Smeedon, W. Chem. Ind. (London) 1958, 1172.
46. Radford, T.; De Jongh, D*.C. Biochemical Applications o f Mass Spectrometry (G.R. Waller and O.S. Dermer, eds.), Wiley(Interscience), New York, 1980, p255.
47. Karlsson, K.A. Progr. Chem. Fats other Lipids 1978, 16, 207
48. Wood, G.W. Biochemical Applications o f Mass Spectrometry (G.R.Waller and O.S. Dermer, eds.). Wiley (Interscience), New York 1980, p i73
49. Reinhold, V.N.; Carr, S.A. Mass Spectrom. Rev. 1983, 2, 153
50. Hakomori, S.I. J. Biochem. (Tokyo) 1964, 55, 205
51. Kochetkov, N.K.; Chizov, O.S. Adv. Carb. Chem. 1966, 21, 39
52. Kochetkov, N.K.; Chizov, O.S.; Bochkov, A.F. MTP International Review o f Science: Organic Chemistry Series One, Butterworths, London 1973, 17, 147
53. Kochetkov, N.K.; Chizov, O.S.; Poliakova, L.A. Doki, Akad. Nauk. SSSR 1964, 158, 685
54. Kovacik, V.; Rosik, J.; Kovac, P. Carb Res. 1962, 8, 622
55. Kovacik, V.; Rosik, J.; Kovac, P. Carb Res. 1962, 8, 291
37
Reproduced with permission of the copyright owner. Further reproduction prohibited without permission.
56. Bjomdal, H.; Hellerquist, C.G., Lindberg, B; Svensson, S. Agnew. Chem. Inti ed. Engl. 1970,9,610
57. Bjomdal, H.; Lindberg, B.; Svensson, S. Carb. Res. 1970, 15, 339
58. Hellerqvist, C.G.; Lindberg, B.; Svensson, S.; Holme, T.; Lindberg,A.A. Carb. Res. 1970,1968,8 ,43
59. Lonngren, J.; Svennson, S. Adv. Carbohydr. Chem. Biochem. 1974,29,42
60. Laine, R.A. Anal. Biochem. 1981, 116, 383
61. Jardine, I.; Scanlen, G.; Mcneil, M.; Brenan, P.J. Anal. Chem. 1989,61, 416
62. Komori, T.; Kawamura, M.; Miyahara, K.; Kawasaki, T.; Tanaka, O.; Yahara, S.; Schutan, H.R. Naturforsch, Z. 1979, 34C, 1094
63. Deutsch, J. Org. Mass Spectrom. 1980, 15, 240
64. Costello, C.E.; Nilson, B.W.; Biemann, K; Reinhold, V.N. Cell Surface Glycolipids, Sweeeley, C.C. ed. ACS symposium series 128,1980, Washington DC p35
65. Moor, J.; Wright, E.S. Org. Mass Spectrom. 1974, 9, 903
66. Ballisteri, A.; Montauda, G.; Garuzzo, D.; Giuffrida, M.; Impallomeni, G. Rapid Commun. Mass Spectrom. 1989, 7, 202
67. Garuzzo, D.; Giuffrida, M.; Impallomeni, G.; Balhstreri, A.; Montauda, G. Anal. Chem. 1990, 62, 279
68. Dallinga, J.W.; Heerma, W. Biol. Mass Spectrom. 1991, 20, 99
69. Dallinga, J.W.; Heerma, W. Biol. Mass Spectrom. 1991, 20, 215
70. Domon, B.; Muller, D.R.; Richter, W.J. Org. Mass Spectrom. 1989, 24, 357
71. Domon, B.; Muller, D.R.; Richter, W.J. Biomed. Environ. Mass Spectrom. 1990, 19, 390
72. Domon, B.; Muller, D.R.; Richter, W.J. Int. J. Mass Spectrom. Ion Processes 1990, 100, 301
73. Carr, S.A.; Reinhold, V.N.; Green, B.N.; Hass, J.R. Biomed. Environ. Mass Spectrom. 1985,12,288
74. Bosso, C.; Heyraud, A.; Petron, L. Org. Mass Sepctrom. 1991, 26, 321
75. Orlando, R. Bush, A.; Fenselau, C. Biomed. Environ. Mass Spectrom. 1990, 19, 390
38
Reproduced with permission of the copyright owner. Further reproduction prohibited without permission.
76. Lemoine, J.; Foumet, B.; Desepyroux, D.; Jennings, R.;Rosenburg, R.; de Hoffman, E. J. Am. Soc. Mass Spectrom. 1993, 4, 197
77. Dell, A. Methods in Enzymol. 1990, 193, 647
78. Domon, B.; Costello, C.E. Glycoconjugate J. 1988, 5,397
79. Garuzzo, D.; Impallomeni, G.; Montaudo, G.; Spina, E. Rapid Commun. Mass Spectrom. 1992, 6, 550
80. Dallinga, J.W.; Heerma, W. Biomed. Mass Spectrom. 1989, 18, 363
81. Dallinga, J.W.; Rinkema, F.D.; Heerma, W. Biomed. Mass Spectrom. 1989, 18, 241
82. Hofineister, G.E.; Zhou, Z.; Leary, J.A. J. Am. Chem. Soc. 1991,113, 5964
83. Zhou, Z.; Ogden, S.; Leary, J.A. J. Org. Chem. 1990, 55, 5444
84. Laine, R.A.; Pamidimukkala, K.; French, A.D.; Hall, R.W.; Abbas, S.A.; Jain, R.K.; Matta, K.L. J. Am. Chem. Soc. 1988, 110, 6931
85. Laine, R.A.; Yoon, E.; Mahier, T. J.; Abbas S. A.; Lappe, B.de; Jain R.K. and Matta, K.L. Biol. Mass Spectrom. 1991, 20, 505
86. Yoon, E; Laine, R.A. Biol. Mass Spectrom. 1992, 21, 479
87. Karas, M.; Hillenkamp, F. Anal. Chem. 1988, 60, 2299
88. Fenn, J.B.; Mann, M.; Meng, C.K.; Wong, S.F.; Whitehouse, C.M. Science, 1989,246, 64
89. Harvey, D.J. Rapid Commun. Mass Spectrom. 1993, 7, 614
90. Stahl, B.; Thurl, S.; Zeng, J.; Karas, M.; Hillenkamp, F.; Sawatzki, G. Anal.Biochem. 1994,223,218
91. Harvey, D.J.; Rudd, P.M.; Bateman, R.H.; Bordolik, R.S.; Vichess, R.G. Org. Mass Spectrom. 1994, 29, 753
92. Spengler, B.; Kirsch, D.; Kaufmann, R. Rapid Commun. Mass Spectrom. 1992, 6,105
93. Spengler, B.; Kirsch, D.; Kaufmann, R.; Lemoine, J. Org. Mass Spectrom. 1994, 29, 736
94. Lemoine, J.; Chirat, F.; Domon, B. J. Mass Spectrom. 1996, 31,908
39
Reproduced with permission of the copyright owner. Further reproduction prohibited without permission.
95. Harvey, D.J.; Bateman, R.H.; Green, M.H. J. Mass Spectrom. 1997,32, 167
96. Penn, S.G.; Cancilla, M.T.; Lebrilla, C.B. Anal. Chem. 1996, 68,2331
97. Cancilla, M.T.; Penn, S.G.; Caroll, J.A.; Lebrilla, C.B. J. Am. Chem. Soc. 1996, 118, 6736
98. Reinhold, V.N.; Reinhold, B.B.; Costello, C.E. Anal. Chem. 1995, 67, 1772
99. Viseux, N.; de Hofmann, E.; Domon, B. Anal. Chem. 1997,69, 3193
100. Carr, S.A.; Huddleston, M.J.; Bean, M.F. Protein Sci. 1993, 2, 183
101. Duffin, K.L.; Welply, J.K.; Huang, E.; Henion, J.D. Anal Chem. 1992, 64, 1440
102. Reinhold, B.B.; Chan, S.Y.; Walker, G.S; Reinhold, V.N. J. Bacteriol. 1994, 176, 1997
103. Reinhold, B.B.; Chan, S.Y.; Chan, S.; Walker, G.S; Reinhold, V.N. Org. Mass Spectrom. 1995, 29, 236
104. Egge, H.; Katalinic, P. J. Mass Spectrom. Rev. 1987, 6, 331
105.Viseux, N.; de Hofmann, E.; Domon, B. Anal. Chem. 1998, 70,4951
106. Solouki, T.; Reinhold, B.B.; Costello, C.E, Malley, M.O.; Guan, S.; Marshall, A.G. Anal. Chem. 1998, 70, 857
107. Garruzo, D.; Impallomeni, G.; Spina, E.; Green, B.N.; Hutton, T. Carb. Res. 1991, 221,253
108. Ii, T.; Ohashi, Y.; Matsuzaki, Y.; Ogava, T.; Nagsi, T. Org. Mass Spectrom. 1993, 28, 1340
109. Fura, A.; Leary, J.A. Anal. Chem. 1993, 65, 2805
110. Gaucher, S.P.; Leary, J.A. Anal. Chem. 1998, 70, 3009
111. Weiskopf, A.; Vouros, P.; Harvey, D.J. J. Mass Spec. 1998, 70,4441
112. Conboy, J.J.; Henion, J. Biomedical Mass Sepctrom. 1992, 21, 397
113. Kohler, M.; Leary, LAAnal. Chem. 1995, 67, 3501
114. Her, G.R.; Li, D.T. J. Mass Spectrom. 1998,33, 644
115. Poultier, L.; Burlingame, A.L. Methods Enzymol. 1990, 193, 661
40
Reproduced with permission of the copyright owner. Further reproduction prohibited without permission.
116. Stoddart, J.F. Stereochemistry o f Carbohydrates,; Wiley, New York, 1971
117. Jones, D.W. J. Polym. ScL 1969,42, 173
118. Brooks, C.L.; Karplus, M.; Pettitt, B.M. Proteins: A Theoretical Perspective o f Dynamics, Structure, and Thermodynamics, Advances in Chemical Physics Series, Vol. LXXI. Wiley, New York, 1988
119. McCammon, J.A.; Harvey, S.C. Dynamics o f Proteins and Nucleic Acids, Cambridge University Press, Cambridge, 1987
120.Allinger, N.L.; Rahman, M.; Lii, J.H. J. Am. Chem. Soc. 1990, 112, 8293
41
Reproduced with permission of the copyright owner. Further reproduction prohibited without permission.
Chapter 2
Synthesis of Sterically Crowded Derivatives o f Anomeric Pairs of Glucose-GIucose Disaccharides
Introduction
This chapter discusses the synthesis o f the various sterically crowded derivatives
o f glucose-glucose disaccharides to be used for the mass spectrometry studies to
differentiate the anomeric configuration o f the glycosidic bond. The preparation of
derivatized carbohydrates is o f interest because they serve as synthetic intermediates in
which they temporarily protect those functional groups not planned to be involved in a
desired manipulation [1]. Further they are very useful in structural studies in mass
spectrometry [2 ]. The synthesis is mainly focussed on etheriflcation, esterification and
silylation of the hydroxyl groups o f the disaccharides. The disaccharide ethers
synthesized are the methyl, ethyl, propyl, butyl and pentyl ethers. Methylation can be
used for confirming any evidence o f the chemical structure [3-6]. With increasing
recognition of the significance o f complex carbohydrates, roles played in the
determination of specificities of hormones, immunity, biological transport, recognition
and in various pathological phenomena, it has become more urgent to find rapid and
sensitive methods for discerning the chemical structure. For this purpose permethylation
on a microscale is important. The higher ethers o f carbohydrates are also important to
study since they could possibly influence the conformational behaviour, making the
glycosidic linkages more sterically crowded hence comparative steric information can be
obtained.
The disaccharide esters synthesized are the peracetylated, perpivaloylated and the
permesitoylated derivatives. Peracetylated oligosaccharides have been used extensively
42
Reproduced with permission of the copyright owner. Further reproduction prohibited without permission.
in the structural determination of oligosaccharides [7-13] because they are o f interest not
only in relation to the conformational data of fully acetylated polymeric derivatives such
as cellulose acetate [14], but also because many naturally occurring polysaccharides
particularly those of microbial origin are partially acetylated [15]. Although the
biological functions of these acetyl groups are not well understood, it is known in some
instances, e.g. gellan, their presence greatly affects the rheological poroperties of aqueous
solutions. Similarly, it might be possible that pivaloylated and mesitoylated derivatives
have some biological activities.
Several approaches have been developed for the preparation of methylated
derivatives. The early methods were those of Purdie [16] and Haworth. [17]. The
disadvantage of the Purdie and Haworth techniques is that they require several re-
methylations to obtain complete etherification. Strong bases such as sodium hydride or
potassium tert-butoxide in dipolar aprotic organic solvents are now used. Using methyl
iodide in N,N-dimethyl formamide with silver oxide [18,19], barium hydroxide [20], or
sodium hydride [21] as the basic agent, the reaction rates increased but full methylation
was not achieved. The use o f sodium hydride has a disadvantage in that it requires careful
handling. Corey and co-workers developed a new synthesis using the methyl sulfinyl
carbanion, the conjugate base o f dimethyl sulfoxide [22], The Wittig type synthesis was
achieved with great ease [23,24]. Hakomori adapted Cory’s methylsulfmyl carbanion
[25] reagent to the methylation of even complex carbohydrates. In spite o f the low yields
(0.3 mol of permethylated derivative per mol of sugar), the Hakomori method has been
used extensively in structural investigations of carbohydrates. The use of potassium ter-
butoxide [26] instead of sodium hydride improved the stability of the reagent but did not
43
Reproduced with permission of the copyright owner. Further reproduction prohibited without permission.
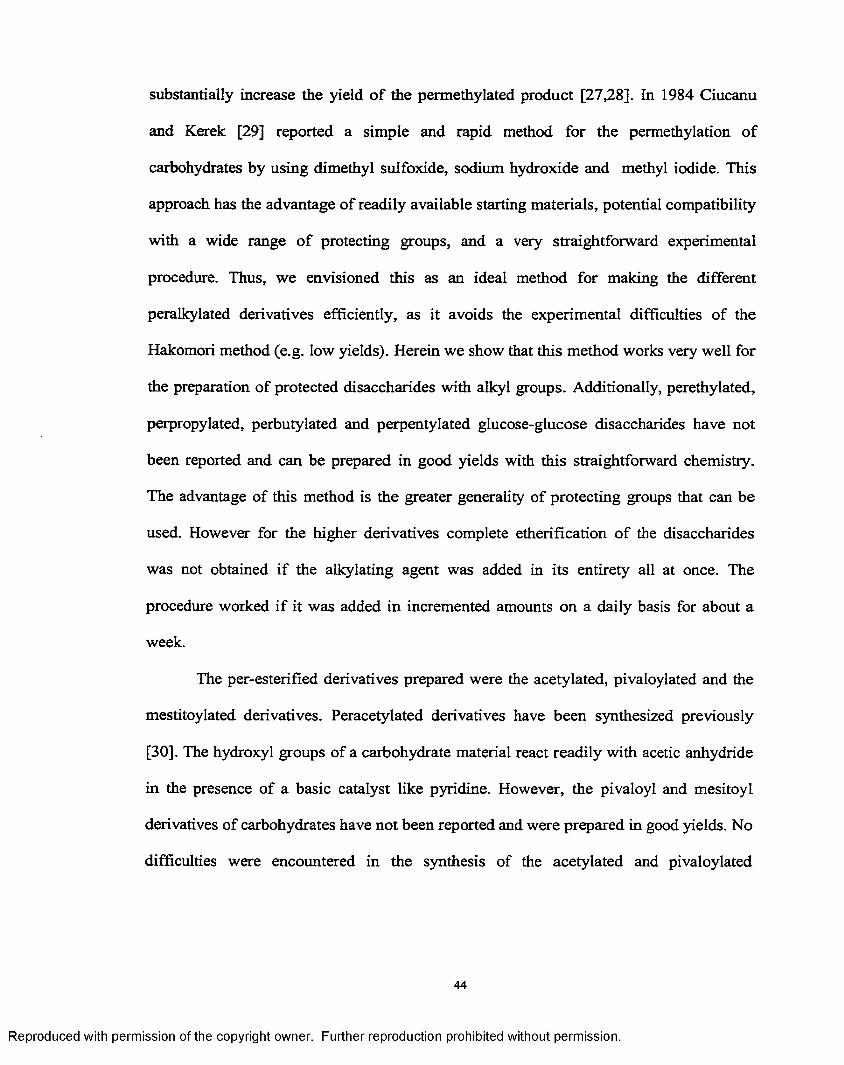
substantially increase the yield o f the permethylated product [27,28]. In 1984 Ciucanu
and Kerek [29] reported a simple and rapid method for the permethylation of
carbohydrates by using dimethyl sulfoxide, sodium hydroxide and methyl iodide. This
approach has the advantage of readily available starting materials, potential compatibility
with a wide range of protecting groups, and a very straightforward experimental
procedure. Thus, we envisioned this as an ideal method for making the different
peralkylated derivatives efficiently, as it avoids the experimental difficulties of the
Hakomori method (e.g. low yields). Herein we show that this method works very well for
the preparation of protected disaccharides with alkyl groups. Additionally, perethylated,
perpropylated, perbutylated and perpentylated glucose-glucose disaccharides have not
been reported and can be prepared in good yields with this straightforward chemistry.
The advantage of this method is the greater generality of protecting groups that can be
used. However for the higher derivatives complete etherification of the disaccharides
was not obtained if the alkylating agent was added in its entirety all at once. The
procedure worked if it was added in incremented amounts on a daily basis for about a
week.
The per-esterified derivatives prepared were the acetylated, pivaloylated and the
mestitoylated derivatives. Peracetylated derivatives have been synthesized previously
[30]. The hydroxyl groups of a carbohydrate material react readily with acetic anhydride
in the presence of a basic catalyst like pyridine. However, the pivaloyl and mesitoyl
derivatives of carbohydrates have not been reported and were prepared in good yields. No
difficulties were encountered in the synthesis of the acetylated and pivaloylated
Reproduced with permission of the copyright owner. Further reproduction prohibited without permission.
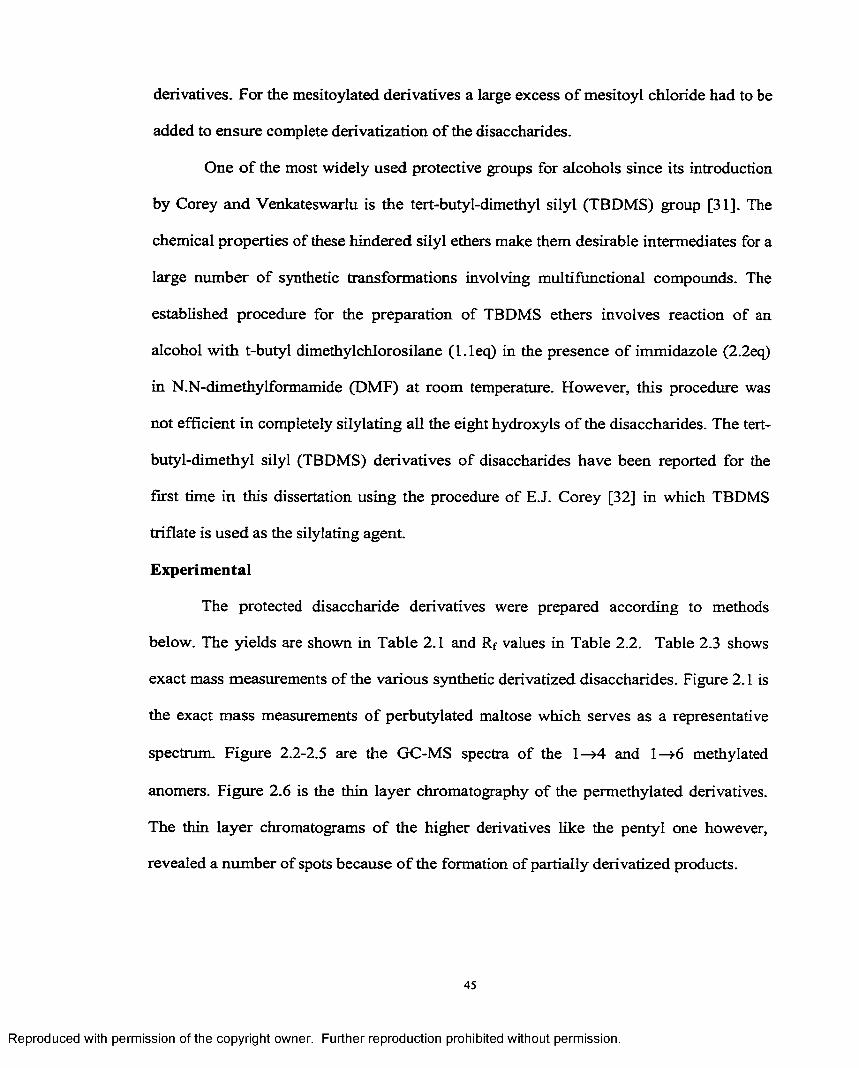
derivatives. For the mesitoylated derivatives a large excess o f mesitoyl chloride had to be
added to ensure complete derivatization o f the disaccharides.
One o f the most widely used protective groups for alcohols since its introduction
by Corey and Venkateswarlu is the tert-butyl-dimethyl silyl (TBDMS) group [31]. The
chemical properties of these hindered silyl ethers make them desirable intermediates for a
large number of synthetic transformations involving multifunctional compounds. The
established procedure for the preparation of TBDMS ethers involves reaction o f an
alcohol with t-butyl dimethylchlorosilane (l.leq) in the presence o f immidazole (2.2eq)
in N.N-dimethylformamide (DMF) at room temperature. However, this procedure was
not efficient in completely silylating all the eight hydroxyls o f the disaccharides. The tert-
butyl-dimethyl silyl (TBDMS) derivatives of disaccharides have been reported for the
first time in this dissertation using the procedure o f E.J. Corey [32] in which TBDMS
triflate is used as the silylating agent.
Experimental
The protected disaccharide derivatives were prepared according to methods
below. The yields are shown in Table 2.1 and Rf values in Table 2.2. Table 2.3 shows
exact mass measurements o f the various synthetic derivatized disaccharides. Figure 2.1 is
the exact mass measurements o f perbutylated maltose which serves as a representative
spectrum. Figure 2.2-2.5 are the GC-MS spectra o f the 1—>4 and 1—>6 methylated
anomers. Figure 2.6 is the thin layer chromatography of the permethylated derivatives.
The thin layer chromatograms o f the higher derivatives like the pentyl one however,
revealed a number of spots because o f the formation of partially derivatized products.
Reproduced with permission of the copyright owner. Further reproduction prohibited without permission.
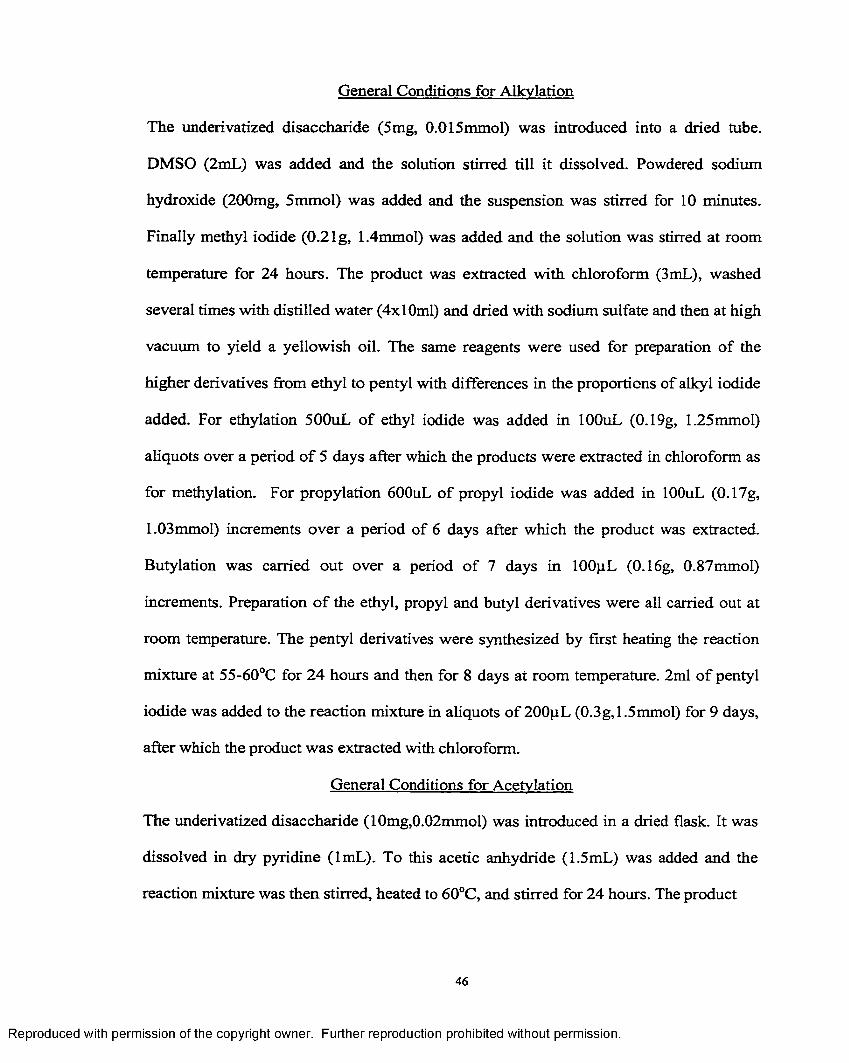
General Conditions for Alleviation
The underivatized disaccharide (5mg, 0.015mmol) was introduced into a dried tube.
DMSO (2mL) was added and the solution stirred till it dissolved. Powdered sodium
hydroxide (200mg, 5mmol) was added and the suspension was stirred for 10 minutes.
Finally methyl iodide (0.2 lg, 1.4mmol) was added and the solution was stirred at room
temperature for 24 hours. The product was extracted with chloroform (3mL), washed
several times with distilled water (4x10ml) and dried with sodium sulfate and then at high
vacuum to yield a yellowish oil. The same reagents were used for preparation o f the
higher derivatives from ethyl to pentyl with differences in the proportions of alkyl iodide
added. For ethylation 500uL o f ethyl iodide was added in lOOuL (0.19g, 1.25mmol)
aliquots over a period o f 5 days after which the products were extracted in chloroform as
for methylation. For propylation 600uL of propyl iodide was added in lOOuL (0.17g,
1.03mmol) increments over a period of 6 days after which the product was extracted.
Butylation was carried out over a period o f 7 days in lOOpL (0.16g, 0.87mmol)
increments. Preparation o f the ethyl, propyl and butyl derivatives were all carried out at
room temperature. The pentyl derivatives were synthesized by first heating the reaction
mixture at 55-60°C for 24 hours and then for 8 days at room temperature. 2ml o f pentyl
iodide was added to the reaction mixture in aliquots o f 200pL (0.3g,1.5mmol) for 9 days,
after which the product was extracted with chloroform.
General Conditions for Acetvlation
The underivatized disaccharide (10mg,0.02mmol) was introduced in a dried flask. It was
dissolved in dry pyridine (lmL). To this acetic anhydride (1.5mL) was added and the
reaction mixture was then stirred, heated to 60°C, and stirred for 24 hours. The product
46
Reproduced with permission of the copyright owner. Further reproduction prohibited without permission.
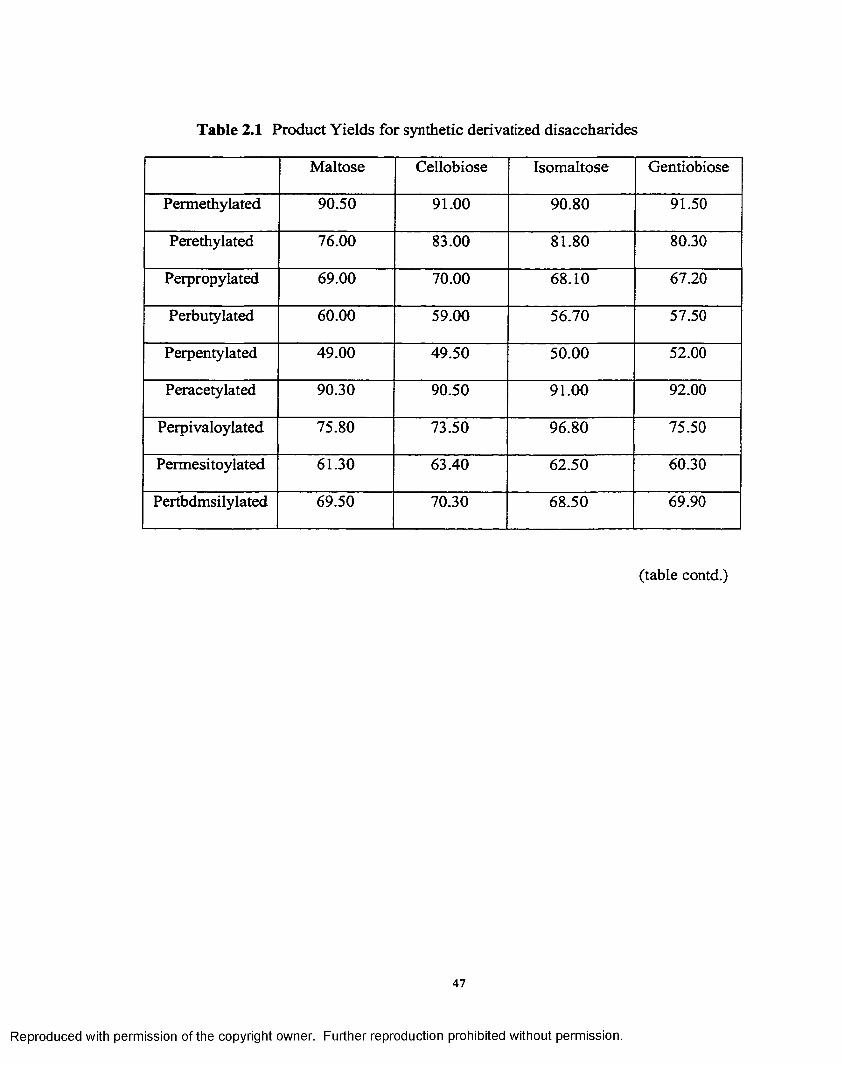
Table 2.1 Product Yields for synthetic derivatized disaccharides
Maltose Cellobiose Isomaltose Gentiobiose
Permethylated 90.50 91.00 90.80 91.50
Perethylated 76.00 83.00 81.80 80.30
Perpropylated 69.00 70.00 68.10 67.20
Perbutylated 60.00 59.00 56.70 57.50
Perpentylated 49.00 49.50 50.00 52.00
Peracetylated 90.30 90.50 91.00 92.00
Perpivaloylated 75.80 73.50 96.80 75.50
Permesitoylated 61.30 63.40 62.50 60.30
Pertbdmsilylated 69.50 70.30 68.50 69.90
(table contd.)
47
Reproduced with permission of the copyright owner. Further reproduction prohibited without permission.
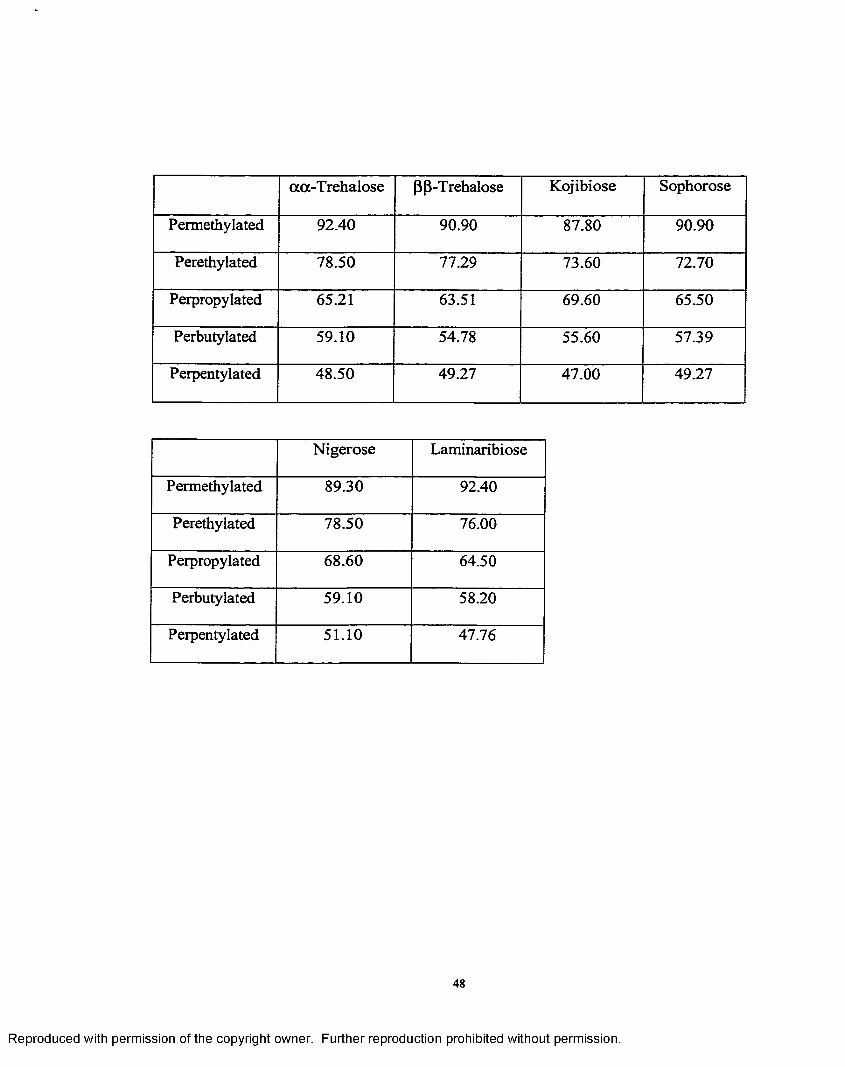
oca-Trehalose P (3-Trehalose Kojibiose Sophorose
Permethylated 92.40 90.90 87.80 90.90
Perethylated 78.50 77.29 73.60 72.70
Perpropylated 65.21 63.51 69.60 65.50
Perbutylated 59.10 54.78 55.60 57.39
Perpentylated 48.50 49.27 47.00 49.27
Nigerose Laminaribiose
Permethylated 89.30 92.40
Perethylated 78.50 76.00
Perpropylated 68.60 64.50
Perbutylated 59.10 58.20
Perpentylated 51.10 47.76
48
Reproduced with permission of the copyright owner. Further reproduction prohibited without permission.
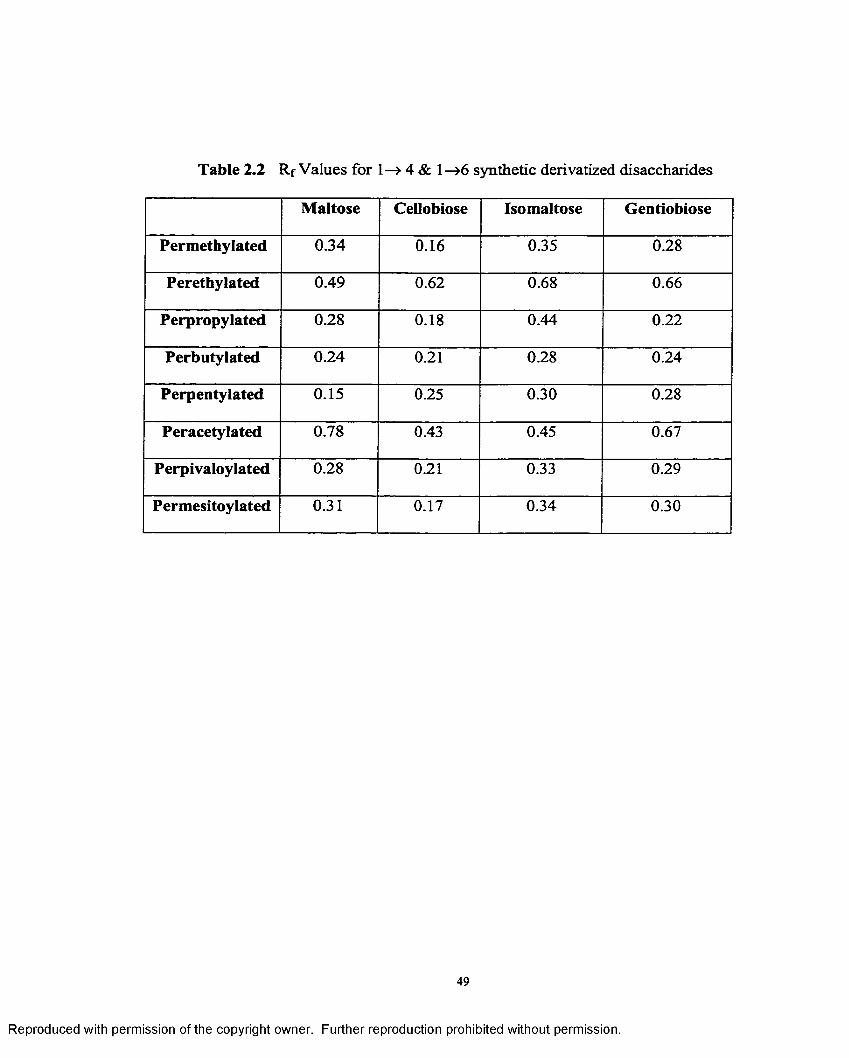
Table 2.2 Rf Values for 1—> 4 & 1—>6 synthetic derivatized disaccharides
Maltose Cellobiose Iso maltose Gentiobiose
Permethylated 0.34 0.16 0.35 0.28
Perethylated 0.49 0.62 0.68 0.66
Perpropylated 0.28 0.18 0.44 0.22
Perbutylated 0.24 0.21 0.28 0.24
Perpentylated 0.15 0.25 0.30 0.28
Peracetylated 0.78 0.43 0.45 0.67
Perpivaloylated 0.28 0.21 0.33 0.29
Permesitoylated 0.31 0.17 0.34 0.30
49
Reproduced with permission of the copyright owner. Further reproduction prohibited without permission.
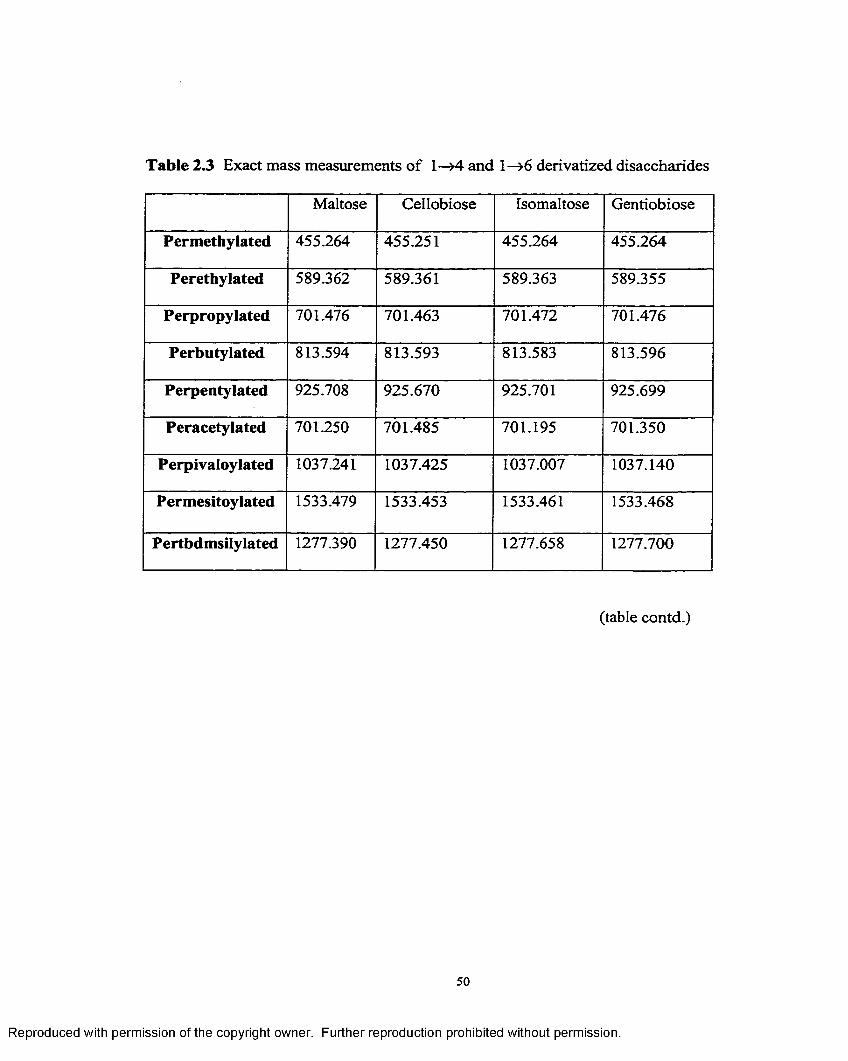
Table 2.3 Exact mass measurements of 1—>4 and 1—>6 derivatized disaccharides
Maltose Cellobiose Isomaltose Gentiobiose
Permethylated 455.264 455.251 455.264 455.264
Perethylated 589.362 589.361 589.363 589.355
Perpropylated 701.476 701.463 701.472 701.476
Perbutylated 813.594 813.593 813.583 813.596
Perpentylated 925.708 925.670 925.701 925.699
Peracetylated 701.250 701.485 701.195 701.350
Perpivaloylated 1037.241 1037.425 1037.007 1037.140
Permesitoylated 1533.479 1533.453 1533.461 1533.468
Pertbdmsilylated 1277.390 1277.450 1277.658 1277.700
(table contd.)
50
Reproduced with permission of the copyright owner. Further reproduction prohibited without permission.
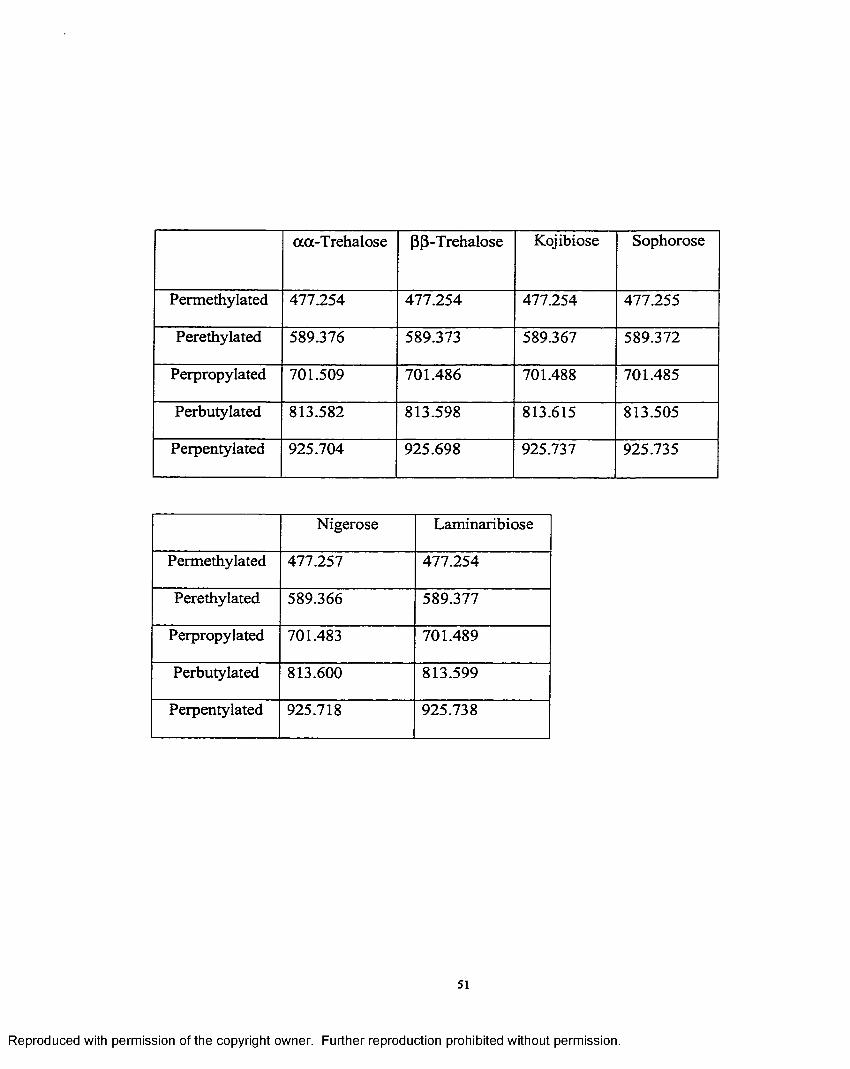
aa-Trehalose PP-Trehalose Kojibiose Sophorose
Permethylated 477.254 477.254 477.254 477.255
Perethylated 589.376 589.373 589.367 589.372
Perpropylated 701.509 701.486 701.488 701.485
Perbutylated 813.582 813.598 813.615 813.505
Perpentylated 925.704 925.698 925.737 925.735
Nigerose Laminaribiose
Permethylated 477.257 477.254
Perethylated 589.366 589.377
Perpropylated 701.483 701.489
Perbutylated 813.600 813.599
Perpentylated 925.718 925.738
51
Reproduced with permission of the copyright owner. Further reproduction prohibited without permission.
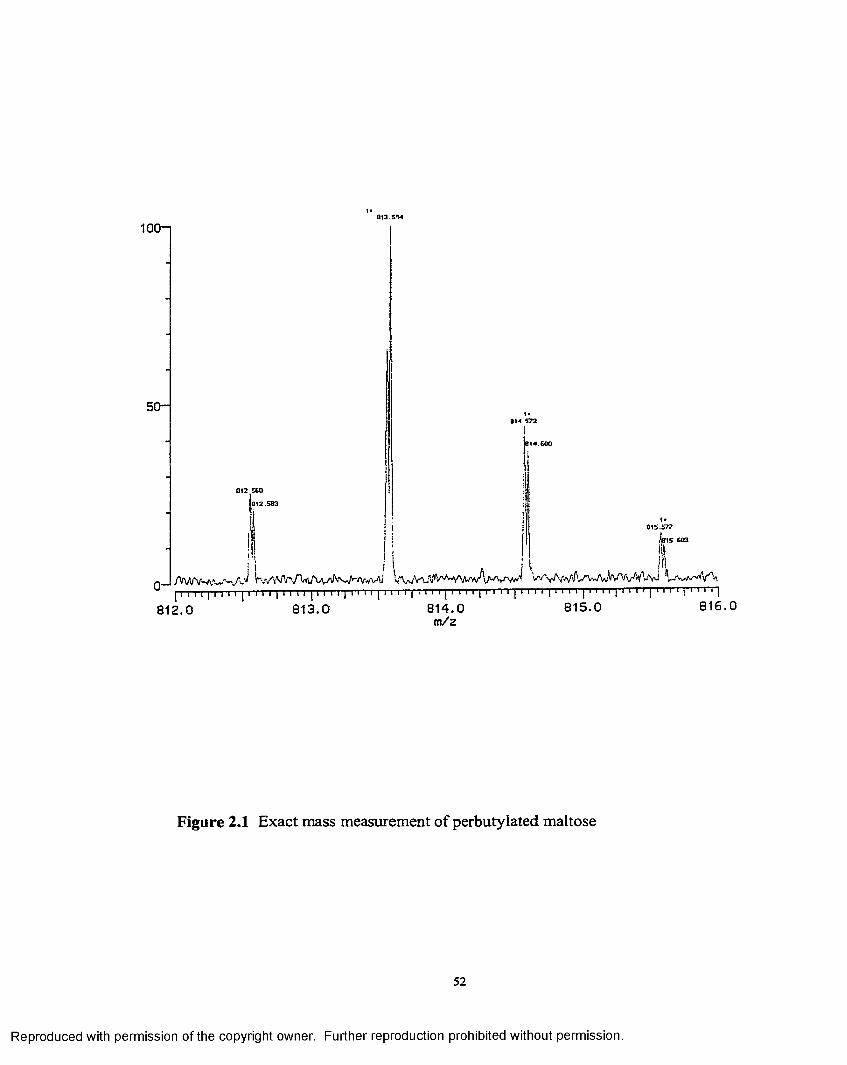
100—
50—
0
QT2 SCO
1 0 1 2 .5 8 3
K^VVV1<ftAv'ftv/M/*Vu VVvWV^vVVVArA/u/VVf'1
8 1 S .5 ? ?
,’a i S C 0 3
WVy'V,i/l-rW V aV 'W '-vi l-n ^ /'/’AAI I I I 1 [ I | I I | I I I I I 1 I I I [ I I I I I I M I [ I M I I I I I I [ I H I I I I 1 I I I I 1 1 I 1 1 f T | I I I I I I I ‘ ■ | ‘ . ' ■ ! ■ ■ ■ ■ |
812.0 813.0 814.0m/ 2
815.0 816.0
Figure 2.1 Exact mass measurement of perbutylated maltose
52
Reproduced with permission of the copyright owner. Further reproduction prohibited without permission.
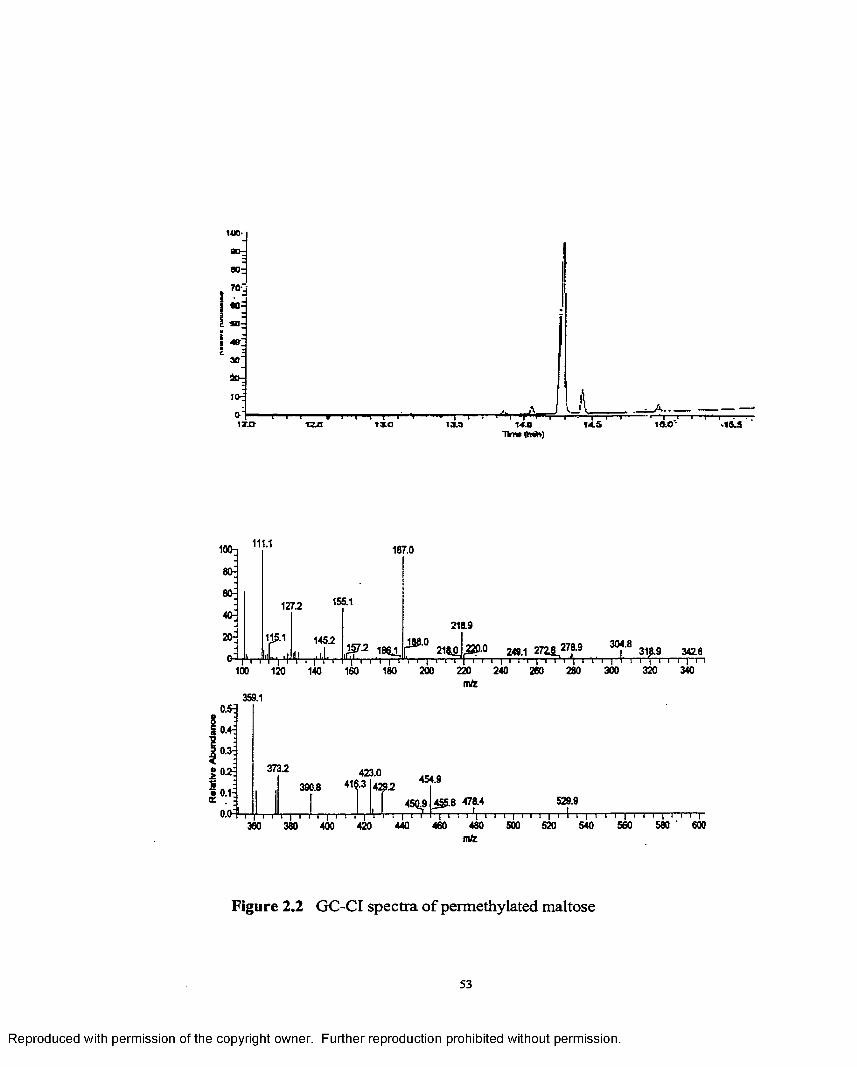
90:
III
1«.0'
111.11«H 1B7.0
80-
60-1155.1
40-218.9
20-304.8
318.9 342.8
320 340200 220 240 260 280 300100 180120 140 160m/2
359.1
423.0416.3390.8• 0.1
529.9
580 ' 600500 560440 460 480m/2
520 540360 380 420400
Figure 2.2 GC-CI spectra o f permethylated maltose
53
Reproduced with permission of the copyright owner. Further reproduction prohibited without permission.
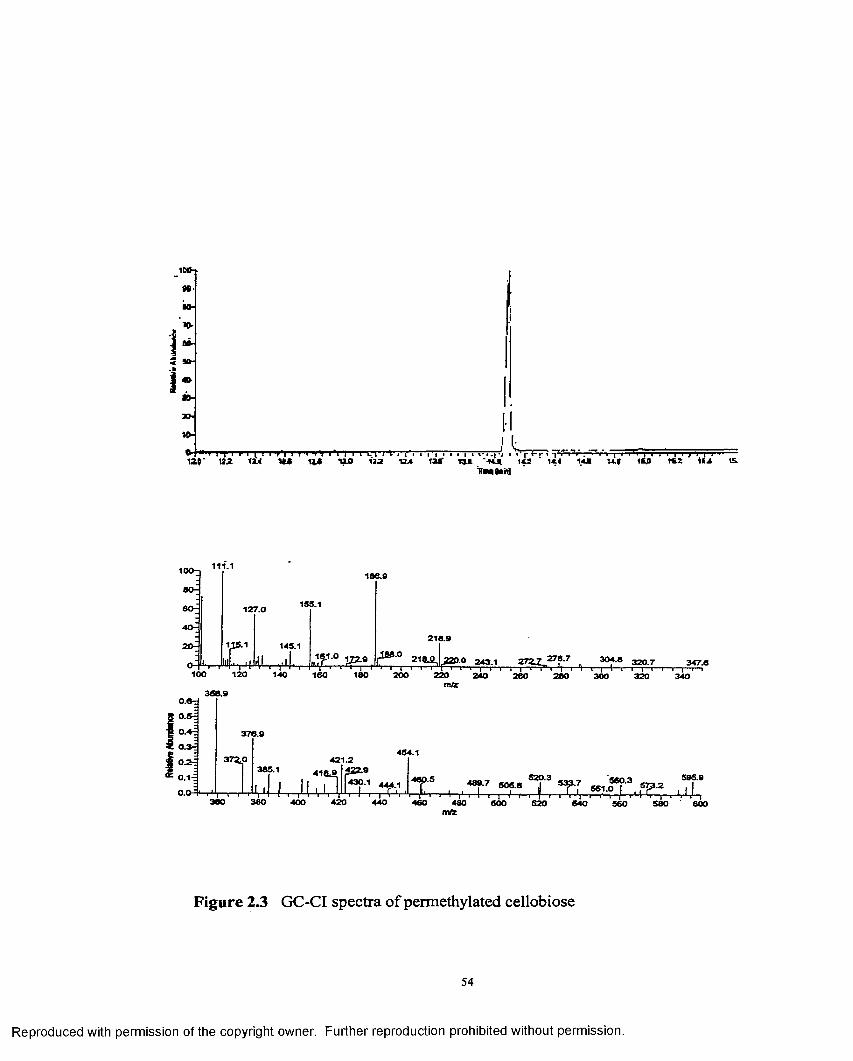
! I I I' I I 1 XZZ 114 HI Hi *1' 1 Ino U 1 I \
i i a
111.110O-,186.9
80-
155.160- 127.0
40-218.9
145.120-
272.7 278-7 1 I 260220
m/z
320.7243.1 347.6100 120 140 160 180 200 240 280 300 320 340
358.9
376.9
454.1421.2
385.10.1
505.80.0-
380380 400 420 440 460 480 500 520 640 580660 600mtz
Figure 2.3 GC-CI spectra o f permethylated cellobiose
54
Reproduced with permission of the copyright owner. Further reproduction prohibited without permission.
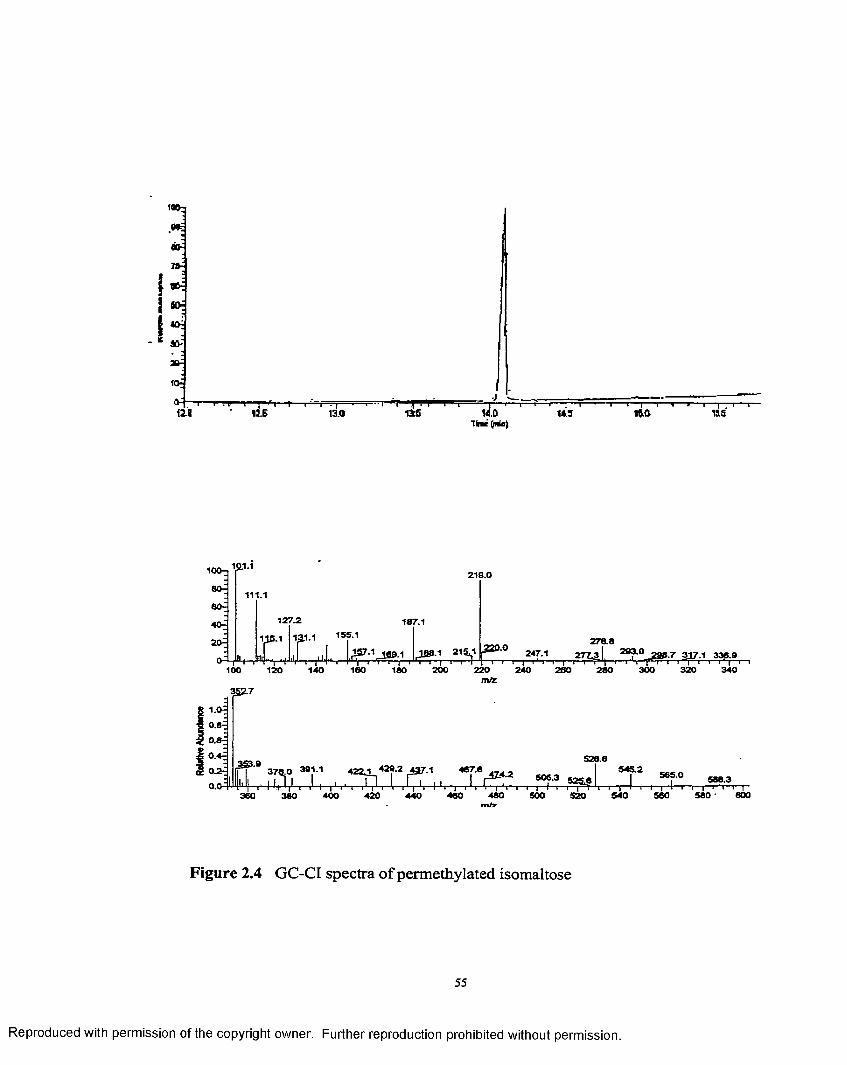
80-
}
I
1i
. B • f y
& ■
10-
12.1 115 13.0■(' "i
-lie TIfD
T im fimnj
■J143
— I------ r -116 155
219.0
111.1
187.1
155.1278 .8
2 93 .0,357*1 1S9.1trT I V=T , 180
247.1
200 220 240 260 320 340100 120 140 160 280 300mfz
1.0
528.65 4 5 .2467.6
565.0505.3
600560 560 '400 420 460 460 500 520 540360 4 4 0
Figure 2.4 GC-CI spectra of permethylated isomaltose
55
Reproduced with permission of the copyright owner. Further reproduction prohibited without permission.
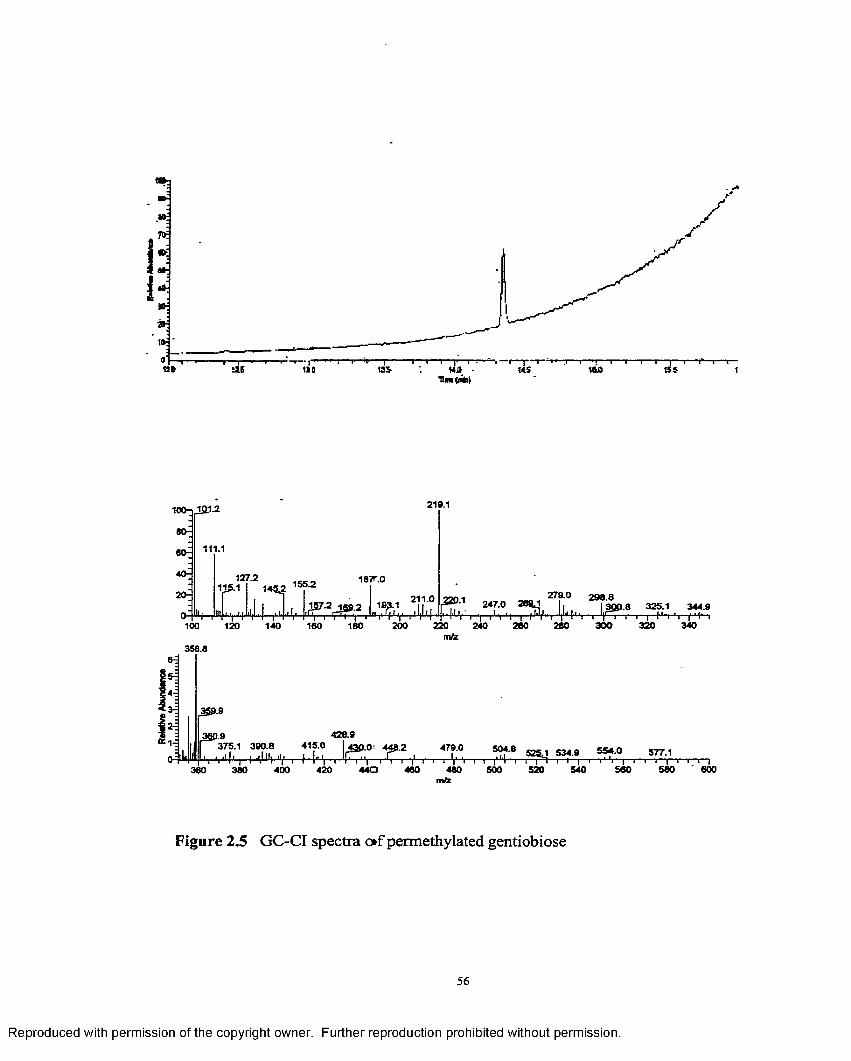
10*t-, y |T r—I—r
USj T T T 1—|—r
tt*■t1t&O
llini<nin^
219.1
4 0 - 127.2
20- 279.0 2 9 8 .8211.0247.0 325.1 344.9
340200 3 0 0 320180 220 240 280 280100 120 140 160m/z
358.8
428.9415 .0375.1 390.8 479.0 504.8 1 534.9 554 -0 577.1
560 580 600480 480 500 520 540380 400 420 440360 m/2
Figure 2.5 GC-CI spectra o»f permethylated gentiobiose
56
Reproduced with permission of the copyright owner. Further reproduction prohibited without permission.
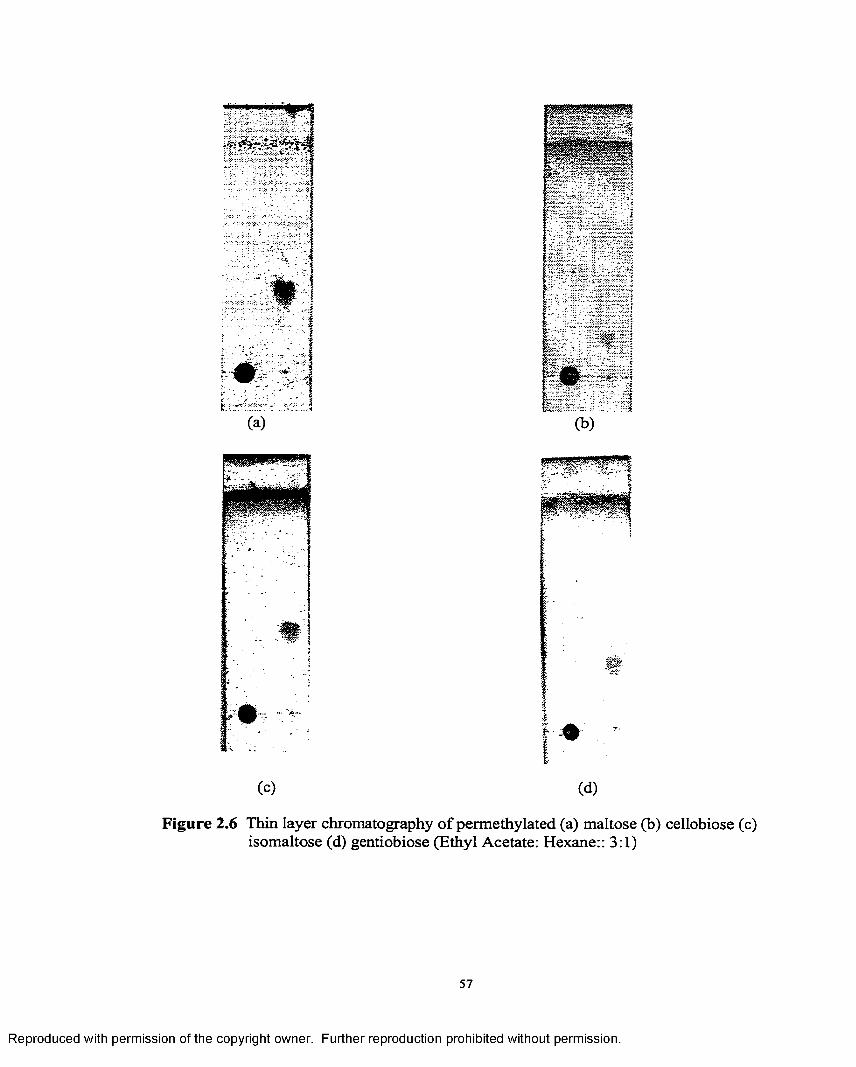
i:
(C) (d)
Figure 2.6 Thin layer chromatography of permethylated (a) maltose (b) cellobiose (c) isomaltose (d) gentiobiose (Ethyl Acetate: Hexane:: 3:1)
57
Reproduced with permission of the copyright owner. Further reproduction prohibited without permission.
was then extracted with ethyl acetate (5mL) and washed with water (lOmL). It was then
washed with 10% HC1 (2xl0mL) to remove the pyridine. It was further washed with
NaHCC>3 (2xl0mL) and finally with water (lOmL). It is then dried with Na2 S0 4 and
under high vacuum.
General Conditions for Pivalovlation
The underivatized disaccharide (5mg, 0.015mmol) was introduced into a dry
flask. It was dissolved in dry pyridine (230pL). Dimethyl amino pyridine (DMAP)
(17.6mg, 0.0049mmol) was added to catalyze the reaction. Finally, trimethylacetyl
chloride (0.18g, 1.46mmol) was added to the reaction mixture. The reaction mixture was
then stirred at room temperature for two days. The product was then extracted with ethyl
acetate (lOmL) and washed with water (2xl0mL), followed by 10%HCL (2xl0mL), then
NaHCC>3 (2x1 OmL) and finally again with water (lOmL). The product was an oil which
was vacuum rotor evaporated and then dried under high vacuum.
General Conditions for Mesitovlation
The underivatized disaccharide (lOOmg, 0.29mmol) was introduced into a dry, 2- necked
flask under Ar. Dry pyridine (lOmL) was added and the solution stirred until it dissolved.
Dimethyl amino pyridine (350mg, 2.9mmol) was then added followed by
trimethylbenzoyl chloride (5.34g, 29.2mmol). The solution was heated to 80°C and
stirred for 3 days. The product was then extracted with ethyl acetate (20mL) and washed
with water (lOmL) followed by 10%HCL (2xl0mL), then saturated NaHC03 (2xl0mL)
and finally by water (lOmL). The product was then rotor evaporated and finally dried
with vacuum to yield a yellowish solid.
Reproduced with permission of the copyright owner. Further reproduction prohibited without permission.
General Conditions for Silvlation
The underivatized sugar (lOOmg, 0.29mmol) was introduced in a dry flask under
Ar. Dry methylene chloride (lOmL) was added and the solution stirred until most o f the
sugar dissolved. Dry 2,6-lutidine (0.75g, 6.9mmol) was then added followed by tert-
butyl-dimethyl triflate (0.93g,3.5mmol). On addition of the triflate the undissolved sugar
dissolved completely and the reaction mixture became clear. The reaction mixture was
stirred at room temperature for a day. The product was extracted with ether (20mL) and
washed with water (20mL). The aqueous layer was then extracted with ether (3xl0mL).
The product in the combined ether extracts was rotor evaporated and dried under high
vacuum to yield a clear oil.
References
1. McOmoie, J.F.W. Protective Groups in Organic Chemistry, Plenum Press, London, 1973
2. Laine, R.A.; Pamidimukkala, K.; French, A.D.; Hall, R.W; Abbas, S.A.; Jain, R.K.; Matta, K.L. J. Am. Chem. Soc. 1988, 110, 6931
3. Stoffyn, P.J.; Jeanloz, R.W. J. Biol. Chem. 1960, 235, 2507
4. Jeanloz, R.W. Polysaccharide in Biology edited by G.F. Springer, The Josiah Macy Jr. Foundation, New York, fourth conference, 1958, p23
5. Kuhn, R.; Trischman , M.; Low, I. Agnew Chem. 1955, 67, 32
6. Yamakawa, T.; Yokoyama, S.; Handa, N. J. Biochem. 1963, 53, 28
7. Leung, F.; Marchessault, R.H. Can. J. Chem. 1973, 51, 1215
8. Leung, F.; Chanzy, D.; Perez, S.; Marchessault, R.H. Can. J. Chem. 1976, 54, 1365
9. Takeda, H.; Kaiya, T.; Yasuoka, N .; Kasai, N. Carb. Res. 1978, 62,27
10. Perez, S.; Brisse, F. Acta Crystallogr. Sect. B. 1977, 33, 2578
11. Perez, S.; St.-Pierre, J.; Marchessault, R.H. Can. J. Chem. 1978,56,2866
59
Reproduced with permission of the copyright owner. Further reproduction prohibited without permission.
12. Brisse, F.; Marchessault, R.H.; Perez, S.; Zugenmaier, P. J. Am. Chem. Soc. 1982, 104, 7470
13. Perez, S.; Vergelati, C.; Tran, V.H. Acta Crystallogr., Sect, B. 1985,41,262
14. Marchessault, R.H.; Sundarajan, P.R. in G.O. Aspinall (Ed.), The Polysaccharides, Vol. 2, Academic Press, New York, 1979
15. Berkeley, R.C.W.; Gooday, C.W.; Ellwood, D.C. (Eds.), Microbial Polysaccharides and Polysacharases, Academic Press, New York, 1979
16. Purdie, T.; Irvine, J.C. J. Chem. Soc. 1903, 83, 1021
17. Haworth, W. N. J. Chem. Soc. 1915, 107, 8
18. Kuhn, R.; Trischmann, H.; Low, I. Agnew. Chem. 1955, 67,32
19. Walker, H.G.; Gee, M.; Mcready, R.M. J. Org. Chem. 1962, 27, 2100
20. Kuhn, R.; Baer, H.H. ; Seeliger, A Justus Liebigs Ann. Chem. 1958, 611, 236
21. Tamura, Z.; Imanari, T. Chem. Pharm. Bull. 1964, 12, 1386
22. Corey, E J . ; Chaykovsky, M. J. Am. Chem. Soc. 1962, 84, 866
23. Chaykovsky, M.; Corey, E.J. J. Org. Chem. 1962, 28, 254
24. Greenwald, R.; Chaykovsky, M.; Corey, E. J. J. Org. Chem. 1962, 28, 1128
25. Hakomori, S. J. Biochem. 1964, 55, 205
26. Brauman, J.J.; Bryson, A.; Kahl, D.C.; Nelson, N.J. J. Am. Chem. Soc. 1970, 92,6679
27. Lindberg, B. Methods in Enzymol. 1972, 28, 178
28. Finne, J.; Krusius, T . ; Rauvala, H. Carb. Res. 1980, 80, 336
29. Ciucanu, I.; Kerek, F. Carb. Res. 1984, 131,209
30. Hudson, C.S.; Brauns, D.H. J. Am. Chem. Soc. 1915, 37, 1264
31. Corey, E.J.; Venkateswarlu, A.K. J. Am. Chem. Soc. 1972, 94, 6190
32. Corey, E.J.; Cho, H.; Rucker, C. Hua, D.H. Tet. Letters 1981,22,3455
60
Reproduced with permission of the copyright owner. Further reproduction prohibited without permission.
Chapter 3
Collision Induced Discrimination of the Glucose 1—>4 Disaccharide Anomeric Pair with Incremented Alkyl Substitution
Introduction
Oligosaccharides attached to proteins or lipids participate in a wide
spectrum of biological roles determined by their primary structure [1,2]. An
increasing number of reports show that carbohydrates exhibit a variety of
important biological functions, such as anti-clotting agents, adhesion ligands,
imunomodulators, antigenic microbial recognition factors and inflammatory
response addressins, among others [1,2]. Rapid methods for detailed
characterization o f their structures have not been fully developed. The wide
variety of positional and anomeric structures makes it possible for saccharides to
form as many as 1012 distinct structures from as few as six different
monosaccharide units [3,4]. Therefore a complete description of carbohydrate
structures requires singling out a structure from a potentially large heterogeneous
set of individual discrete molecular isomers. The problems encountered in their
structural elucidation far exceed those encountered with proteins. A complete
structural analysis o f carbohydrates requires a determination of composition,
molecular mass, sugar sequence, branching, molecular mass, ring size, anomeric
configuration and interglycosidic linkages. Currently there is no universal method
to obtain complete structural information of glycans. Methods that are currently
being pursued for oligosaccharide analysis include combinations o f enzymatic
degradation [5-8], chemical degradation such as acid hydrolysis [9], periodate
61
Reproduced with permission of the copyright owner. Further reproduction prohibited without permission.
oxidation [10-12], reduction and methylation [13-18], chromium trioxide
oxidation [19] and nuclear magnetic resonance (nmr) [20-23]. Nmr requires
micromole quantities o f pure material for complex 2-D experiments. For high
sensitivity, mass spectrometry has become an important method for structural
characterization o f oligosaccharides [24-27], Tandem mass spectrometry allows
the analyte molecule to be selectively analyzed ignoring all other impurities
except isobars (at low resolution) of the same mass in the sample. Hence, it can be
used in mixture analysis, which is always encountered with real-world biological
samples [28]. Mass spectrometry has been used in the determination of
monosaccharide type [29-32], sequence [33-37], and linkage position [38-42],
Differentiation o f the anomeric configuration of the glycosidic bond has long
been the stronghold o f nmr spectroscopy, since traditionally mass spectrometry
was not considered a technique to differentiate stereoisomers. However, mass
spectrometry is emerging as a technique capable of differentiating stereoisomeric
compounds with rapid advancements in instrumentation and software [43].
Among other attributes, the anomeric configuration o f the glycosidic bond has
resisted discernment with rapid and sensitive methods.
Previous MS work on Differentiation of the Anomeric Configuration of Carbohydrates
Mass spectrometry was tested as a tool for differentiation of
stereoisomeric saccharides as early as the late nineteen fifties when Reed and
coworkers [44] reported the results of electron impact appearance potentials on
the CsHn0 5 + ion derived from alpha and beta methyl glucopyranosides and four
disaccharides. The alpha glycosides had a slightly lower appearance potential as
62
Reproduced with permission of the copyright owner. Further reproduction prohibited without permission.
compared to the beta glycosides (a sign o f a difference in the energy level o f the
most easily removed electron). Heyns [45] distinguished between a few
stereoisomeric permethylated monosaccharides by specific ion ratios, which
stimulated Ridder [46] to investigate stereoisomeric trimethylsilyl derivatives o f
the disaccharides a-lactose, (3—lactose, (3-cellobiose and the equilibrium mixtures
oc,|3-lactose and a,{3-cellobiose which were distinguished from each other by
measuring one particular peak intensity ratio for each anomer. The configuration
of the anomeric C-atom of the reducing unit was found to be the most important
factor. However, no differentiation o f the inter-glycosidic bond configuration was
made. Chemical ionization has been used by several researchers to attempt
differentiation between stereoisomeric saccharides, since EI-MS employs
fragmentation conditions that are frequently too drastic to unambiguously discern
stereoisomers of many saccharides. Murata [47] discriminated between anomeric
TMS derivatives o f the per-trimethyl silyl ethers o f the monosaccharides D-
glucose, D-galactose, and D- mannose using ammonia as the reagent gas. He
found that the (3 anomers gave ions at m/z 558 showing intensities 3-12 times
those of the a -D anomers. Discrimination of a few anomeric permethylated
disaccharides was attempted by De Jong et al. [48]. Some glycosidic linkage
positions could be estimated and in some cases differences were found between
spectra o f anomers. However, several disaccharides could still not be uniquely
identified even by their collision activation spectra. A continuation of these
studies [49] of permethylated 1—>1, 1—>2, 1—>3, 1—>4, 1—>5, 1 —>6 disaccharides
was preferred using chemical ionization (Cl) with ammonia and isobutane as
63
Reproduced with permission of the copyright owner. Further reproduction prohibited without permission.
reagent gases in a reversed geometry double focusing mass spectrometer, using
helium as the collision gas. Even though there was an improvement in the number
o f anomeric disaccharides discriminated, a disadvantage of this method is that in
some cases experiments with two different reagent gases were needed for
discrimination of some disaccharides that could not be discriminated using one
reagent gas. The advent o f low energy ionization techniques like FAB, ESI and
MALDI which are capable o f generating ions from the condensed phase, have
enhanced the analysis o f carbohydrates in general. FAB and ESI in particular
have been used for studies on anomeric configuration differentiation.
Positive ion fast atom bombardment (FAB) in conjunction with low
energy collision induced dissociation (CID) was first used by Laine et al.
[40,41,42] for linkage analysis position in both the reducing and non reducing
terminals of linkage isomeric sets o f trisaccharides. Domon et al. [50,51] assigned
the anomeric configuration o f non reducing end glucopyranosyl ions derived from
larger oligoglycosides. The study was later extended to anomeric peracetylated
glucose-glucose disaccharides [52,53]. In these studies, low energy CID was
carried out on precursor ions o f peracetylated anomers of 1—>2, 1—>3, 1—>4, 1—>5
linkage type disaccharides that were generated by FAB or DCI. The C-l
carbenium precursor ions were used. Both linkage and anomeric configuration
differentiation were attempted. A weak distinction was made based on the
abundance of the parent and daughter ions for anomeric configuration
differentiation. Differences in ion abundance were rather minor and only certain
fingerprint ions were chosen to enable the discrimination while ignoring major
64
Reproduced with permission of the copyright owner. Further reproduction prohibited without permission.

daughter ions. In the case o f linkage position a small discrimination was made for
the 1—>2, 1—>3, 1—>4 positions but not the 1—>6. Differentiation o f the same
anomers was also carried out in the high energy regime [53]. Again a
differentiation was possible based on the difference in ratios o f two ions without
consideration given to the ratios o f other ions. Khoo and Dell [54] used fast atom
bombardment for assigning the anomeric configurations o f pyranose sugars in
oligosaccharides. The method is based upon a FAB-MS analysis of
deuteroacetylated derivatives before and after oxidation with chromium trioxide
which oxidizes the beta pyranosides to keto esters leaving the alpha pyranosides
largely intact. FAB was also used to examine the anomeric configuration in a
series o f 1—>3, 1—>4 and 1—>6 glucosy 1-glucose disaccharides through the mass-
analyzed, ion kinetic energy spectra o f the metastable complexes [55]. Leary et al.
[55] reported that the alpha linked disaccharide complexes consistently displayed
a 20-30 percent greater kinetic energy release value than the corresponding beta
disaccharide complexes. This is reminiscent of the very early work on appearance
potentials, however Leary et al. state that it was difficult to correlate the kinetic
energy release data (KER) with structural characteristics o f the individual
Co(acac) 2 /disaccharide complexes without detailed information on the geometry
of the disaccharide complex with bis acetyl acetonate. Positive ion FAB-MS/MS
data of derivatized xylobiosides showed some distinction between alpha and beta
configurations o f the interglycosidic linkage in the unimolecular decomposition
spectra o f the [M + H]+ ions of the peracetylated methyl glycosides [56]. The ratio
of m/z 259/475 was used as a gauge to differentiate alpha and beta anomers. The
65
Reproduced with permission of the copyright owner. Further reproduction prohibited without permission.
ion at m/z 259 corresponded to cleavage o f the glycosidic bond while m/z 475
corresponded to loss of methanol from the parent ion. The comparison of
beta/alpha values o f the 259/475 ratios for the 1—>2, 1—>3 and 1—>6 anomers gave
1.43, 2.84, and 3.06 respectively, with the beta anomer having a consistently
higher ratio than the corresponding alpha anomer. Fast atom bombardment was
also used together with mass-analyzed ion kinetic energy (MIKE) spectra and
collision induced dissociation in both the positive and negative ion mode to
attempt differentiation of unsaturated and saturated anomeric C glycosides
[57,58].
Negative ion FAB together with metastable ion and collision activation
techniques were used to examine anomeric linkages for all glucose-glucose
disaccharides [59], This analysis was made based on the abundance of the
monosaccharide ion at m/z 221. Differences between the anomers were small and
did not always allow unambiguous identification. Negative ion electrospray was
used to determine directly the anomeric configuration in a complete series of
underivatized glucopyranosyl disaccharides based on “in-source” CID in the
nozzle-skimmer region rather than tandem mass spectrometric analysis [60], The
discrimination was based on the ratio o f m/z 161/341
monosaccharide/disaccharide at different settings of the nozzle to skimmer
voltage difference. In-source CID was also used to differentiate between the
anomeric configuration of the glycosidic bond in disaccharides and linear
oligosaccharides labeled with p-aminobenzoic ethylester chromophore [61].
While little to no discrimination was found for the 1—>3 and 1—>6 linkage,
66
Reproduced with permission of the copyright owner. Further reproduction prohibited without permission.
anomeric configuration discrimination was made for the 1—>4 linkage glucose-
glucose disaccharides. More recently, Nilsson et al. [62] reported that both the
linkage position and anomeric configuration in glucose containing disaccharide
alditols could be estimated by multivariate analysis mass spectrometry. Their
results indicated that the axial glycosidic bond (a-D) is more easily cleaved than a
corresponding equatorial bond (|3-D). Their models were restricted only to
glucose containing disaccharides or disaccharides with a non reducing terminal
galactose residue. A theoretical study o f deprotonated glucopyranosyl
disaccharide fragmentation was carried out in which it was shown that the
stereochemistry at the 2-position of the non-reducing ring could have a significant
effect on disaccharide fragmentation especially with regard to determination of
the anomeric configuration [63].
Differentiation of the stereochemistry o f the glycosidic bond by FAB-MS
has a number o f disadvantages including a relatively poor detection limit and
sensitivity, due to poor ionization efficiency and considerable in-source
fragmentation. In contrast, electrospray has more efficient ionization, which
produces intense molecular ion beams and high sensitivity, as well as lower
background chemical noise. Derivatization of carbohydrates by permethylation,
peracetylation and reductive amination with an aromatic or an aliphatic amine
have been reported to increase mass spectral response. Burlingame [64] and
Reinhold [65] have both stated that chemical derivatization was the usual
approach adopted in structural analysis of carbohydrates and that it enhanced
sensitivity in ESI. We have used electrospray in our work because of its above-
67
Reproduced with permission of the copyright owner. Further reproduction prohibited without permission.
stated advantages to examine the effect o f alkyl derivatization on decomposition
spectra o f a series of peralkylated disaccharides.
In previous FAB-CID-MS/MS studies o f linkage position discrimination
in a set o f linkage isomeric neutral or permethylated trisaccharides it was
previously hypothesized that steric factors played an important role in the
determination o f fragmentation patterns. For sterically crowded linkages there
were higher glycosidic bond cleavage rates for some linkages when compared
with others under collision activation conditions which was rationalized by
molecular modeling [40,41.42]. Later Leary et al. [55] also proposed the
importance of steric factors as related to energy differences in an attempt to
explain differences in kinetic energy release values between the alpha and beta
anomers in a set of metal ion coordinated glucose-glucose disaccharides. Ohashi
et al. [66] stated that one of the future challenges would be to obtain steric
information by ES-MS, especially in its CID-MS/MS mode which is a focus of
our project.
In the present investigation we examine the importance o f steric factors by
incrementing alkyl substitution. We hypothesize that higher alkyl substitution
may increase differentiation not only among linkage positions but in the anomeric
configuration of the glycosidic bond. An alkyl series (ranging from methyl to
pentyl) o f two pairs of glucose-glucose disaccharides maltose\ cellobiose and
isomaltose\ gentiobiose were synthesized as described elsewhere [67], The goal of
the work to be presented in this paper is to differentiate the stereochemistry o f the
glycosidic bond in these anomeric pairs o f disaccharides and to study the effect of
68
Reproduced with permission of the copyright owner. Further reproduction prohibited without permission.
the alkyl groups on collision-induced glycosidic bond cleavage. To the best o f our
knowledge electrospray in conjunction with tandem mass spectrometry o f this
extensive set of protonated peralkylated disaccharides used here for anomeric
configuration differentiation has not yet been investigated under the low energy
regime. This work will demonstrate that differentiation of the alpha (a) and beta
(P) anomers o f glucose-glucose disaccharides by positive ion electrospray tandem
mass spectrometry is possible, depending on the ability o f the molecule to
rotationally diffuse the energy attained in the collision event. The spectra obtained
are strongly dependent on the freedom o f rotation o f the monosaccharide rings
about the glycosidic bond.
Experimental
Materials
The native disaccharides maltose, cellobiose, isomaltose and gentiobiose were
purchased from Sigma Chemicals (St. Louis MO). All materials were used as
received without further purification. Solutions for ESI-MS were prepared by
mixing lOOuL of the peralkylated disaccharide of 2mM in methanol with 1-2%
trifluoroacetic acid.
High- Resolution Measurements
High resolution nanoelectrospray-MS was performed on all precursor ions prior to
low energy CID studies to unambiguously ascertain the molecular ion. Accurate
mass measurements were made with an Ion Spec FTICR.
Reproduced with permission of the copyright owner. Further reproduction prohibited without permission.
Instrumentation
Electrospray ionization mass spectrometry was performed using a Micromass
Quattro II triple quadrupole mass spectrometer (Micromass Inc., Manchester,
England). The collision cell is an r f only quadrupole and is the reaction region.
Collision induced dissociation is carried out in this reaction region between the
first and third quadrupole. The sample is introduced via direct infusion at a flow
rate o f 2-3jiL/min. Ions formed in the source are transmitted into the first
quadrupole where the precursor ion is mass selected. The precursor ion is then
transmitted into the second quadrupole where it undergoes collision induced
decomposition by collison with argon target gas which is introduced into this
quadrupole. The pressure of the collision gas is at lxlO ' 5 torr which is kept
constant through out the experiment. The threshold laboratory collision energy is
5eV for each derivative, which is then incremented by 4, 5, 6 , 7, 8 eV for the
methyl, ethyl, propyl, butyl, and pentyl derivatives respectively. Incrementation of
the collison energy has been calculated in the center of mass frame of reference
based on the following equation
E COm=Eiab[mt/m i+ m t]
Ecom =collision energy in the center o f mass frame
Eub ^collision energy in the lab frame
mi = mass of ion
mt = mass of target
The third quadrupole is then scanned for the product ions. The product ion spectra
resulted from the signal averaging of 25 scans.
70
Reproduced with permission of the copyright owner. Further reproduction prohibited without permission.
Results and Discussion
Four alpha and beta glucose-glucosyl disaccharides viz. 1—>4 linked
maltose (a) and cellobiose ((3) and 1 — > 6 linked isomaltose (a) and gentiobiose ((3)
derivatized with alkyl groups (methyl to pentyl) (as shown in figure 3.1) were
analyzed by low energy ESI-MS/MS since this regime allows one to probe a
subtle variation o f ion internal energies. The peralkylated disaccharides
preferentially yield intense sodium cationized adducts, w hich give ions due to
both cleavage o f the glycosidic bond and sugar ring cleavages and generally
require a higher energy to fragment [65,68]. The protonate<d molecular ion of
permethylated oligosaccharides had previously been shown to provide facile
fragmentation of the glycosidic bond in studies of sugar sequence and branching
[6 8 ]. The protonated molecules (MH)+ were generated in fiigh abundance by
addition of 2% trifluoroacetic acid after desalting o f the compound with a cation
exchange column. The on-line reverse phase desalting step adopted by Viseux et
al. [6 8 ] prior to MS analysis appears to be more time consumimg.
Rationale for derivatization of disaccharides with a homologous series o f alkvl groups
Derivatization of the saccharide in our study with am increasing size of
alkyl substituent provided not only an increase in the steric crowding around the
glycosidic bond but a very clear reflection of the importance of steric factors on
fragmentation. The steric encumberance on the disaccharides w as incremented by
simple increase o f the carbon chain length, to examine the effects of crowding on
glycosidic bond rotation, while keeping constant the number oft potential
Reproduced with permission of the copyright owner. Further reproduction prohibited without permission.
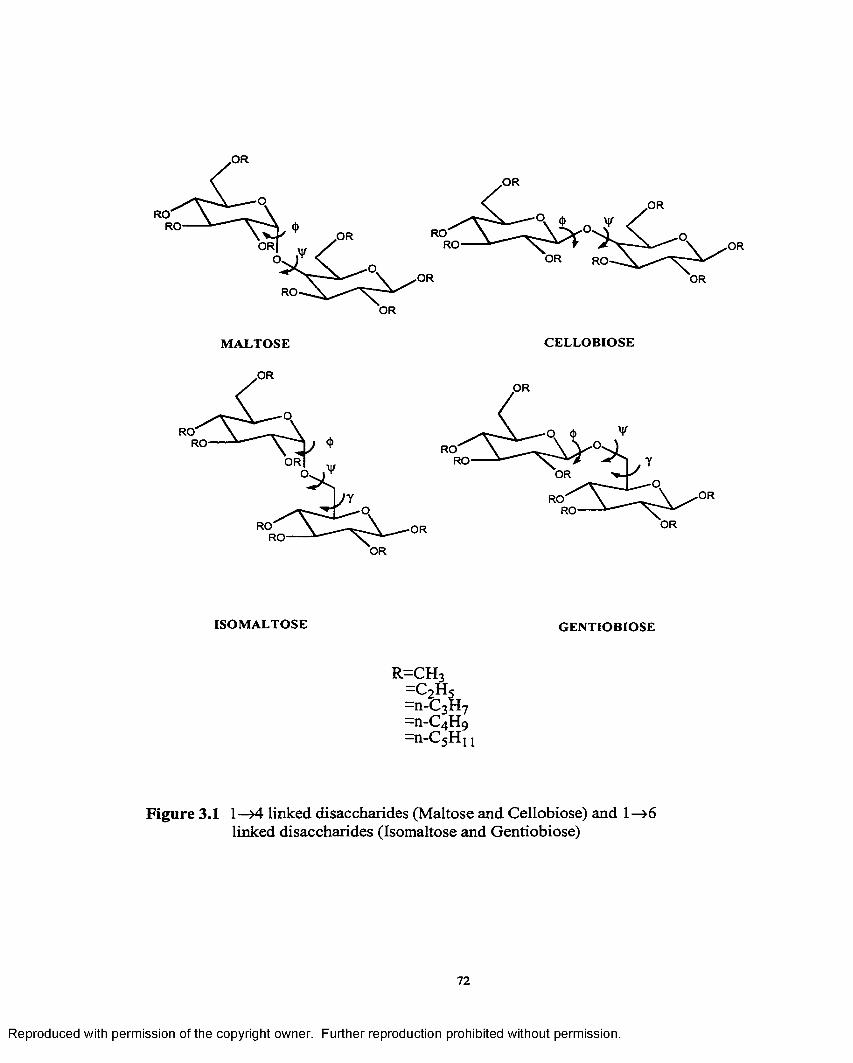
OR
MALTOSE CELLOBIOSE
,OR
RO'RO
OR
RO' ORRO
OR
RO'RO
ORORRO'
ROOR
OR
ISOMALTOSE GENTIOBIOSE
R=CH3 f C 2H5 —I1-C3H7 —H-C4 H 9
=n-C5H 1 L
Figure 3.1 1—>4 linked disaccharides (Maltose and Cellobiose) and 1— > 6
linked disaccharides (Isomaltose and Gentiobiose)
72
Reproduced with permission of the copyright owner. Further reproduction prohibited without permission.
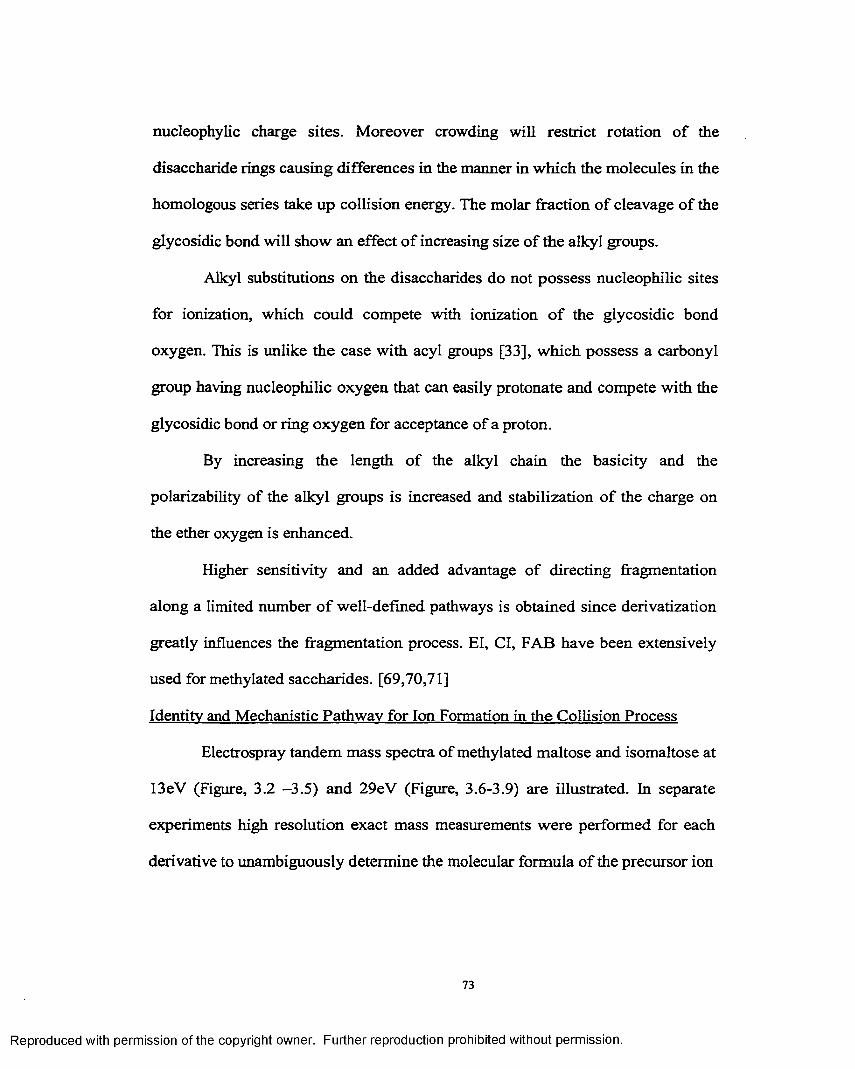
nucleophylic charge sites. Moreover crowding will restrict rotation o f the
disaccharide rings causing differences in the manner in which the molecules in the
homologous series take up collision energy. The molar fraction o f cleavage o f the
glycosidic bond will show an effect o f increasing size o f the alkyl groups.
Alkyl substitutions on the disaccharides do not possess nucleophilic sites
for ionization, which could compete with ionization o f the glycosidic bond
oxygen. This is unlike the case with acyl groups [33], which possess a carbonyl
group having nucleophilic oxygen that can easily protonate and compete with the
glycosidic bond or ring oxygen for acceptance of a proton.
By increasing the length o f the alkyl chain the basicity and the
polarizability of the alkyl groups is increased and stabilization o f the charge on
the ether oxygen is enhanced.
Higher sensitivity and an added advantage o f directing fragmentation
along a limited number o f well-defined pathways is obtained since derivatization
greatly influences the fragmentation process. El, Cl, FAJB have been extensively
used for methylated saccharides. [69,70,71]
Identity and Mechanistic Pathway for Ion Formation in the Collision Process
Electrospray tandem mass spectra of methylated maltose and isomaltose at
13eV (Figure, 3.2 -3.5) and 29eV (Figure, 3.6-3.9) are illustrated. In separate
experiments high resolution exact mass measurements were performed for each
derivative to unambiguously determine the molecular formula o f the precursor ion
Reproduced with permission of the copyright owner. Further reproduction prohibited without permission.
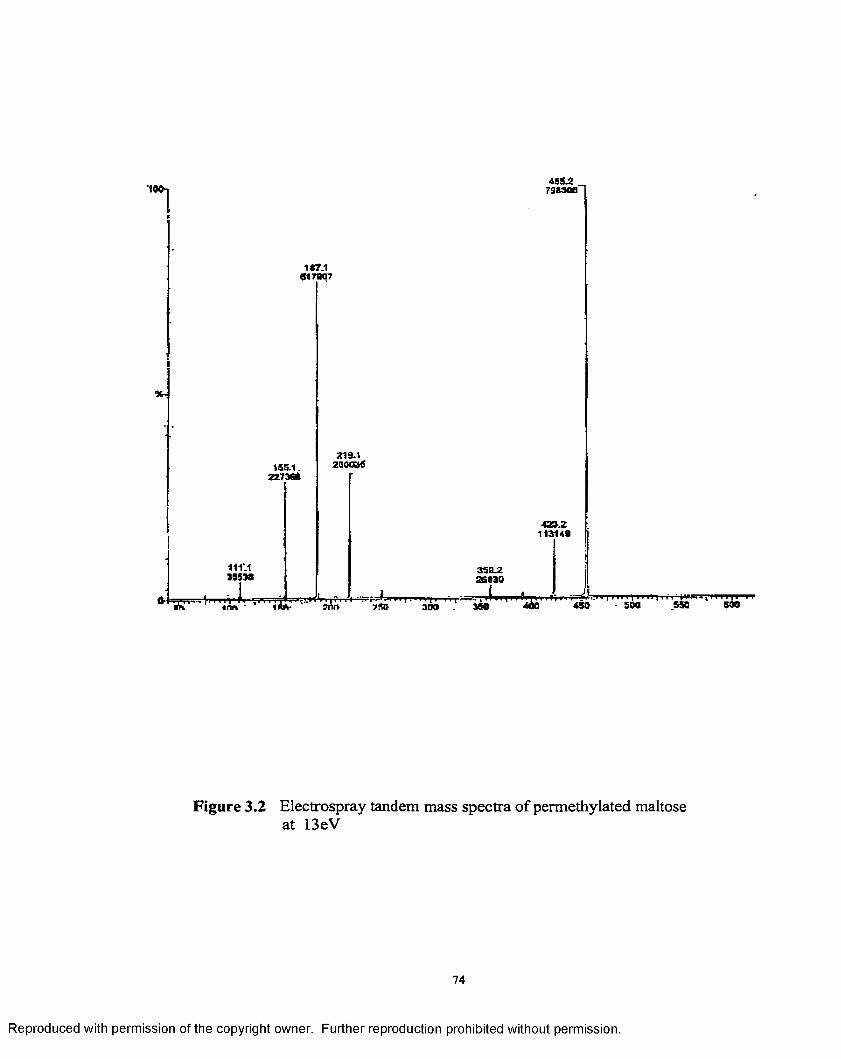
•1 » j45
790300"
157.1617007
V
1 55 .1 . 2 2 7 3 9 0
111VIJ 5 5 »
219.12saca5
IRA-
439.2113149
3SCL2 j26030 1
. .. . . il »n 11 >i 11 ■ ii r .r r lvm 300 360 450 500 550 500
Figure 3.2 Electrospray tandem mass spectra of permethylated maltose at 13eV
74
Reproduced with permission of the copyright owner. Further reproduction prohibited without permission.
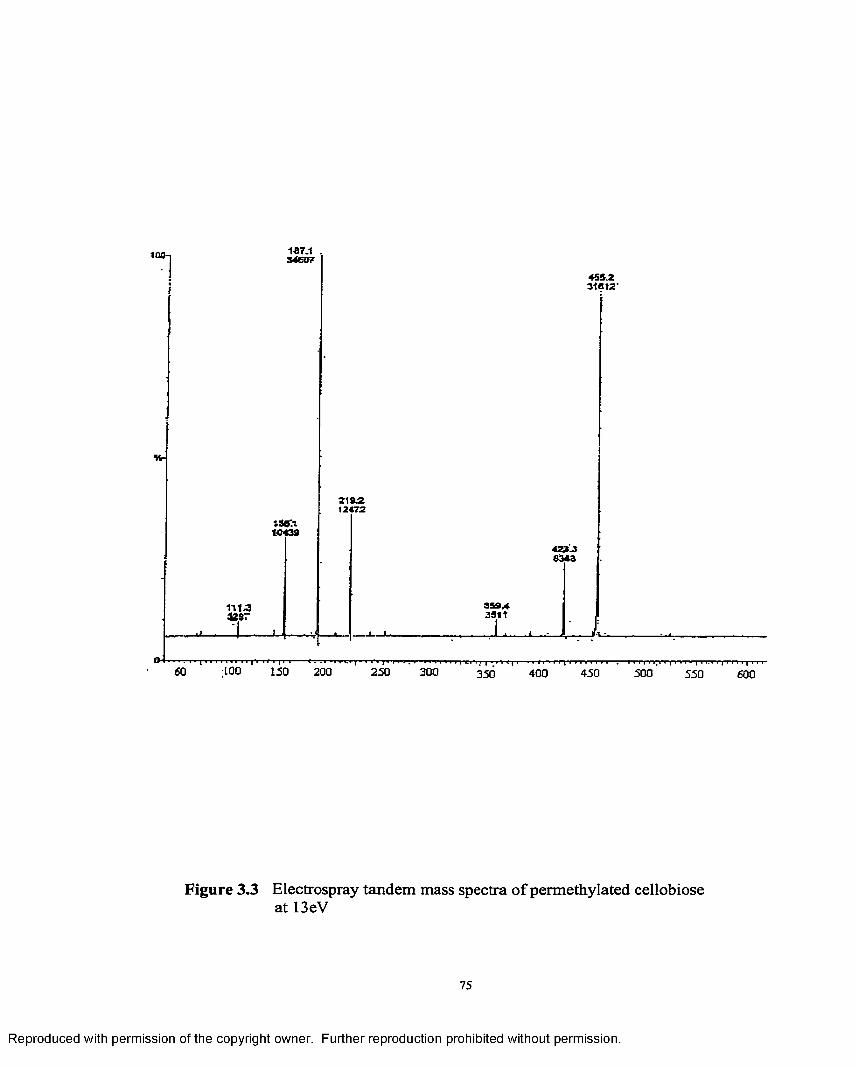
21*212*72
•LOO 150 200 250 300 450 500400350 550 600
Figure 3.3 Electrospray tandem mass spectra o f permethylated cellobiose at 13eV
Reproduced with permission of the copyright owner. Further reproduction prohibited without permission.
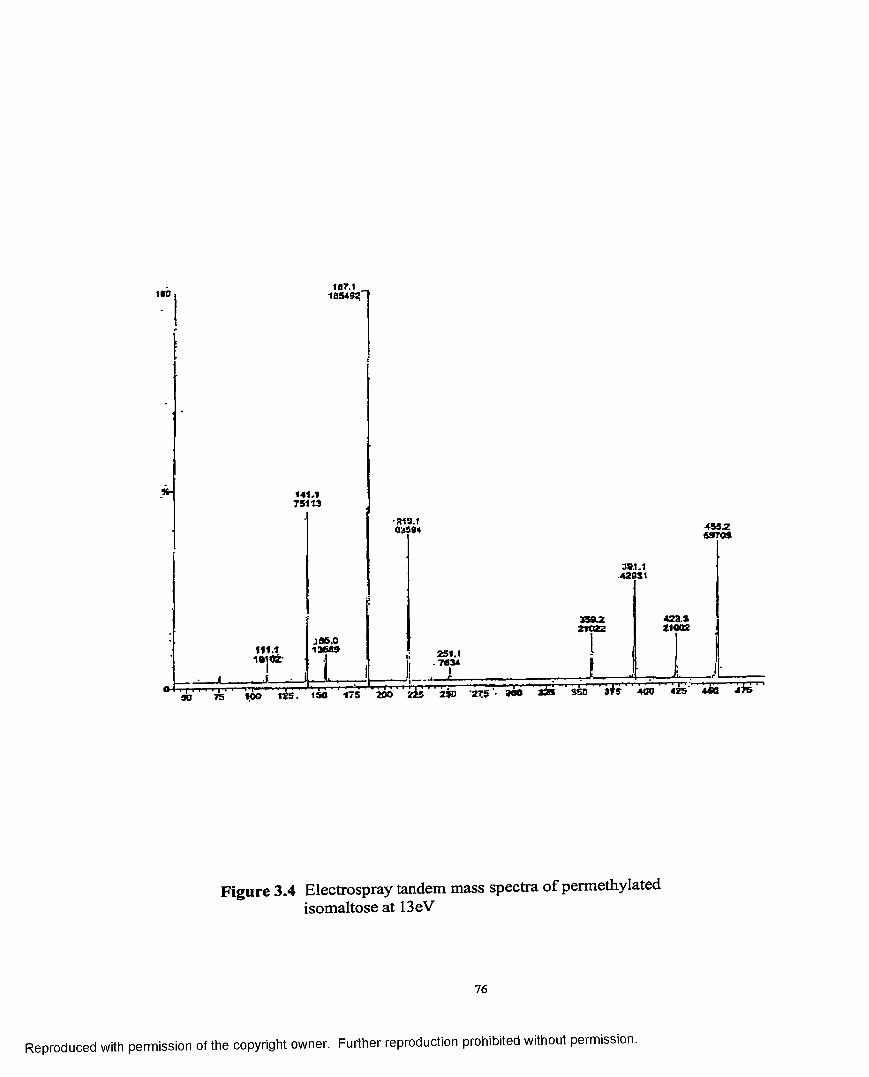
100
%-
251.1. M U
1 2 5 . 150 1 7 5 2 0 075
Figure 3.4 Electrospray tandem mass spectra of permethylated isomaltose at !3eV
76
Reproduced with permission of the copyright owner. Further reproduction prohibited without permission.
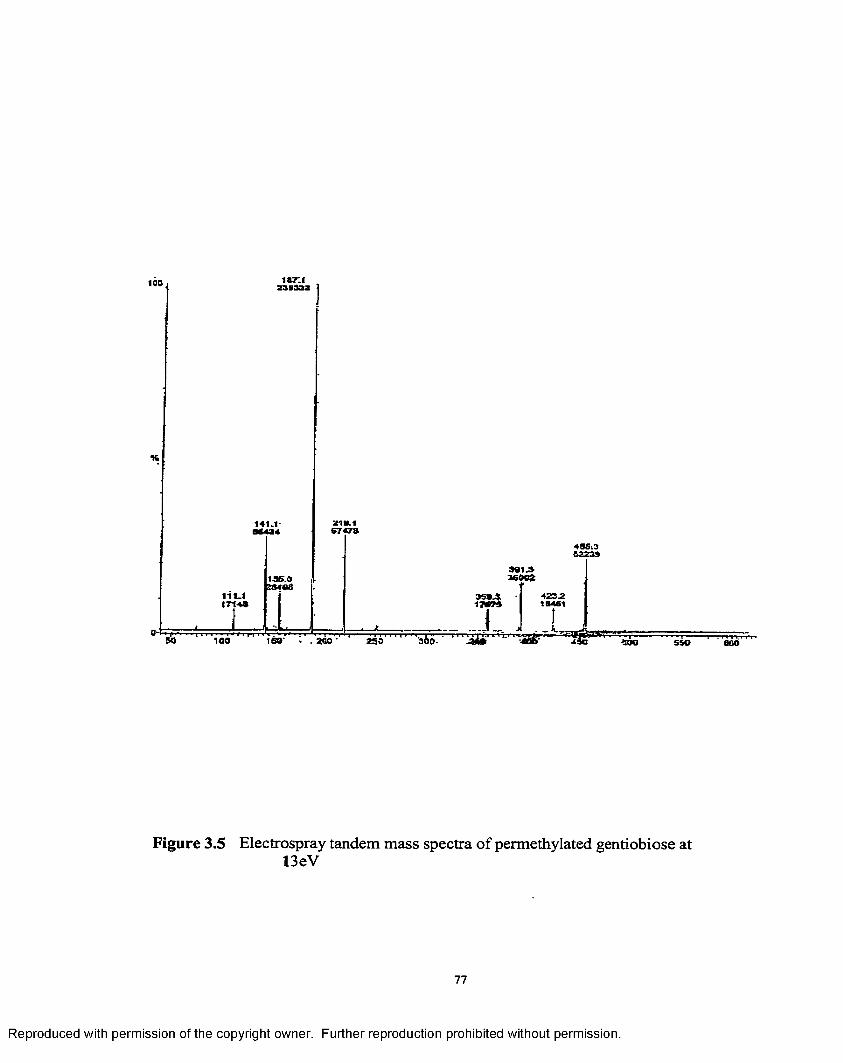
Z1S.1«7«7S
11 U l !Tf4»\ 3 G . 0b84«s
455362239901^
359417W ?5
4234tB 461
I$o IC O 1 S 0 ' 200 ' 250 a6 o- 500 SCO
Figure 3.5 Electrospray tandem mass spectra of permethylated gentiobiose at 13eV
77
Reproduced with permission of the copyright owner. Further reproduction prohibited without permission.
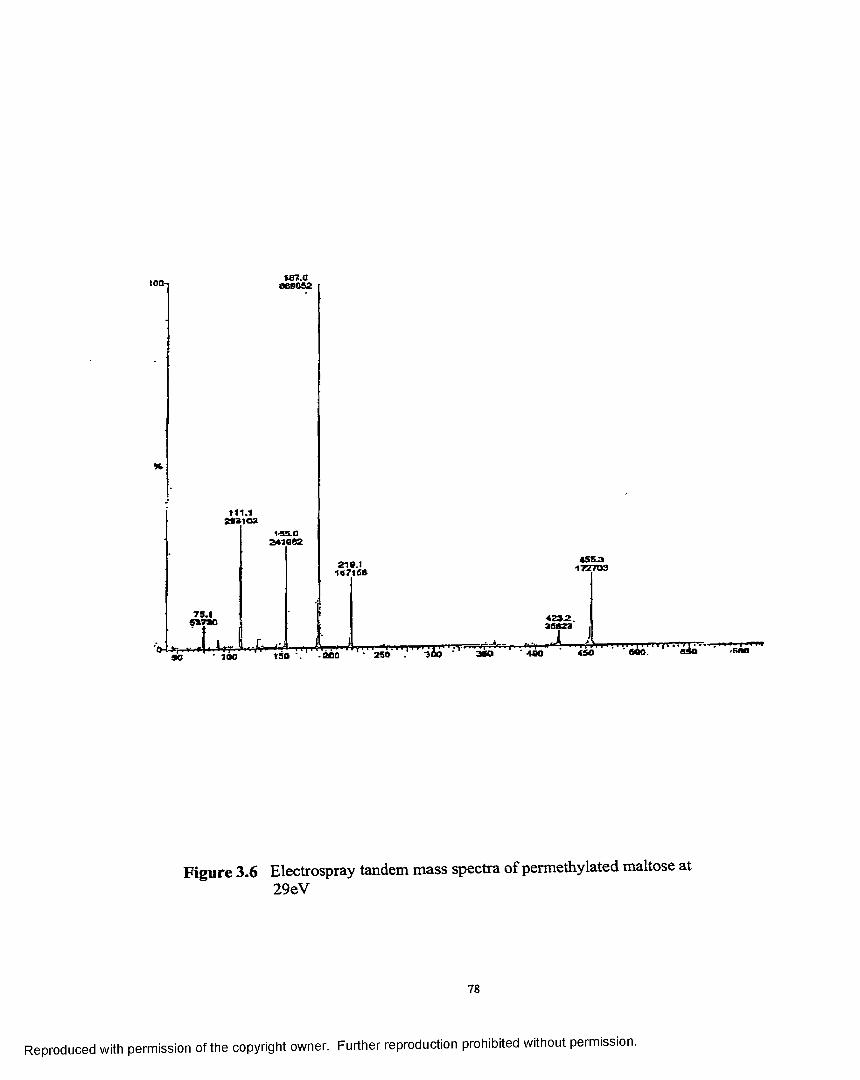
250S O
Figure 3.6 Electrospray tandem mass spectra of permethylated maltose at 29eV
78
Reproduced with permission of the copyright owner. Further reproduction prohibited without permission.
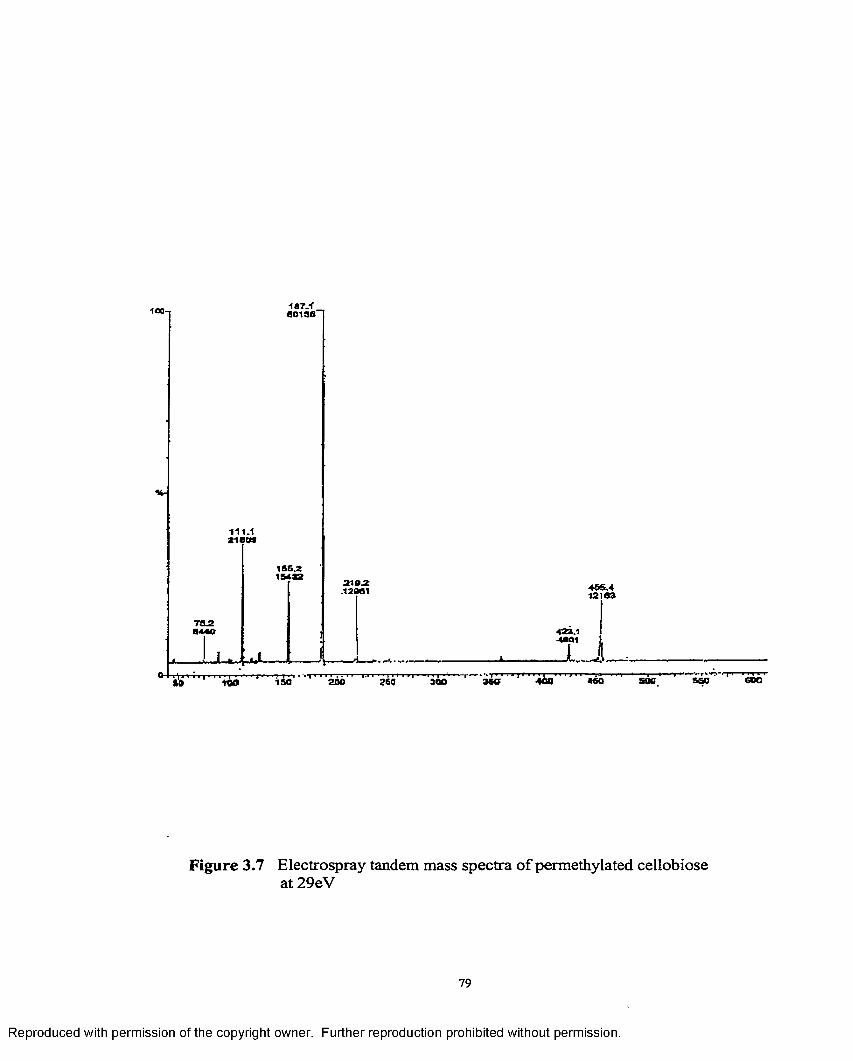
111.1 *1 cn
165 .2
sgc SfiO260200IS O
Figure 3.7 Electrospray tandem mass spectra o f permethylated cellobiose at 29eV
79
Reproduced with permission of the copyright owner. Further reproduction prohibited without permission.
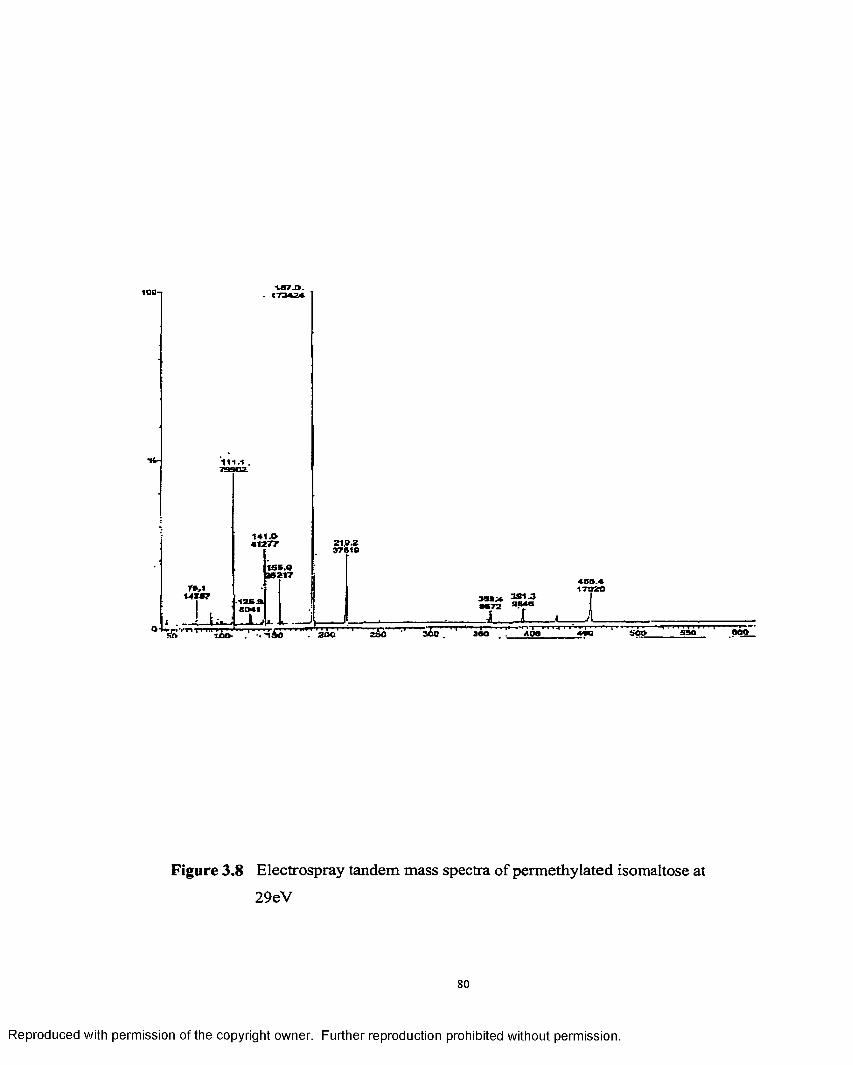
MW MU M72
300
Figure 3.8 Electrospray tandem mass spectra of permethylated isomaltose at
29eV
80
Reproduced with permission of the copyright owner. Further reproduction prohibited without permission.
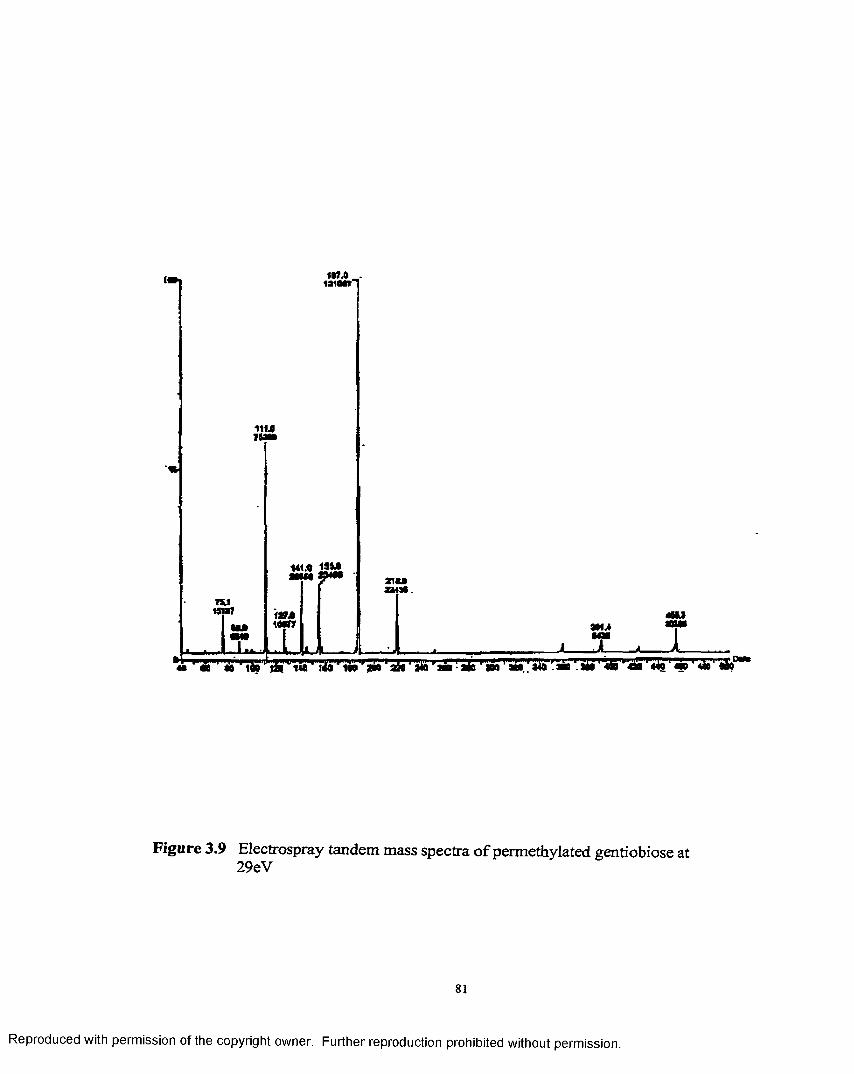
Figure 3.9 Electrospray tandem mass spectra o f permethylated gentiobiose at 29 eV
81
Reproduced with permission of the copyright owner. Further reproduction prohibited without permission.
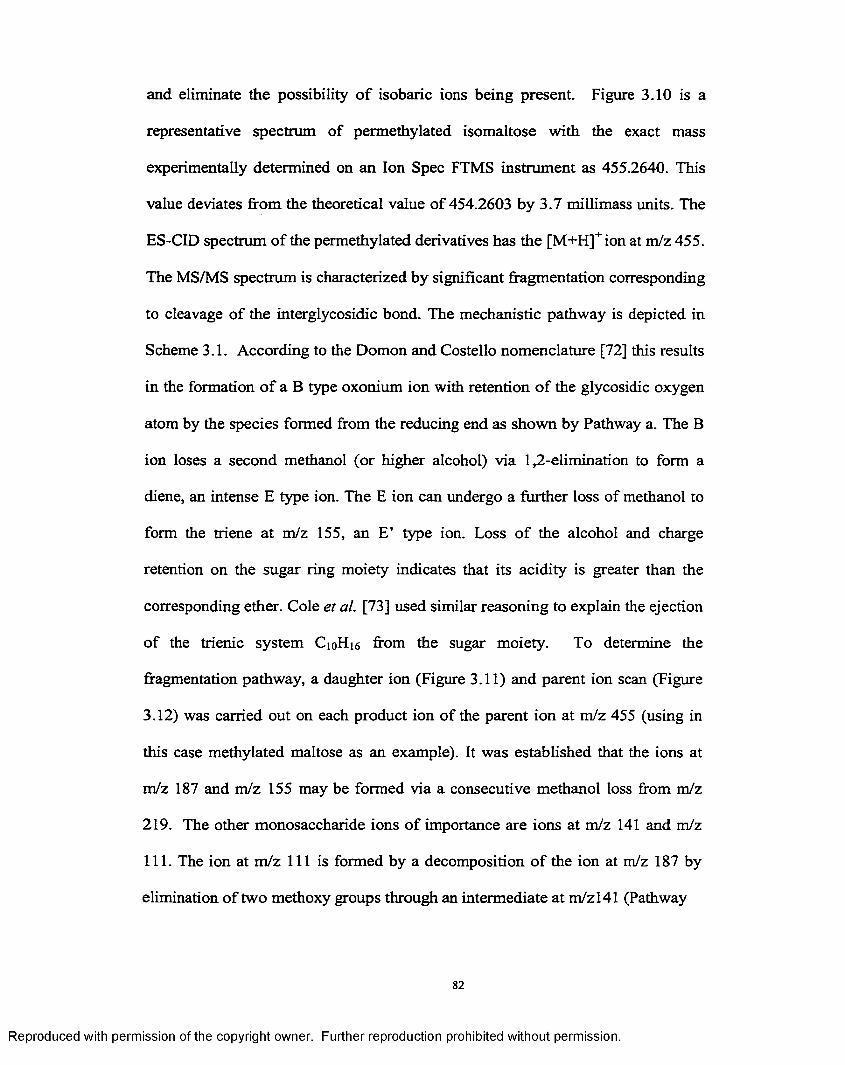
and eliminate the possibility o f isobaric ions being present. Figure 3.10 is a
representative spectrum of permethylated isomaltose with the exact mass
experimentally determined on an Ion Spec FTMS instrument as 455.2640. This
value deviates from the theoretical value of 454.2603 by 3.7 millimass units. The
ES-CID spectrum of the permethylated derivatives has the [M+H]+ ion at m/z 455.
The MS/MS spectrum is characterized by significant fragmentation corresponding
to cleavage of the interglycosidic bond. The mechanistic pathway is depicted in
Scheme 3.1. According to the Domon and Costello nomenclature [72] this results
in the formation o f a B type oxonium ion with retention o f the glycosidic oxygen
atom by the species formed from the reducing end as shown by Pathway a. The B
ion loses a second methanol (or higher alcohol) via 1 ,2 -elimination to form a
diene, an intense E type ion. The E ion can undergo a further loss of methanol to
form the triene at m/z 155, an E’ type ion. Loss o f the alcohol and charge
retention on the sugar ring moiety indicates that its acidity is greater than the
corresponding ether. Cole et al. [73] used similar reasoning to explain the ejection
o f the trienic system CioHi6 from the sugar moiety. To determine the
fragmentation pathway, a daughter ion (Figure 3.11) and parent ion scan (Figure
3.12) was carried out on each product ion of the parent ion at m/z 455 (using in
this case methylated maltose as an example). It was established that the ions at
m/z 187 and m/z 155 may be formed via a consecutive methanol loss from m/z
219. The other monosaccharide ions of importance are ions at m/z 141 and m/z
111. The ion at m/z 111 is formed by a decomposition o f the ion at m/z 187 by
elimination of two methoxy groups through an intermediate at m/zl41 (Pathway
82
Reproduced with permission of the copyright owner. Further reproduction prohibited without permission.
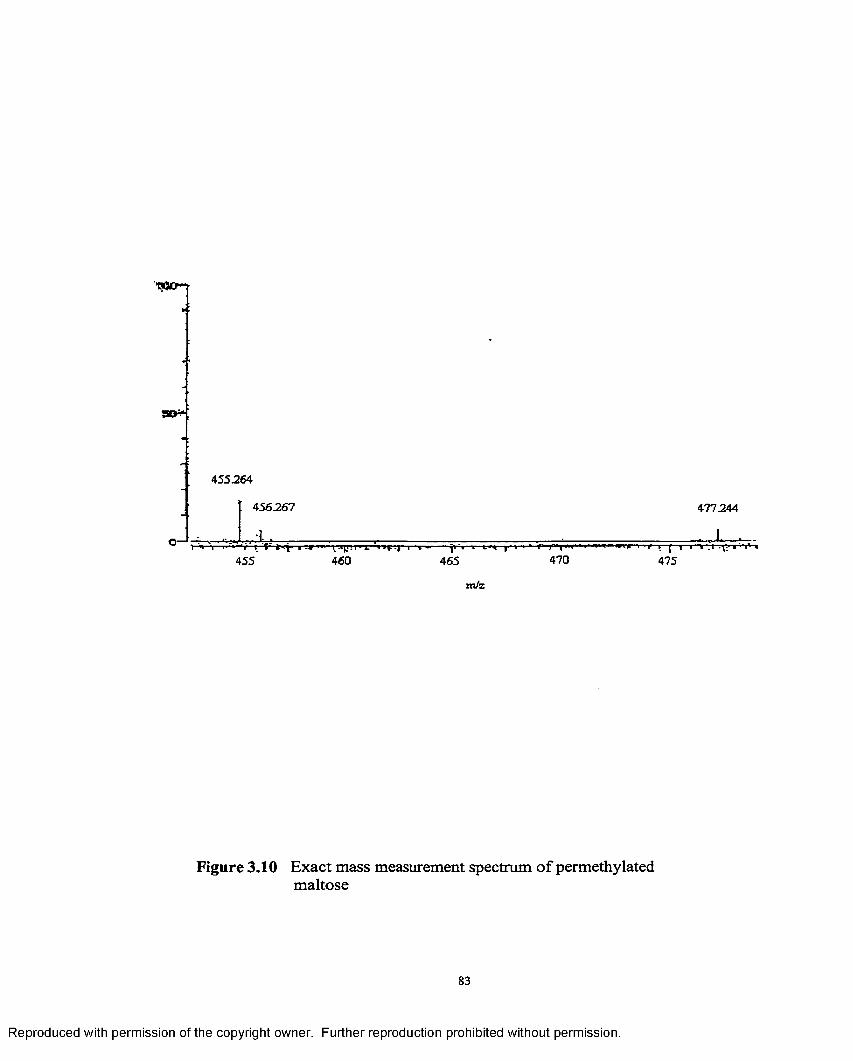
'Too-“r
455.264
456.267
t V455
*<r-460
r'l ■">470
T p475
r*465
zn/z
Figure 3.10 Exact mass measurement spectrum o f permethylated maltose
83
477.244
■ "i* *
Reproduced with permission of the copyright owner. Further reproduction prohibited without permission.
V-— 'J U----—.‘ . i b o L- f»l> ' 190 ’ 200
Figure 3.11 Daughter ion scan o f permethylated maltose at m/z 187
84
Reproduced with permission of the copyright owner. Further reproduction prohibited without permission.
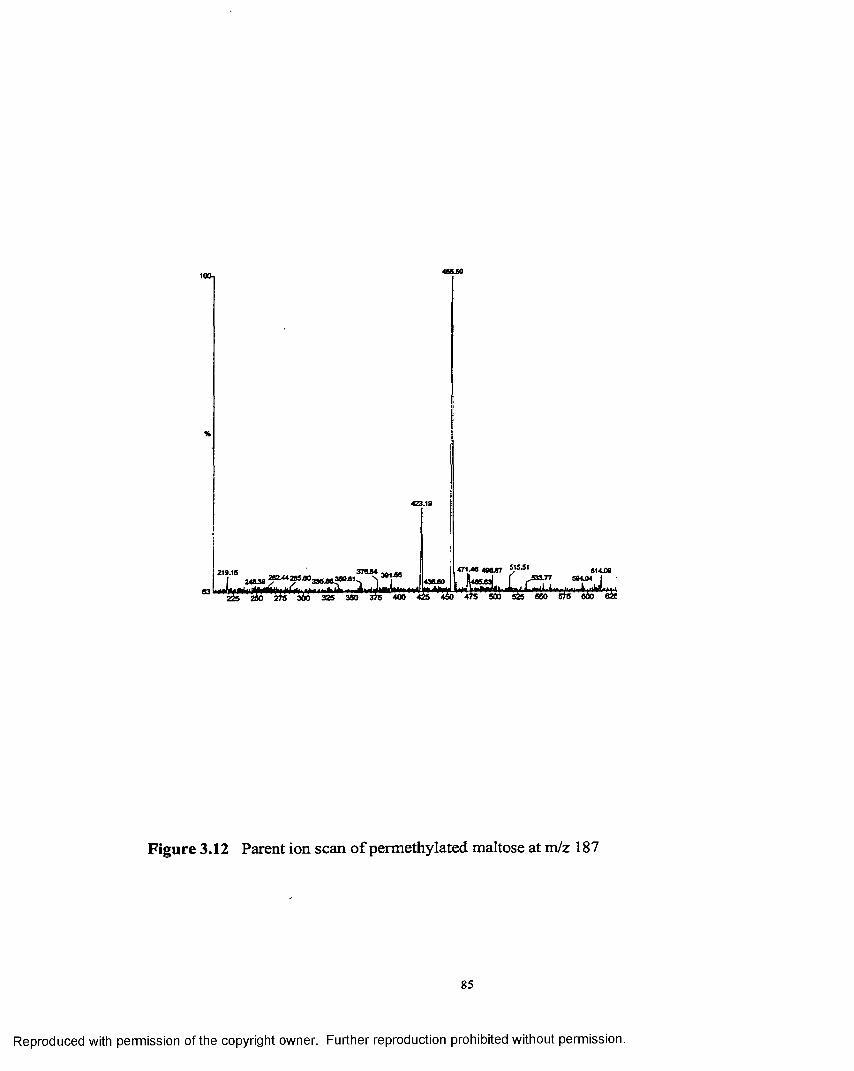
too.
%
219.15 3 7 0 0 4 mmJ 24& 30 ^ 2 M ^ 5 -a 0 3 3 6 > I 4 3 000
1 "k ,""Sr ^ r, i & J " a **&'
471.46 4064T7
sie'eHo"«!*sso
Figure 3.12 Parent ion scan o f permethylated maltose at m/z 187
85
Reproduced with permission of the copyright owner. Further reproduction prohibited without permission.
b). A similar fragmentation pathway was earlier observed by Chizov et al. [74].
For the derivatives higher than methyl viz. ethyl, propyl, butyl, and pentyl the
representative ion at m/z 111 (for methyl) could be formed by Pathway b or
through an intermediate at m/z 183 or higher depending on the alkyl group by a
hydride shift (Pathway c). However the methylated derivatives can follow only
mechanism b. The major monosaccharide ion at m/z 141 is formed by
decomposition o f the ion at m/z 391 as revealed in the product ion spectrum o f
m/z 391. The ion at m/z 141 is formed by a beta cleavage o f the ion at m/z 391
(Pathway d). A similar fragmentation pattern was proposed by Dell et al. [75] in
FAB mass spectrometry. Derivatives higher than methyl could follow a similar
pathway (Pathway d) or by elimination of the alkyl chain as an alkene (Pathway
e) for alkyl groups higher than methyl. The minor ions at m/z 423, 391 and 359
(Figure 3.1) are formed by successive losses of methanol (or the corresponding
alcohol in the case of the higher derivatives) which is a continuous pathway as
shown by the MS/MS/MS experiment (Pathway f).
Effect of Increasing Masses of the Ions
To maintain collision events as isoenergetic one must compensate for the
increasing mass o f the precursor ions that change from methyl to pentyl
derivatives. This is accomplished by holding the collision energy constant in the
center of mass frame of reference [76].
In the center of mass frame the maximum energy available for transfer
depends on the mass of the projectile ion (m*) and the target gas (mt) (eqn 1 )
Ecom=Eiab[mt/mi+mt] (1)
8 6
Reproduced with permission of the copyright owner. Further reproduction prohibited without permission.
which initiates decompositions. Eub is the translational energy o f the precursor ion
before collision. The collision energy in the center o f mass frame of reference
(Ecom) represents the maximum amount o f kinetic energy available for conversion
into internal energy for an analyte ion of mass m, colliding with a stationary gas
atom o f mass mt. E^b is incremented with increasing mass of MET such that the
center-of-mass collision energies remain nearly constant. This allows a direct
comparison between cleavage rates for the different alkyl derivatives. Table 3.1
shows a comparison o f the center-of-mass energy (AEcom) which is nearly
constant with the incremented collision energy (AEiab) for each alkyl derivative.
Note that only integer increments of laboratory collision energy are possible on
the employed instrument. Compensation for the increase in mass o f the target ions
is important since only a fraction (Ecom) o f E^b is available for internal excitation
[77], The energy in the center of mass frame o f reference also decreases with
increase in mass o f the projectile ion, with a consequent decrease in collision
efficiency. Collision with a target gas molecule such as Ar will transfer
proportionately more energy to smaller, in comparison with larger, molecules. In
this study, anomeric configuration discrimination will be based upon a
comparison o f the relative rates of competitive and consecutive decompositions.
The methylated derivatives would be expected to fragment more completely than
the perpentylated derivatives at the same center-of-mass energy on collision with
stationary argon. However the glycosidic bond may cleave more easily in the
perpentylated derivative as described below. No correction is made for subtle
differences in collision cross-section. If the conversion of E ^ to ECOm according to
87
Reproduced with permission of the copyright owner. Further reproduction prohibited without permission.
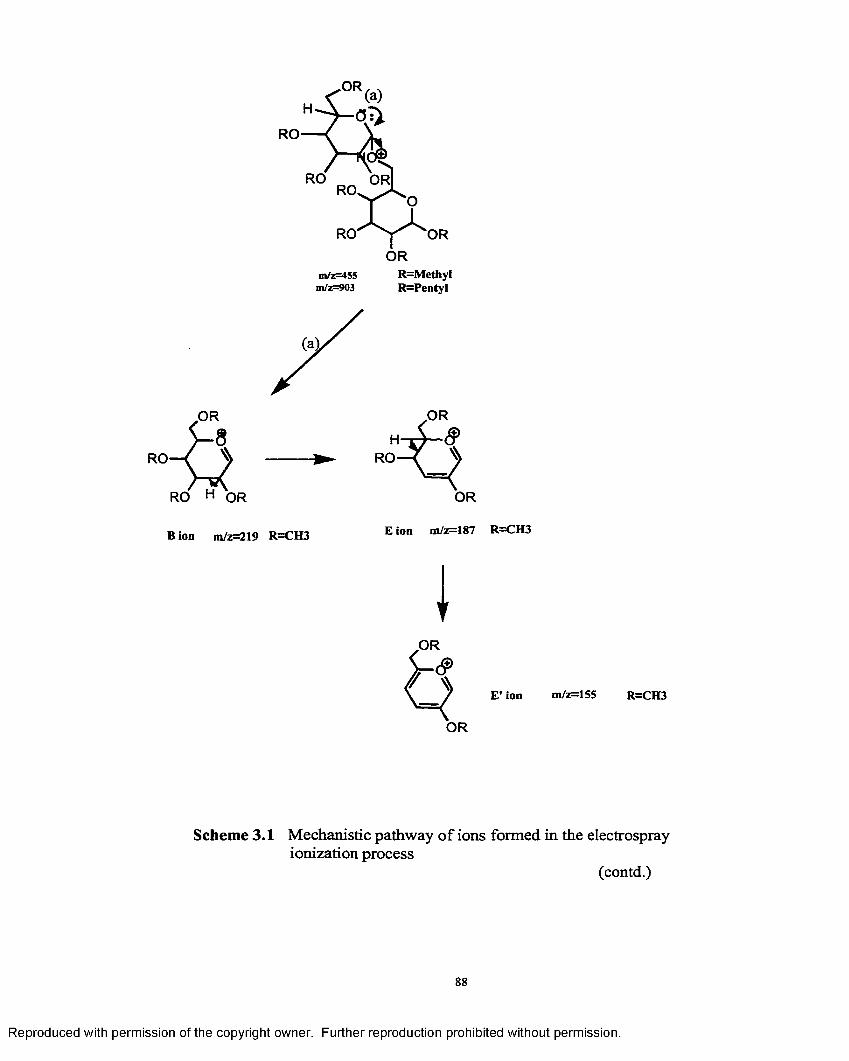
OR
OR
RO H OR
m/z=455m/z=903
R=MethyIR=Pentyl
B ion m/z=219 R=CH3
OR
E ion m/z=187 R=CH3
OR
E' ion m/z=155 R=CH3
Scheme 3.1 Mechanistic pathway o f ions formed in the electrospray ionization process
(contd.)
88
Reproduced with permission of the copyright owner. Further reproduction prohibited without permission.
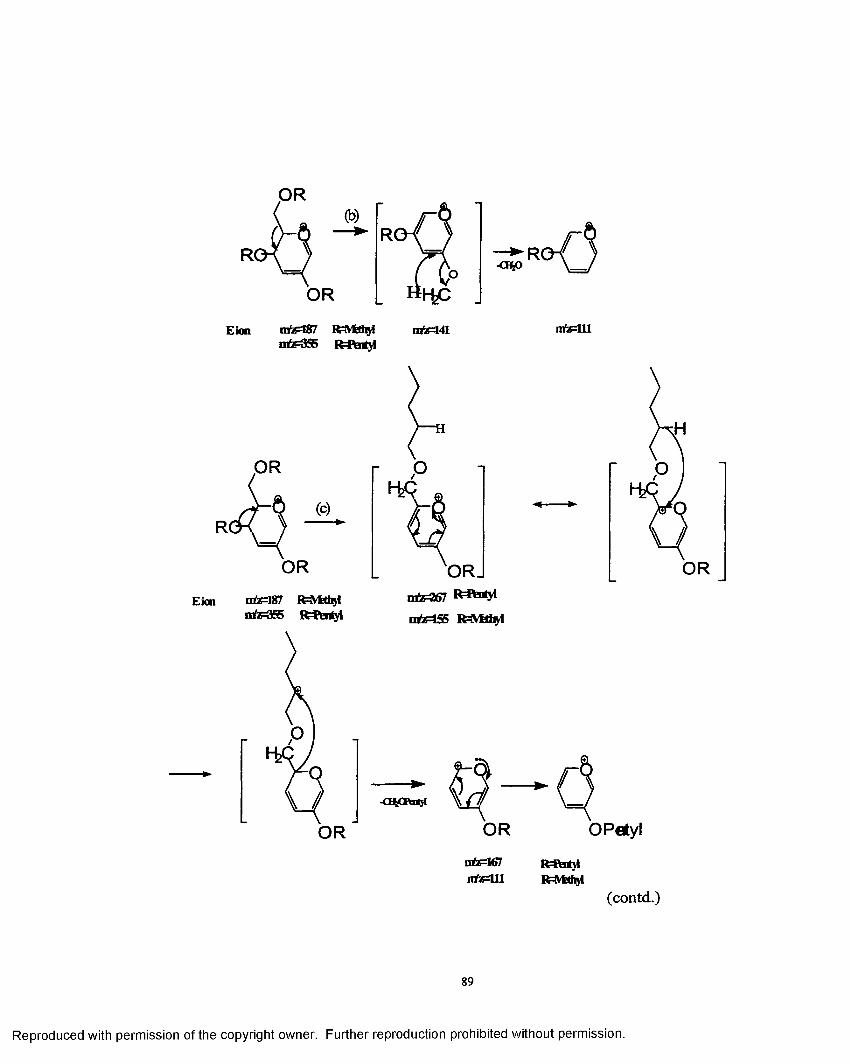
.OR(b)
OR
Eion mfe=187 ISVIfhyi a te S 55 I^Pfentyl
mfa=l41
OR
E ic n trfe=187 R =?V iihyl m fe= 355 R = f t r t \i n M fS R^Vttfiyi
-GE&0fat}<
OR
OR OR OPetylmfe=167irfz=Ul
R t t a t y tR=fVttM
(contd.)
89
Reproduced with permission of the copyright owner. Further reproduction prohibited without permission.
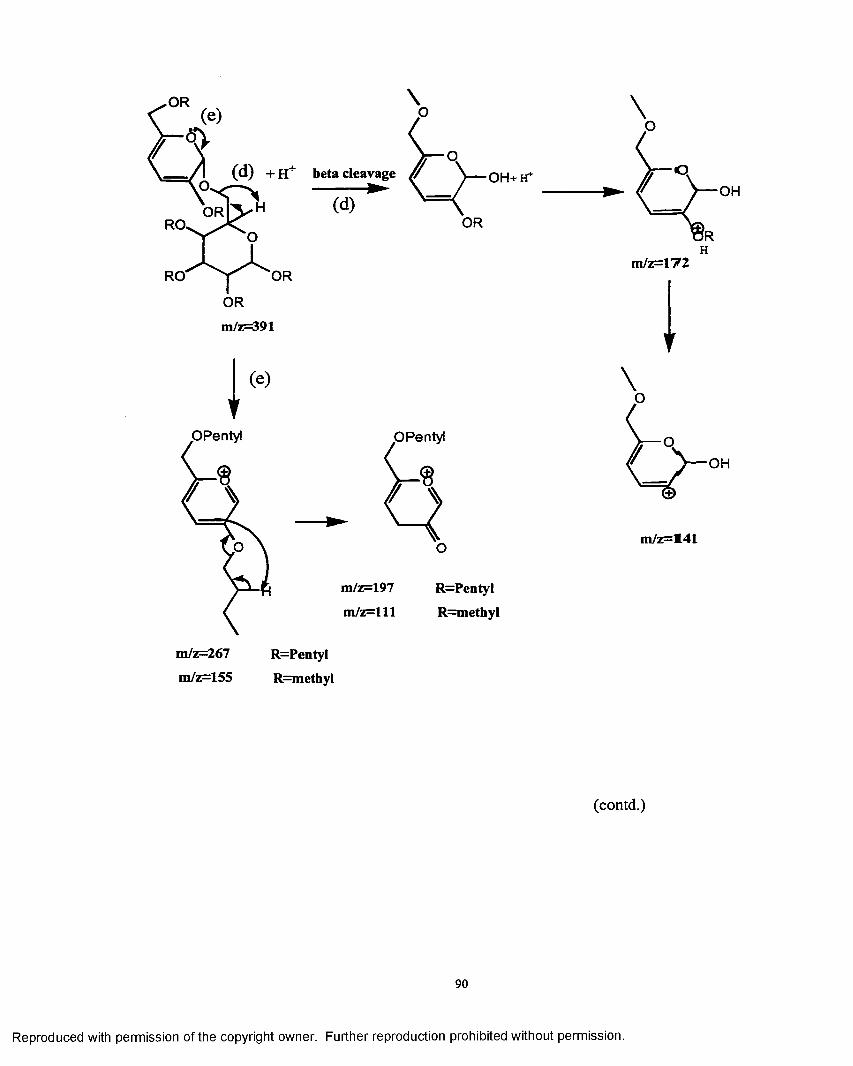
OR
(d ) + h + beta cleavage // OH+H*
ORORRO.
ORRO‘
ORm/z=391
I(e)
OPentyl OPentyl
m/z=197 R=PentylR=methylm /z= lll
m/z=267 R=PentyI
\
OH
Hm/z=172
\
OH
m/z=141
m/z=155 R=methyl
(contd.)
90
Reproduced with permission of the copyright owner. Further reproduction prohibited without permission.
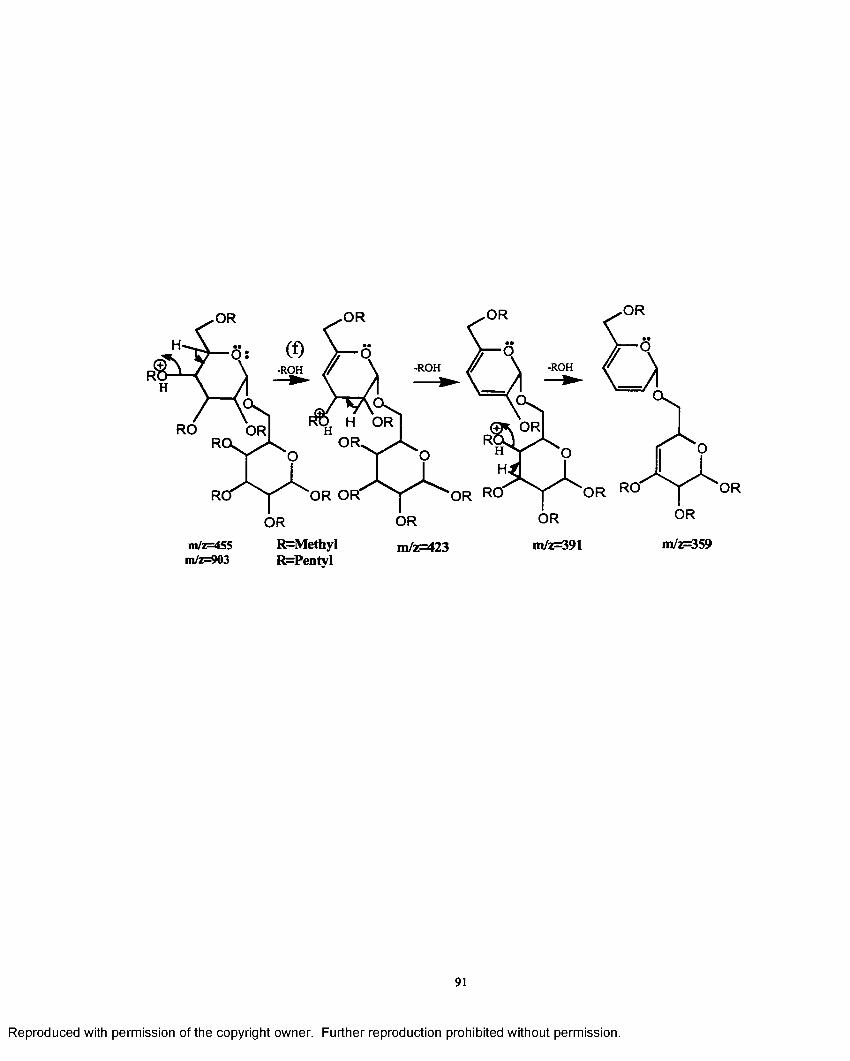
R=MethylR=PentyI
m /z= 3 9 1m/z=4S5m/z=903
91
Reproduced with permission of the copyright owner. Further reproduction prohibited without permission.
equation 1 is not taken into account investigators would be inadvertently
observing the incorrect relative effect o f collision energy. Special attention was
also paid to the adjustment o f the o f collision gas pressure, such that single or low
number collision conditions were maintained in the r.f. only collision hexapole
[76]. Maintaining a low constant pressure of lx 10' 5 torr at zero offset so that the
main ion beam was attenuated by 1 0 % was used as the criterion for low number
collision conditions [78,79].
Methodology Used to Differentiate Stereoisomers
The MS-MS spectra o f each anomer derivatized with the same alkyl group and of
the same linkage type show the same parent ion and fragment ions at a certain
collision energy. Even though the fragment ions are identical, the abundances of
the ions differ significantly between the two anomers to an extent that makes it
possible to differentiate the stereochemistry o f the glycosidic bond in each
anomer. Anomeric configuration information is thus obtained through differential
ion abundance of the glycosidic fragments, which provides the most promising
criteria for usage of the methodology to be described for differentiation o f the
stereochemistry and rates of cleavage o f the glycosidic bond. The MS-MS spectra
of decompositions o f the [M+H]+ at m/z 455 for the four methylated glucose-
glucose disaccharide anomers for the 1-^4 and 1 —> 6 linkage positions at a
collision offset energy o f 13eV and 29eV (Fig. 3.2-3.9) serve as representative
spectra for the entire disaccharide series. The complete fragmentation pathway of
all the ions formed in the spectrum of methylated isomaltose is summarized in
Scheme 3.2. This depiction of one possible pathway is deduced by carrying out an
92
Reproduced with permission of the copyright owner. Further reproduction prohibited without permission.
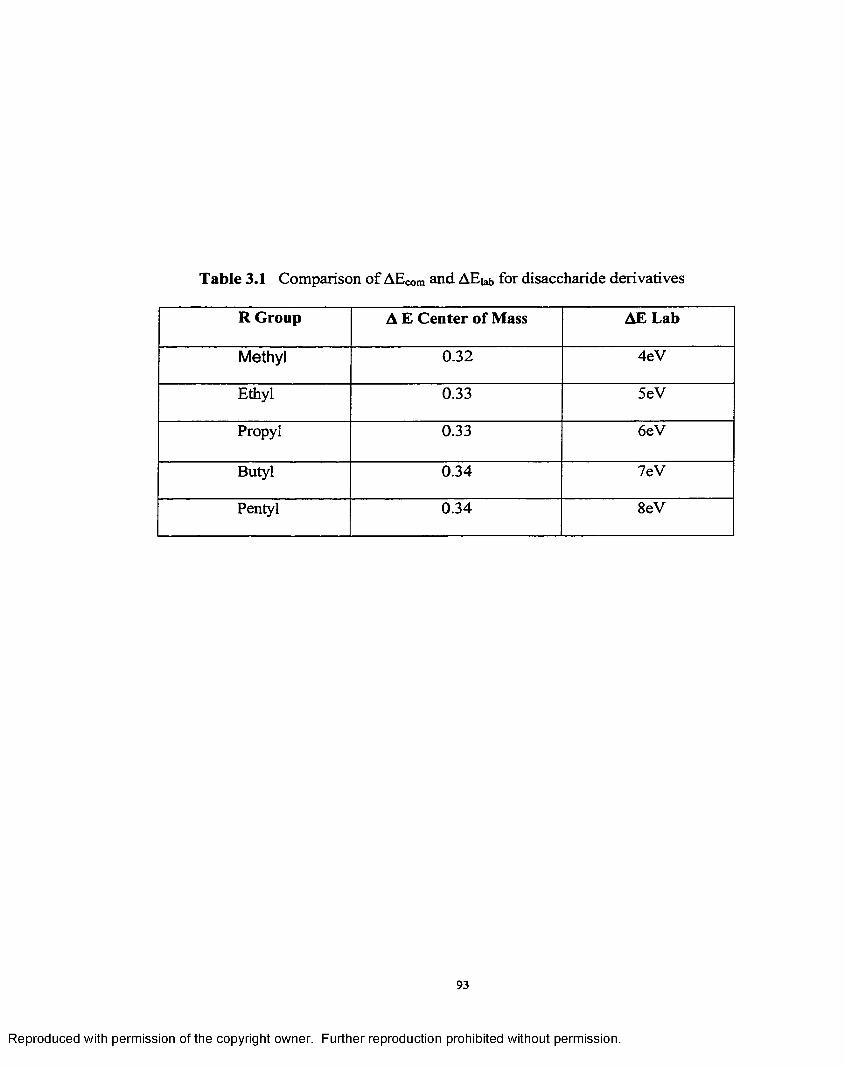
Table 3.1 Comparison of AECOm and AEiab for disaccharide derivatives
R Group A E C enter of Mass AE Lab
Methyl 0.32 4eV
Ethyl 0.33 5eV
Propyl 0.33 6 eV
Butyl 0.34 7eV
Pentyl 0.34 8 eV
93
Reproduced with permission of the copyright owner. Further reproduction prohibited without permission.
MS-MS-MS experiment involving a sequential dissociation o f the daughter ions
(daughter ion scan) in the spectrum as stated above to obtain their individual
product ions. To ascertain if the same pathway is followed by the anomer of a
different linkage position viz. permethylated maltose, and for a higher derivative
viz. perbutylated maltose the product ion spectra o f all the daughter ions were
obtained, and a parent ion scan on each daughter ion was carried out. The
fragmentation pathway for permethylated maltose (Scheme 3.3) was similar to
that for permethylated isomaltose except that the formation o f m/z 1 1 1 from m/z
141 is o f minor abundance. In the case o f perbutylated maltose (Scheme 3.4) the
mechanistic pathway is similar to that of permethylated maltose except for the
presence o f an enhanced pathway from 239—>183. Thus, each alkyl derivative
forms homologous sets of ions, with their formation proceeding at different rates
through alternative pathways.
The internal energy deposited in an ion and hence the degree of
fragmentation is dependent on the collision energy [80]. This is evident from the
MS/MS spectra for permethylated isomaltose which is used as a model compound
that the collision energy has a dramatic effect upon the character o f the spectra
because o f increased energy deposition, as shown in Fig. 3.8.
In our experiments, the collision energy is varied by incrementing the
voltage on a lens before the RF only quadrupole. Plots o f the change in collision
offset voltage against the ion ratio o f the combined intensity of relevant daughter
ions divided by the intensity o f the parent ion were constructed. Figure 3.13 is an
example. Then plots o f the ratio o f the daughter to parent ion intensity for each
94
Reproduced with permission of the copyright owner. Further reproduction prohibited without permission.
anomer are constructed. To differentiate between alpha and beta anomers, a
comparison between the absolute intensities of the product ions related to
cleavage o f the glycosidic bond is not as useful as taking the daughter to the
parent ratio which minimizes effects due to variations in instrumental parameters
over time. According to the MS-MS-MS spectra (Scheme 3.2) fragmentation of
the glycosidic bond takes place resulting in a cascade of relevant product ions.
These product ions are formed through a consecutive pathway o f alcohol losses
directly related to cleavage of the glycosidic bond. Van der Kerk et al. [56] used
the daughter ion ratios to judge the difference between the alpha and beta anomers
in a series of peracetylated P-xylobiosides after ascertaining that there were no
factors adding to, or subtracting from, the intensity o f the glycosidic bond ion
other than from the [M+H]+ ion. The MS-MS-MS spectra of our compounds
revealed pathways that were related to glycosidic bond cleavage. These ions taken
together comprise the intensity of the glycosidic ion. An explanation of the
daughter ions taken into account and summed up is shown in Scheme 2 using
methylated isomaltose as a representative compound. The very minor
disaccharide ions at m/z 423, m/z 391, m/z359 are not considered since they do
not involve cleavage of the glycosidic bond. The ion at m/z 423 could form m/z
391 or m/z 219 through two different pathways each with a different rate constant.
If the rate constant for the pathway 423—>391 is much greater, then the formation
of the ion at m/z 219 would be negligible and formation of the disaccharide ion
would be very facile, giving no information of the glycosidic bond. Not knowing
the rate constant for the two pathways leaves some amount o f ambiguity,
95
Reproduced with permission of the copyright owner. Further reproduction prohibited without permission.
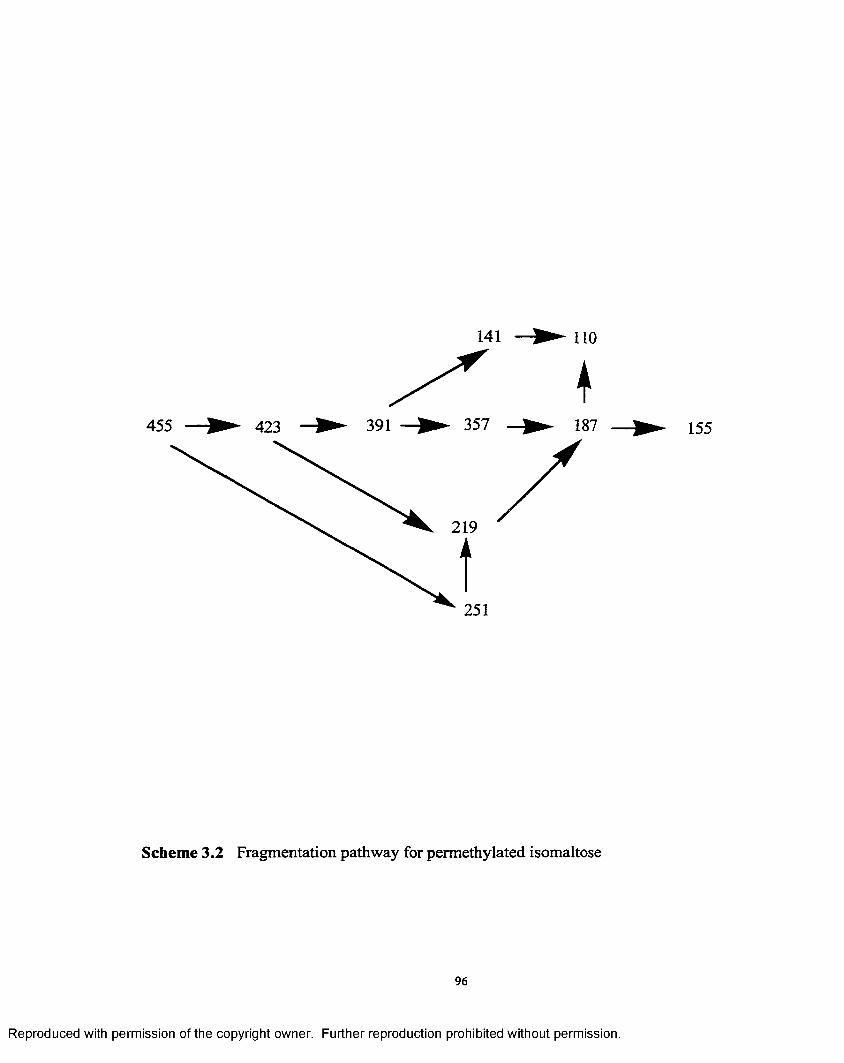
141 — ► 110
219
251
Scheme 3.2 Fragmentation pathway for permethylated isomaltose
96
Reproduced with permission of the copyright owner. Further reproduction prohibited without permission.
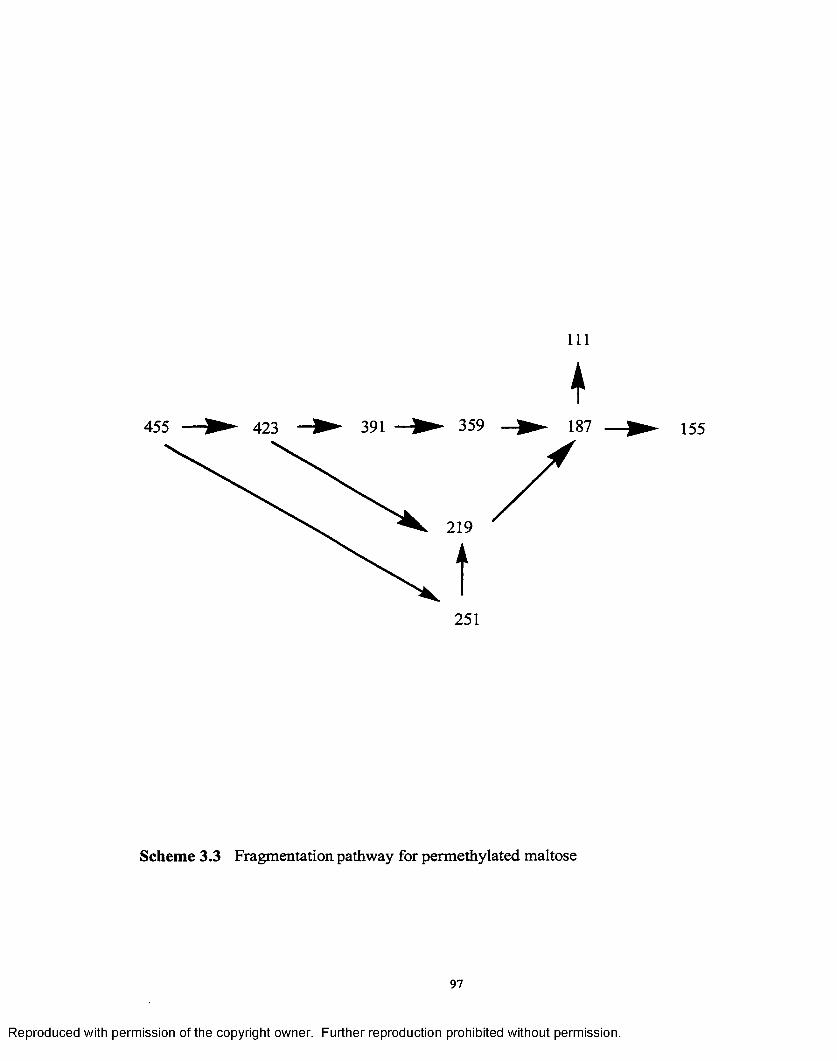
L1 1
f
219
251
Scheme 3.3 Fragmentation pathway for permethylated maltose
97
Reproduced with permission of the copyright owner. Further reproduction prohibited without permission.
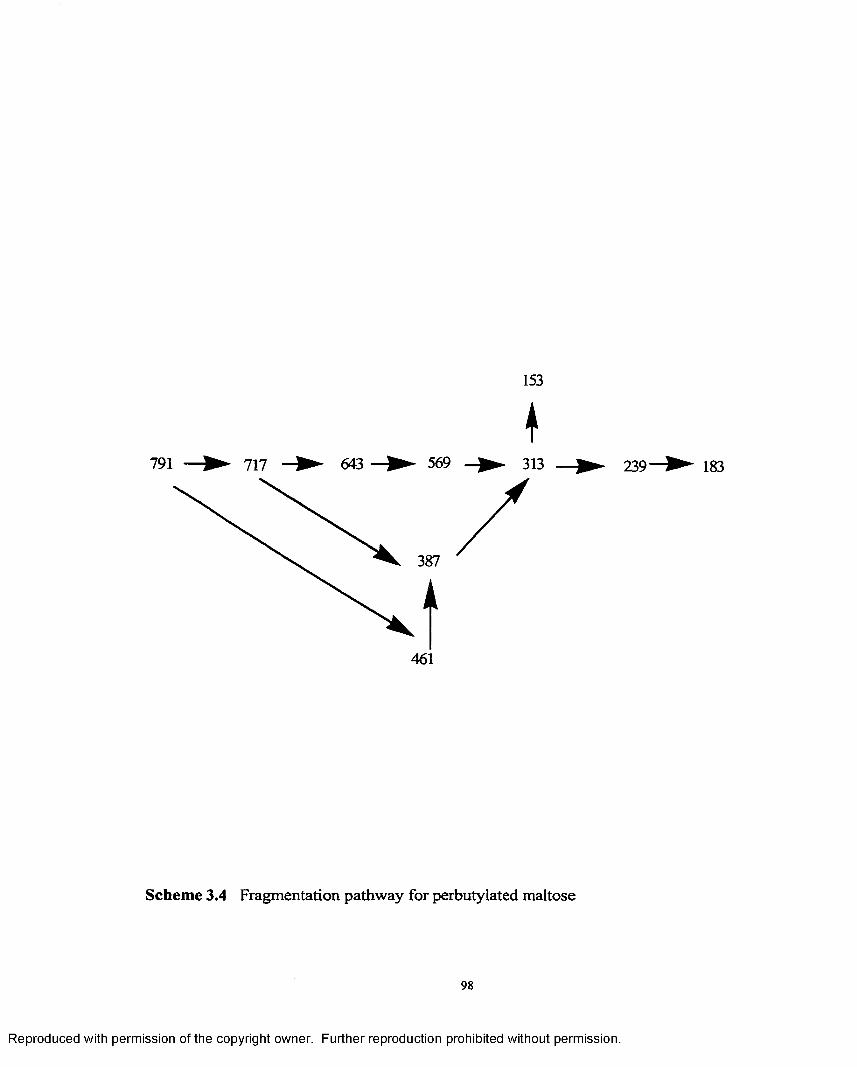
Scheme 3.4 Fragmentation pathway for perbutylated maltose
98
Reproduced with permission of the copyright owner. Further reproduction prohibited without permission.

DIP
Ion
Ratio
- • — Propyl Maltose • - • Propyl Cellobiose
30
25
20
15
0 1 2 3Center of Mass Collision Energy
Figure 3.13 Plot of the collision offset voltage versus daughter/parent ion ratio
Reproduced with permission of the copyright owner. Further reproduction prohibited without permission.
therefore warranting non-consideration of the disaccharide ions. The daughter
ions summed up are m/z 219, the glycosidic bond ion and monosaccharide ions at
m/z 187, m/z 155, m/z 141 and m/z 110. Even though some o f the ions are formed
by two different pathways and the ion at m/z 187 in turn fragments to form other
ions by two pathways (Scheme 3.2) they are considered since they are
monosaccharide ions which are formed only after cleavage of the glycosidic bond.
Similarly the ion at m/z 141 is a monosaccharide ion formed from the
disaccharide ion at m/z 391. The ions obtained after glycosidic bond cleavage are
related to it and thus considered to arise only beyond threshold energy for
cleavage. In summary the daughter ion value is obtained by summing up the
abundance for all the daughter ions formed once the glycosidic bond is cleaved.
Fragmentations taking place a number of steps after cleavage of the
glycosidic bond are related to it and information regarding the glycosidic bond
could be obtained from such distant fragmentations since they are formed with a
range of internal energies because of the excess energy contained in the glycosidic
bond ion and are thus influenced by the energy contained in it. It is known that the
internal energy acquired by the parent and product ions is related to the structure
of the parent ion [81]. Thus it is reasonable to say that a “memory effect” is
retained in distant fragment ions which is related to the structure of the
disaccharide ion. The ions that are formed after glycosidic bond cleavage could
also be formed from precursor ion structures that lead directly to the transition
state and thus posses characteristics o f their precursors. The relation of the
“memory effect” of the fragment ions formed due to glycosidic bond cleavage
100
Reproduced with permission of the copyright owner. Further reproduction prohibited without permission.
with structure can be rationalized as follows: [i] At the temperatures of the mass
spectrometer a large number o f conformations are possible for each anomer.
Differences in the distribution of conformers present would be expected to
contribute to differences in the rate o f cleavage of the glycosidic bond for the two
anomers. [ii] Since we are operating under near single collision conditions it
results in fragment ions that are not produced from high energy dissociation
pathways, providing information specific to ion structure.
This particular methodology is used to determine the anomerity of the
glycosidic bond for the following reasons: It takes into account specific
decompositions initiated by a favorable stereochemistry at the glycosidic site thus
giving information on stereochemical effects. Incrementing of the collision energy
and evaluation o f the data within a range of collision energy will enhance the
stereochemical differentiation window. This is because it is difficult to predict in
advance the optimum collision energy to enable maximum stereochemical
differentiation. For a particular alkyl group, both the anomers of a particular
linkage isomer have all identical parameters except differences in anomerity.
Relative daughter ion abundances in collision activation spectra are
determined by the internal energy acquired by the molecule during activation. We
hypothesize that the amount of internal energy acquired by a molecule and thus
the propensity for cleavage of the glycosidic bond are linked to its anomerity, in
addition to the parameters defined by equation 1. This is because stereoisomers
are known to have different bond dissociation energies. Relative ion abundances
are known to be a measure of internal energy [82]. It is thus conceivable to say
101
Reproduced with permission of the copyright owner. Further reproduction prohibited without permission.
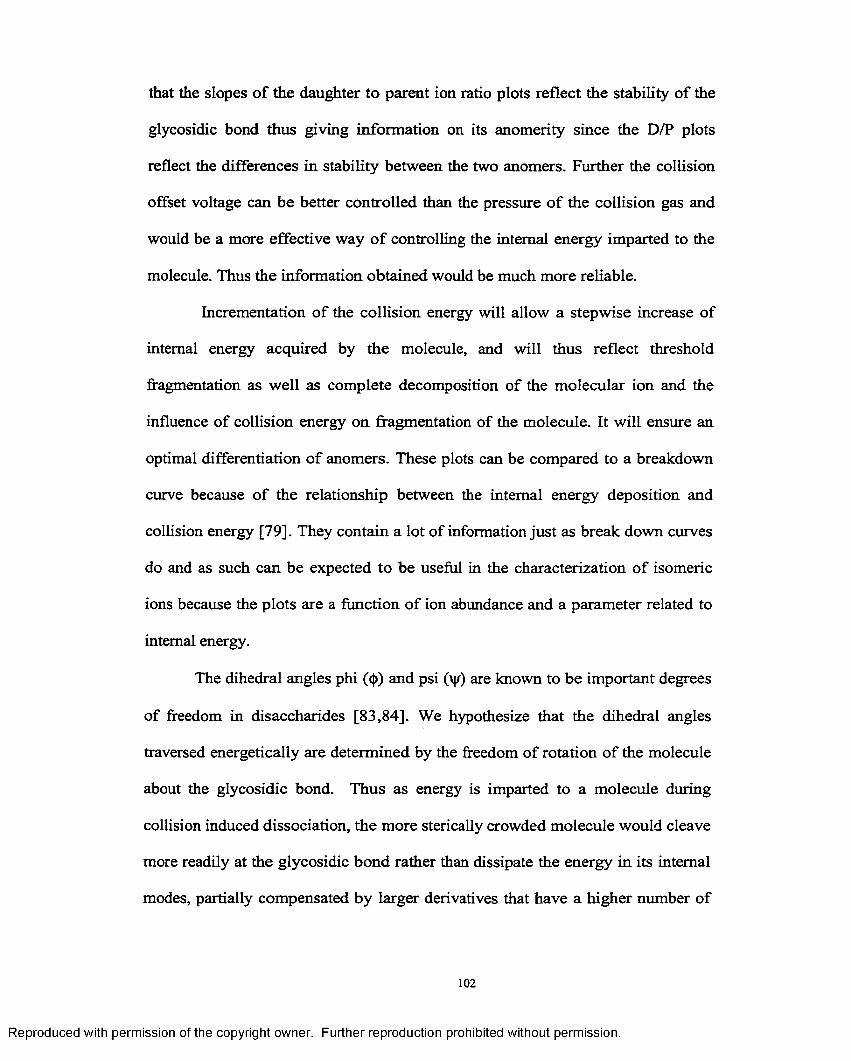
that the slopes o f the daughter to parent ion ratio plots reflect the stability o f the
glycosidic bond thus giving information on its anomerity since the D/P plots
reflect the differences in stability between the two anomers. Further the collision
offset voltage can be better controlled than the pressure o f the collision gas and
would be a more effective way o f controlling the internal energy imparted to the
molecule. Thus the information obtained would be much more reliable.
Incrementation o f the collision energy will allow a stepwise increase of
internal energy acquired by the molecule, and will thus reflect threshold
fragmentation as well as complete decomposition of the molecular ion and the
influence of collision energy on fragmentation of the molecule. It will ensure an
optimal differentiation o f anomers. These plots can be compared to a breakdown
curve because o f the relationship between the internal energy deposition and
collision energy [79]. They contain a lot of information just as break down curves
do and as such can be expected to be useful in the characterization o f isomeric
ions because the plots are a function o f ion abundance and a parameter related to
internal energy.
The dihedral angles phi (<f>) and psi (\y) are known to be important degrees
of freedom in disaccharides [83,84]. We hypothesize that the dihedral angles
traversed energetically are determined by the freedom of rotation of the molecule
about the glycosidic bond. Thus as energy is imparted to a molecule during
collision induced dissociation, the more sterically crowded molecule would cleave
more readily at the glycosidic bond rather than dissipate the energy in its internal
modes, partially compensated by larger derivatives that have a higher number of
102
Reproduced with permission of the copyright owner. Further reproduction prohibited without permission.
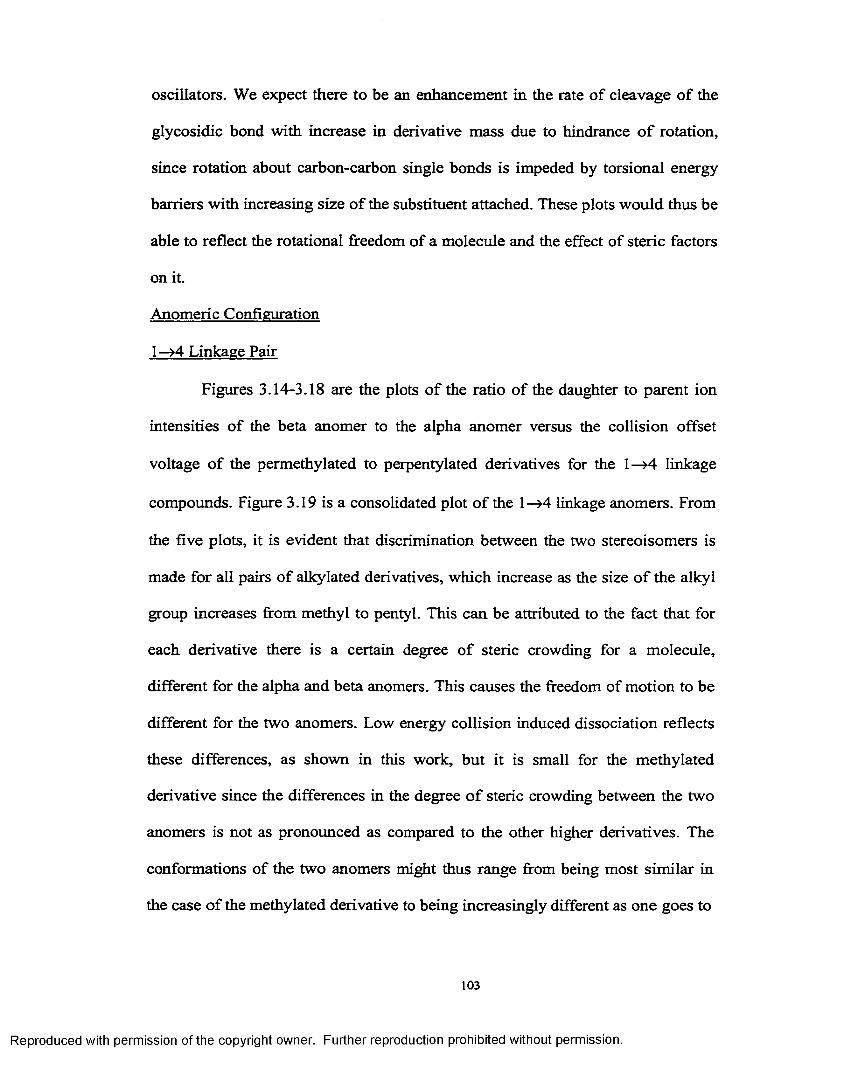
oscillators. We expect there to be an enhancement in the rate o f cleavage of the
glycosidic bond with increase in derivative mass due to hindrance o f rotation,
since rotation about carbon-carbon single bonds is impeded by torsional energy
barriers with increasing size o f the substituent attached. These plots would thus be
able to reflect the rotational freedom o f a molecule and the effect of steric factors
on it.
Anomeric Configuration
1—>4 Linkage Pair
Figures 3.14-3.18 are the plots o f the ratio of the daughter to parent ion
intensities of the beta anomer to the alpha anomer versus the collision offset
voltage o f the permethylated to perpentylated derivatives for the 1 — > 4 linkage
compounds. Figure 3.19 is a consolidated plot o f the 1—>4 linkage anomers. From
the five plots, it is evident that discrimination between the two stereoisomers is
made for all pairs o f alkylated derivatives, which increase as the size o f the alkyl
group increases from methyl to pentyl. This can be attributed to the fact that for
each derivative there is a certain degree o f steric crowding for a molecule,
different for the alpha and beta anomers. This causes the freedom of motion to be
different for the two anomers. Low energy collision induced dissociation reflects
these differences, as shown in this work, but it is small for the methylated
derivative since the differences in the degree o f steric crowding between the two
anomers is not as pronounced as compared to the other higher derivatives. The
conformations of the two anomers might thus range from being most similar in
the case o f the methylated derivative to being increasingly different as one goes to
103
Reproduced with permission of the copyright owner. Further reproduction prohibited without permission.

Methyl Maltose—O - Methyl Ceilobiose
g
I
i
1.2
0 .9 *
0.6 T T
1 2Center of Mass Collision Energy
Figure 3.14 Anomeric configuration differentiation of 1—>4 linked permethylated derivatives
104
Reproduced with permission of the copyright owner. Further reproduction prohibited without permission.
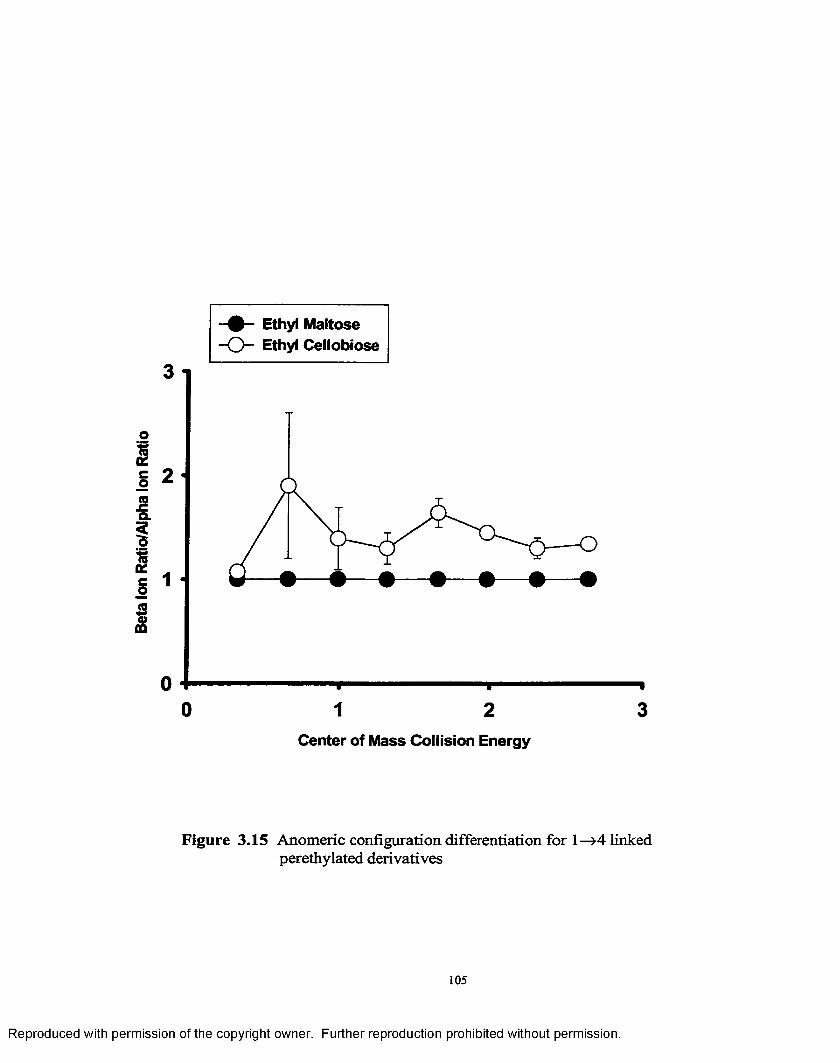
Beta
Ion
Ratio
/Alph
a Ion
Ra
tio
—0 — Ethyl Maltose- 0 ~ Ethyl Cellobiose
t
1"»
3Center of Mass Collision Energy
Figure 3.15 Anomeric configuration differentiation for 1—>4 linked perethylated derivatives
105
Reproduced with permission of the copyright owner. Further reproduction prohibited without permission.
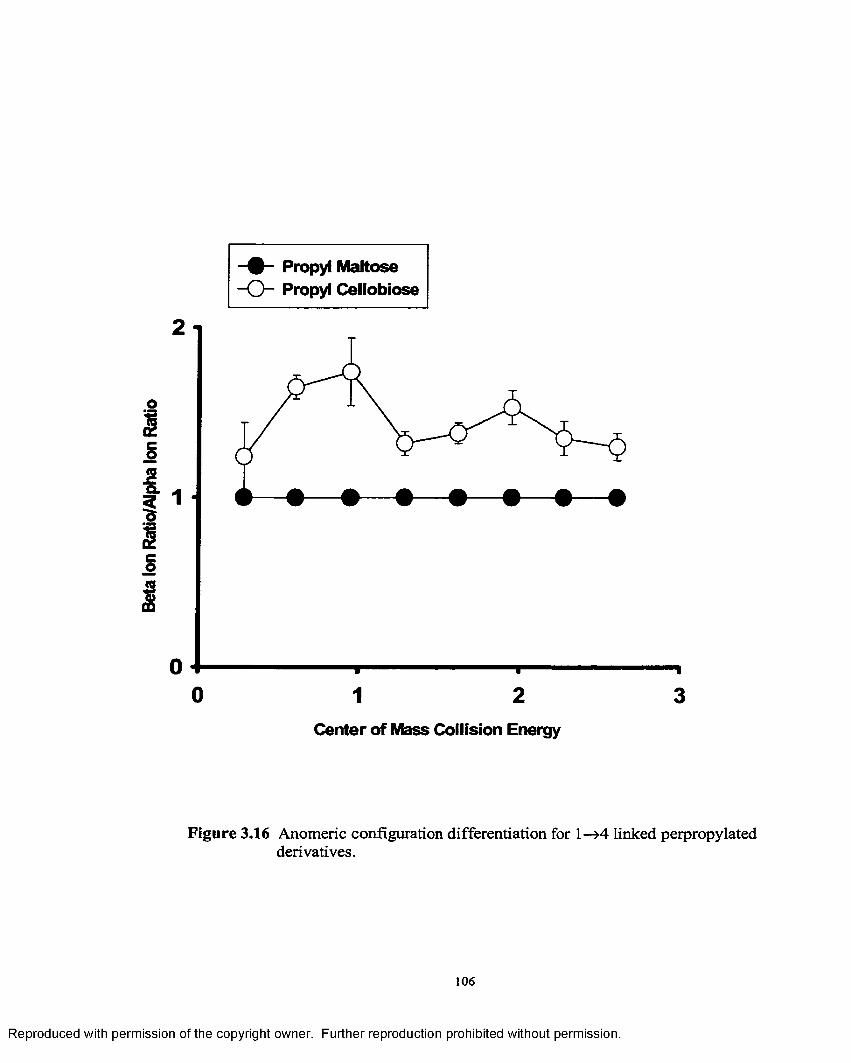
Beta
Ion Ra
tio/A
lpha
Ion Ra
tio
W Propyl M altose- O Propyl Cellobiose
Center of Mass Collision Energy
Figure 3.16 Anomeric configuration differentiation for 1—>4 linked perpropylated derivatives.
106
Reproduced with permission of the copyright owner. Further reproduction prohibited without permission.
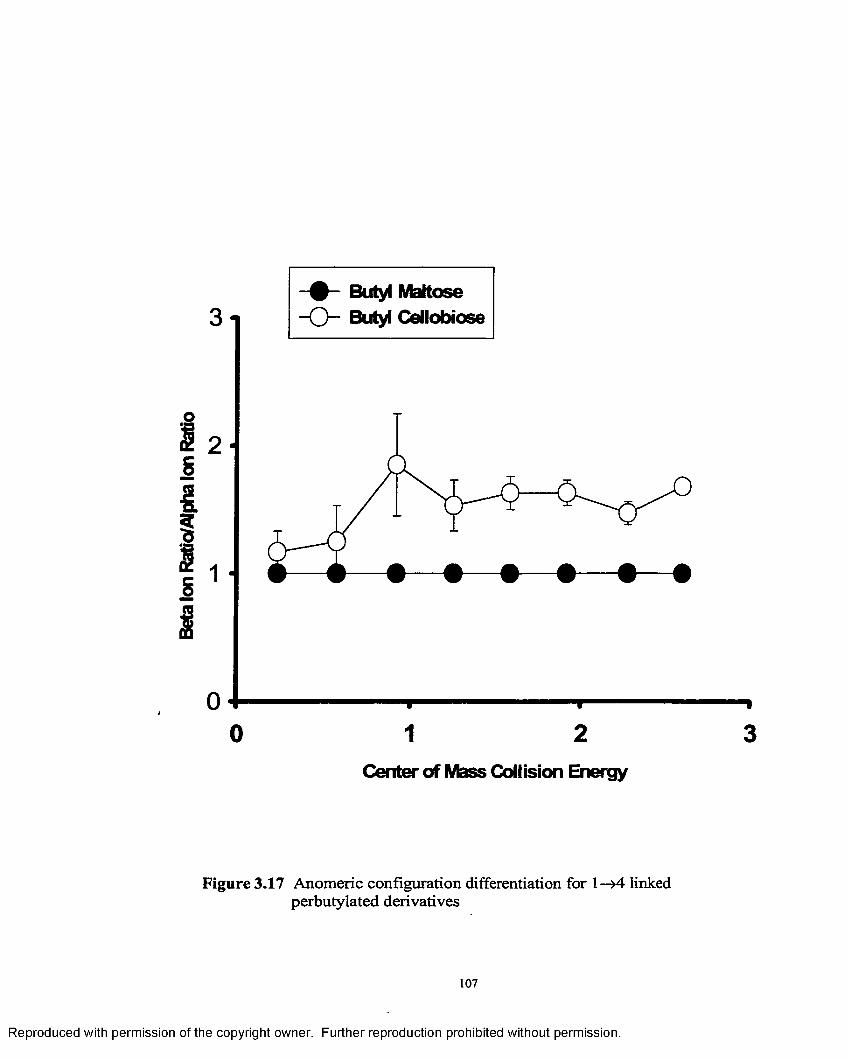
Beta
Ion
Ratio
/Alph
a Ion
Ra
tio
0
Butyl Maltose-Q - Butyl Cellobiose
nr
1f
2Center of Mass Collision Energy
Figure 3.17 Anomeric configuration differentiation for 1—>4 linked perbutylated derivatives
107
Reproduced with permission of the copyright owner. Further reproduction prohibited without permission.
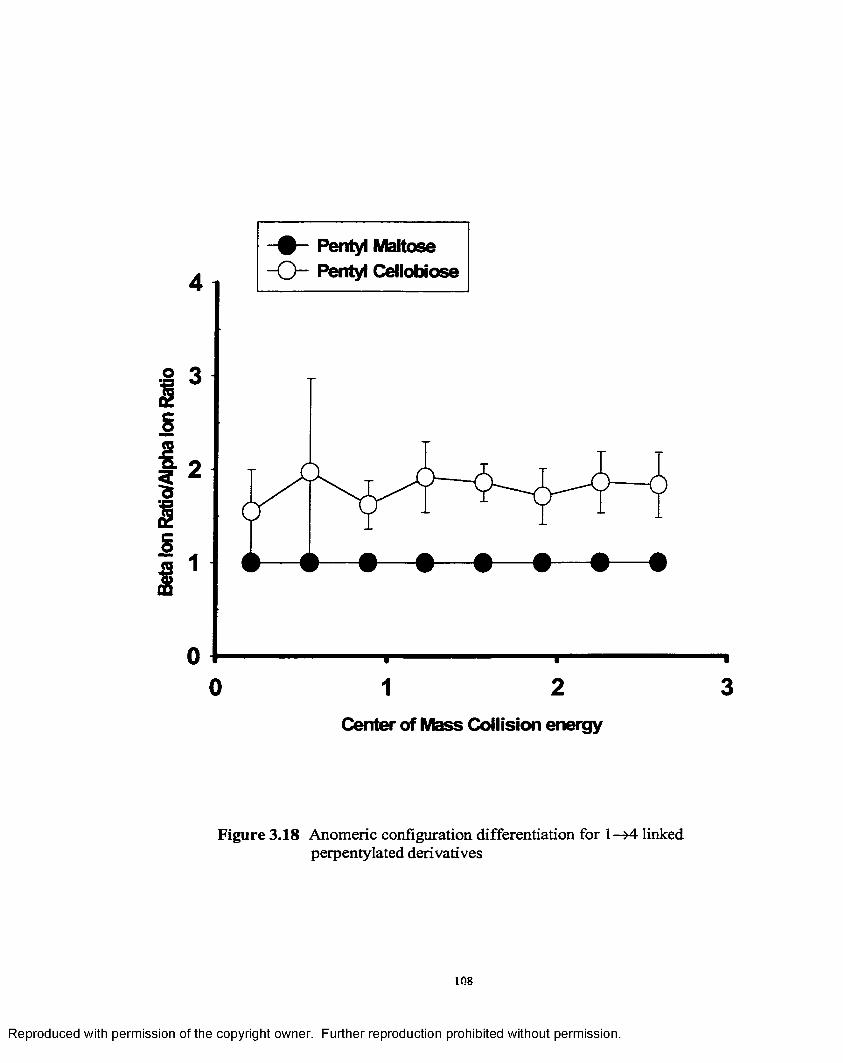
Beta
Ion
Ratio
/Alph
a Ion
Ra
tio
4
Pentyl Maltose—O - Pentyl Cellobiose
31 2Center of Mass Collision energy
Figure 3.18 Anomeric configuration differentiation for 1—>4 linked perpentylated derivatives
108
Reproduced with permission of the copyright owner. Further reproduction prohibited without permission.
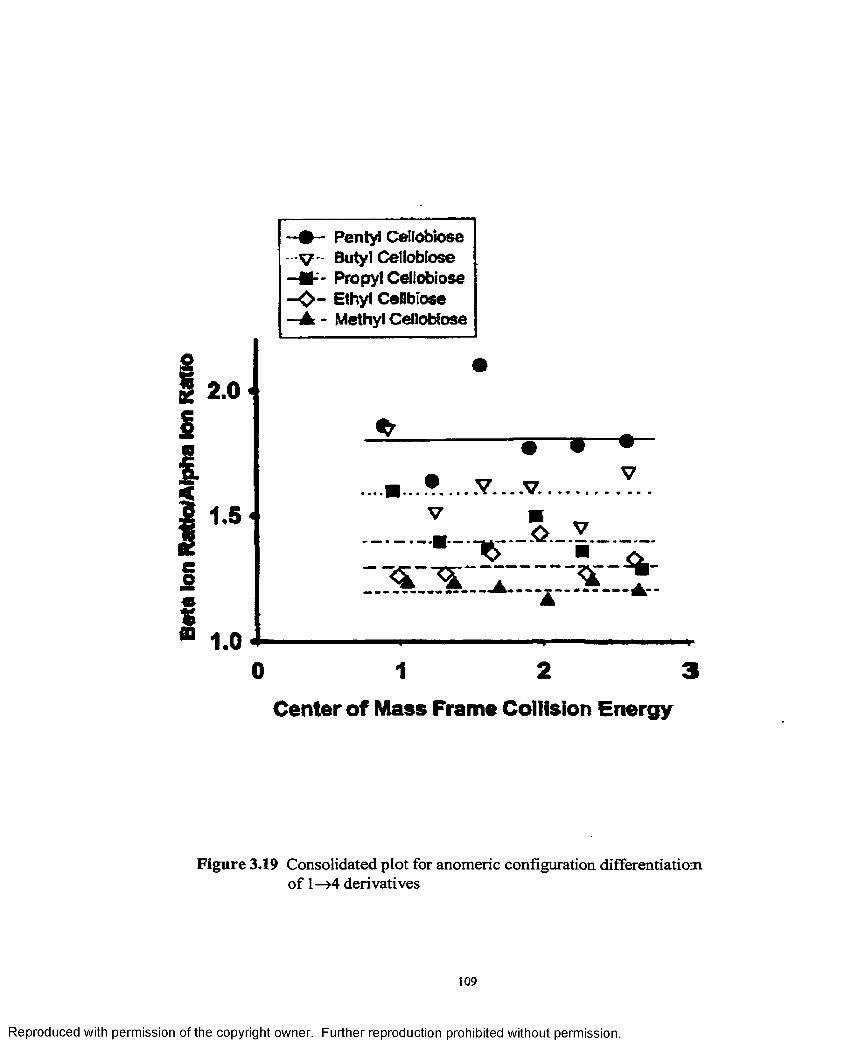
- Pentyl Cetlobiose V ' Butyl Celiobiose
— Propyl Celiobiose —O - Ethyl Cellblose —A - Methyl Celiobiose
2.0 «
1. 5 <
%« 1.0
■ v . .V ■ _- o V■_ TJ> a” '7r
0 1 2 3Center of Mass Frame Collision Energy
Figure 3.19 Consolidated plot for anomeric configuration differentiation of 1—>4 derivatives
109
Reproduced with permission of the copyright owner. Further reproduction prohibited without permission.
the pentylated derivative. The barriers to internal rotation and thus the
conformational freedom greatly depend on the location of substituents in
conformational space. Thus, as the size of the alkyl substituent is increased,
especially to the largest alkyl group, pentyl, the probability of neighbouring
pentyl groups occupying a close conformational space is much higher than for
methyl. With each molecule having a unique degree o f steric crowding, one of the
anomers in the two pentylated stereoisomers will have a much lesser degree of
freedom of motion than the other and thus a very different chemical free energy.
Low energy collision induced dissociation is able to reflect these differences in
free energy thus providing a greater discrimination for the pentylated anomers.
The differences in collisional cross-sections o f the particular conformation
undergoing cleavage for each of the ions o f the permethylated derivative anomers
might be very close. Thus the rate constant for dissociation of the glycosidic
bond will be very similar, which is indicated by the similar abundances of the
daughter ions and a small differentiation between the anomers. In contrast, for the
perpentylated derivatives the conformation of the individual anomers undergoing
cleavage might possibly have vastly different collision cross-sections allowing
one anomer to undergo a more frequent collision with the target gas molecule, and
thus a higher rate constant for glycosidic bond cleavage and formation of the
related fragment ions.
Another aspect which is evident from the plots is that the beta anomer
consistently has a higher daughter to parent ion ratio (D/P) than the corresponding
alpha anomer in all the five pairs of the 1—>4 linkage isomer. A higher D/P ion
110
Reproduced with permission of the copyright owner. Further reproduction prohibited without permission.
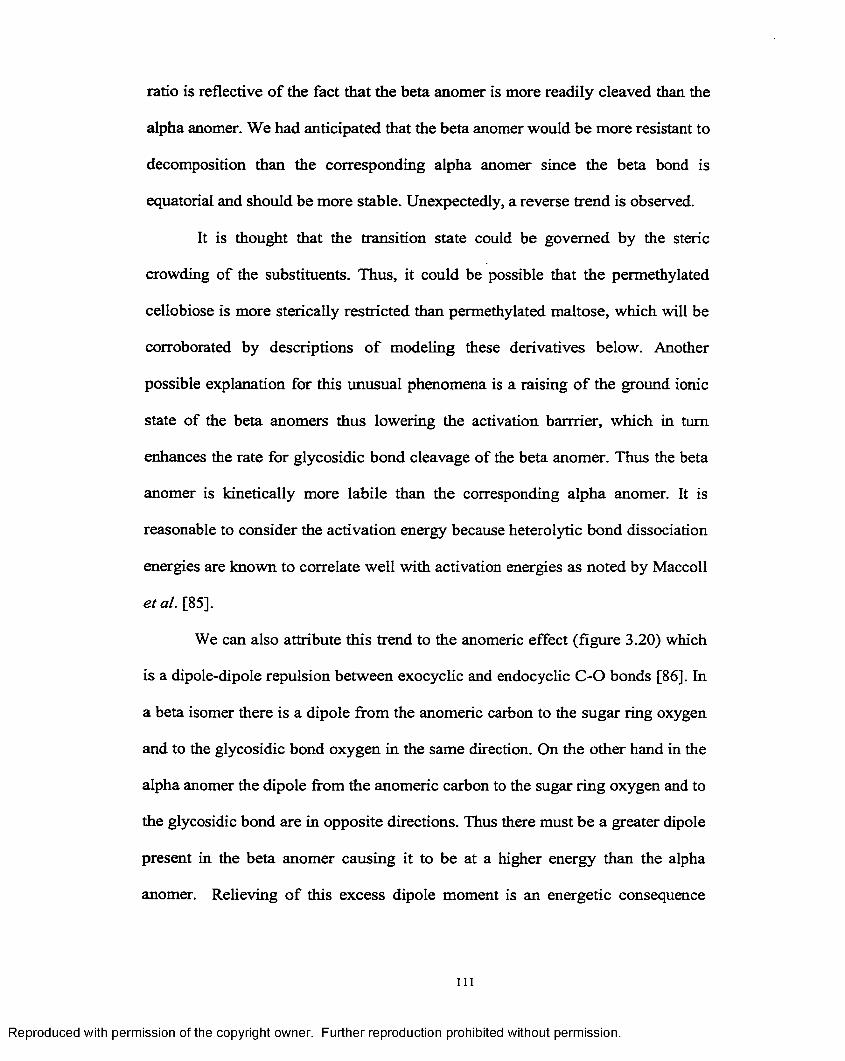
ratio is reflective o f the fact that the beta anomer is more readily cleaved than the
alpha anomer. We had anticipated that the beta anomer would be more resistant to
decomposition than the corresponding alpha anomer since the beta bond is
equatorial and should be more stable. Unexpectedly, a reverse trend is observed.
It is thought that the transition state could be governed by the steric
crowding of the substituents. Thus, it could be possible that the permethylated
celiobiose is more sterically restricted than permethylated maltose, which will be
corroborated by descriptions o f modeling these derivatives below. Another
possible explanation for this unusual phenomena is a raising o f the ground ionic
state of the beta anomers thus lowering the activation barrrier, which in turn
enhances the rate for glycosidic bond cleavage of the beta anomer. Thus the beta
anomer is kinetically more labile than the corresponding alpha anomer. It is
reasonable to consider the activation energy because heterolytic bond dissociation
energies are known to correlate well with activation energies as noted by Maccoll
eta l. [85].
We can also attribute this trend to the anomeric effect (figure 3.20) which
is a dipole-dipole repulsion between exocyclic and endocyclic C-O bonds [8 6 ]. In
a beta isomer there is a dipole from the anomeric carbon to the sugar ring oxygen
and to the glycosidic bond oxygen in the same direction. On the other hand in the
alpha anomer the dipole from the anomeric carbon to the sugar ring oxygen and to
the glycosidic bond are in opposite directions. Thus there must be a greater dipole
present in the beta anomer causing it to be at a higher energy than the alpha
anomer. Relieving o f this excess dipole moment is an energetic consequence
i l l
Reproduced with permission of the copyright owner. Further reproduction prohibited without permission.
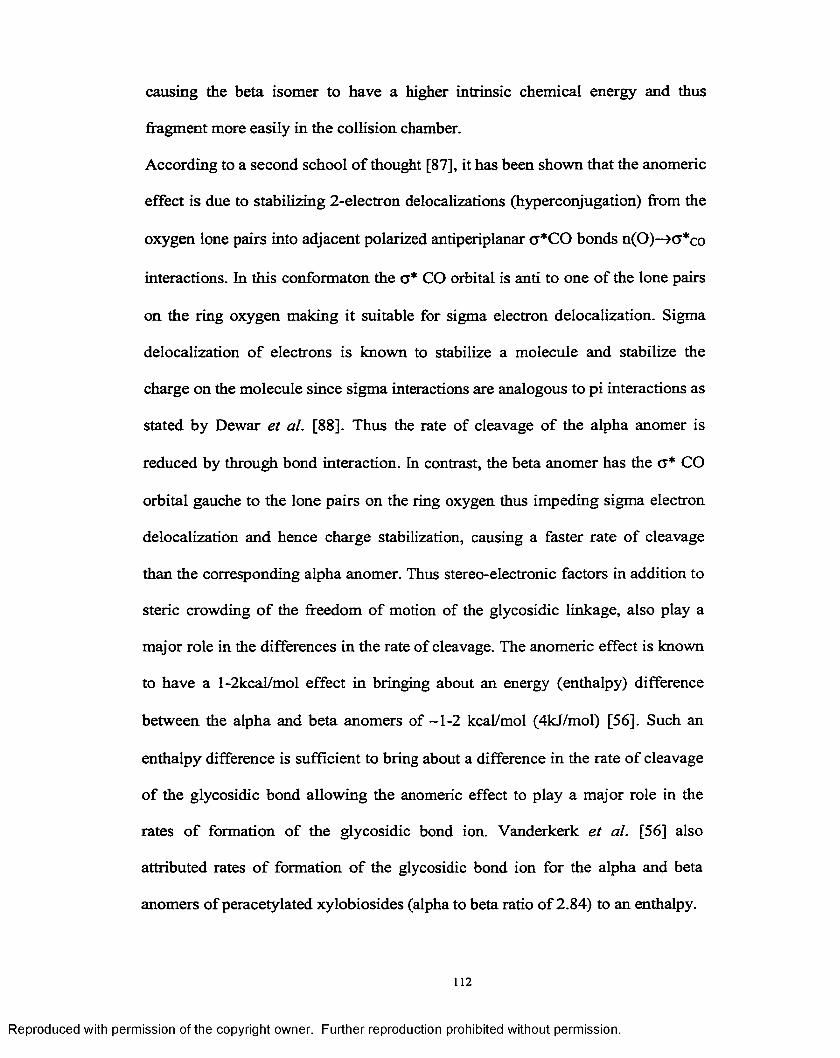
causing the beta isomer to have a higher intrinsic chemical energy and thus
fragment more easily in the collision chamber.
According to a second school o f thought [87], it has been shown that the anomeric
effect is due to stabilizing 2 -electron delocalizations (hyperconjugation) from the
oxygen lone pairs into adjacent polarized antiperiplanar <r*CO bonds n(O)—>a*co
interactions. In this conformaton the a* CO orbital is anti to one o f the lone pairs
on the ring oxygen making it suitable for sigma electron delocalization. Sigma
delocalization o f electrons is known to stabilize a molecule and stabilize the
charge on the molecule since sigma interactions are analogous to pi interactions as
stated by Dewar et al. [8 8 ]. Thus the rate of cleavage of the alpha anomer is
reduced by through bond interaction. In contrast, the beta anomer has the a* CO
orbital gauche to the lone pairs on the ring oxygen thus impeding sigma electron
delocalization and hence charge stabilization, causing a faster rate of cleavage
than the corresponding alpha anomer. Thus stereo-electronic factors in addition to
steric crowding o f the freedom o f motion of the glycosidic linkage, also play a
major role in the differences in the rate of cleavage. The anomeric effect is known
to have a l-2 kcal/mol effect in bringing about an energy (enthalpy) difference
between the alpha and beta anomers of ~l-2 kcal/mol (4kJ/mol) [56]. Such an
enthalpy difference is sufficient to bring about a difference in the rate of cleavage
of the glycosidic bond allowing the anomeric effect to play a major role in the
rates o f formation of the glycosidic bond ion. Vanderkerk et al. [56] also
attributed rates o f formation o f the glycosidic bond ion for the alpha and beta
anomers of peracetylated xylobiosides (alpha to beta ratio o f 2.84) to an enthalpy.
112
Reproduced with permission of the copyright owner. Further reproduction prohibited without permission.
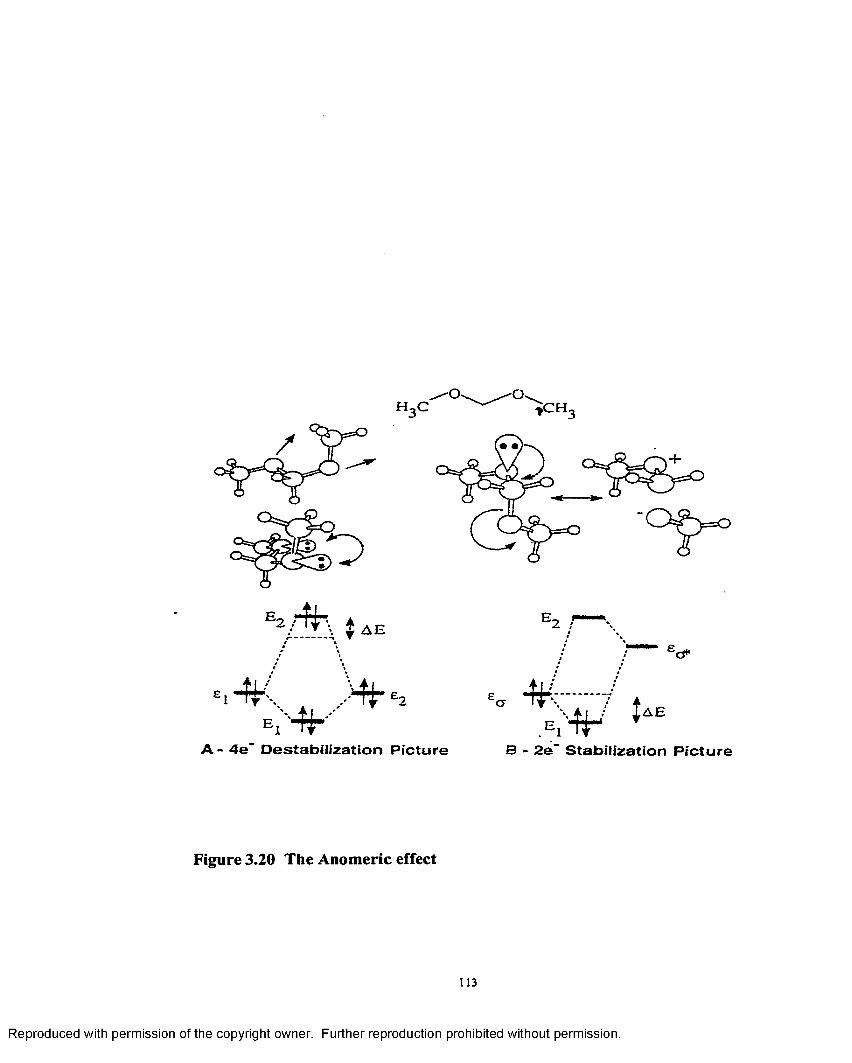
H3C'CX -o>
>CH3
X $ AE
\ a , T
e i ' 4 ^ - ' 'A - 4e" D estab iliza tion P icture
'2 /
4±4-
'O*
/ fe ; - 4 ^ : l i E
B - 2e~ S tab ilization P ictu re
Figure 3.20 The Anom eric effect
113
Reproduced with permission of the copyright owner. Further reproduction prohibited without permission.
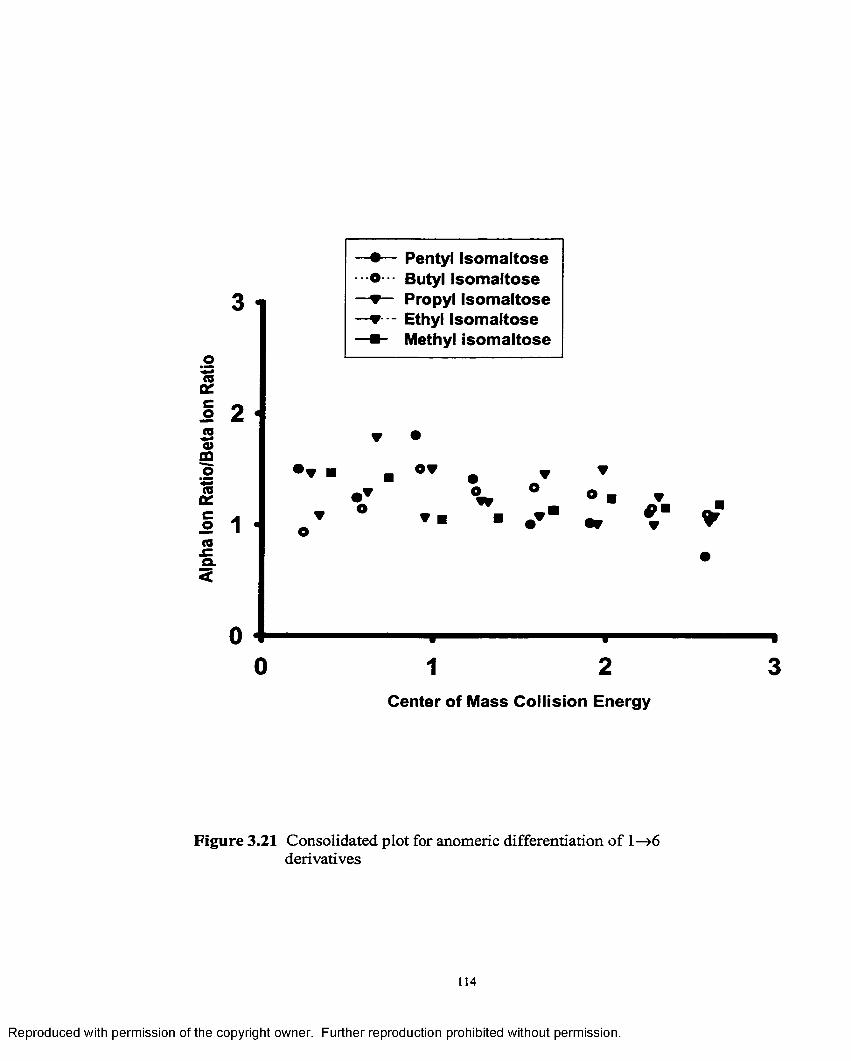
ra
I 2COO)co[5*<sCO0tO 1
CO
Pentyl Isom altose Butyl Isom altose Propyl Isom altose Ethyl Isom altose Methyl isom altose
■
o
o v
▼ ■
1 2Center of Mass Collision Energy
Figure 3.21 Consolidated plot for anomeric differentiation o f 1— > 6
derivatives
114
Reproduced with permission of the copyright owner. Further reproduction prohibited without permission.
difference o f 4kJ/mol. Thus, the 1—>4 daughter ion mass spectra o f the 1—>4
linkage anomers show ion abundances, which are characteristic of each anomer
1— » 6 Linkage Pair
The 1— > 6 derivatives, as shown in Fig. 3.21 which is a consolidated plot o f
the center of mass collision energy versus the alpha D/P ion ratio/beta D/P ion
ratio, exhibit little or no discrimination between the alpha and beta anomers for all
the five pairs o f derivatives.
The alpha anomer, if anything, has a marginally higher D/P ion ratio than the beta
anomer. The 1— > 6 derivatives have much more rotational freedom of motion
around the glycosidic bond than the corresponding 1—>4 derivatives. This is
validated by Cummings and Carver [89], in which the glycosidic linkages of
pyranose rings involving primary hydroxyls as in 1 —>6 linkages are known to be
much more flexible than linkages involving bonds to secondary hydroxyls groups
as in 1—>4 linkages. In 1—>6 linkages there is a three-bond rotation that diminishes
inter-residue interactions due to increased distance between the monosaccharide
sugar rings. French et al. [90] have demonstrated that both isomaltose and
gentiobiose prefer extended orientations in which the two rings are placed trans
relative to the 01-C 6’ bond. Therefore, both the anomers for all the different alkyl
derivatives are able to rotationally diffuse the collision energy obtained during the
collision event. Even though the steric crowding around the glycosidic bond
increases, especially as one goes to the pentylated derivatives, the conformational
freedom of the molecule predominates over the hindrance provided by the steric
bulk of the molecule precluding any sort of discrimination in all the 1 — > 6
115
Reproduced with permission of the copyright owner. Further reproduction prohibited without permission.
anomeric pairs. In comparison the 1—>4 linkage derivatives are more sterically
hindered due to two-bond rotation between the monomeric residues allowing
greater inter-residue interactions for the 1—>4 derivatives. Further, the orientations
o f the two anomers towards the colliding molecule might be more similar so that
they both receive an equal amount of kinetic energy that is converted to a
corresponding equal amount of internal energy. Since the amount of internal
energy acquired during a collision is related to structure, as stated before, with the
only differences in structure being the anomeric configuration of the glycosidic
bond, no discernment of the glycosidic bond configuration is possible for all the
1 — > 6 derivatives. We have stated above that the alpha anomer might possibly
have a higher D/P ion ratio than the corresponding beta if there is any
discrimination in the 1— > 6 linkage anomers at all. This could be rationalized by
invoking the exo-anomeric phenomenon [91,92] in which the electron density of
the lone pair o f the exocyclic oxygen atom is transferred to the anti bonding
orbital of the endocyclic C-O bond. Essentially this effect is maximized when the
p orbital for the unshared pair o f electrons is anti-periplanar to the C-l ring
oxygen. There are two conformations for the equatorially substituted anomer in
comparison to only one for the axially substituted one that are stabilized by the
exo-anomeric effect. This causes it to have a marginally lower D/P ion ratio than
the corresponding alpha anomer. Dowd and French [90] have located minima
having § values between —18° and -46° for isomaltose in conformity with the exo-
anomeric effect.
Reproduced with permission of the copyright owner. Further reproduction prohibited without permission.
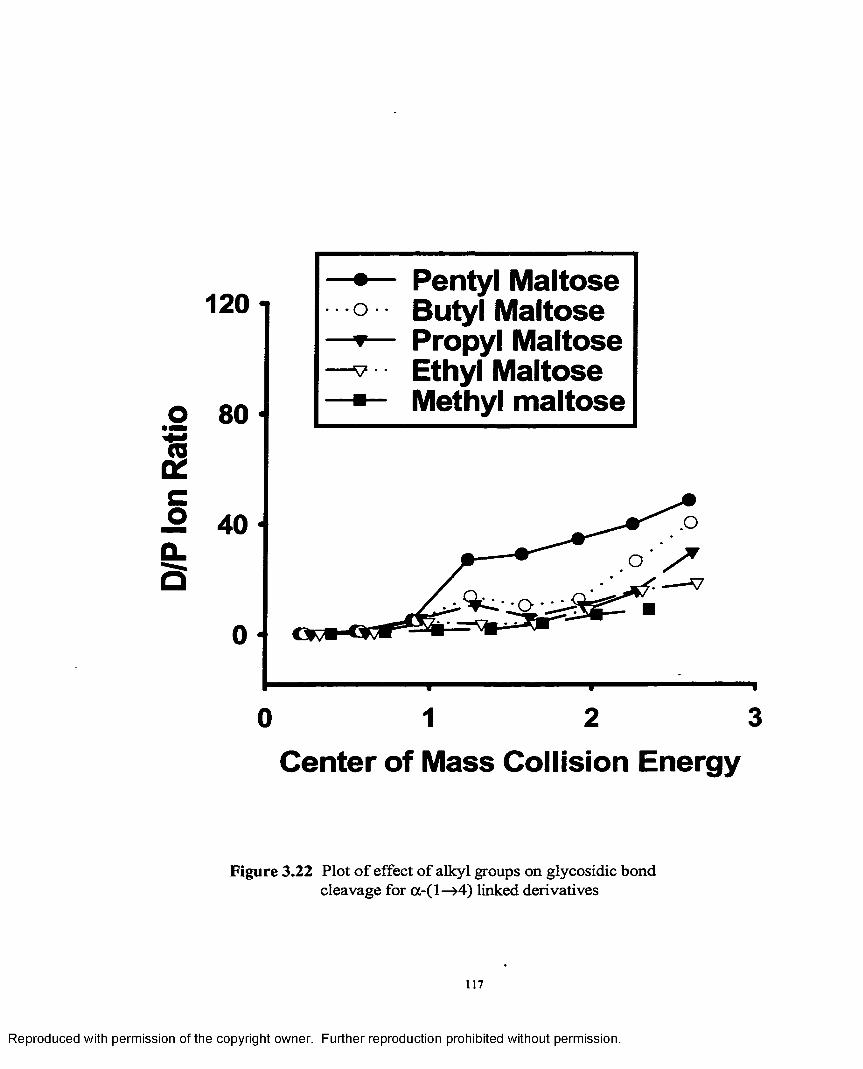
D/P
Ion
Rat
io
— Pentyl Maltose Butyl Maltose
— Propyl Maltose Ethyl Maltose
— Methyl maltose
120 i
80 •
40 -
o - ^
31 20
Center of Mass Collision Energy
Figure 3.22 Plot o f effect of alkyl groups on glycosidic bond cleavage for a - ( l—>4) linked derivatives
117
Reproduced with permission of the copyright owner. Further reproduction prohibited without permission.
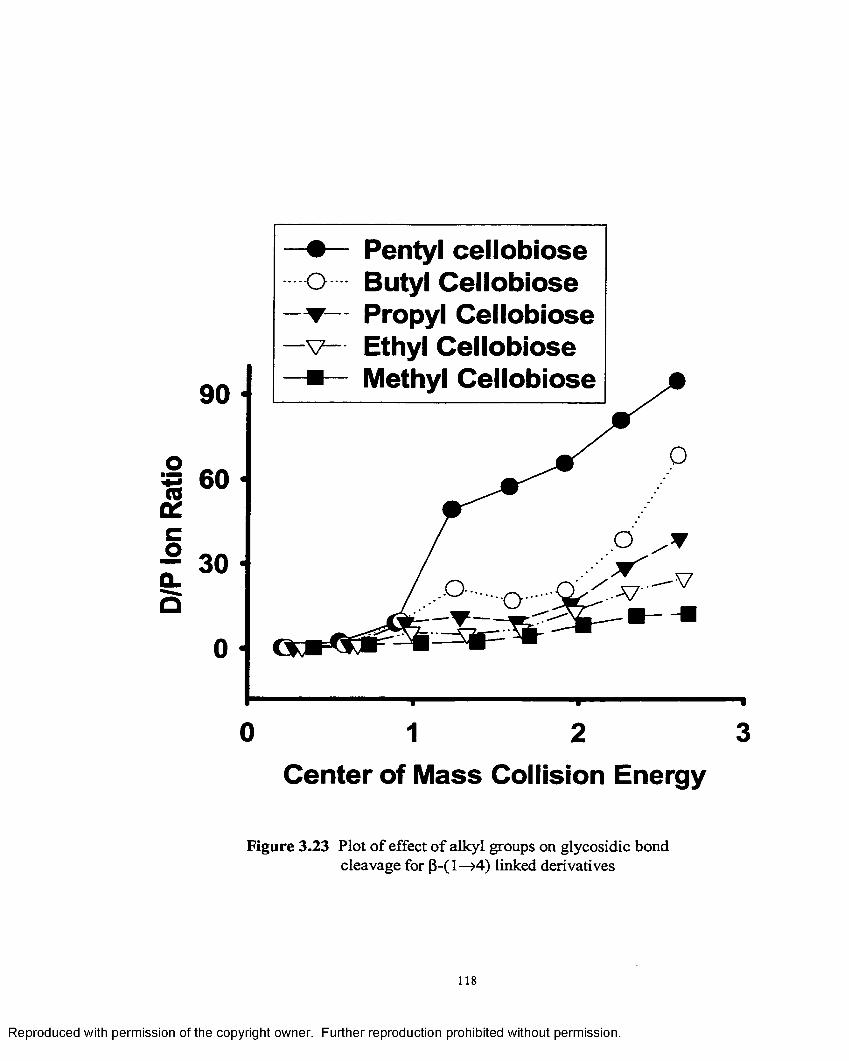
D/P
Ion
Ratio
9 0
60
30 •
Pentyl celiobiose o Butyl Celiobiose ▼— Propyl Celiobiose -v- Ethyl Celiobiose
Methyl Celiobiose
0 1 2 3Center of Mass Collision Energy
Figure 3.23 Plot of effect of alkyl groups on glycosidic bond cleavage for p -( l—>4) linked derivatives
118
Reproduced with permission of the copyright owner. Further reproduction prohibited without permission.
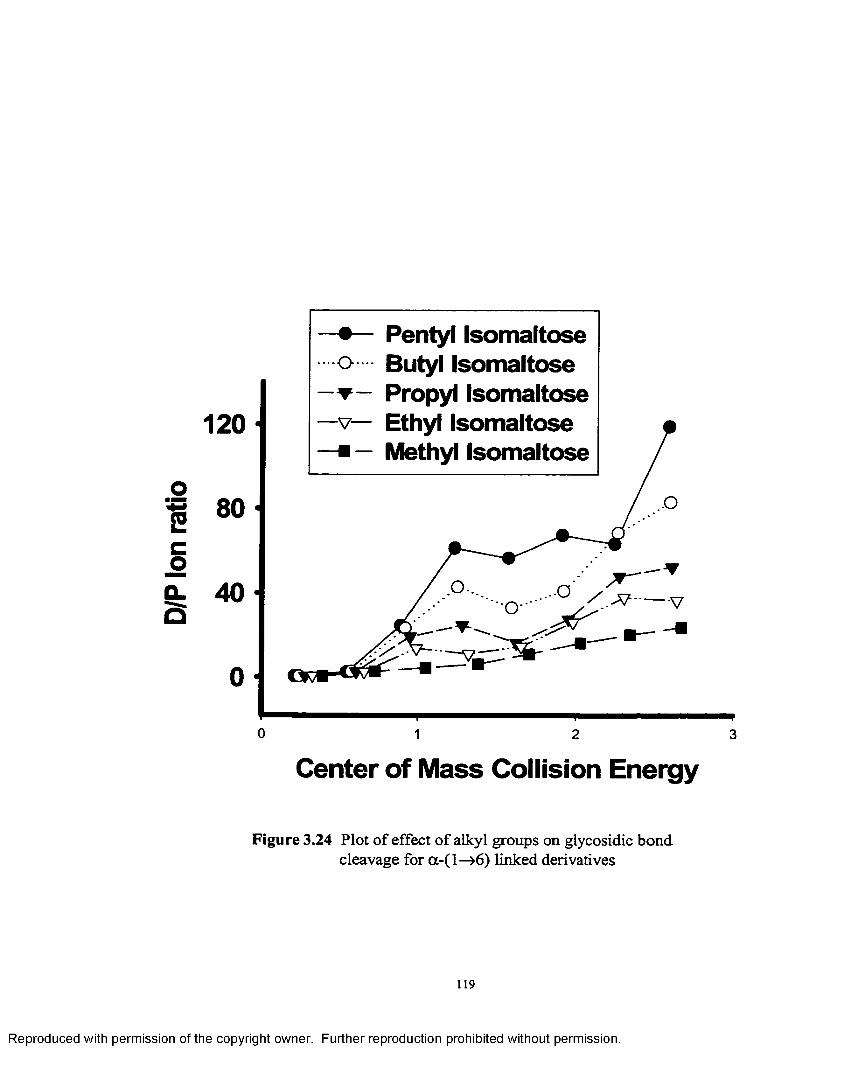
D/P
Ion
ratio
1 2 0
80
40
- o - -
-v—
Pentyl Isomaltose Butyl Isomaltose Propyl Isomaltose Ethyl Isomaltose Methyl Isomaltose
Center of Mass Collision Energy
Figure 3.24 Plot of effect of alkyl groups on glycosidic bond cleavage for a - ( l—>6 ) linked derivatives
119
Reproduced with permission of the copyright owner. Further reproduction prohibited without permission.
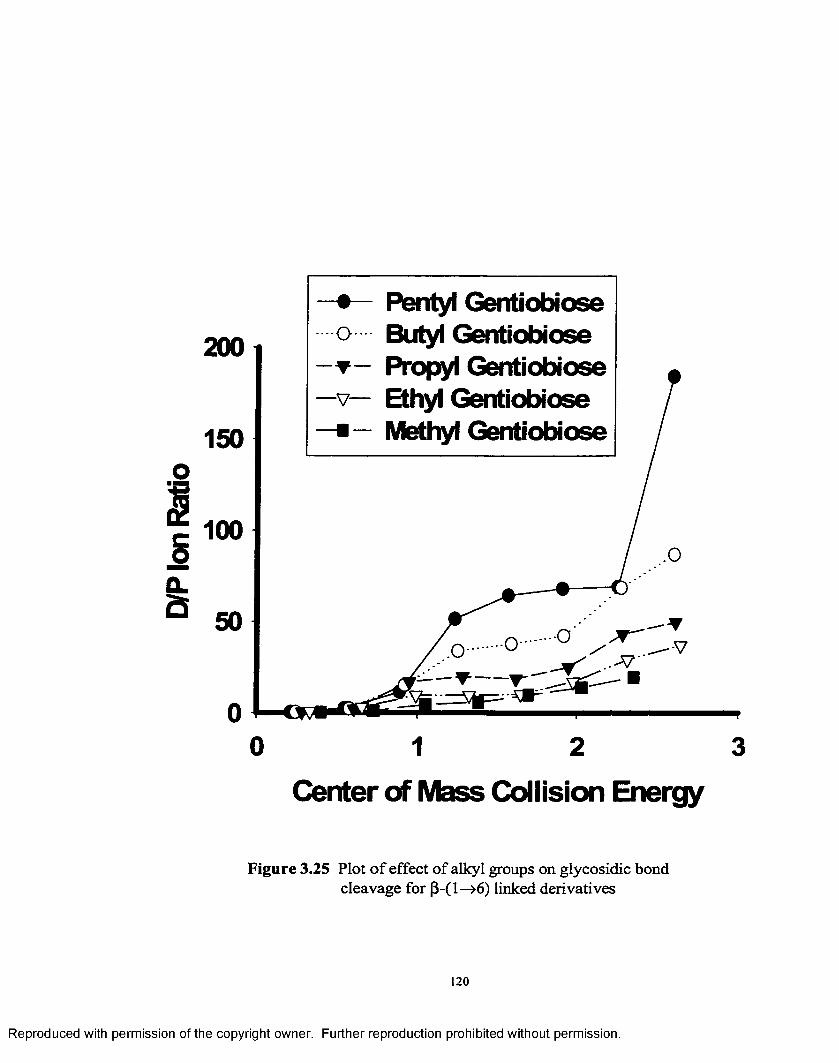
D/P
Ion
Ratio
2 0 0
150
100
50
o -
- V -
Fentyl Gentiobiose Butyl Gentiobiose Propyl Gentiobiose Ethyl Gentiobiose Methyl Gentiobiose
1 2 Center of Mass Collision Energy
Figure 3.25 Plot o f effect of alkyl groups on glycosidic bond cleavage for (3-(l—>6 ) linked derivatives
120
Reproduced with permission of the copyright owner. Further reproduction prohibited without permission.
Effect o f the Size of the Alkyl Group on Glycosidic Bond Cleavage
Figures 3.22-3.25 are plots showing the daughter to parent ion ratios
versus the collision offset voltage for the methylated to pentylated 1 —>4 and 1 — > 6
linkage anomers. These plots indicate that the stability of the derivatives
decreases in the order of methyl> ethyl> propyl> butyl> pentyl. This trend is
attributed to a gradation in crowding by alkyl groups with the larger alkyl
disaccharide derivatives dissociating faster to relieve additional steric strain and to
relieve the extra torsional strain. Substitution by smaller alkyl group can more
efficiently dissipate acquired energy by intramolecular vibrational-rotational
energy redistribution because the rotational barrier is not as high as the higher
derivatives thus the allowable number o f rotamers is larger.
Dissociation pathways can be described in terms o f coupling of molecular
vibrations. When the number o f rotamers is large there is a greater number of
vibrational states that can couple and dissipate the energy. Even though the
number of vibrational modes is increased by an increase in the number of
methylenes and they are able to explore more states, the pentylated derivatives are
unable to dissipate the internal energy as freely as the methylated derivatives
among these excess vibrational modes. This is due to the large hindrance in
rotation. Cleavage of the glycosidic bond will therefore be favored because of the
predominance o f a small number o f the total possible conformations of the
molecular ion that enables focusing o f the available energy on the glycosidic
bond. Thus, attaining the transition state will reduce the number o f free rotamers
because o f an enhanced rotational barrier. The normal and bend vibrational modes
121
Reproduced with permission of the copyright owner. Further reproduction prohibited without permission.
and rotational modes connected to these “frozen” rotamers as a result become
inaccessible.
Since some o f the rotamers are “frozen” for the higher derivatives the
transition state leading to the cleavage products must be more ordered with a
reduced entropy o f activation. In contrast, a smaller derivative like the
permethylated one will have a less ordered transition state with a higher entropy
of activation due to the higher number of available conformational states. The
formation of a conformationally flexible transition state will not lock up the free
rotations of the ion which will allow dissipation of the acquired collision energy
and thus slow down its rate o f cleavage in comparison to the perpentylated
derivative. If the difference in the rotational barrier between the permethylated
and perpentylated derivatives (presuming they have the same ground state energy)
were small enough it could preclude any predominance o f kinetic effects,
resulting in an enhanced rate of cleavage of the permethylated over the
perpentylated derivative. Thus cleavage of the perpentylated derivative is
statistically favored.
The permethylated derivatives might also be undergoing an enhanced
secondary rotation of the methyl side chain in comparison to the pentyl which
further reduces the steric interactions between the methyl side chains during
rotation of the glycosidic bond, and enhancing its freedom of motion. An
alternative explanation is that the different derivatives might be lying in different
ground state conformations as R varies. Also, as one goes to the higher alkyl
group derivatives there is an increase in the surface area o f the molecule
1 2 2
Reproduced with permission of the copyright owner. Further reproduction prohibited without permission.
enhancing the probability of collision with the target. This increased collision
cross-section increases the tendency for cleavage of the glycosidic bond.
It is also known that the general trend among alkyl ethers upon
protonation is a lengthening o f the O-CR bond with R=ethyl to pentyl by 0.14A0
and R=methyl 0.08 A0 [93]. This would cause a further increase of intramolecular
interaction o f alkyl groups steric crowd for the larger derivatives augmenting their
rates of glycosidic cleavage. The gas phase basicities and proton affinities o f alkyl
ethers are known to decrease with a decrease in size of an alkyl group [93]. Hence
a longer chain alkyl group which is more polarizable will stabilize the positive
charge better by an inductive effect than a methyl group. Thus the protonated
methyl ether group would be more easily eliminated than a corresponding pentyl
ether group since the electron donation from the sigma bond attached to the ring
would less effectively stabilize the protonated methyl ether. Hence the
perpentylated derivative would undergo a more facile cleavage at the glycosidic
bond and at a faster rate than the corresponding permethylated derivative which
would preferentially cleave to form a neutral methanol since the methyl ether is a
more likely location of the charge as compared to the glycosidic bond oxygen.
This is indicative from the higher abundances of the disaccharide ions formed for
the permethylated derivative by 3 consecutive losses of methanol in comparison
to the perpentylated derivative.
Modeling o f 1 —>4 Linkage Anomers Permethylated Maltose and Celiobiose
Computer modeling studies were undertaken for assessing the
conformational freedom of motion around the glycosidic bond for the anomeric
123
Reproduced with permission of the copyright owner. Further reproduction prohibited without permission.
pair of permethylated maltose and celiobiose. Chem-X was used to generate phi-
psi energy surfaces for 360° rotations in 2 0 ° increments about the <J> and vjr bonds.
162 starting structures were generated via a rules based search which enabled
talcing into account a limited number o f starting structures. The collision induced
dissociation experiments were carried out in vacuum, hence the modeling was
carried out without solvation effects.
The modeling studies supported the fragmentation ratios and hence the
degree of freedom o f motion observed under collision activation conditions in the
triple quadrupole mass spectrometer for both the anomers. Figure 3.26 and Figure
3.27 show the three dimensional energy wells o f permethylated maltose and
celiobiose, which are plots of <|>, \\f and energy that are derived from MM3
calculations with a lOkcal mol' 1 cut off above the minima. Permethylated
celiobiose exhibited a smaller volume o f 1.059e6 than its corresponding anomer
permethylated maltose which had a volume of 1.132e6. The exact values o f the
volume have arbitrary units and are computed by the Surfer program. The
volumes of the energy wells correspond to the conformational freedom o f motion
of the two monosaccharide sugar rings about the glycosidic bond. The freedom of
motion is correlated with the ability o f the molecule to dissipate the energy
obtained in the collision event. Thus permethylated maltose, which has a greater
volume, will dissipate the added collision energy amongst its internal modes more
easily than Permethylated Celiobiose and thus exhibits a greater stability in the
mass spectrometer. However, the values of the volumes are very close to each
other, which corroborates with the fragmentation ratios obtained in the mass
124
Reproduced with permission of the copyright owner. Further reproduction prohibited without permission.
spectrometer where a small discrimination is made between the two anomers due
to a very similar degree o f motional freedom.
Conclusions
Electrospray tandem masss spectrometry is a useful analytical approach
for obtaining structural information of derivatized disaccharides. This
methodology has the potential o f differentiating 1—>4 linkage anomeric pairs o f
disaccharides but not 1—>6 . Although further studies of model systems will be
required before this approach can be routinely used we believe that this
methodology will be very useful in understanding the complexities o f the
structural problems in carbohydrates.
References
1 Dwek, R. A. Chem Rev.(Washington DC) 1996, 96, 683
2. Varki, A.; Cummings, D. Essentials o f Glycobiology, Academic Press, 1998
3. Laine, R.A. Pure and Appl. Chem. 1997, 69, 1867
4. Laine, R.A. Glycobiology 1994, 6 , 759
5. Edge,C.J.; Rademacher, T.W.; Wormald, M.R.; Parekh, R.B.; Dwek, R.A. Proc. Natl. Acad.Sci.USA 1992, 89, 6338
6 . Matheson, N.K.; Mcleary, B.V. The Polysaccharides , Vol. 3 Aspinall, G; Academic Press , New York, 1985, ppl
7. Lee, E.Y.C.; Wheelam, W.J. Arch. Biochem. Biophys. 1966, 116, 162
8 . Li, Y.T.; Li, S.C. Methods in Carbohydrate Chemistry ed. (R.L. Whistler and J.N. Bemiller) Vol. 7, pp221, Academic Press, New York, 1976
9. Aspinall, G.O. J. Biological Chemistry 1977,49,1105
10. Barry, V.C.; McCormick, J.E.; Mitchell, P. W. D. J. Chem. Soc. 1954, 3692
125
Reproduced with permission of the copyright owner. Further reproduction prohibited without permission.
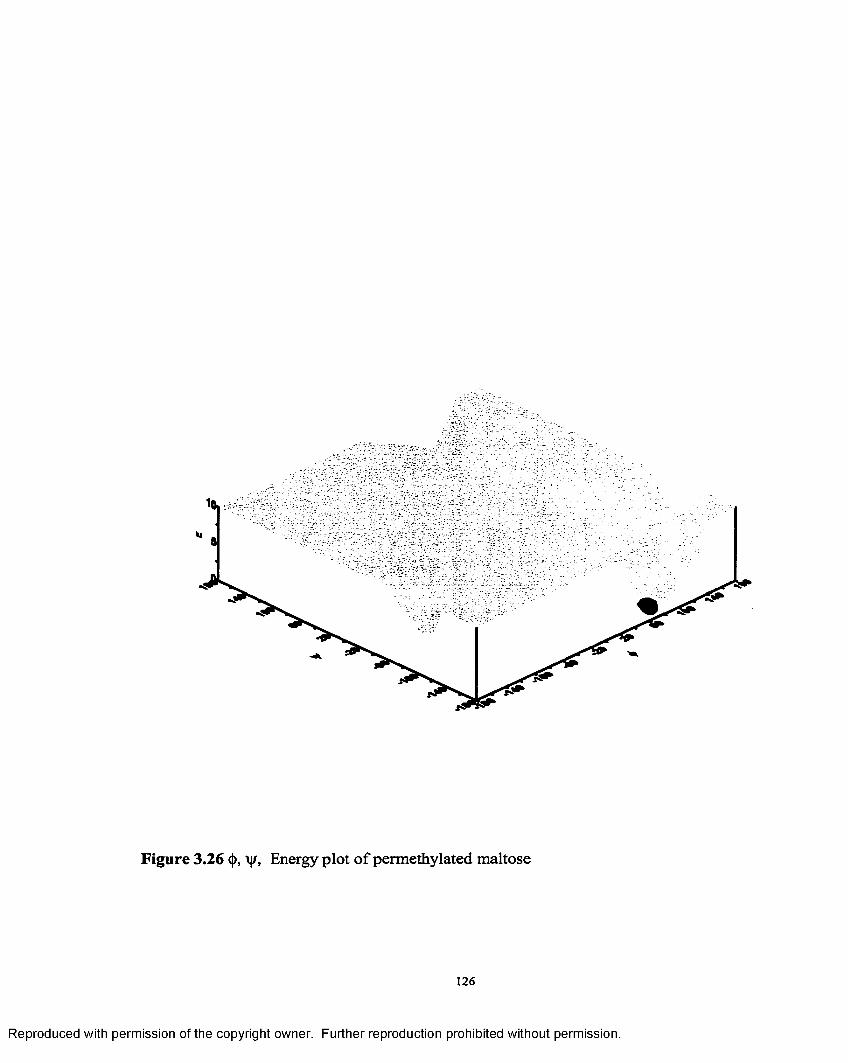
Figure 3.26 <|>, \\f, Energy plot o f permethylated maltose
126
Reproduced with permission of the copyright owner. Further reproduction prohibited without permission.
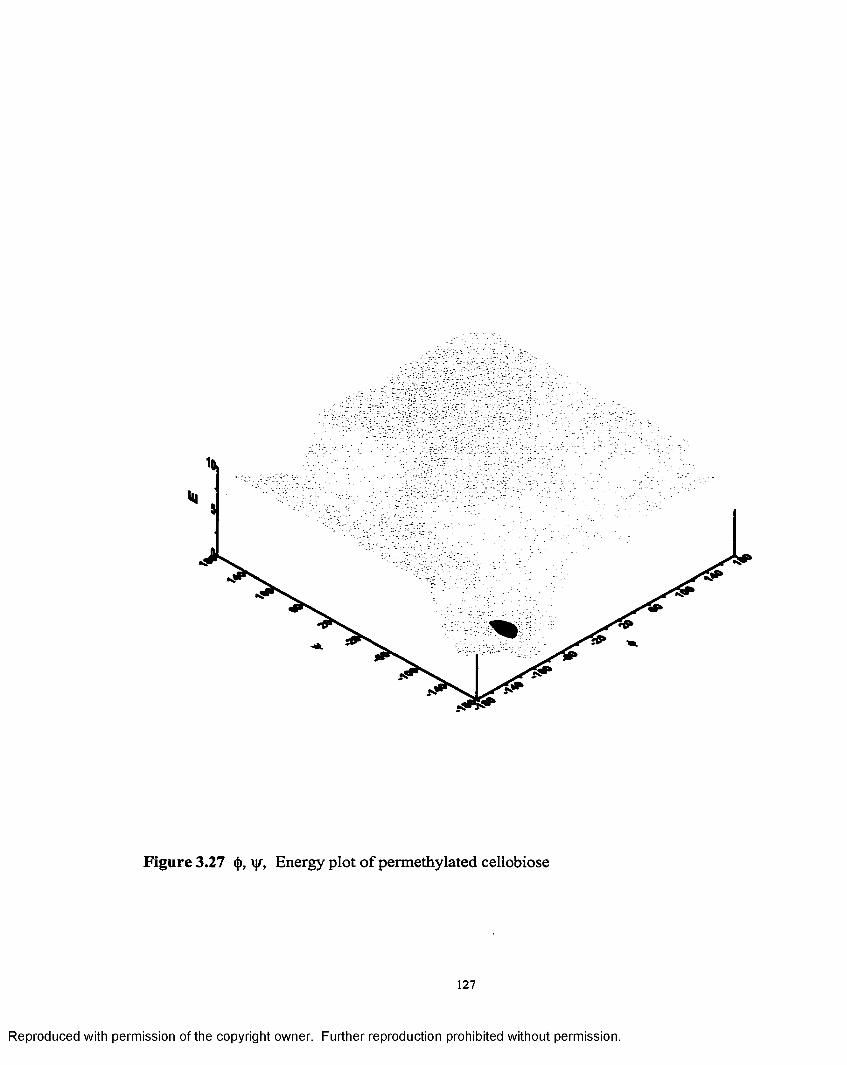
Hi
Figure 3.27 <J), \jr, Energy plot of permethylated celiobiose
127
Reproduced with permission of the copyright owner. Further reproduction prohibited without permission.
References
1 Dwek, R. A. Chem Rev. (Washington DC) 1996, 96, 683
2. Varki, A.; Cummings, D. Essentials o f Glycobiology, Academic Press, 1998
3. Laine, R.A. Pure and Appl. Chem. 1997, 69, 1867
4. Laine, R.A. Glycobiology 1994, 6 , 759
5. Edge,C.J.; Rademacher, T.W.; Wormald, M.R.; Parekh, R.B.; Dwek, R.A. Proc. Natl. Acad.Sci.USA 1992,89,6338
6 . Matheson, N.K.; Mcleary, B.V. The Polysaccharides , Vol. 3 Aspinall, G ; Academic Press , New York, 1985, ppl
7. Lee, E.Y.C.; Wheelam, W J. Arch. Biochem. Biophys. 1966, 116, 162
8 . Li, Y.T.; Li, S.C. Methods in Carbohydrate Chemistry ed. (R.L. Whistl<er and J.N. Bemiller) Vol. 7, pp221, Academic Press, New York, 1976
9. Aspinall, G.O. J. Biological Chemistry 1977,49, 1105
10. Barry, V.C.; McCormick, J.E.; Mitchell, P. W. D. J. Chem. Soc. 1954, 3692
11. Goldstein, I.J.; Hay, G.W.; Lewis, B.A.; Smith, F. Methods in Carbohydrate Chemistry, Vol. 5. (ed. R.L. Whistler) pp361, Academic press, New Yo*rk
12. Angel, A.S.; Nilsson, B. Methods in Enzymology Vol. 193 1990 pp 587
13. Hakomori, S. J. Biochem.(Tokyo) 1964,55,205
14. Bjomdal, H.; Lindberg, B.; Svensson S. Acta Chem. Scan. 1967, 21, 1801
15. Bjomdal, H.; Lindberg, B.; Svensson, S. Carb. Res. 1967, 5,433
16. Bjondal, H.; Lindberg, B.; Svensson, S.; Holme, T.; Lindberg, A.A. Carb. Res. 1968, 8,4317
17. Bjomdal, H.; Hellerqvist, C.G.; Lindberg, B.; Svensson, S Agnew Chem. 1979, 82, 643
18.Lindberg, B.; Lonngren, J. Methods in Carbohydrate Chemistry (ed. R.L.Whistler and J.N. Bemiller), Vol. 7, ppl42, Academic Press, New York, 1976
19. Angyal, S.J.; James, K. Australian Journal o f Chemistry 1970,23, 1209*
128
Reproduced with permission of the copyright owner. Further reproduction prohibited without permission.
20. Halbeek, H.V. Curr. Opin. Stru. Biol. 1994,4, 697
21. Bush, C.A. Curr. Opin. Stru. Biol. 1992,2, 655
22. Carver, J. Curr. Opin. Stru. Biol. 1991, 1,716
23. Bush, C.A. Biophys. J. 1994, 6 6 , 1267,
24. Reinhold, B.B.; Chen, S.Y.; Chen, S.; Reinhold, V.N. Org. Mass Spectrom. 1994, 29, 736
25. Harvey, D.J.; Naven, T.P.; Karter, B. Bio. Chem. Soc. Trans. 1996,24, 905
26. Orlando, R.; Bush, A.; Fenselau, C.A. Biomed. Environ. Mass Spec. 1990, 19, 747
27. Stahl, B.; Steup, M.; Karas, M.; Hillenkamp, F. Anal. Chem. 1991, 63, 1463
28. Yost, R.A., Enke, C.G. Anal. Chem. 1979, 51, 1251A
29. Albersheim, P.; Nevins, D.J.; English, P.D.; Karr, A. Carb Res 1967, 5, 340,
30. Sweely, C.C.; Bentley, R.; Makita, M.; Wells, W.W. J. Am. Chem. Soc. 1963, 85, 2497
31. Sawardekar, J.S.; Sloneker, J.H.; Jeanes, A.R. Anal. Chem. 1965, 37, 1602
32. Golovkina, L.S.; Chizhov, O.S.; Wultson, U.S. Bull. Acad. Sci, USSR 1966, 11,1853
33. Poulter, L.; Earnest, J.P.; Stroud, R.M.; Burlingame, A.L. Proc. Natl. Acad. Sci. U.S.A. 1989 , 86, 6645
34. Lindberg, B.; Longren, J. Methods in Enzymol. Vol. 50 [1]
35. Svensson, S. Methods in Enzymol. Vol. 50 [2]
36. Valent, B.S.; Darvill, A.G.; Mcneil, M.; Robertson B.K.; Albersheim, P. Carb Res. 1980,79,165
37. Samuelson, B.E.; Pimlott, W.; Karlsson, K.A. Methods in Enzymol. 1990, 193, 623
38. Hellerqvist, C.G. Methods in Enzymol. 1990,193, 554
39. Gray, G.R. Methods in Enzymol. 1990, 193, 573
129
Reproduced with permission of the copyright owner. Further reproduction prohibited without permission.
40. Laine, R.A.; Pamidimukkala, K.; French, A.D.; Hall, R.W.; Abbas, S.A.; Jain, R.K.; Matta, K.L. J. Am. Chem. Soc. 1988, 110, 6931
41. Laine, R.A.; Yoon, E.; Mahier, T. J.; Abbas, S. A.; Lappe, B.de; Jain, R.K.; Matta, K.L. Biol. Mass Spectrom. 1991, 20, 505
42. Yoon, E.; Laine, R.A. Biol. Mass Spectrom. 1992, 21, 479
43. Splitter, J.S.; Turecek, F., ed. Applications o f Mass Spectrometry to Organic Stereochemistry VCH Publishers: New York, 1994
44. Finnan, P.A.; Reed, R.I.; Sneedon, W. Chem. Ind. (London) 1958, 1172
45. Heyns, K.; Scharmann, H. Tetrahedron 1965, 21, 507
46. Vink, J.; Ridder, J.J.; Kamerling, J.P.; Vliengenthart, F. Biochem. Biophys. Res. Comm. 1971, 42, 1050
47. M urata,T.; Takahashi, S. Carb Res. 1977, 56, 239
48. De Jong, E. G.; Heerma, W.; Sicherer, C. A. Biomed. Mass Spectrom. 1979, 8 , 242
49. De Jong, E.G.; Heerma, W.; Dijkatra, G. Biomedical Mass Spectrom 1980, 7,
50 Domon , B.; Richter, W .J .; Blum,W; Schlunegger, U.P.; Senn M Tandem Mass Spectrometry, ed. F. W. Mclafferty, Wiley, New York, 1983, pp 417
51 Muller, D.R.; Domon, B.; Blum, W.; Raschdorf, F.; Richter, W.J. Biomed. Environ. Mass Spectrom. 1988, 15, 441
52 Domon B.; Muller, D.R.; Richter,W.J. Org. Mass Spectrom. 1989, 24, 357,
53 Domon, B.; Muller, D.R.; Richter, W.J. Int. Journal Mass Spectrom. and Ion Proc. 1990, 100,301
54 Khoo, K.H.; Dell, A. Glycobiology 1990, 1, 83
55. Smith, G.; Leary, J. A. J. Am. Soc. Mass Spectrom. 1996, 7, 953
56. Van der Kerk, S.M.; Blok-Tip, L.; Kerk-van Hoof, A.V.; Heerma, W.; Haverkamp, J. Int. Journal Mass Spectrom. and Ion Proc. 1994, 134, 41
57. Brakta, M.; Chaguir, B.; Sinou D.; Banoub J.; Becchi, M. Org. Mass Spectrom 1992, 27, 331
130
Reproduced with permission of the copyright owner. Further reproduction prohibited without permission.
58. Brakta, M.; Sinou, D.; Banoub, J; Becchi, M. Org. Mass Spectrom. 1992,27, 621
59. Dallinga, J.W.; Heerma, W. Biol. Mass Spectrom. 1991,20,215
60. Mulroney, B.; Traeger, J.C.; Stone, B.A. J. Mass Spectrom. 1995, 30,1277
61. Li, D.T.; Her, G.R. J. Mass Spectrom. 1998,33, 644
62. Fangmark, I; Jansson, A.; Nilsson, B. Anal Chem. 1999, 71,1105,
63. Mulroney, B.; Peel, J. B.; Traeger, J.C. J. Mass Spectrom. 1999, 34, 856
64. Burlingame, A.L.; Boyd, R.K; Gaskell, S.J. Anal Chem. 1994, 6 6 ,634R
65. Reinhold, V.N.; Reinhold, B.B.; Costello, C.E. Anal. Chem. 1995, 65,1772
66. Ohasi,Y. Electrospray Ionization Mass Spectrometry, ed. Richard B. Cole, New York:John Wiley and sons, 1997
67. Mendonca, S.; Laine, R.A. In preparation
6 8 . Viseux, N.; Hoffmann, E. de; Domon, B. Anal Chem. 1997, 69, 3193
69. Karlsson, K.A. Glycolipid Methodology, American Oil Chemists Society, Champaign IL, 1976; pp 97
70. Reinhold, V.N. Methods in Enzymol. 1987, 138, 59,
71. Dell, A. Adv. Carbohydr. Chem. Biochem. 1987, 45, 19
72. Domon, B.; Costello, C.E. Glycoconjugate J. 1988, 5, 397
73. Cole, R.B.; Tabet, J.C.; Salles, C.; Jallageas, J.C.; Crouzet, J. Rapid Commun. Mass Spec. 1989,3, 59
74. Kochetkov, N.K.; Chizhov, O.S. Adv. Carbohydr. Chem. 1966, 21, 39
75. Dell, A. Adv. Carb. Chem. and Biochem. 1987, 45, 19
76. Hayes, R.N.; Gross, M.L.. Methods in Enzymol. Vol. 193, 237
77. Bernstein, R.B.; Levine, R.D. Molecular Reaction Dynamics, Clarendon Press, Oxford, 1974
78. Nystrom, J.A.; Bursey, M.M.; Hass, J.R. Int. J. Mass Spectrom. Ion Processes 1983/1984,55,263
131
Reproduced with permission of the copyright owner. Further reproduction prohibited without permission.
79. Schey, K.L.; Kenttamaa, H.I.; Wysocki, V.I.; Cooks, R.G. International Journal o fMass Spectrometry and Ion processes 1983, 90, 71
80. Mclafferty, F.W. Tandem Mass Spectromerty, John Wiley and sons, New York, 1983
81. Holmes, J.L. Organic Mass Spectrom. 1985,20,169
82. Busch, K.L.; Glish, G.L.; Mcluckey, S.A. Mass Spectrometry/Mass Spectrometry'. Techniques and Applications o f Tandem Mass Spectrometry' VCH publishers: New York 1988
83. Sasisekharaan, V. Stereochemical Criteria fo r Polypeptides and Proteins. Collagen, Proc Symp. Madras, India, 1962, Vol. 1960, pp39
84. Rao, V.S.R., Sundarajan, P.R., Ramakrishnan, C.; and Ramachandran, G. N. Conformations in Biopolymers. Academic Press, London, 1963, Vol. 2
85. MacColl, A. Chem. Rev. 1969, 69, 33,
8 6 . Lemieux, R.U.; Chu, N.J. Abstr. o f papers Am.Chem. Soc. 1958,133, 31N
87. Petillo, P.A. and Lemer, L.E. Origin and Quantitative Modeling o f Anomeric E ffect, Ch. 9
8 8 . Dewar, M.J.S. J. Amer. Chem. Soc. 1984, 106, 669,
89. Cummings, D. and Carver, J. Biophys. J. 1993, 6 6 , 1267
90. Dowd, M.K.; Reilly, P .J .; French, A.D. Bipolymers 1994,34, 625
91. Lemieux, R.U.; Pavia, A.A.; Martin, J.C.; Watanabe, K.A. Can. J. Chem. 1969 47, 4427
92. Lemieux, R.U.; Pavia, A.A.; Martin, J.C. Can. J. Chem. 1987, 65, 213
93. Blake, J.F. and Jorgenson, W.L. Journal o f Org. Chem. 1991, 56, 6052
132
Reproduced with permission of the copyright owner. Further reproduction prohibited without permission.
Chapter 4
Conformational Analysis of Permethylated Disaccharides Using MM3
Introduction
Mass spectrometry has been used to determine the various aspects of the primary
structure of carbohydrates namely sugar sequence, branching pattern, identification o f the
constituent monosaccharide units, molecular mass, ring size, anomeric configuration and
interglycosidic linkages. However, even with the advent o f new techniques like fast atom
bombarment (FAB) and electrospray (ESI) ionization, obtaining a good sensitivity for
underivatized sugars has been a daunting task. This is because of the weak acidity of the
hydroxyl protons and lack o f surface activity. Derivatization overcomes these problems
and allows mass spectrometric identification. Permethylated carbohydrates have been
especially useful in the field o f mass spectrometry. The first synthesis o f a permethylated
sugar was reported by Hakomori et al. [1] who adapted Cory’s methyl sulfinyl carbanion
reagent. Since then several approaches to their synthesis have been reported [2].
Electrospray-CID studies [3] were carried out on a series o f peralkylated
disaccharides with the intent to discriminate among the anomeric configuration. The
present modeling study is a conformational analyses of both the permethylated and native
two-bond linked glucose-glucose disaccharides to try to see if we could explain the
behavior of the permethylated disaccharides and understand their breakdown in the mass
spectrometer by determining their conformational freedom. This was discussed in
Chapter 3 with reference to permethylated maltose and cellobiose. A second objective of
interest is to see the effect o f the methyl groups on the energy surfaces. O f prime interest
is to see the effect of suppression o f the hydrogen bonds which are often present in the
133
Reproduced with permission of the copyright owner. Further reproduction prohibited without permission.
experimental crystal structures and computer models o f native disaccharides. A third
objective is to study the characteristics o f the energy surfaces for both the permethylated
and native disaccharides at one dielectric constant e=1.5. A comparison is made between
the minimum energy structures for the permethylated derivatives and between the
maps for the native disaccharides at e =1.5. For each particular native dimer a comparison
between the <|>-\|/ energy surfaces at three different dielectric constants is made.
Results from this study are valuable because the native and permethylated
disaccharides are the smallest building blocks o f analogous oligo- and polysaccharides.
The conformations are described by the degrees of rotation of the monomeric residue
about their bonds to the glycosidic oxygen atom as indicated by the value o f angles <j) and
\j/ as shown in Figure 3.1. The torsion angle referring to rotation about the glycosidic C-O
bond is denoted by <{>, and that for the O-C bond to the aglycon is denoted by \|r. The
energy for each combination can be plotted on a grid o f <(> and and the resulting
<])—\jr plots are called Ramachandran maps [4]. These energies can be calculated in various
ways. In this case we have used the molecular mechanics program MM3 developed by
Allinger et al. [5]. This is a highly detailed force field which in addition to the classical
terms, includes anisotropy o f hydrogens, corrections for stereoelectronic effects, cross
term effects like torsion stretch, torsion bend and bend-bend interactions that contribute
to the energy of a particular conformer, a Buckingham type potential for non-bonded
interactions and explicit terms for hydrogen bonding. MM3 has been used previously
with apparent success for many disaccharides [6,7].
Reproduced with permission of the copyright owner. Further reproduction prohibited without permission.
Brief Historical Perspective o f Disaccharide Modeling
Computerized molecular modeling of disaccharides has been carried out for
nearly 35 years [8 ]. In the mid 1960’s Ramachandran and coworkers [9] developed a
classic appproach for disaccharides. They computed the conformational energy of the
disaccharides as a function of <|) and \\r of the interglycosidic bond. In their calculations
they treated the atoms as incompressible spheres of a set diameter. In these initial studies,
such as one on amylose, the only variables were <J) and \|r, the sugar rings were not
allowed to change their internal coordinates [10]. The energy value reported included
only nonbonding and electrostatic terms. Since then Ramachandran maps have been used
extensively for conformational analysis of disaccharides. Rees and Skerrett [11]
performed conformational analyses o f cellobiose, cellulose and xylan by assuming the
ring conformations and C1-0-C4’ angle for each pair of residues to be fixed and
derivable from known crystal structures. They used three different potential energy
functions, as proposed by Liquori and coworkers [12], by Brant and Flory [13] and by
Kitaygorodsky [14] to calculate the conformational energies. Subsequently Rao and
coworkers [15,16] examined the a —linked disaccharides kojibiose, nigerose and maltose
and the p—linked disaccharides sophorose, laminaribiose, and cellobiose. First a contact
approach was used in which the energy was either 0 or ©°. Then potential energies for
generation o f the <{)—\|/ maps were computed by contributions from Van der Waal
interactions, hydrogen bonds, and torsional potentials. The maps showed that the
sterically allowed region is only 5% of the ({>—V|/ space indicating limited conformational
freedom. Rees and Scott [17] reported similar maps. Later Giacomini [18] carried out
semiempirical quantum mechanical calculations using the PCILO method.
135
Reproduced with permission of the copyright owner. Further reproduction prohibited without permission.
Several disaccharide-specific rigid residue programs like HSEA [19,20] and
PFOS [21] have been used for conformational analysis. These programs considered the
exo-anomeric effect. Brady and coworkers [22] performed a rigid rotation conformational
analysis on the disaccharide maltose that is the repeating unit o f amylose using a
CHARMM like energy function. That paper also had a relaxed-residue map. Several
other rigid rotation maps were published using other energy functions [23-26]. Rigid
residue methods have disadvantages in that inappropriately high energies are encountered
when traversing from one low-energy region to another. The high energies result because
pyranoid rings are not completely rigid. The internal degrees o f freedom of motion
should be allowed to relax for disaccharide molecules during rotation about the
glycosidic bond, lowering the conformational energy [27], Rigid maps depend on the
exact choice o f the starting model [21]. Also, important minima on the energy surface are
likely to be ignored since energies are high on most of the surface except near the starting
shape [28]. This limitation o f rigid residues does not exist in computational software
developed in the 1980’s for doing conformational analysis. Relaxed residue modeling
methods for generation o f the <()—y energy surfaces include force fields like CHARMM
[29], Amber [30], MM2CARB [21], CVFF [31], TRIPOS [32], MM3 [33].
Rasmussen and Melberg [34,35] presented the first relaxed residue
conformational analysis o f maltose [34] and cellobiose [35]. They found four minima
within 5 kcal/mol for maltose and five conformers within 3 kcal/mol for cellobiose using
the PEF300 force field program through energy minimization in which all internal
degrees o f freedom are allowed to relax. The calculations correlated with those carried
out by Tvaroska et al. [36,37]. However, not all o f (j)—\|f space was systematically
136
Reproduced with permission of the copyright owner. Further reproduction prohibited without permission.
searched and no attempt was made to find the global minimum. In a subsequent paper
Rasmussen [38] investigated the conformational flexibility o f the (3—(1—>6 ) linkage in [3-
gentiobiose using for the first time a newly optimized set o f potential energy functions
PEF9IL. The minimized coordinates from one grid point were used as the initial set for
the following grid point and no rigid rotations were performed when going from one grid
point to another letting the harmonic drag change the glycosidic conformation. Tvaroska
and Perez [39] carried out a conformational analysis on maltose and cellobiose using
MM2CARB, which demonstrated the variation of internal disaccharide geometry with
change o f conformation around the glycosidic linkage. Subsequently, Tvaroska and
Vaclavik [40] reported the conformational analysis of a,a-trehaIose, (3,|3-trehalose and
a,|3-trehalose to aid in understanding the anomeric and exo-anomeric effects.
Several papers compare the <f)—qr maps obtained by rigid residue and flexible
residue analysis. Brady [22] reports a comparison for sucrose using the CHARMM
parameters. French [41] et al. reports a similar comparison for cellobiose using MM2.
Tran [42] et al. reports a comparison for maltose using MM2 and MM2CARB energy
functions. Dowd et al. [43,44] later carried out more complete flexible residue
conformational analysis on the a —linked disaccharides maltose, kojibiose, and nigerose
and the (3-linked disaccharides sophorose, laminaribiose, and cellobiose using the MM3
force field. The a and (3 anomers were done separately, and as many as 24 combinations
of side group orientations were used in making the starting models. The maps illustrated
the importance of the exoanomeric effect and the linkage type in determining the
conformational flexibility of the respective disaccharides. In another paper [45] they
generated isoenergetic surfaces for the 1— > 6 dimers isomaltose and gentiobiose. These
137
Reproduced with permission of the copyright owner. Further reproduction prohibited without permission.
anomers showed a greater number o f low energy minima than the corresponding two-
bond linked structures. Different orientations of the hydroxyl hydrogens were considered
for each anomer. In some other papers they generated energy surfaces for the pyranosyl
rings of oc,a- oc, (3 and p,(3 trehalose [46] and analogues by MM3, and for the
disaccharides leucrose and turanose [47].
Relaxed potential energy surfaces have been computed for other disaccharides.
Tran [48] and Perez [49] have computed them for sucrose, Edge [50] and Perez [51] for
a - ( l—>2) linked mannobiose, Imberty [52] and Carver [53] for a ( l —>3) linked
mannobiose, Jimenez-Barbero [54] for (3(1—>4) linked mannobiose, Calub [55] for
inulobiose using MMP2(85) in which the fructofiiranose rings initially had the low-
energy 4 3T conformation that was retained except when the linkage conformations
created severe inter-residue conflicts, and Waterhouse [56] for levanbiose.
Methods
We used Chem-X and Sybyl to sketch and display structures. Molecular
mechanics energy surfaces o f the native and derivatized molecules were prepared using
MM3-96 [57], This force field compares favorably with other molecular mechanics force
fields [58,59]. The single exception appears to be sucrose, where difficulties with
adjacent anomeric centers appear to cause errors in the calculated energy [60,61]. Three
different dielectric constants (e) were used. The default dielectric constant of 1.5 was
used to mimick molecules in vacuum (e.g the mass spectrometer) and 3.5 and 7.5 were
used to see the effect o f decreased hydrogen bonding strength on the maps. Block
Diagonal minimization was applied with energy optimization to the default convergence
value (3.6 cal/mol for the native disaccharides). The conformational analysis was carried
138
Reproduced with permission of the copyright owner. Further reproduction prohibited without permission.
out in 20 0 intervals, with the torsion angles defined as <j>= 05-C l-01-C 4’and \jr= C5’-
C4’-01-C1. In all optimizations, only these angles were constrained and all other
geometric properties were relaxed. The maps show the lowest energy calculated
irrespective of the starting model at each (j), ijr point. Unix shell scripts were written to
read in the structures from Chem-X for MM3 minimizations. The <{>, xj/ maps were plotted
with Surfer (Golden software). Contours are plotted out to 10 kcal/mol above the
respective global minima. The native and permethylated disaccharides studied are: oc,a-
trehalose, p,|3-trehalose, kojibiose, sophorose, nigerose, laminaribiose, maltose,
cellobiose.
Disaccharide Starting Models
The initial structures were based on glucose fragments provided by Chem-X that
had 4Ci rings. To decrease the number of structures to be considered, Chem-X supports a
rule-based method based on conformational energies. From approximately 500 million
potential structure combinations of methyl group orientations, only a small certain
number of starting structures were selected based on the Chem-X rules-based search.
Conformations are rejected by the rules if the torsion angles are known to cause a high
energy. When applying the rules to a systematic search, the calculation time is
significantly decreased and a much smaller results file containing only low energy
conformations is generated. The time taken for the search is roughly proportional to the
number of search variables.
For permethylated (maltose, cellobiose, kojibiose, sophorose, nigerose,
laminaribiose) 162 starting structures were found. For permethylated aoc—trehalose and
Reproduced with permission of the copyright owner. Further reproduction prohibited without permission.
permethylated pp—trehalose 81 and 243 starting structures were used respectively. All the
starting structures were used at each <J>, \jr point for each disaccharide.
The starting structures for the native disaccharides were obtained in a different
manner, because hydroxyl groups are not covered by the Chem-X rules, (i) Orienting the
hydroxyl groups on each monosaccharide residue in a clockwise orientation by setting the
torsion angles H-O-Cn-Cn.i=180° (c conformer) or (ii) Orienting the hydroxyl groups on
each monosaccharide residue in a counterclockwise fashion (r conformer) with H-0-Cn-
Cn+i=180° or (iii) The same counterclockwise set except H-O-C2-H=180° (x conformer).
Thus 9 different combinations of (i), (ii) and (iii) viz. cc, cr, cx, rc, rr, rx, xc, xr, xx were
obtained. The clockwise (c) and reverse clockwise(r) exocyclic orientations of the
secondary hydroxyl groups for each glucose ring are chosen because they form a partial
network o f weak hydrogen bonds around the pyranosyl ring [28] and provides a way to
give all the <J>, \\f conformations the lowest possible calculated energy. For each o f the 9
different starting structures and for the intial starting structure with orientations from the
database starting structures were then generated using the rules base search that included
(j),\|r and the primary alcohol groups.
Results and Discussion
Description of Starting Structures
In this section permethylated maltose will represent molecules with 162 starting
structures. The default structure that results from using the glucose residues provided by
Chem-X has all the methyl groups either (+) or (-) gauche to the methine hydrogens. The
methyl groups at the C6 position (Cm-0 6 -C6 -) on both the nonreducing and reducing
monomers are in a trans orientation to C5 . The 06 is trans to the ring oxygen and gauche
140
Reproduced with permission of the copyright owner. Further reproduction prohibited without permission.
to C4 . The other starting structures generated by the rules based search exhibit a certain
degree o f similarity to the starting structure. In most o f the structures the C6 chain is
either in 180° or 120° orientations to C5 on both residues o f the disaccharide. The methyl
groups on the Q , C 2 or C3 are either in the eclipsed (0°) or gauche orientation to the
resepctive methine hydrogen on the reducing sugar of the disaccharide. On the
nonreducing sugar the methyl groups at the C2 and C3 positions are in similar nearly
eclipsed orientations while the one on C4 is at various varying positions for the different
starting structures. In an ab initio study of the conformational behavior of a and (3
glycosidic linkages on axial and equatorial 2 -methoxy tetrahydropyrans as models
Tvaroska and Carver et al. [62] state that conformers having the methyl group on C l in a
gauche position to the ring oxygen are preferred over those having it in the trans position
due to the exo-anomeric effect. In a previous study [63] o f the conformational properties
and the gauche effect o f the methoxymethyl in hexopyranosides, methylation of the
hydroxymethyl group oxygen resulted in the tg conformer being favored. The starting
structures generated by Chem-X have the methyl groups in a nearly eclipsed orientation
to the methine hydrogen and some o f them have the 0 6 methyl in a tg conformation.
Tvaroska and Carver [64] also carried out an ab initio study of the conformational
behaviour of aglycon O-C bonds and rotameric distribution in O-methylated axial and
equatorial 1—>2,1—>3, 1—>4- dimethoxy tetrahydropyrans as models. The 1—>4 and 1—>3
models had their lowest energy minima when the methyl groups were either + or —
gauche to the methine hydrogen atom. The kojibiose model is characterized by two
equivalent minima, plus a slightly higher gg minimum, two of which are in the gt and tg
orientation at the same energy. Only the (+) gauche model o f sophorose had a low
141
Reproduced with permission of the copyright owner. Further reproduction prohibited without permission.
energy. These quantum mechanics results suggest that our starting structures are
reasonable.
Description o f Minimum Energy Structures
The minimum energy structures of the two bond linked permethylated disaccharides as
shown in Figure 4.1, exhibit both similarities and differences. Similarities o f all the
disaccharides are that the torsion angles for the exocyclic methyl groups are gauche to
eclipsing the methine hydrogen atom. The primary alcohol (C6 ) chains on both the
residues are trans to the C5 atom. The 0 6 atoms are both, either in gt ot gg orientations.
The only exception is permethylated kojibiose where the 0 6 atom is in a gg orientation
on the non-reducing sugar and in a gt orientation on the reducing sugar. The glycosidic
angles are approximately the same in all the axial-equatorial reducing sugars kojibiose,
nigerose and maltose at 116-117° and in the diequatorial reducing sugars sophorose,
laminaribiose and cellobiose at 114°. The difference between the axial-equatorial versus
diequatorial is that the glycosidic angle has opened up for the axial-equatorial by
approximately 2-3° to prevent the C6 group from colliding with the second residue. Thus
the steric strain of the axial linkages causes the bond angle to open up. The non-reducing
disaccharides oc,a—trehalose and (3,p—trehalose have similar glycosidic angles o f 113.8°
and 114° respectively. The global minima for each of the permethylated disaccharide
molecules are located at the <f>,vjr values shown in Table 4.1.
Characteristics of Maps with Different Linkage Configurations
MM3 energy surfaces at ©=1.5 for the 8 disaccharides are presented in figures.
4.2-4.9 and Table 4.2 gives the positions of the global minima on each surface along with
their flexibility values. We define the flexibility over the Ramachandran surface as
142
Reproduced with permission of the copyright owner. Further reproduction prohibited without permission.
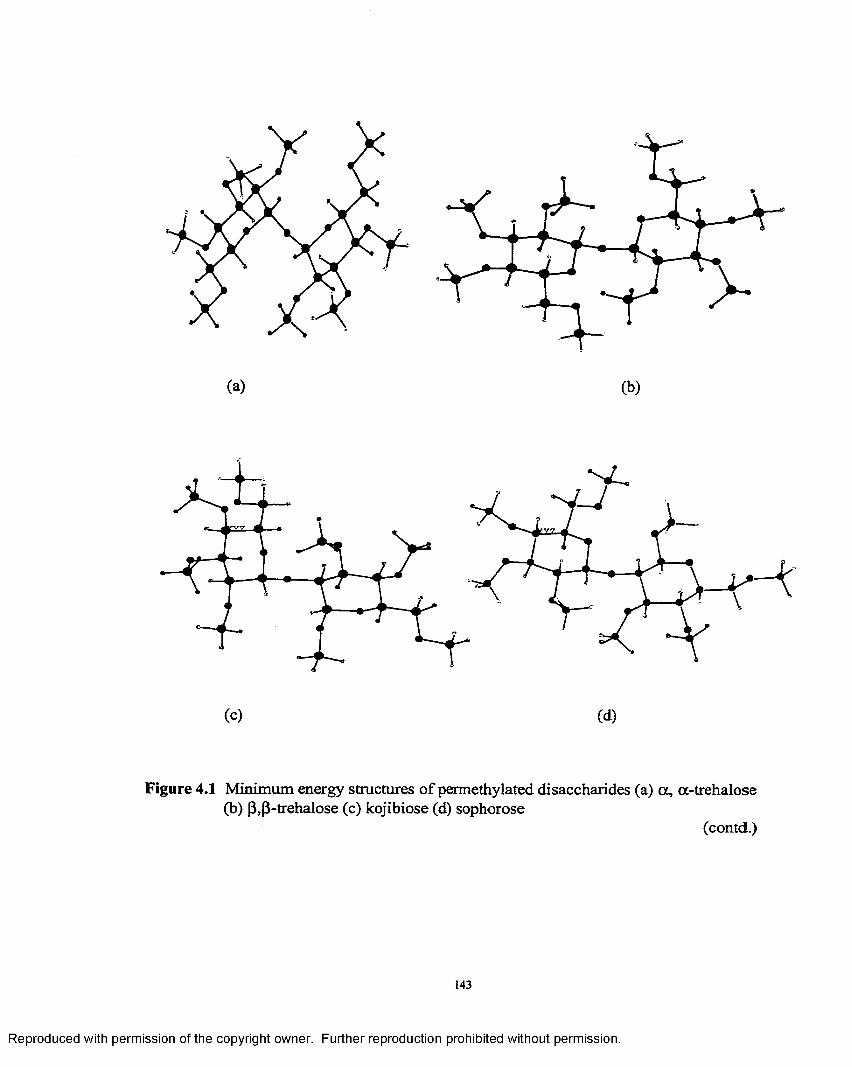
(a) (b)
(c) (d)
Figure 4.1 Minimum energy structures of permethylated disaccharides (a) a , a-trehalose (b) P,(3“trehalose (c) kojibiose (d) sophorose
(contd.)
143
Reproduced with permission of the copyright owner. Further reproduction prohibited without permission.
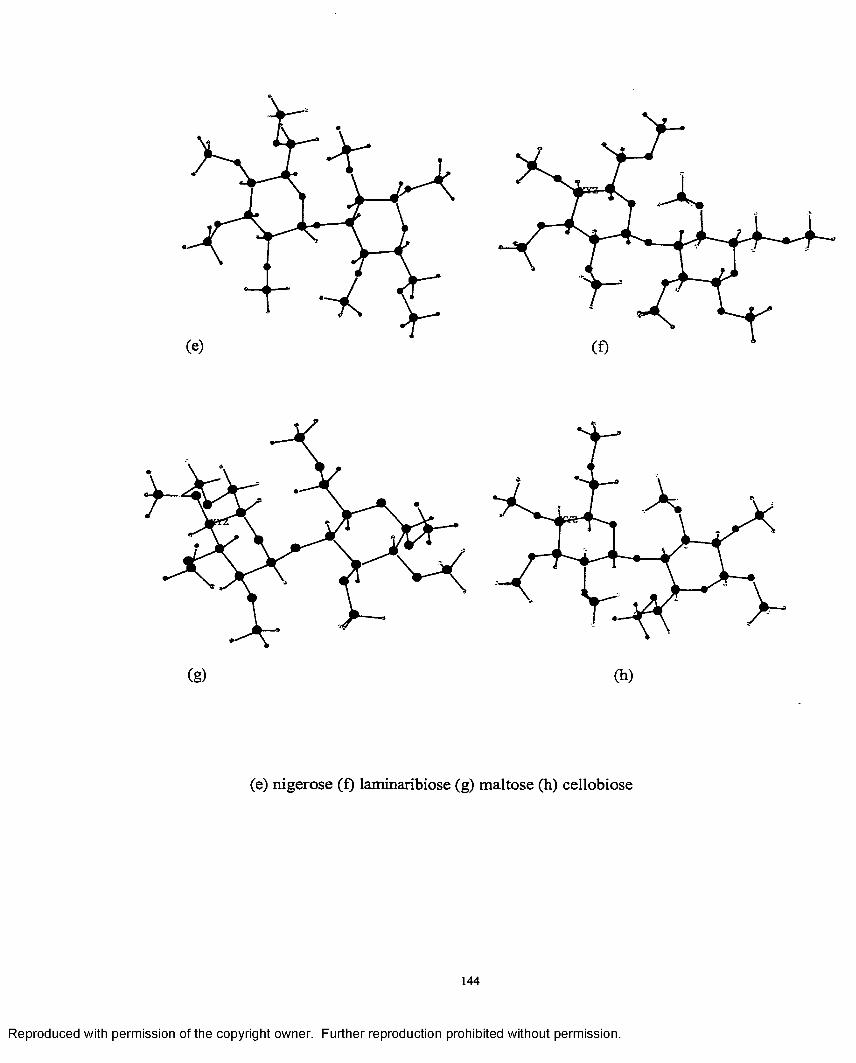
(e)
X
(g) GO
(e) nigerose (f) laminaribiose (g) maltose (h) cellobiose
144
Reproduced with permission of the copyright owner. Further reproduction prohibited without permission.
the probability volume in degrees squared, with the probability calculated by a Boltzman
relationship, pi=e'AE/RT. Therein, AE is the electronic energy relative to the global
minimum determined by quantum mechanics, R is the universal gas constant, and T is
298 K. This probability volume is related to the partition function, a summation of the
probability values over the surface. A completely flexible molecule would have a relative
energy of 0 kcal (and p; =1) everywhere on the surface. On a grid with a 1° spacing there
are 360 x 360 = 129,600 $,1/ points. A completely rigid molecule would have a p* of 1 at
only one point and a value o f zero at all others. Thus the maximum possible value of the
partition function would be 129,600, and the minimum on that basis would be 1.
Similarly, the maximum and minimum probability volumes would be 129,600 deg x deg
and 1 deg x deg respectively. Numerical values of the dimensionless partition function
were essentially the same as the probability volume for the analog surfaces when using a
1° grid spacing and the Trapezoidal rule, Simpson’s rule or Simpson’s 3/8 rule. At larger
grid increments, the probability volume represents a reasonable fine quadrature approach
to the partition function calculated for a 1 ° grid, but values o f the partition function for
other grid increments were, o f course, quite dependent on the number o f grid points in the
summation.
The main energy wells for the symmetric non-reducing disaccharides a , a-trehalose and
P,P-trehalose differ in character from the reducing disaccharides: kojibiose, nigerose,
maltose, sophorose, laminaribiose and cellobiose. The non-reducing disaccharides have a
single low-energy region with different positions. The different positions result from the
different order of atoms seen during counterclockwise rotation. While the reducing
disaccharides have elongated regions in the \\r direction within the 1 kcal contour, the
145
Reproduced with permission of the copyright owner. Further reproduction prohibited without permission.
alpha and beta disaccharides are similar in the region o f the global minimum. The beta
disaccharides viz. sophorose, laminaribiose and cellobiose have an alternate secondary
minimum at <J)=60o while the alpha anomers do not. The flexibility values Table 4.2 show
in comparison to the other molecules that a ,a-trehalose has the smallest flexibility value
and is the most sterically hindered molecule while the least sterically hindered anomers
are the diequatorial disaccharides of sophorose, laminaribiose and cellobiose. The
restricted flexibility arises from the fact that there are two anomeric centers in a ,a -
trehalose and from the extra stabilization given to the minimum energy form due to the
exo-anomeric effect. An unusual result is that (3,P-trehalose is more flexible than maltose
and nigerose that have one anomeric center and are axial equatorial linkages. The
flexibility values indicate that the alpha-equatorial reducing disaccharides are less
flexible than the corresponding diequatorial reducing disaccharides. This is confirmed by
the 1 kcal contours that are smaller for the axial-equatorial disaccharides than the
corresponding diequatorial disaccharides.
Comparison of Maps with Different Dielectric Constants
The <J>—\jrmaps at £=1.5, 3.5, and 7.5 are shown in figures 4.2-4.25. In the case of
a ,a —trehalose the maps look very similar at all the three dielectric constants. The maps
are symmetric since a , a-trehalose has rotational symmetry. There is no shift in the
position of the global m inimum as the dielectric constant is increased for either a ,a - or
p.p-trehalose. The energy surface becomes flatter as one goes to higher e for a ,a - trehalose
while for p,p-trehalose the energy surface becomes steeper. For the 1—>2 and 1—>3 linked
disaccharides both the axial-equatorial disaccharides kojibiose and nigerose have their
low energy regions lying in the same trough.
146
Reproduced with permission of the copyright owner. Further reproduction prohibited without permission.
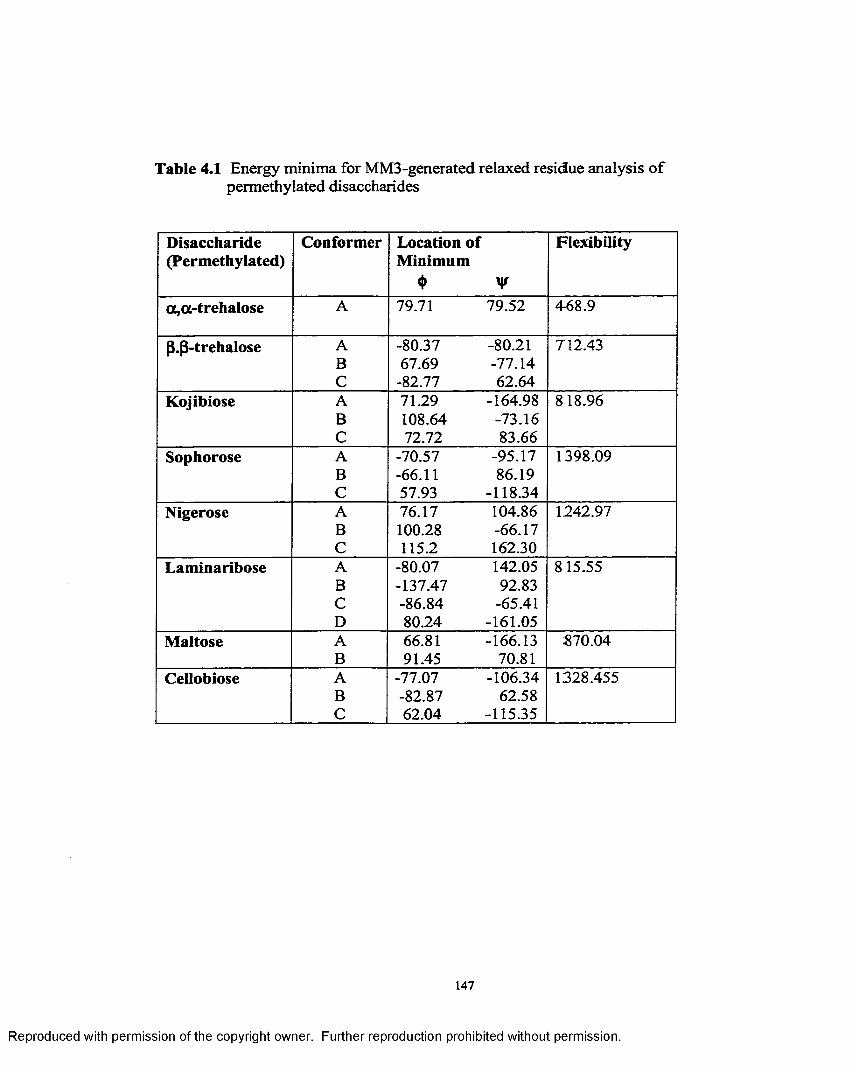
Table 4.1 Energy minima for MM3-generated relaxed residue analysis o f permethylated disaccharides
Disaccharide(Permethylated)
Conformer Location of Minimum
♦ V
Flexibility
a,a-trehalose A 79.71 79.52 468.9
p.p-trehalose A -80.37 -80.21 712.43B 67.69 -77.14C -82.77 62.64
Kojibiose A 71.29 -164.98 818.96B 108.64 -73.16C 72.72 83.66
Sophorose A -70.57 -95.17 1398.09B -6 6 . 1 1 86.19C 57.93 -118.34
Nigerose A 76.17 104.86 1242.97B 100.28 -66.17C 115.2 162.30
Laminaribose A -80.07 142.05 815.55B -137.47 92.83C -86.84 -65.41D 80.24 -161.05
Maltose A 66.81 -166.13 870.04B 91.45 70.81
Cellobiose A -77.07 -106.34 1328.455B -82.87 62.58C 62.04 -115.35
147
Reproduced with permission of the copyright owner. Further reproduction prohibited without permission.
at <{>= 80° and 93° respectively. They otherwise exhibit different characteristics. In
kojibiose the regions around the global minima (< 5kcal) look very similar for the <|>, \|r
maps at e= 1.5 and 7.5, while the three nigerose maps have little similarity at any of the 3
dielectric constants. In kojibiose at all three dielectric constants the energy increases
gradually to 3 kcal and then steeply to 10 kcal. However in nigerose the contours become
steeper as one goes from £=1.5 to 3.5 but remain the same at 7.5. In the case of the
diequatorial linkages sophorose and laminaribiose the 1 kcal contour is longer on the s
=7.5 surface than on the £=1.5 surface. There is no shift in the position o f the global
minima as the dielectric constant is increased but the position of the secondary minimum
at <))=-80o and \j/ = -75° is shifted to the left in laminaribiose. In the case of nigerose,
however the global minimum is shifted.
In the case of the 1—>4 linked disaccharides both native maltose and cellobiose
the area surrounded by the 1 kcal contour increases as the dielectric constant is increased
from 1.5 to 3.5 to 7.5. However for cellobiose it remains the same from £ = 3.5 to 7.5 and
the <J>, \|r maps at £ = 3.5 and 7.5 look very similar. The energy increases more gradually
as one goes from the lowest to highest dielectric constant for both the molecules. At
dielectric constant 1.5 the 10 kcal contour around the global minimum is separate from
the 10 kcal contour around the secondary minimum. However as one increases the
dielectric constant the contours join forming a trough that encloses the saddle point.
There is no shift in the position of the secondary minimum as the dielectric constant is
increased for both maltose and cellobiose. There is a slight shift in the position of the
global minimum for maltose and no shift in the case o f cellobiose as £ is increased.
Reproduced with permission of the copyright owner. Further reproduction prohibited without permission.
Characteristics o f the Individual Native Disacccharides
The discussion o f the individual native disaccharides pertains to those at
e=1.5. The disaccharides at £=3.5 and 7.5 will not be discussed but the energy surfaces
will be given as supplementary material.
a . a trehalose
The map o f oc,a trehalose is shown in Fig. 4.2. Their conformational features
along with their flexibility values are listed in Table 4.2. This molecule has chemical
symmetry and thus structures drawn on one side of the diagonal line on which <{>=\|f could
be plotted on the other side. The global minimum (A) is located at <J),xj/= 79.9°,79.8°.
Each residue is stabilized by a crown o f intra-residue hydrogen bonds. The global
minimum is a single round well in <{),\|/ space. The map indicates that this molecule is the
most sterically hindered among all the 2-acetal-bond linked disaccharides. The MM3-
generated map o f oc,a-trehalose was reported previously [45]. Similarities between both
the maps can be found. The only difference between the maps is that the present maps are
created with a greater variety of starting structures.
ft.ft-trehalose
The relaxed residue map o f (3(3-trehalose generated by MM3 is shown in Figure
4.3 and the location o f the low energy conformers are in Table 4.2. The appearance of
this map differs considerably from that of a,a-trehalose. In addition the (f>,\jr map
indicates that it is more flexible than a ,a —trehalose. There are three low energy regions.
They are contained in one single region extending vertically across the map in the
\\f direction. The two secondary minima at = -81.9 °, 53.2 0 and —120.6 ° , 62.2° are
symmetry related. The global energy minimum is at ()),\jr = -80.3 °,-79.5 ° and is at the
149
Reproduced with permission of the copyright owner. Further reproduction prohibited without permission.
center o f symmetry. It is stabilized by intramolecular hydrogen bonds on both residues
and by an inter residue hydrogen bond from 0 2 -0 6 ’. The two other minima which are at
a substantially higher energy are at <|>,\j/ = -81.9 °, 53.2 0 that has the hydroxyl groups in a
near-eclipsed orientation and <J>,\|r = - 1 2 0 .6 ° , 62.2° that is stabilized by an inter-residue
bond at 0 2 -0 2 ’.
Kojibiose
The MM3-generated relaxed residue map o f kojibiose is shown in Figure 4.4 and
the optimized minima are listed in Table 4.2. A deep trough of low energy conformations
running along the direction is present. The global minimum is located at <|>,\|/=101.3 °,-
162.18 0 which is a near eclipsed orientation. It is stabilized by an inter-residue hydrogen
bond between 0 2 and O l’. The second minimum is at <{),\j/= 94.09 °,-76.94 °. There is a
small energy difference of <lkcal that exists between these two conformers. The third
minimum is at <|),\|f= 81.72 °,58.04 °. It is < 2 kcal higher in energy than the global
minimum. It is stabilized by an inter residue hydrogen bond between 0 2 -0 3 ’. For all the
three minima the <j) angle is centered around 80°.
Sophorose
The MM3 map of sophorose is shown in Figure 4.5 with isoenergy contour lines at 1
kcal /mol increments where four minima are denoted and represented in Table 4.2. There
are two intersecting troughs containing the low energy regions with some of the energy
barriers between the low energy regions larger than 8 kcal/mol. The lowest energy
minimum lies within the lkcal contour that extends in the direction from -180 0 to —
1200 at <j),\jr= -84 °, -172.4°. It has an inter residue hydrogen bond between 02 -0 3 ’. The
other two secondary minima lie within the same trough defined by the 5 kcal contour that
150
Reproduced with permission of the copyright owner. Further reproduction prohibited without permission.
extends in the \jf direction form 20° to 80°. The two minima are found at <{>,\}/=-l 18.8 61.5°
that is stabilized by an interresidue bond between 0 2 -0 1 ’and <|>,\|/= -82 °, 42°, that is in a
staggered orientation one on each side of the gauche orientation at \j/=60°. The energy
difference between the two minima is very small. The fourth minimum is in the
intersecting trough at 66.9 °,-110° stabilized by an interesidue hydrogen bond
between 0 2 -0 1 ’.
Nigerose
The map of nigerose is shown in Figure 4.6 and the optimized minima are listed
and represented in Table 4.2. There are two low-energy regions, both of which are
contained in a single low-energy trough extending vertically in the \jr direction. The
global minimum is at <{),\j/= 83.7 °,157.8 0 and is stabilized by an inter residue bond
between 0 2 and 0 4 ’ and the secondary minimum is at <{),\j/= 117.7 °,-59.2 0 with an
intramolecular hydrogen bond that could be formed between O l ’ and 0 2 ’. A plateau is
found at = 60 °,60 °.
Laminaribiose
The relaxed residue map of laminaribiose as generated by MM3 is shown in
Figure 4.7 along with the representation and location o f the minima in Table 4.2. Two
low energy minima A and B are located parallel to the \jr axis along the same line and
centered around ({>= -80°. The global minimum is elongated and is located at -83.7 °
,82.4°. It is stabilized by a crown of both intra residue and inter residue hydrogen bonds.
The secondary m in im um is <3 kcal higher in energy than the global minimum and is
located at -83°,-78.3° that is stabilized by an inter residue bond between 0 2 and
0 2 ’. A second lowest minimum (<1 kcal/mol) is separated from the other two minima in
151
Reproduced with permission of the copyright owner. Further reproduction prohibited without permission.
another trough at <t>,\y=66.3°, 132.9°. It is stabilized by an interresidue bond between 0 2
and 0 4 ’.
Maltose
The MM3-generated relaxed residue map o f maltose is shown in Figure 4.8
along with the details and representations o f the low energy conformations. There are
two low energy minima that are in separate energy wells. The global minimum is located
at <|),\|/= 107 °,-140 0 and is stabilized by an interresidue hydrogen bond between 0 3 ’-02.
The secondary minimum is located at <J»,\p= 87.2 °,76.3 °. It is stabilized by an interresidue
hydrogen bond between 0 3 ’-05.
Cellobiose
The relaxed residue map of cellobiose is shown in Figure 4.9 and the exact
location and representation of each minimum is shown in Table 4.2. The energy surface
has three low energy minima with the global and one secondary minimum located along
the same line parallel to the \j/ axis between <{>= -60 ° and -180 °. The global minimum is
at <j),\|f= -82.3 °,-138.7° and is stabilized by an interesidue bond between 0 3 -0 5 ’ and the
secondary minimum (B) is located at -82.3 °,57 °. A third minimum (< 2kcal) is
located in a separate well at <)>,\y= 63.9 °,-122.1° and is stabilized by the 03 -0 2 hydrogen
bond.
Individual Maps for Permethylated Disaccharides
Permethylated q.a-Trehalose
The MM3 generated flexible residue map o f permethylated aa-trehalose is shown
in Figure 4.26. The <j),\|/ map is very similar to the map o f the native molecule at £=7.5
because in the permethylated derivative there is no hydrogen bonding and at e= 7.5 there
152
Reproduced with permission of the copyright owner. Further reproduction prohibited without permission.
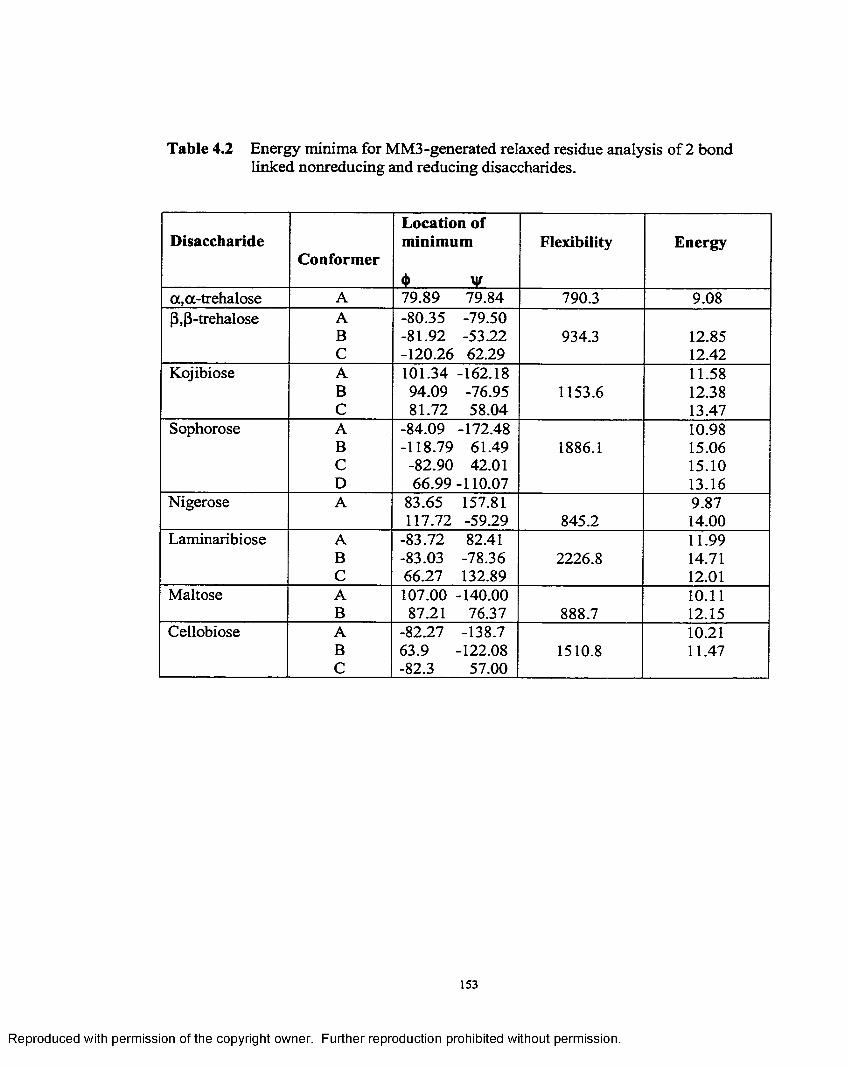
Table 4.2 Energy minima for MM3-generated relaxed residue analysis of 2 bond linked nonreducing and reducing disaccharides.
DisaccharideConformer
Location of minimum
$ V
Flexibility Energy
a,a-trehalose A 79.89 79.84 790.3 9.08(3,(3-trehalose A -80.35 -79.50
B -81.92 -53.22 934.3 12.85C -120.26 62.29 12.42
Kojibiose A 101.34 -162.18 11.58B 94.09 -76.95 1153.6 12.38C 81.72 58.04 13.47
Sophorose A -84.09 -172.48 10.98B -118.79 61.49 1886.1 15.06C -82.90 42.01 15.10D 66.99-110.07 13.16
Nigerose A 83.65 157.81 9.87117.72 -59.29 845.2 14.00
Laminaribiose A -83.72 82.41 11.99B -83.03 -78.36 2226.8 14.71C 66.27 132.89 1 2 . 0 1
Maltose A 107.00 -140.00 1 0 . 1 1
B 87.21 76.37 888.7 12.15Cellobiose A -82.27 -138.7 1 0 . 2 1
B 63.9 -122.08 1510.8 11.47C -82.3 57.00
153
Reproduced with permission of the copyright owner. Further reproduction prohibited without permission.
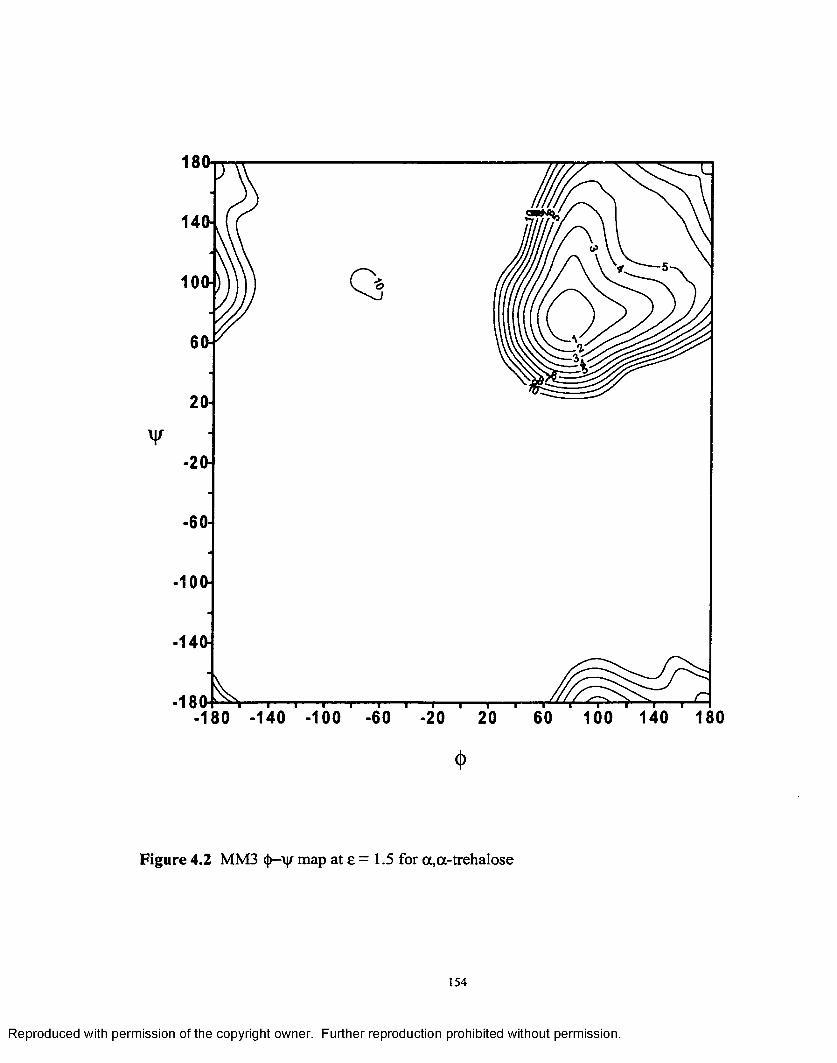
180-
14CH
100H
2<H
-20H
-60-I
-10(H
-14 (H
- 180- P ^ i — i— i— i— i— i— i— i— i— r --180 -140 -100 -60 -20 20 60 100 140 180
Figure 4.2 MM3 (}>-\{f map at e = 1.5 for oc,a-trehalose
154
Reproduced with permission of the copyright owner. Further reproduction prohibited without permission.
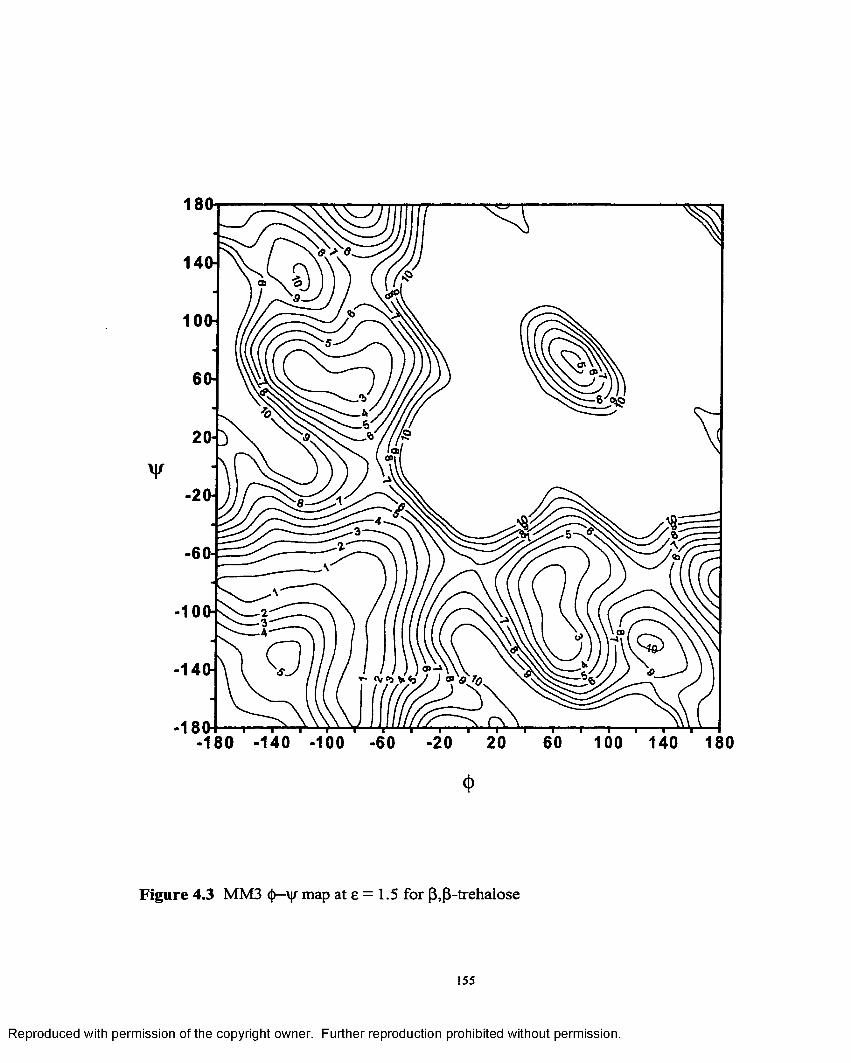
180
140H
10(H
6 (h
2(H
¥-20H
-6(H
-10CD
-14DH
-1801— .— y ,-180 -140 -100 -60 -20 20 60 100 140 180
4>
Figure 4.3 MM3 §—\\r map at e = 1.5 for (3,(3-trehalose
155
Reproduced with permission of the copyright owner. Further reproduction prohibited without permission.
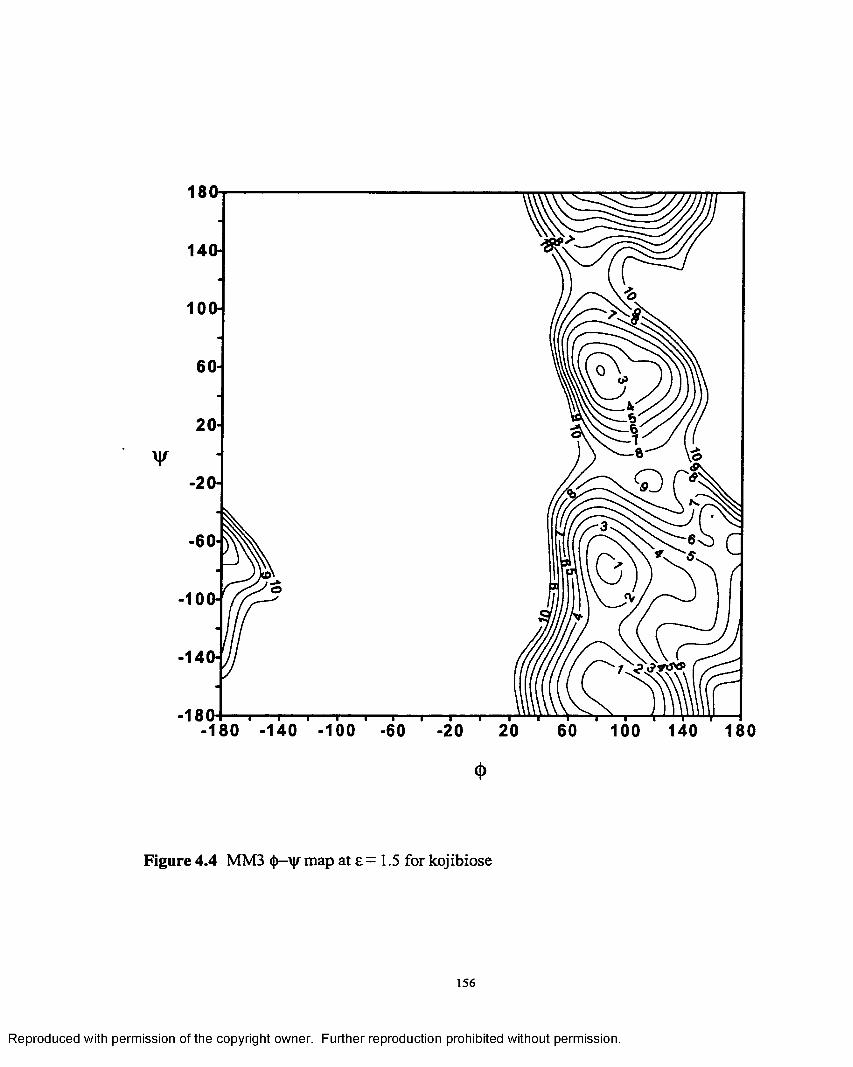
1 8 0
14CH
10(H
60H
20-\
¥-2(H
-60-^
-100H
-14<W
-180-20 2 0 60 100 140 80
<l>
Figure 4.4 MM3 4>— map at £ = 1.5 for kojibiose
156
Reproduced with permission of the copyright owner. Further reproduction prohibited without permission.
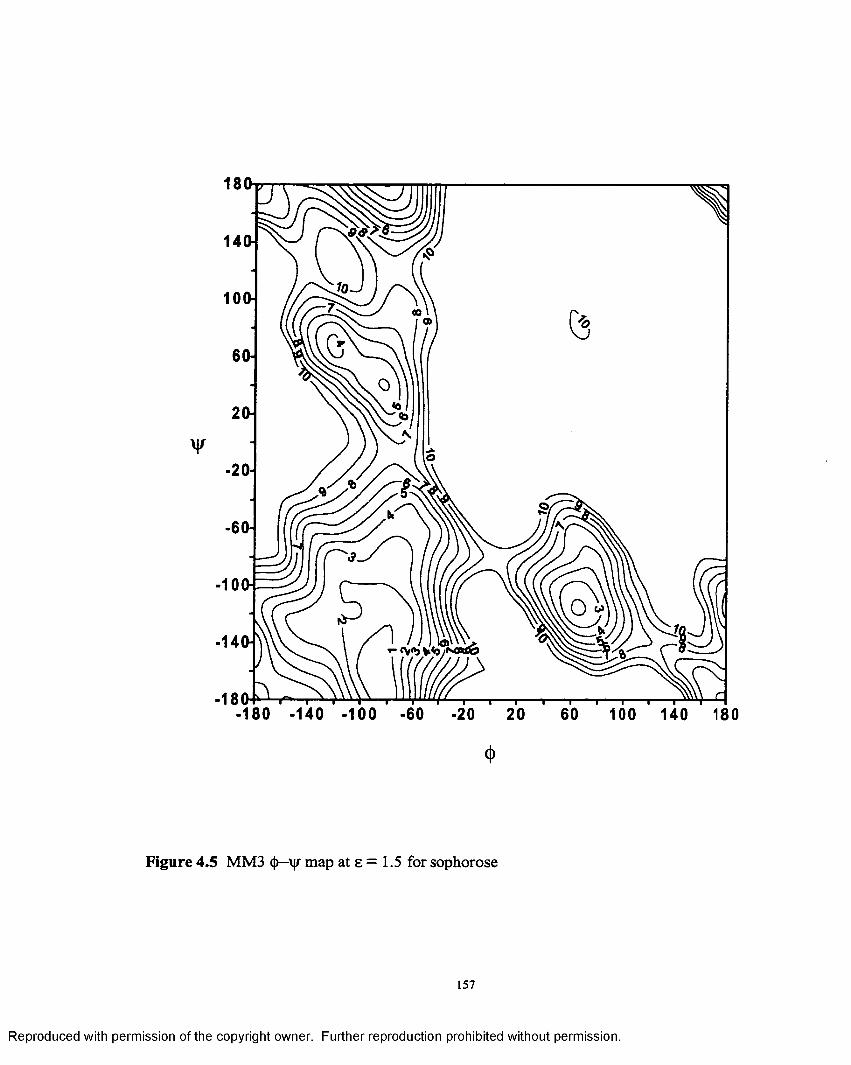
1 8 a
14CH
6 (H
2 <W
¥-20H
-60H
-100H
-140H
•18a-20 100 140 180
4>
Figure 4.5 MM3 <J)—vjr map at 8 = 1.5 for sophorose
157
Reproduced with permission of the copyright owner. Further reproduction prohibited without permission.
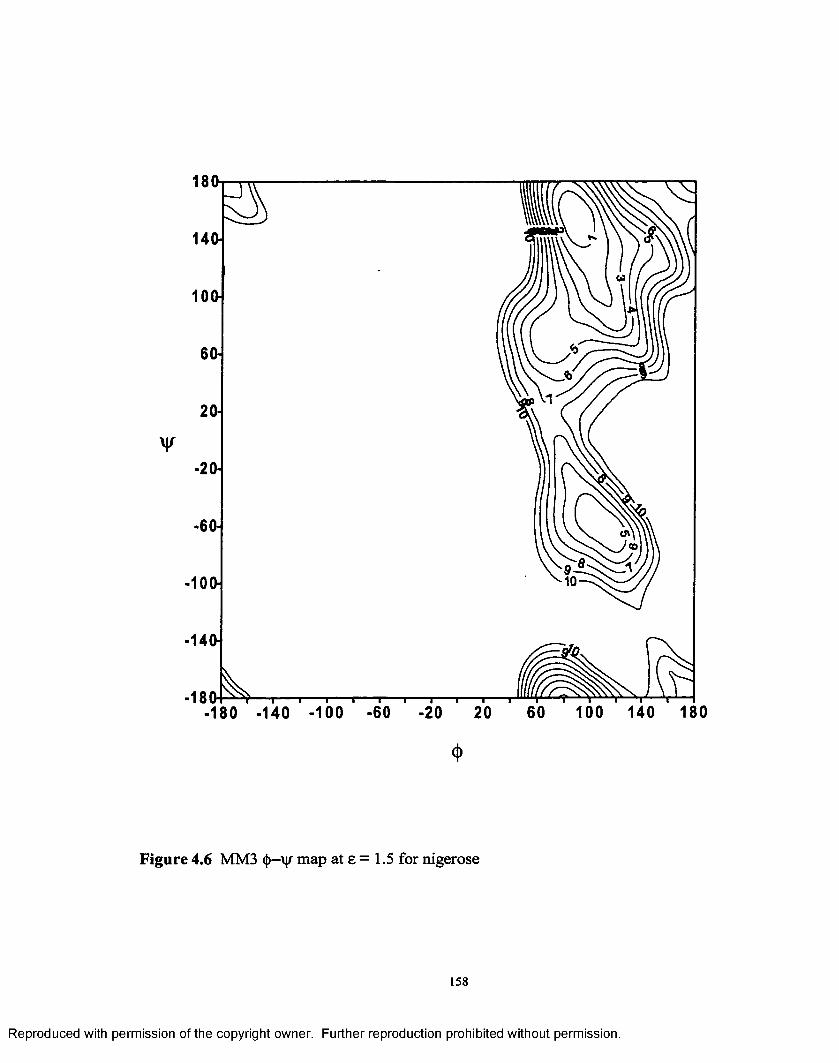
i s a
14CH
10W
2(H
-60-!
-14(H
-isa100 140 180-20
*
Figure 4.6 MM3 <{>— map at b = 1.5 for nigerose
Reproduced with permission of the copyright owner. Further reproduction prohibited without permission.
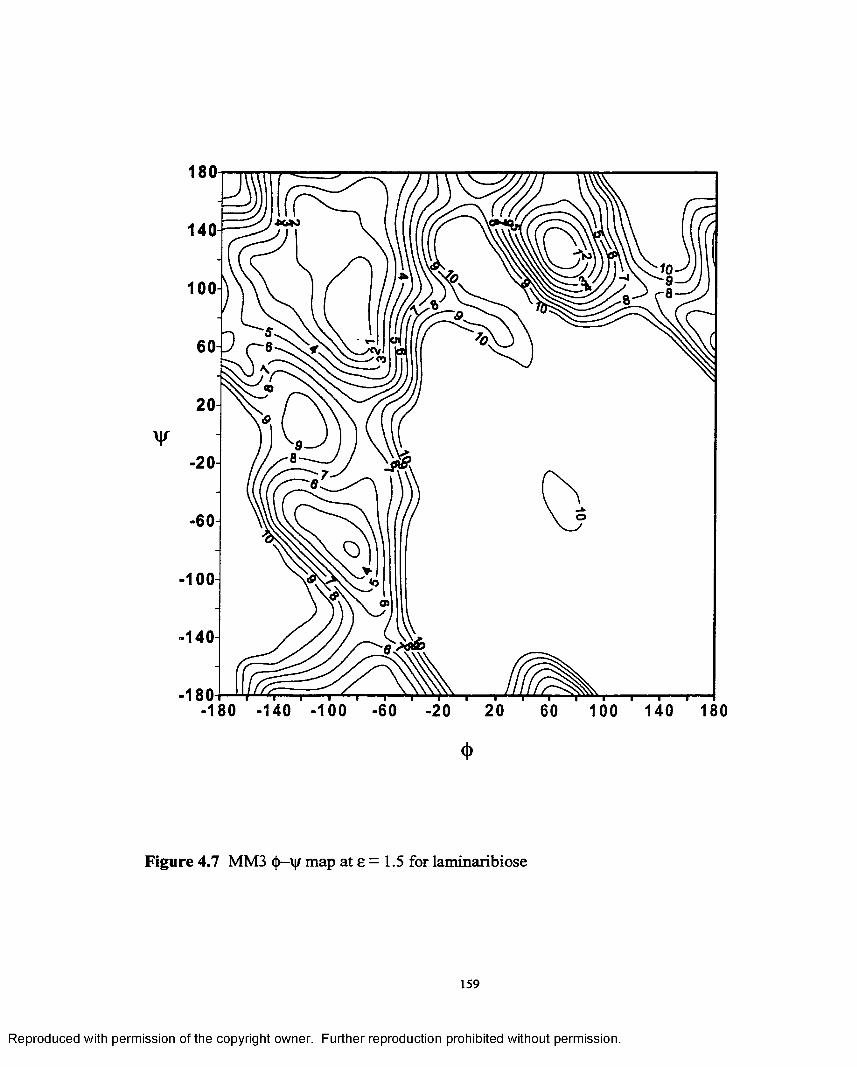
180
140
1 0 0 i
60-D
20]
¥-2 0 i
60H
- 1 0 0 H
-140H
, I60 100 140 180
-1801-180 -140 -100 -60 -20 2 0
<l>
Figure 4.7 MM3 <)>-\|/ map at e = 1.5 for laminaribiose
159
Reproduced with permission of the copyright owner. Further reproduction prohibited without permission.
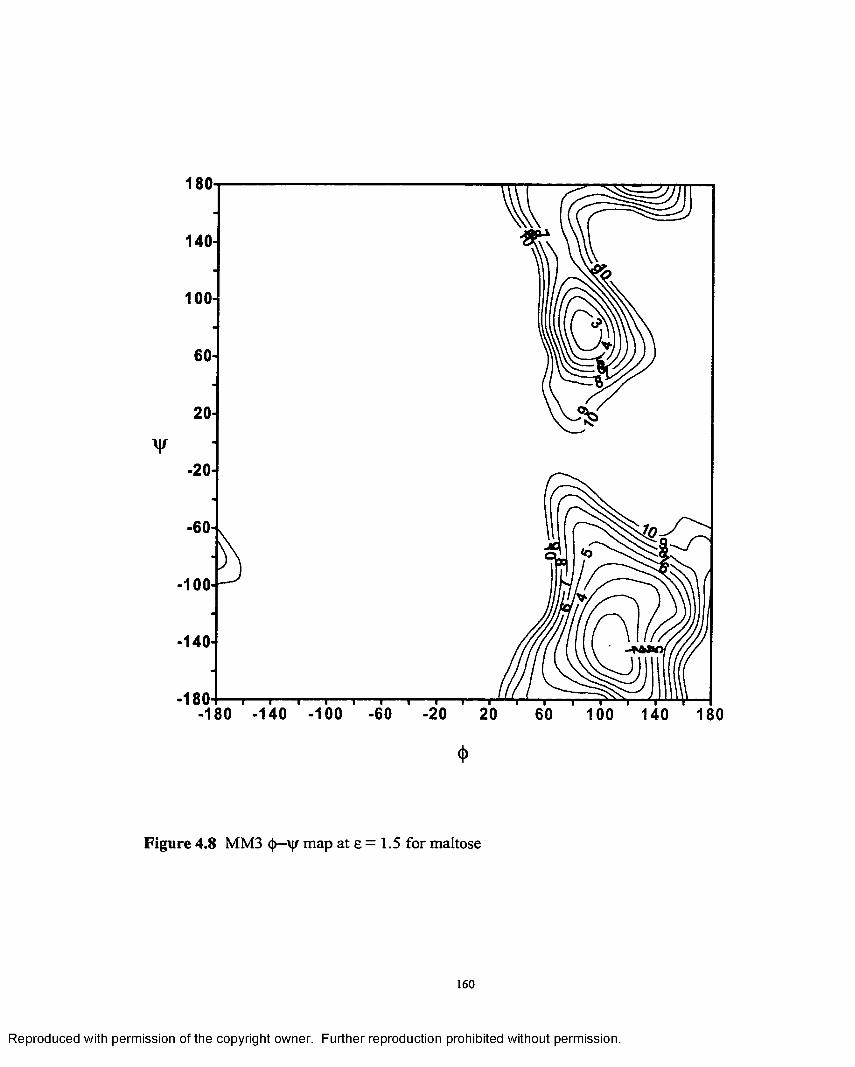
180
140-
100 -
60-
2 0 -
¥-2 0 -
-60
-100
-140-
-180-1------r i 1— —r— i 1---1 i 1 r—-180 -140 -100 -60 -20 20 60 100 140 180
4>
Figure 4.8 MM3 <(>—\|r map at e = 1.5 for maltose
Reproduced with permission of the copyright owner. Further reproduction prohibited without permission.
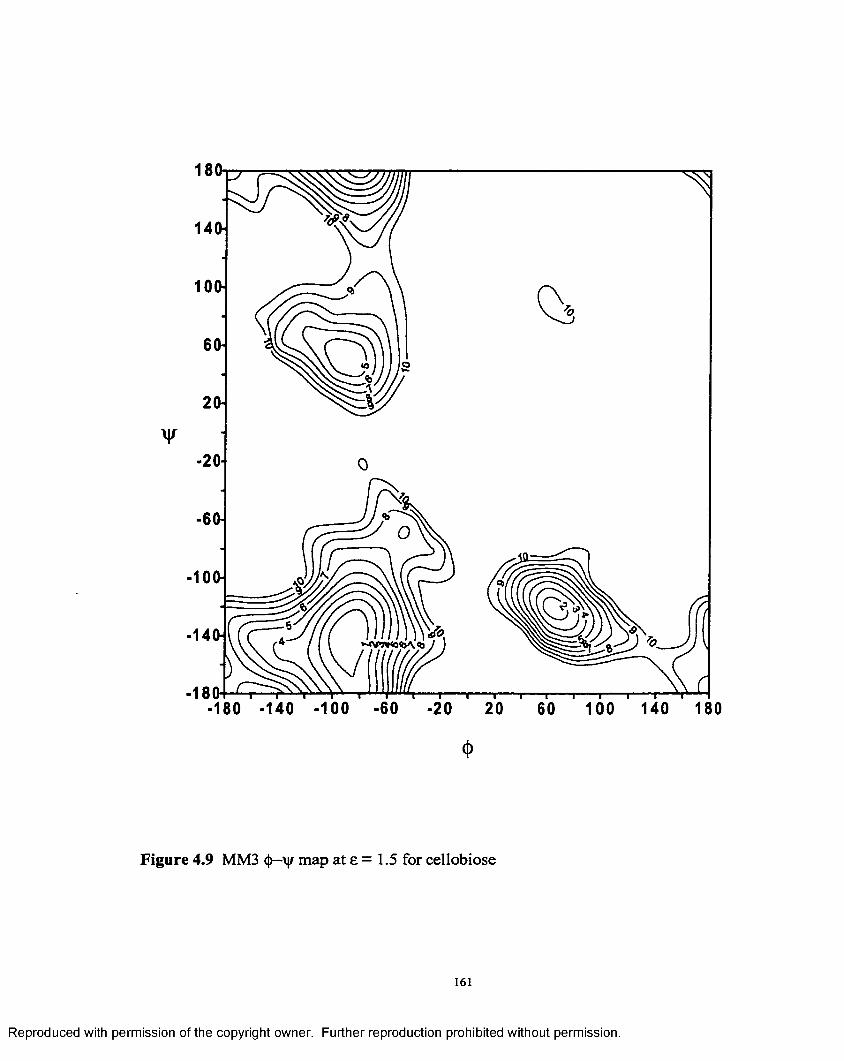
i s a
14W
6<H
20H
¥-20-I
- 6 O-l
-100H
-140h
-isa100 140 180-20
<l>
Figure 4.9 MM3 <{)—\|r map at e = 1.5 for cellobiose
Reproduced with permission of the copyright owner. Further reproduction prohibited without permission.
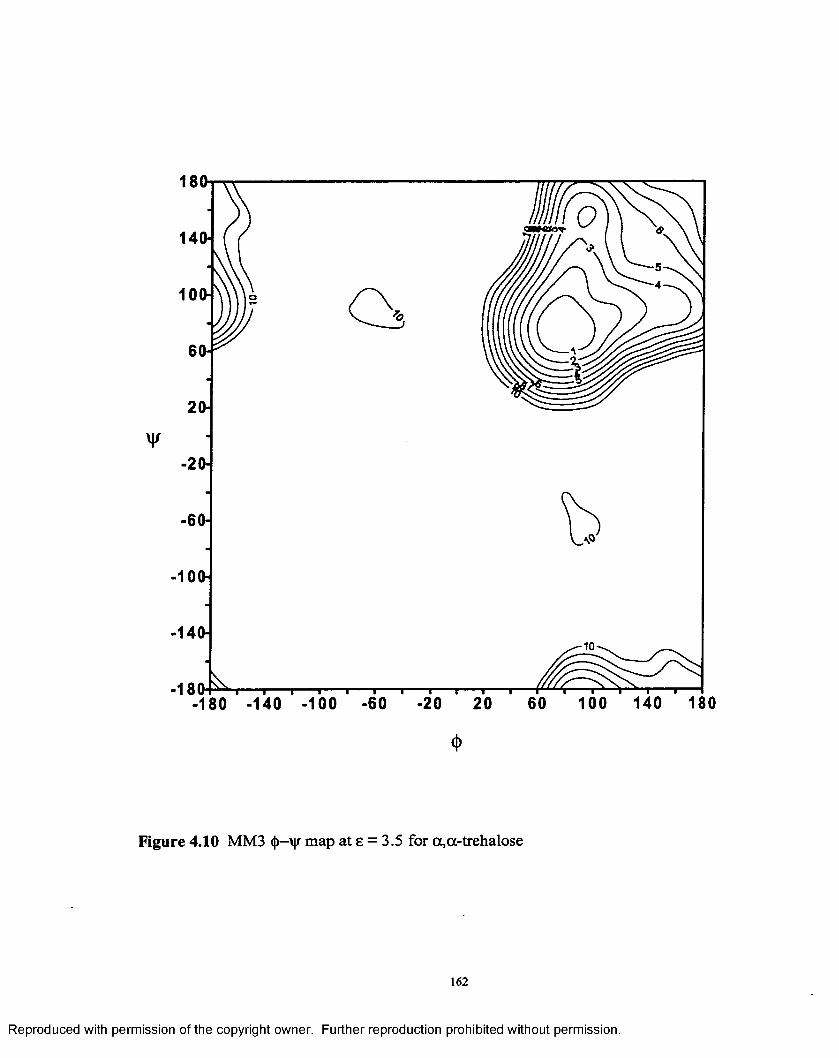
i s a
140H
1 ooH
20H
V-20H
- 6 OH
-100H
-140H
•18a100 140 180•20 20
4>
Figure 4.10 MM3 <]>—vy map at e = 3.5 for oc,a-trehalose
Reproduced with permission of the copyright owner. Further reproduction prohibited without permission.
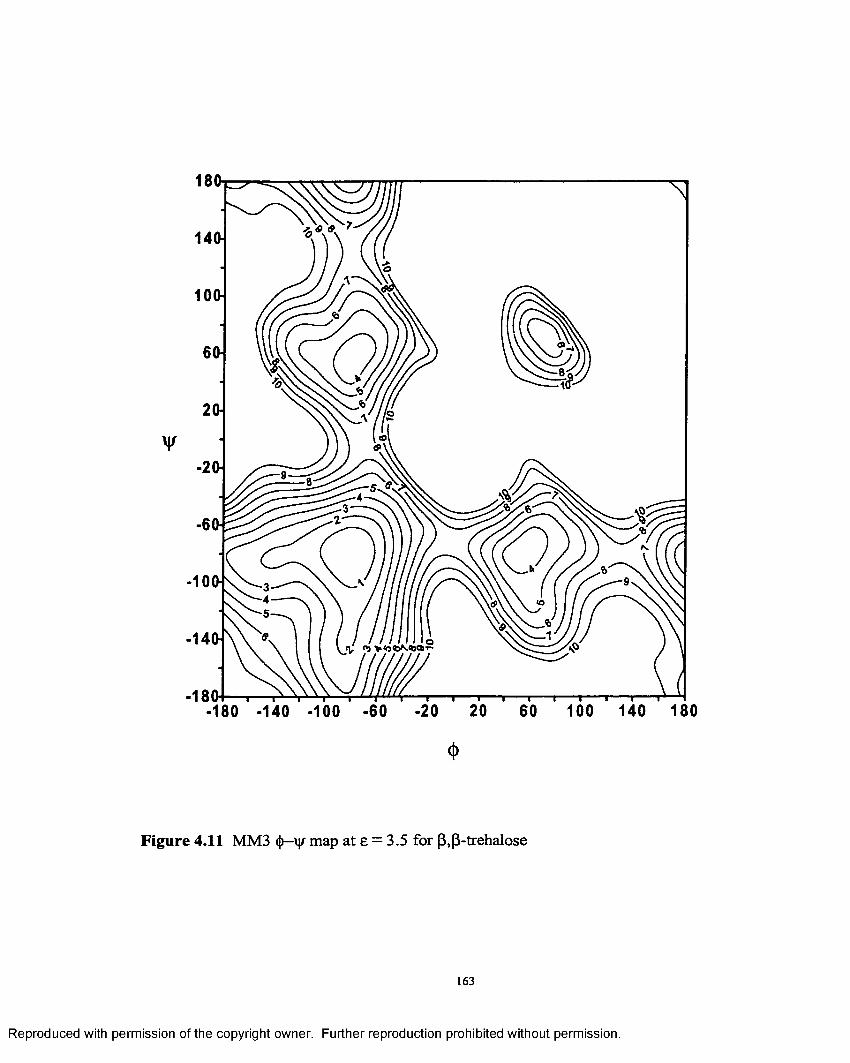
180-
14(H
6 OH
2(H
¥-2(H
-6 WN»
-10W
-180-•180 -140 -100 -60 -20 20 60 100 140 180
<l>
Figure 4.11 MM3 <f)—\|r map at e = 3.5 for p,p-trehalose
163
Reproduced with permission of the copyright owner. Further reproduction prohibited without permission.
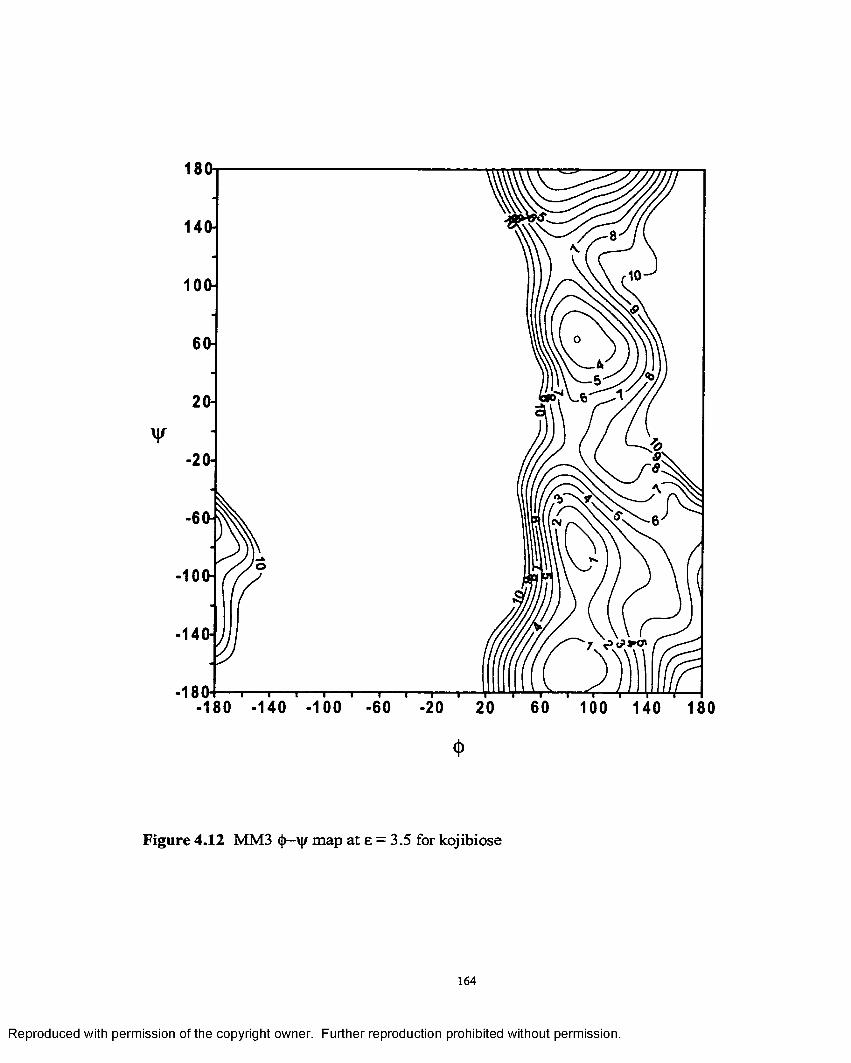
180-
140h
1 ooH
6(H
2(H
¥-2 <H
o-1 ooH
-140H
■180•20 100 140 180
4>
Figure 4.12 MM3 <{>—\|/ map at 8 = 3.5 for kojibiose
164
Reproduced with permission of the copyright owner. Further reproduction prohibited without permission.
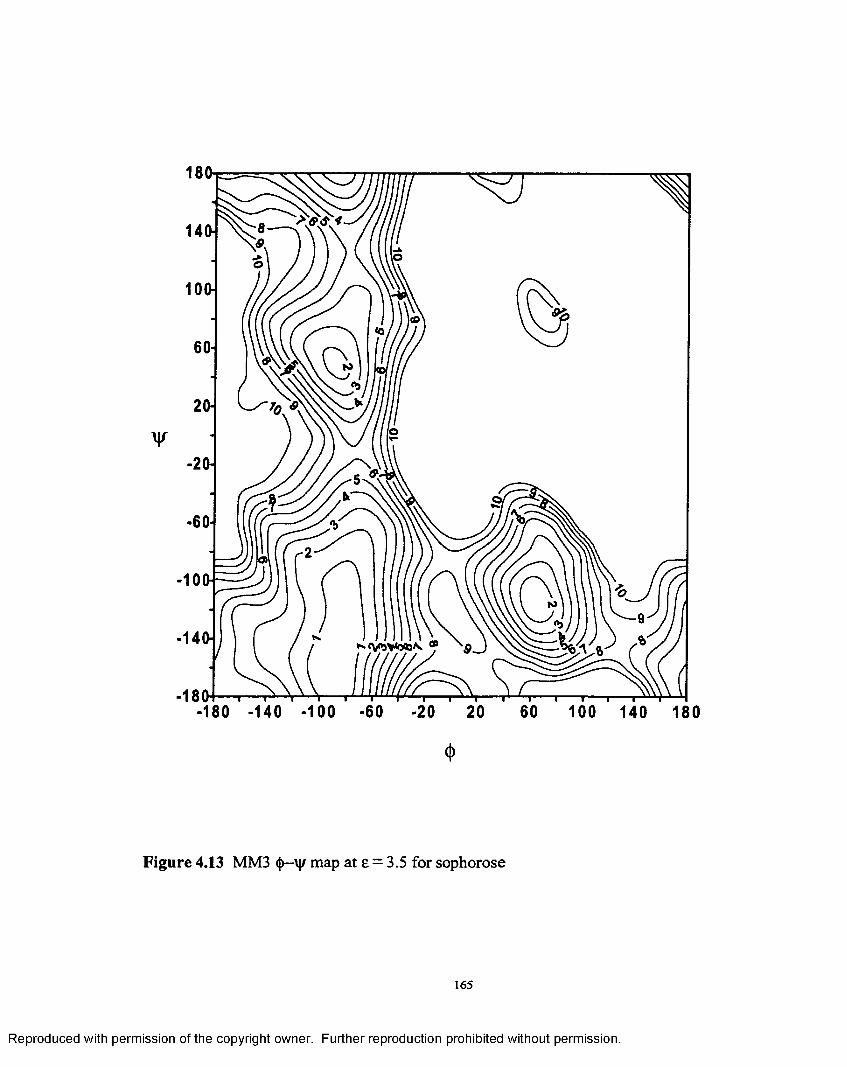
180
14CH
6 Oh
2(H
¥-20H
-60H
- 1 0
-14W
-180180 -140 -100 -60 -20 20 60 100 140 180
<!>
Figure 4.13 MM3 <|>-vj/ map at e = 3.5 for sophorose
165
Reproduced with permission of the copyright owner. Further reproduction prohibited without permission.
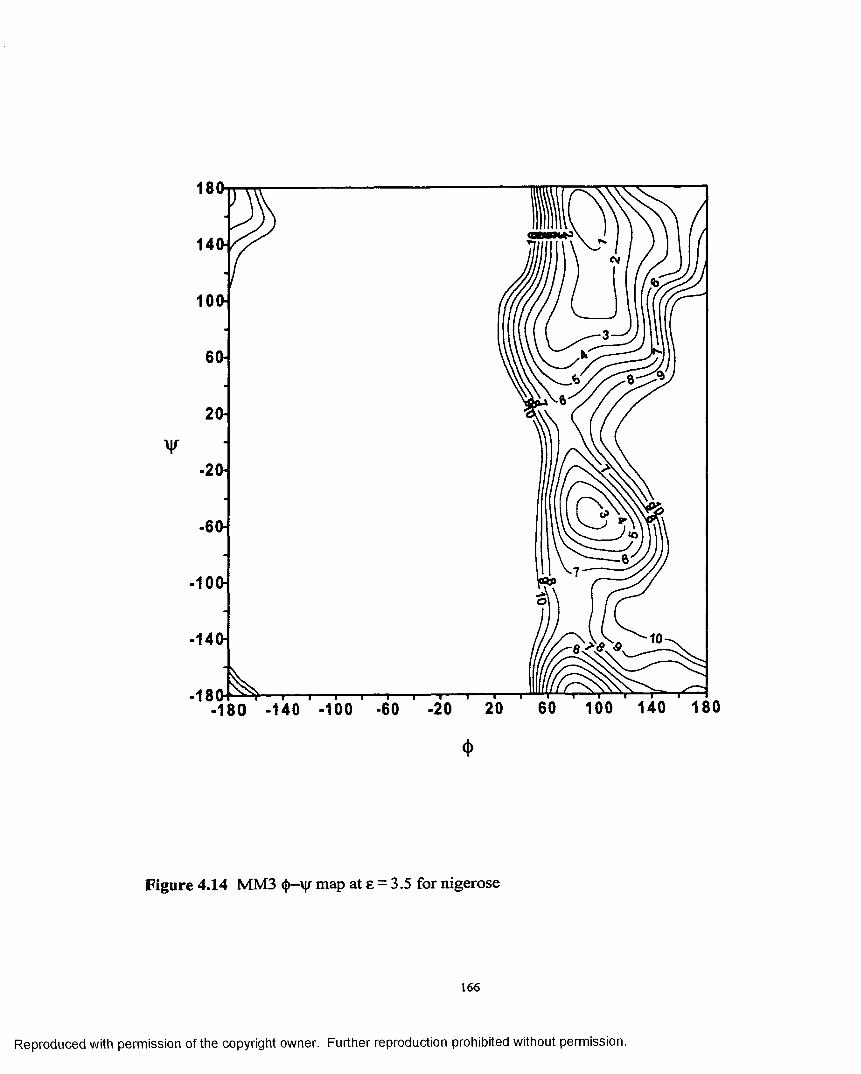
180
1 0 0 -
60-
2 0 -
-60-
-100
-140-
-180-180 -140 -100 -60 -20
<t>
Figure 4.14 MM3 ty-\\r map at e = 3.5 for nigerose
166
Reproduced with permission of the copyright owner. Further reproduction prohibited without permission.
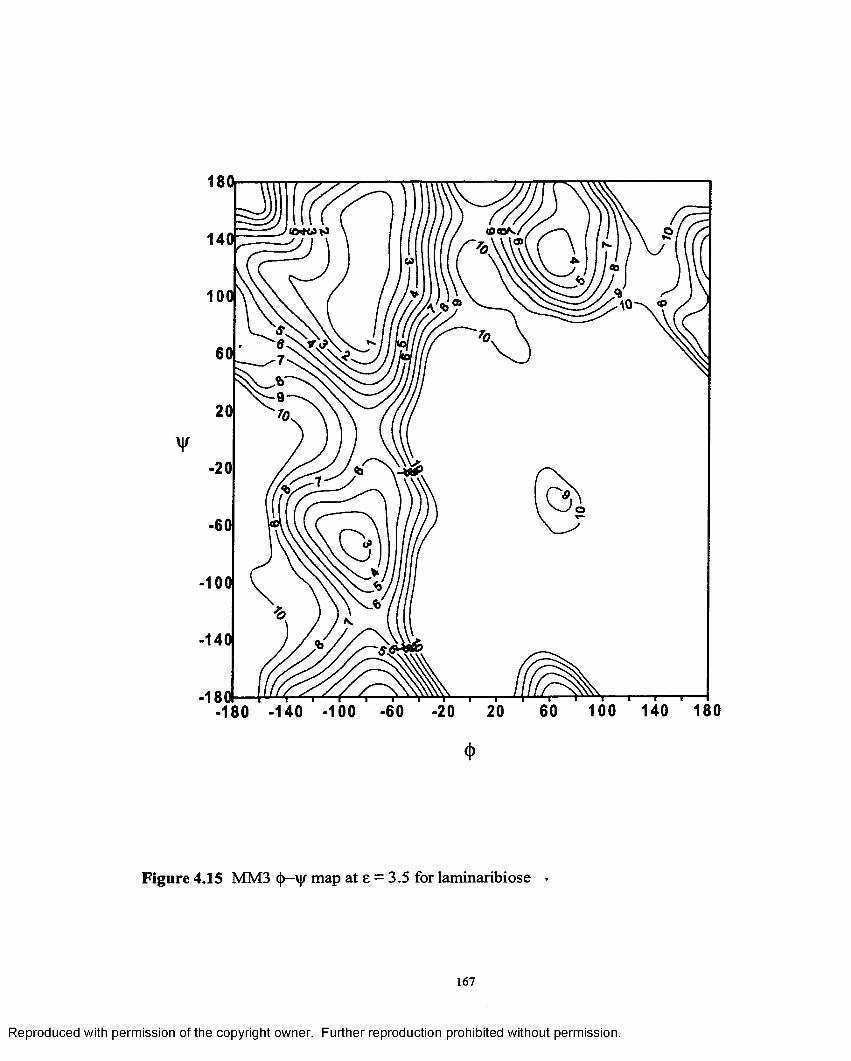
180.
14#
1001
¥-20
-60
-104
-144
-1801 -180 -140 -100 100 140 180
Figure 4.15 MM3 (f)—\|/ map at e = 3.5 for laminaribiose •
167
Reproduced with permission of the copyright owner. Further reproduction prohibited without permission.
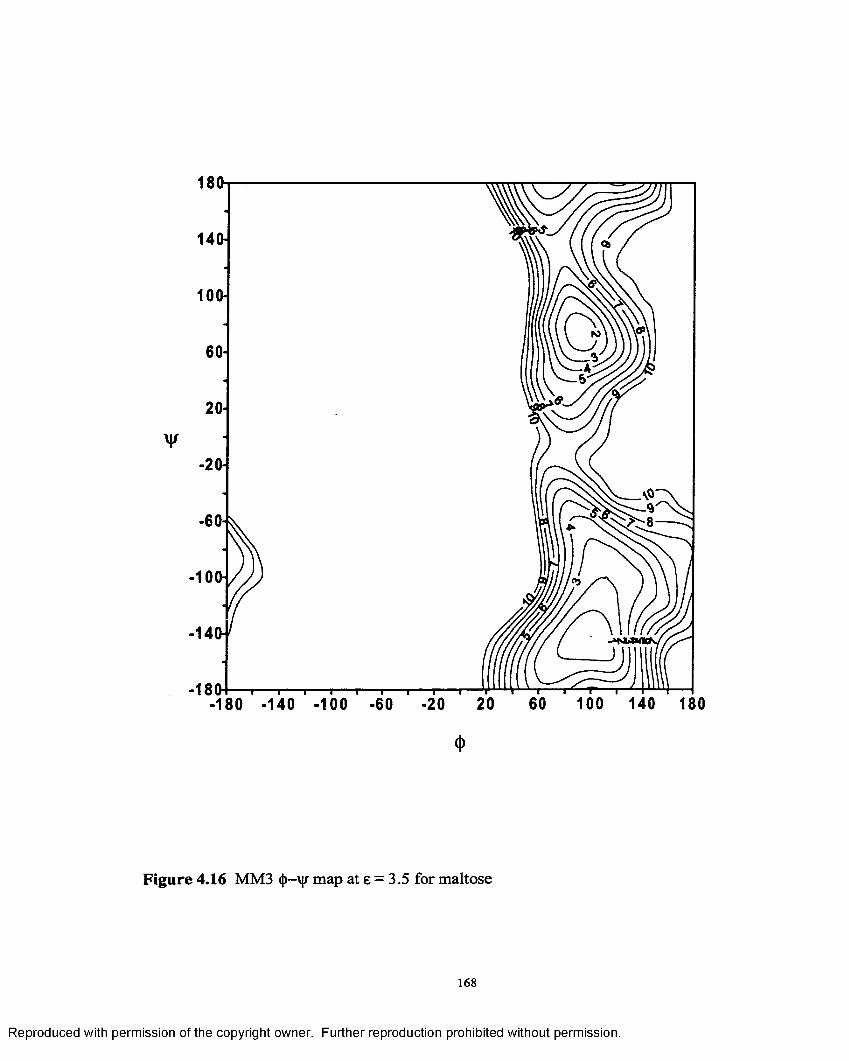
180-
1 4(h
10(H
¥-20
-60
-iooH
-14
-186100 140 180-20-180
<l>
Figure 4.16 MM3 (j)—vjr map at e = 3.5 for maltose
168
Reproduced with permission of the copyright owner. Further reproduction prohibited without permission.
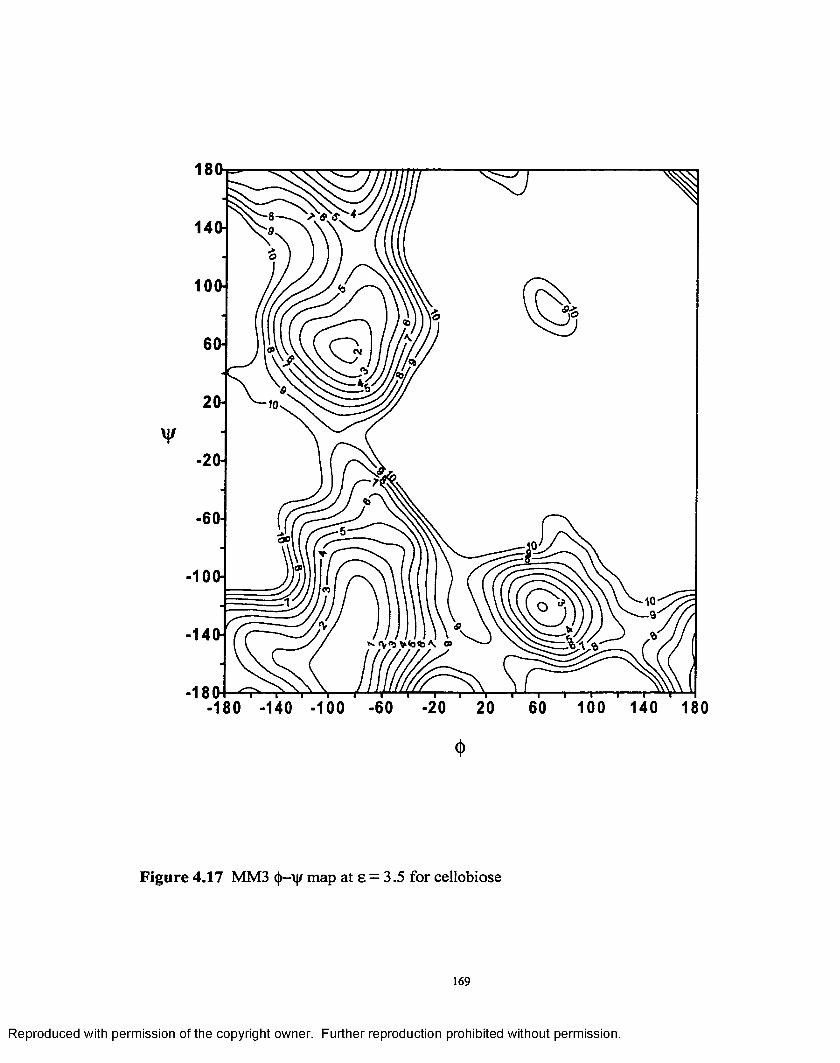
180
iooH
60H
2 (H
¥-2 0 H
-60H
-10W
CD
-180-180 -140 -100 -60 -20 20 60 100 140 180
<l>
Figure 4.17 MM3 <|>-\j/ map at e = 3.5 for cellobiose
Reproduced with permission of the copyright owner. Further reproduction prohibited without permission.
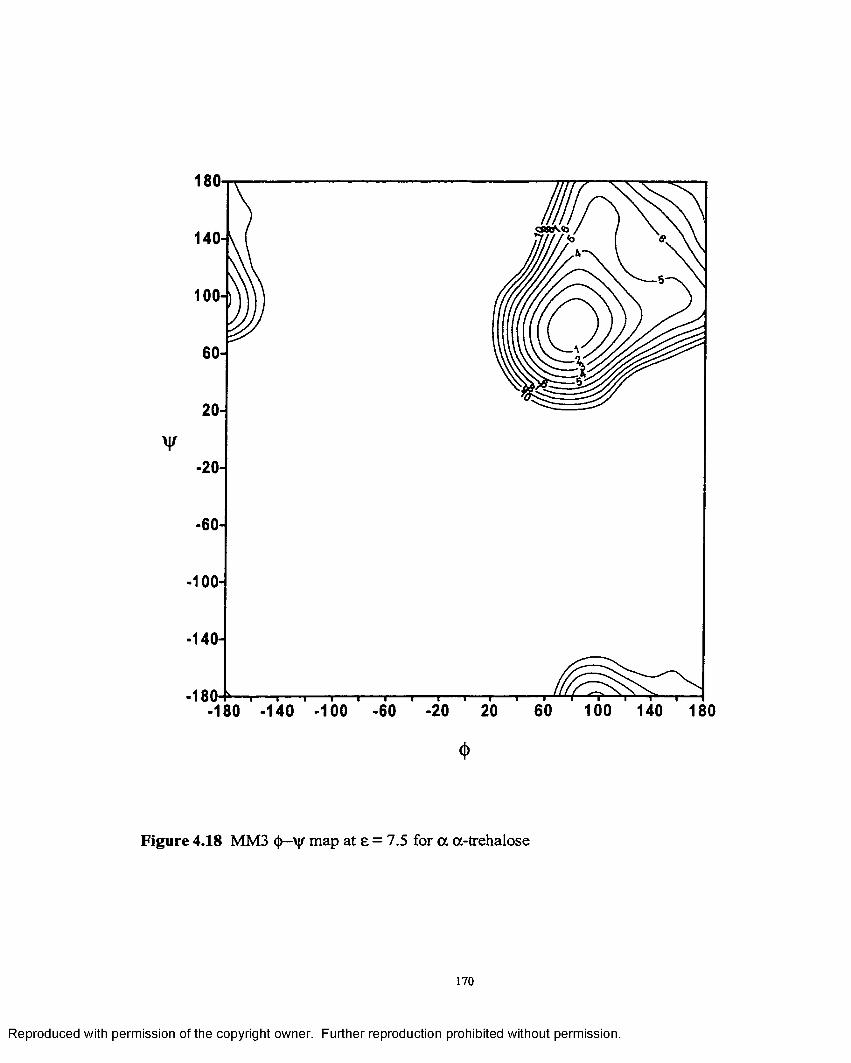
180
140-
1 0 0 -
60-
2 0 -
V-2 0 -
-60-
-1 0 0 -
-140-
-180-180 -140 -100 -60 -20
4>
Figure 4.18 MM3 <J>—■'V|/ map at e = 7.5 for a a-trehalose
Reproduced with permission of the copyright owner. Further reproduction prohibited without permission.
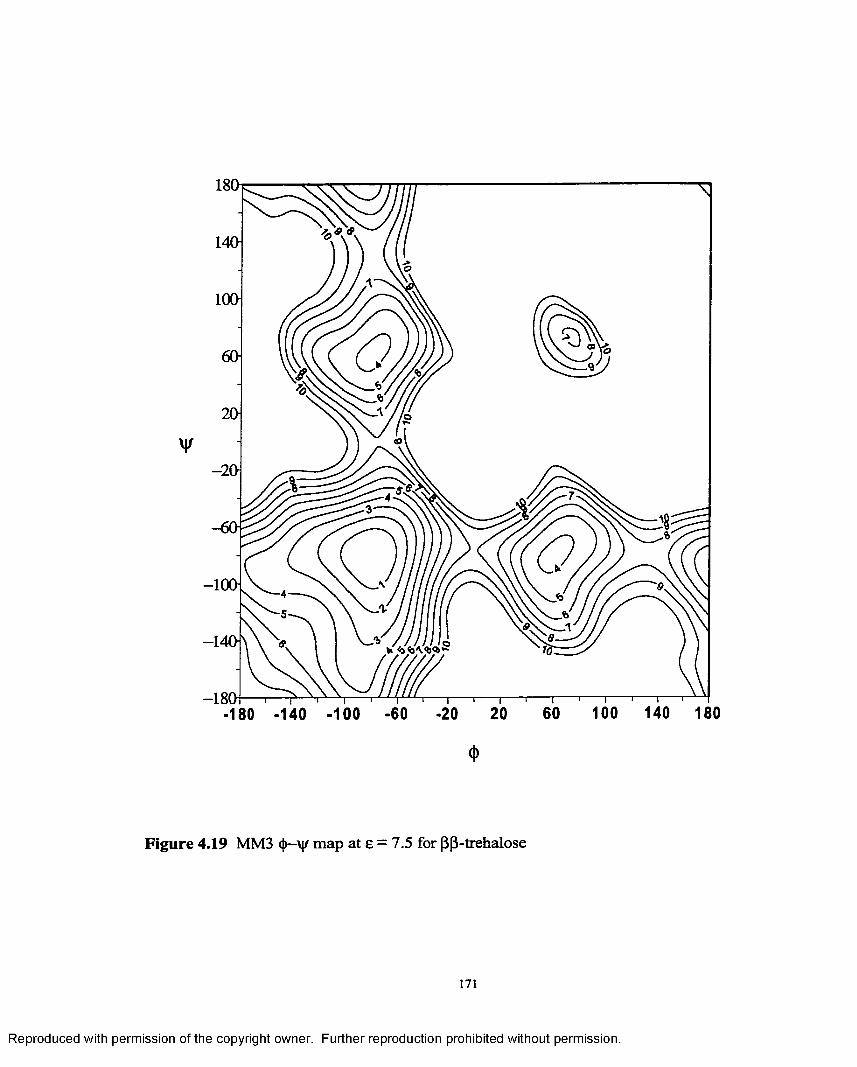
1 8 0
140^
¥
- 1 0 0 ]
-1401
-180100 140 180
Figure 4.19 MM3 <{>—\j/ map at e = 7.5 for [3 (3-trehalose
171
Reproduced with permission of the copyright owner. Further reproduction prohibited without permission.
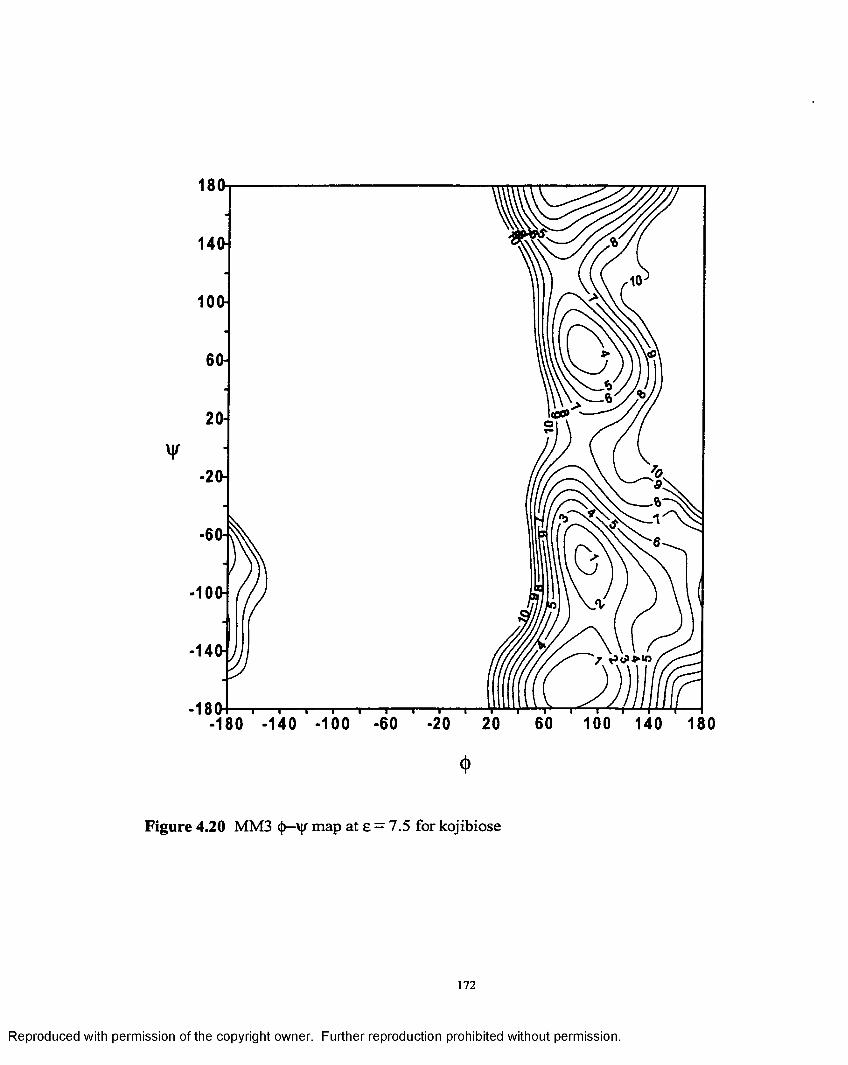
i s a
60H
I tg&2(H
¥-2 (H
-1 0 W
7
■isa-180 -140 -100 -60 -20 100 140 180
0
Figure 4.20 MM3 §—\\r map at e = 7.5 for kojibiose
172
Reproduced with permission of the copyright owner. Further reproduction prohibited without permission.
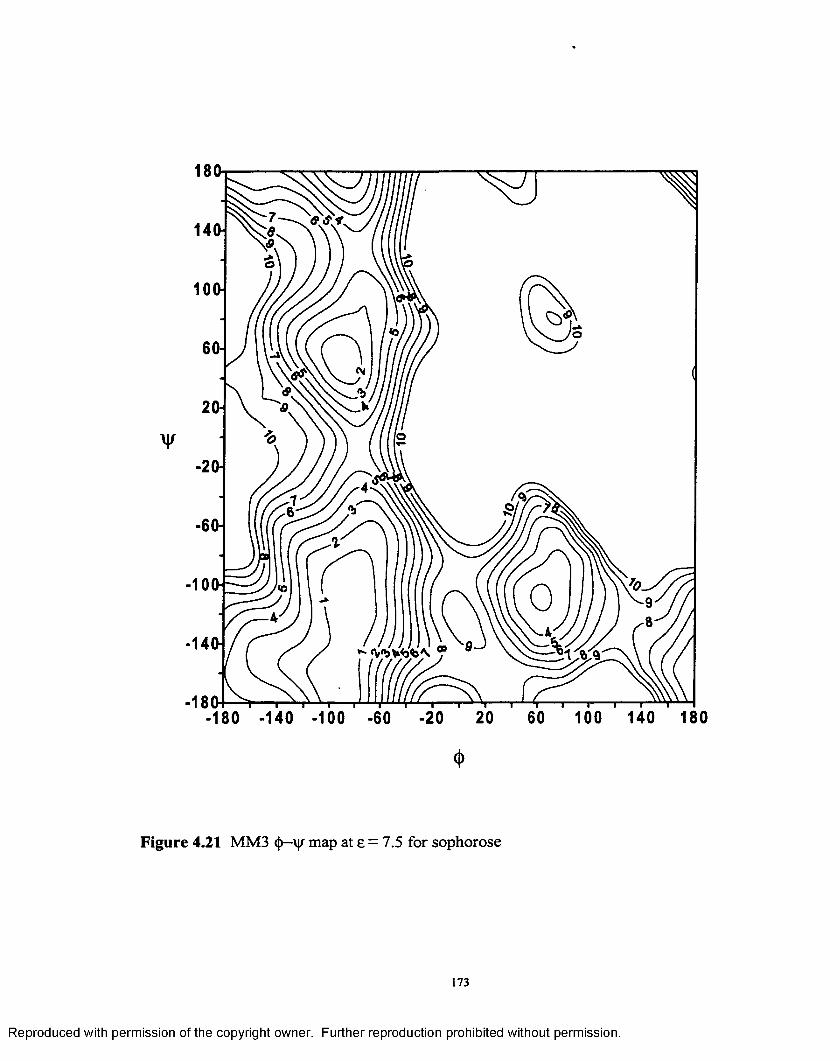
i s a
1 0 CH
6 (H
2CH
-60-I
-1 0 W
-20 21- i s a
100 140 180
<l>
Figure 4.21 MM3 <J)—ij/ map at e = 7.5 for sophorose
173
Reproduced with permission of the copyright owner. Further reproduction prohibited without permission.
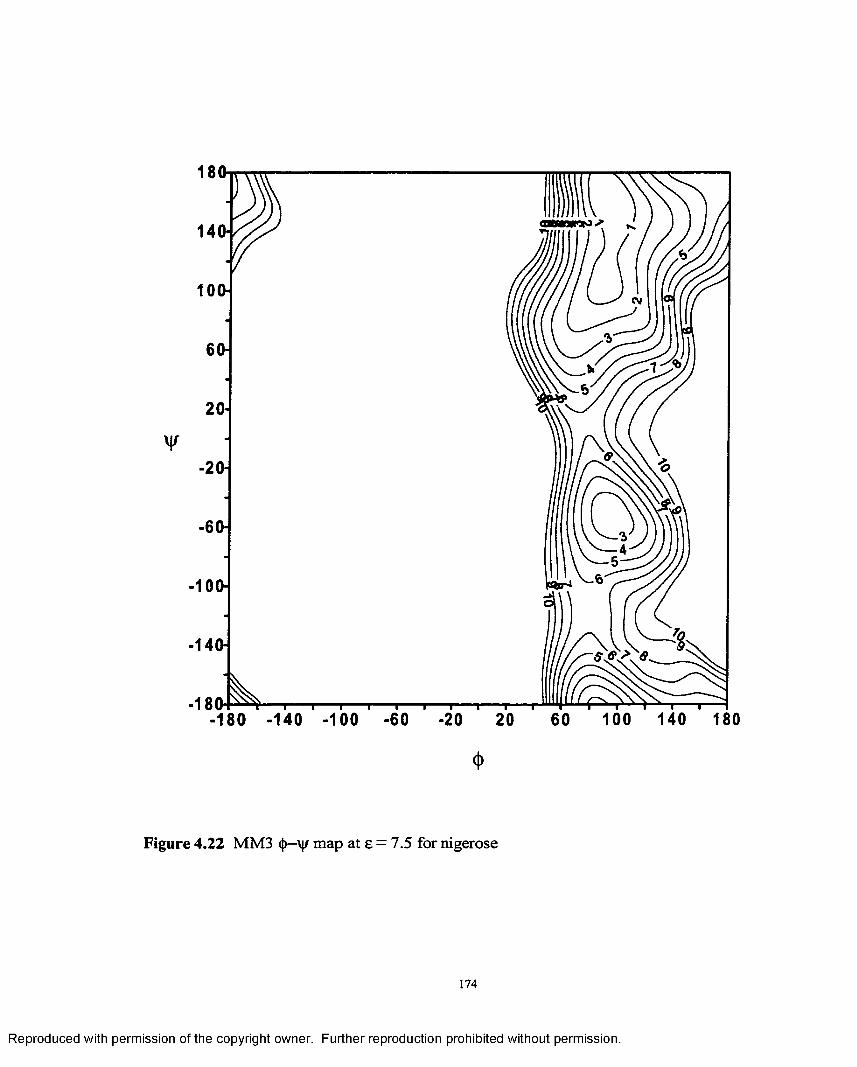
180-
140
100 -
60-
2 0 -
¥-2 0 -
- 60-
-100
-140
-180140-20 60
<l>
Figure 4.22 MM3 (j>—'vj/ map at e = 7.5 for nigerose
174
Reproduced with permission of the copyright owner. Further reproduction prohibited without permission.
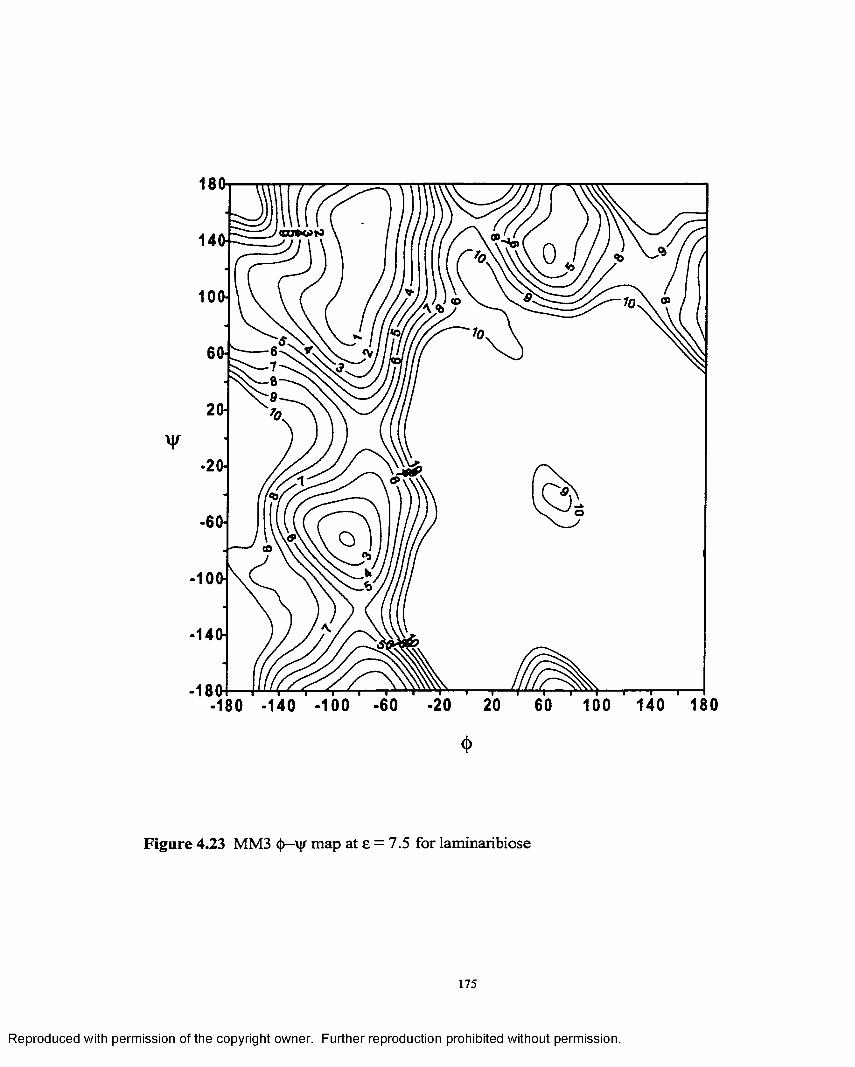
180
1 0 0 H <0
6(H
•2(H
-60H
-1 0 W
-14(h
-180100 -60 -20 20 60 100 140 180
<l>
Figure 4.23 MM3 <j)—vj/ map at e = 7.5 for laminaribiose
175
Reproduced with permission of the copyright owner. Further reproduction prohibited without permission.
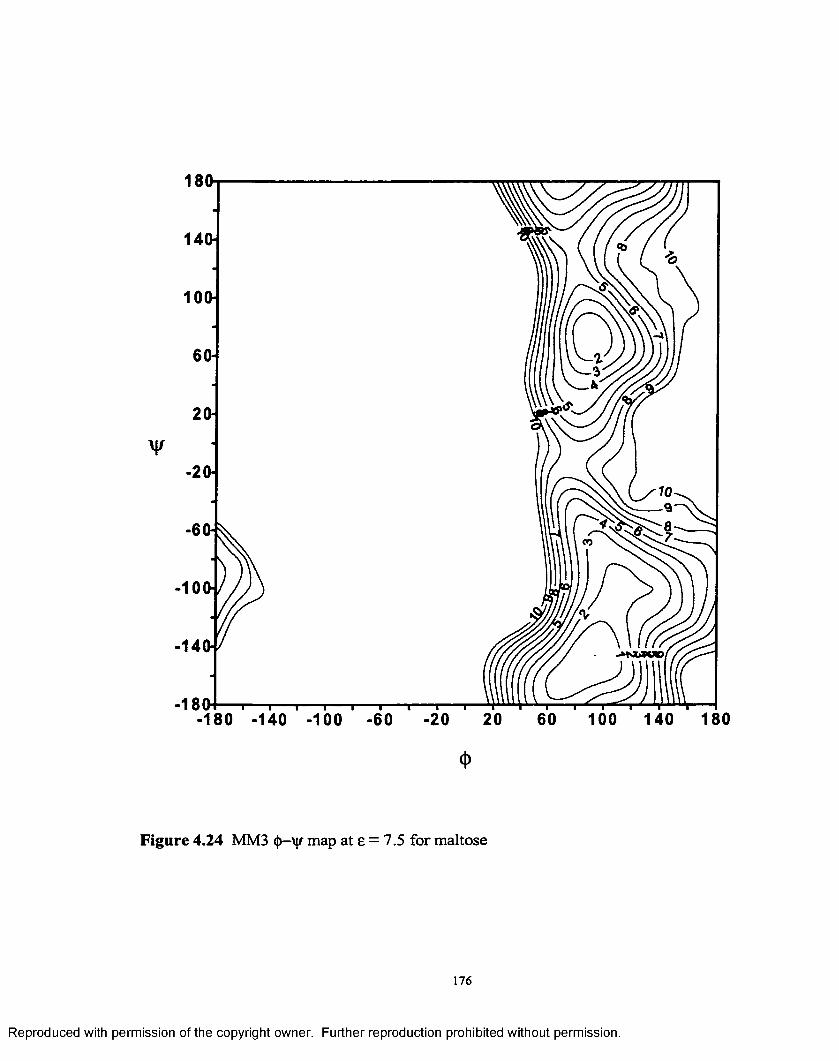
180
140
1 0 0 -
6 0
2 0
¥-2 0 -
-140
-18060 100 140 180180 -140 -100 -60 -20 2 0
<t>
Figure 4.24 MM3 <j)— map at e = 7.5 for maltose
176
Reproduced with permission of the copyright owner. Further reproduction prohibited without permission.
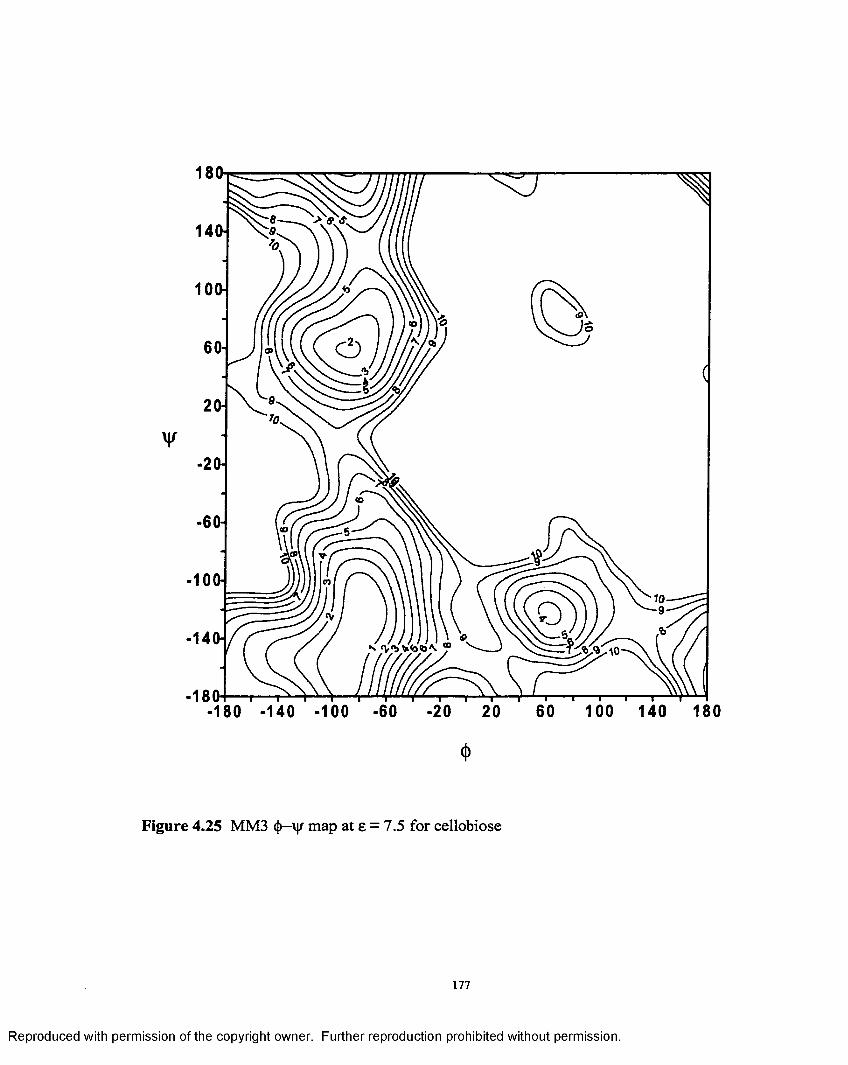
180
14(H
10CH
60H ©
20H
¥-20H
-6 0 i®
-100H
-140H K «vVvV<bX ®
-180-1— .— — (J . n u t f / f ,— PJL -180 -140 -100 -60 -20 20 60 100 140 180
«>
Figure 4.25 MM3 <{>— map at e = 7.5 for cellobiose
Reproduced with permission of the copyright owner. Further reproduction prohibited without permission.
is very little strength accorded to hydrogen bonding. Like the native molecule there is
only one low energy minimum at a <j>,\j/= 79.7 °,79.5°. It is different from maltose and
cellobiose which have very viable secondary minima. The energy surface is symmetrical
about the diagonal where <{)=\ir. This is the most sterically restricted of all the 2-acetal-
bond linked glucose-glucose disaccharides.
Permethylated B.{3 trehalose
The relaxed residue map o f permethylated (3, {3-trehalose is shown in figure 4.27.
Like for the native molecule there are three low energy regions, with one o f the
secondary minima lying in an intersecting trough. The 1 kcal contour is much smaller
than the corresponding contour at e=1.5 because of the inability o f the permethylated
disaccharide to form hydrogen bonds in contrast to the native molecule. The global
minimum is at -80.3 °, -80.2°. The second minimum lies at a higher energy within
the same trough as the global minimum at = -82.8, 62.6. The third minimum lies in
the intersecting trough at <{>,\|/ = 67.7 °, -77.10 .
For the reducing disaccharides shown in figures 4.28-4.33 the general trend is that
they all have three low energy regions with the exception of maltose that has two low
energy regions and laminaribiose has four low energy regions. The axial-equatorial
disaccharides kojibiose, nigerose and maltose have their low energy regions lying in the
same trough. In the case o f kojibiose all the three low energy regions lie along the same
line in the \\f direction while for nigerose and maltose they do not. The diequatorial
disaccharides sophorose, laminaribiose and cellobiose also exhibit a similar trend.
Sophorose and cellobiose have two o f the three low energy minima lying in the same
trough with a third minimum in an intersecting trough. Laminaribiose has three o f the
178
Reproduced with permission of the copyright owner. Further reproduction prohibited without permission.
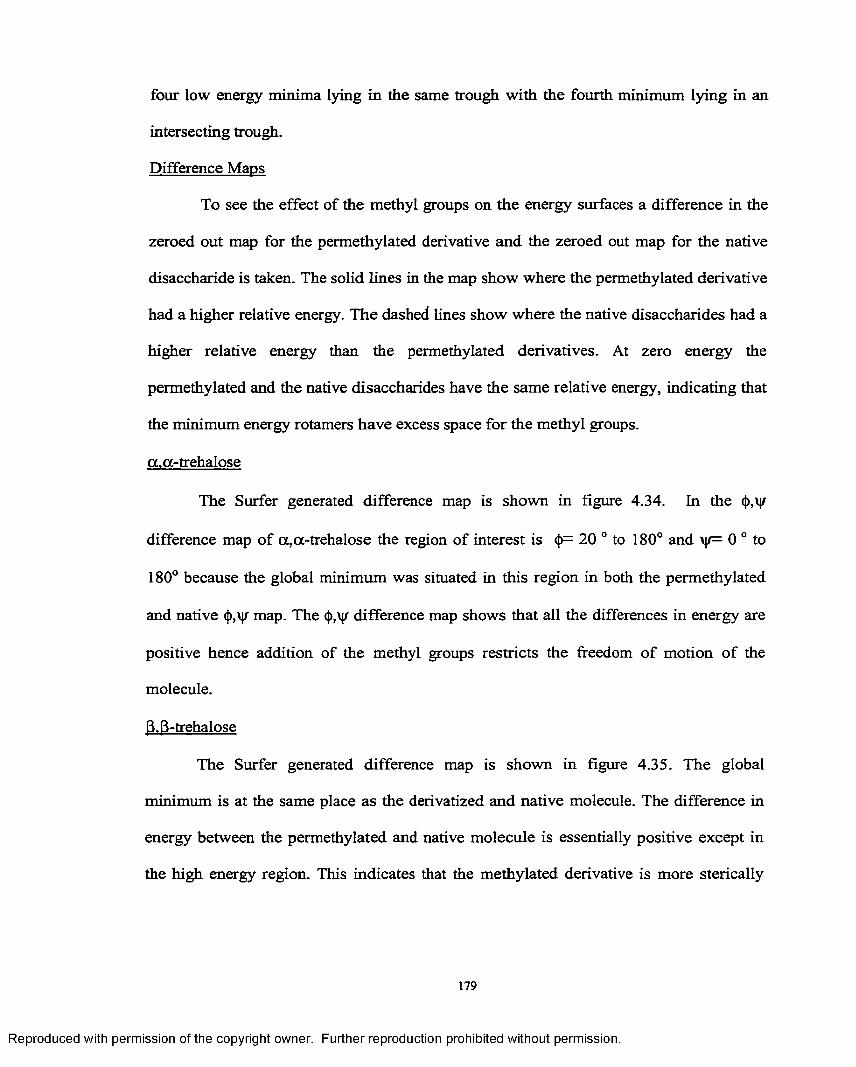
four low energy minima lying in the same trough with the fourth minimum lying in an
intersecting trough.
Difference Maps
To see the effect of the methyl groups on the energy surfaces a difference in the
zeroed out map for the permethylated derivative and the zeroed out map for the native
disaccharide is taken. The solid lines in the map show where the permethylated derivative
had a higher relative energy. The dashed lines show where the native disaccharides had a
higher relative energy than the permethylated derivatives. At zero energy the
permethylated and the native disaccharides have the same relative energy, indicating that
the minimum energy rotamers have excess space for the methyl groups.
a.q-trehalose
The Surfer generated difference map is shown in figure 4.34. In the
difference map of a,a-trehalose the region of interest is (f>= 2 0 0 to 180° and \\r= 0 0 to
180° because the global minimum was situated in this region in both the permethylated
and native map. The §,\\r difference map shows that all the differences in energy are
positive hence addition of the methyl groups restricts the freedom of motion o f the
molecule.
p.p-trehalose
The Surfer generated difference map is shown in figure 4.35. The global
minimum is at the same place as the derivatized and native molecule. The difference in
energy between the permethylated and native molecule is essentially positive except in
the high energy region. This indicates that the methylated derivative is more sterically
Reproduced with permission of the copyright owner. Further reproduction prohibited without permission.
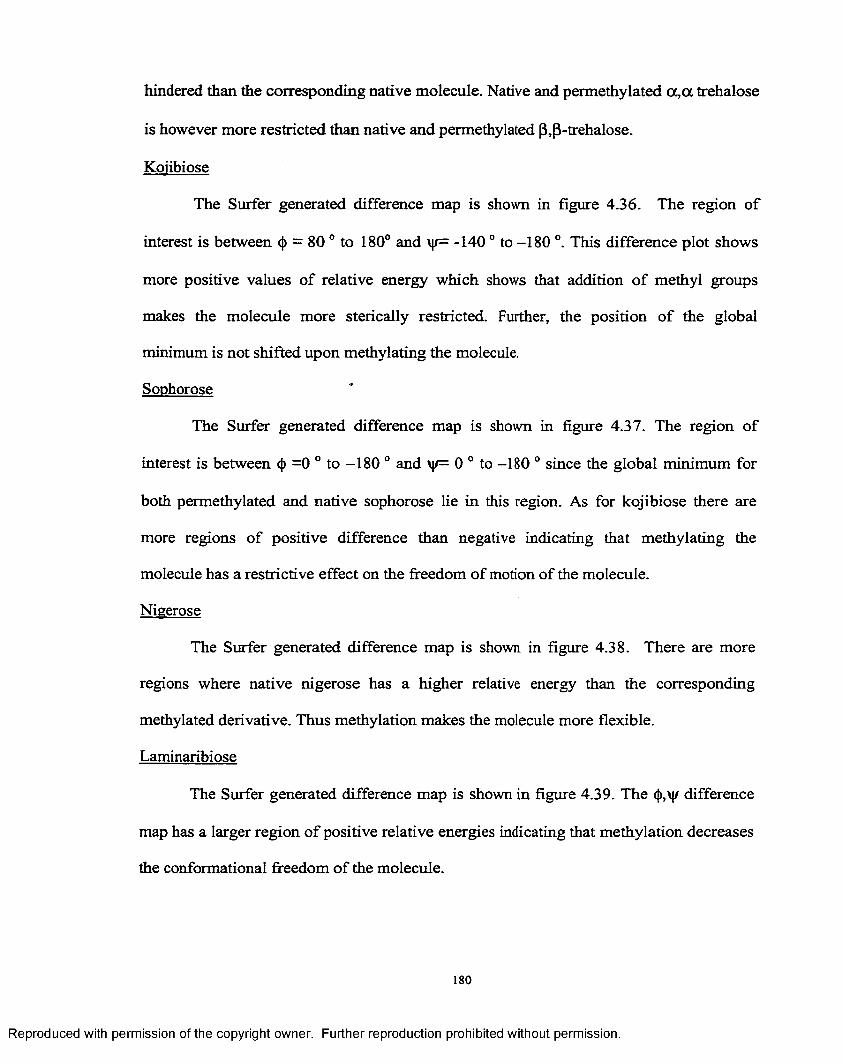
hindered than the corresponding native molecule. Native and permethylated a , a trehalose
is however more restricted than native and permethylated (3,P-trehalose.
Kojibiose
The Surfer generated difference map is shown in figure 4.36. The region of
interest is between <j) = 80 0 to 180° and \|/= -1400 to -180 °. This difference plot shows
more positive values of relative energy which shows that addition o f methyl groups
makes the molecule more sterically restricted. Further, the position of the global
minimum is not shifted upon methylating the molecule.
Sophorose
The Surfer generated difference map is shown in figure 4.37. The region of
interest is between <}> = 0 ° to —180 0 and \jr= 0 0 to -180 0 since the global minimum for
both permethylated and native sophorose lie in this region. As for kojibiose there are
more regions of positive difference than negative indicating that methylating the
molecule has a restrictive effect on the freedom of motion of the molecule.
Nigerose
The Surfer generated difference map is shown in figure 4.38. There are more
regions where native nigerose has a higher relative energy than the corresponding
methylated derivative. Thus methylation makes the molecule more flexible.
Laminaribiose
The Surfer generated difference map is shown in figure 4.39. The <j),\jr difference
map has a larger region o f positive relative energies indicating that methylation decreases
the conformational freedom of the molecule.
Reproduced with permission of the copyright owner. Further reproduction prohibited without permission.
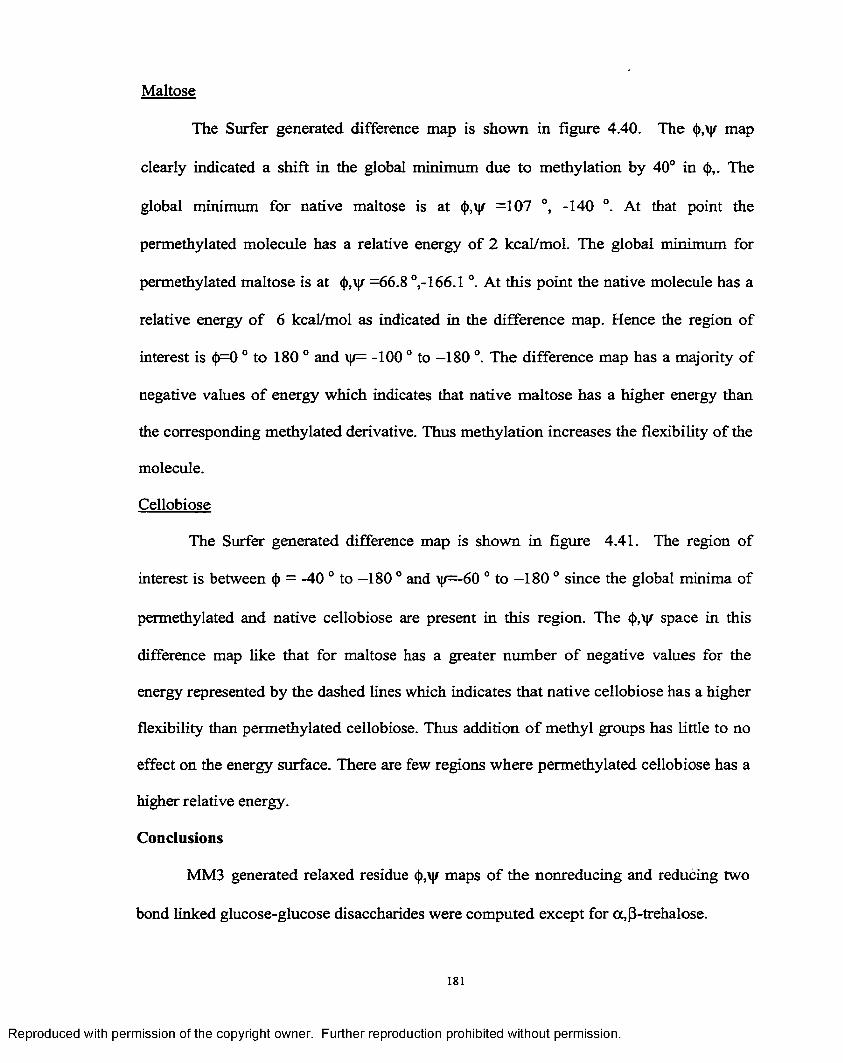
Maltose
The Surfer generated difference map is shown in figure 4.40. The <j),\j/ map
clearly indicated a shift in the global minimum due to methylation by 40° in <}>,. The
global minimum for native maltose is at (j),y =107 °, -140 °. At that point the
permethylated molecule has a relative energy of 2 kcal/mol. The global minimum for
permethylated maltose is at <|),\|/ =6 6 . 8 °,-166.1 °. At this point the native molecule has a
relative energy o f 6 kcal/mol as indicated in the difference map. Hence the region of
interest is <(>=0 0 to 180 0 and i|/= -100 0 to —180 °. The difference map has a majority of
negative values o f energy which indicates that native maltose has a higher energy than
the corresponding methylated derivative. Thus methylation increases the flexibility of the
molecule.
Cellobiose
The Surfer generated difference map is shown in figure 4.41. The region of
interest is between <{> = -40 ° to —180 ° and \|/=-60 0 to —180 ° since the global minima of
permethylated and native cellobiose are present in this region. The space in this
difference map like that for maltose has a greater number o f negative values for the
energy represented by the dashed lines which indicates that native cellobiose has a higher
flexibility than permethylated cellobiose. Thus addition o f methyl groups has little to no
effect on the energy surface. There are few regions where permethylated cellobiose has a
higher relative energy.
Conclusions
MM3 generated relaxed residue <j>,\j/ maps of the nonreducing and reducing two
bond linked glucose-glucose disaccharides were computed except for a,(3-trehalose.
181
Reproduced with permission of the copyright owner. Further reproduction prohibited without permission.
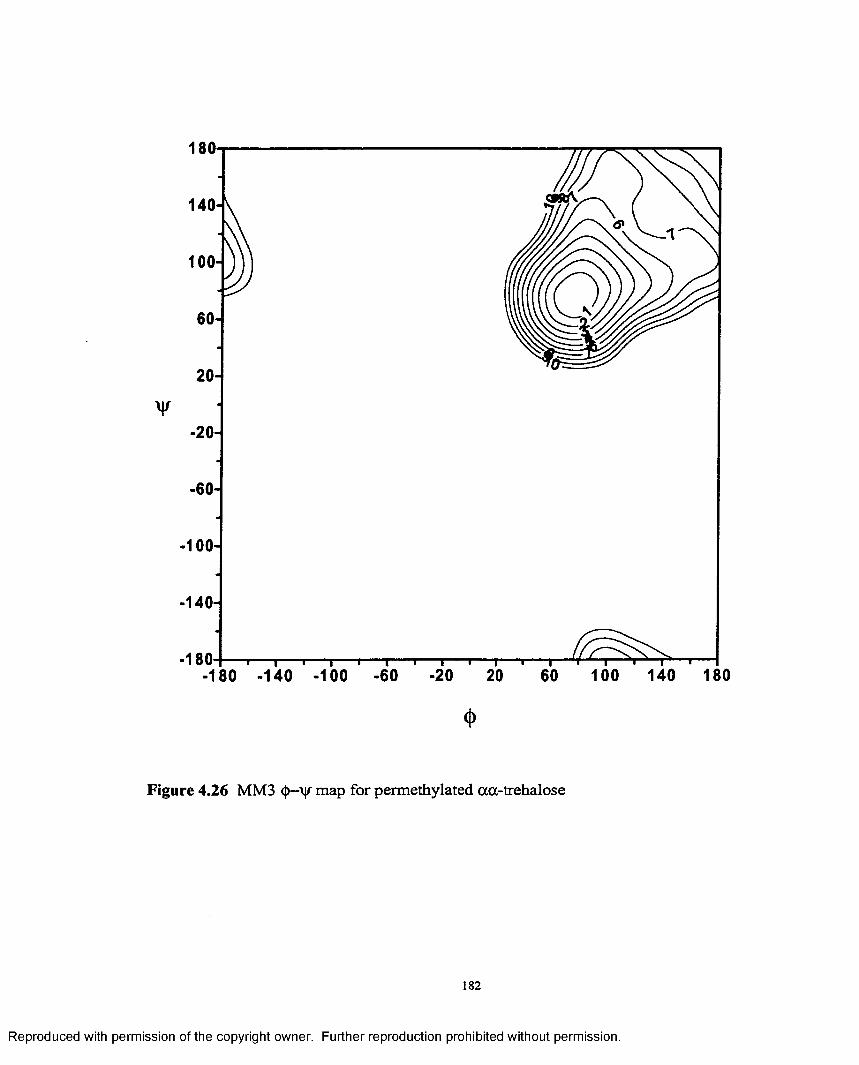
180
140-
100-
60-
2 0 -
¥-2 0 -
-60-
- 100-
-140-
-1 8 OH— i— i— i— i— i— i— i— i— i— t1 -180 -140 -100 -60 -20 20 60 100 140 180
<e
Figure 4.26 MM3 <()—V|r map for permethylated aa-trehalose
Reproduced with permission of the copyright owner. Further reproduction prohibited without permission.
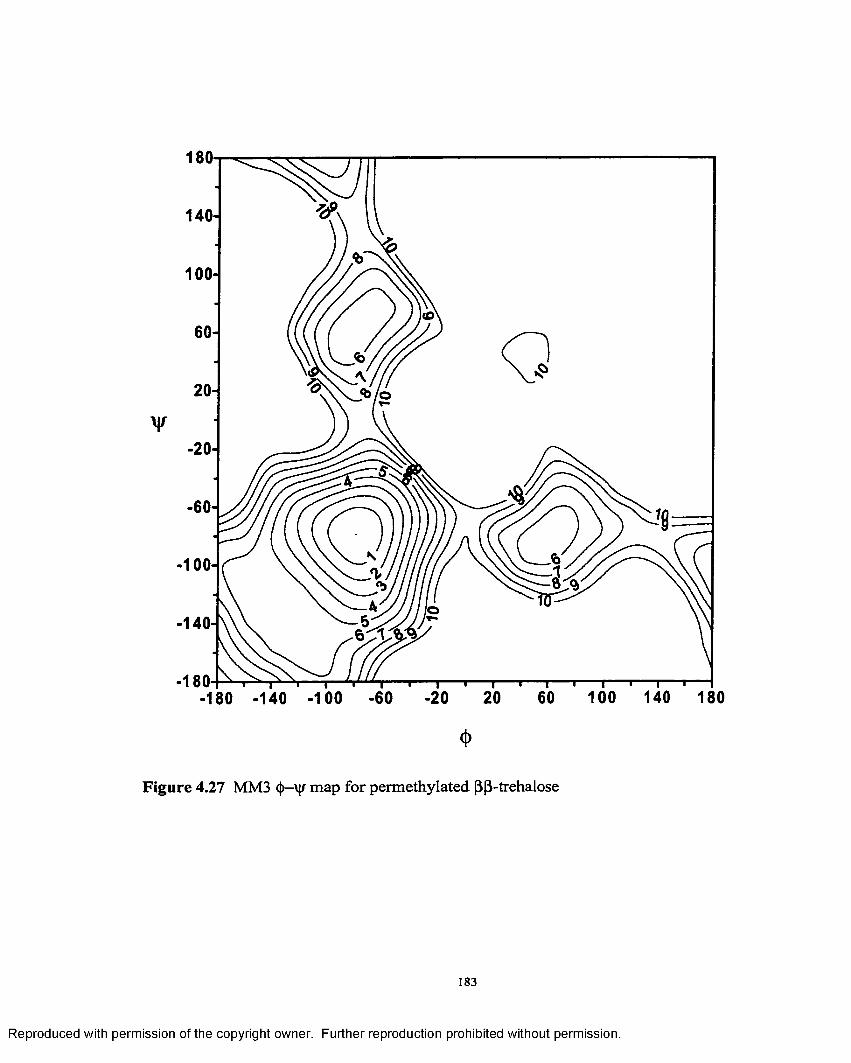
180
140H
100H
60H
20H ‘b /o
¥-20H
-60H
- 1 0 0 H
-140H
-180100 140 180-180 -140 -100 -60 -20
<t>
Figure 4.27 MM3 <|)—\y map for permethylated P(3-trehalose
Reproduced with permission of the copyright owner. Further reproduction prohibited without permission.
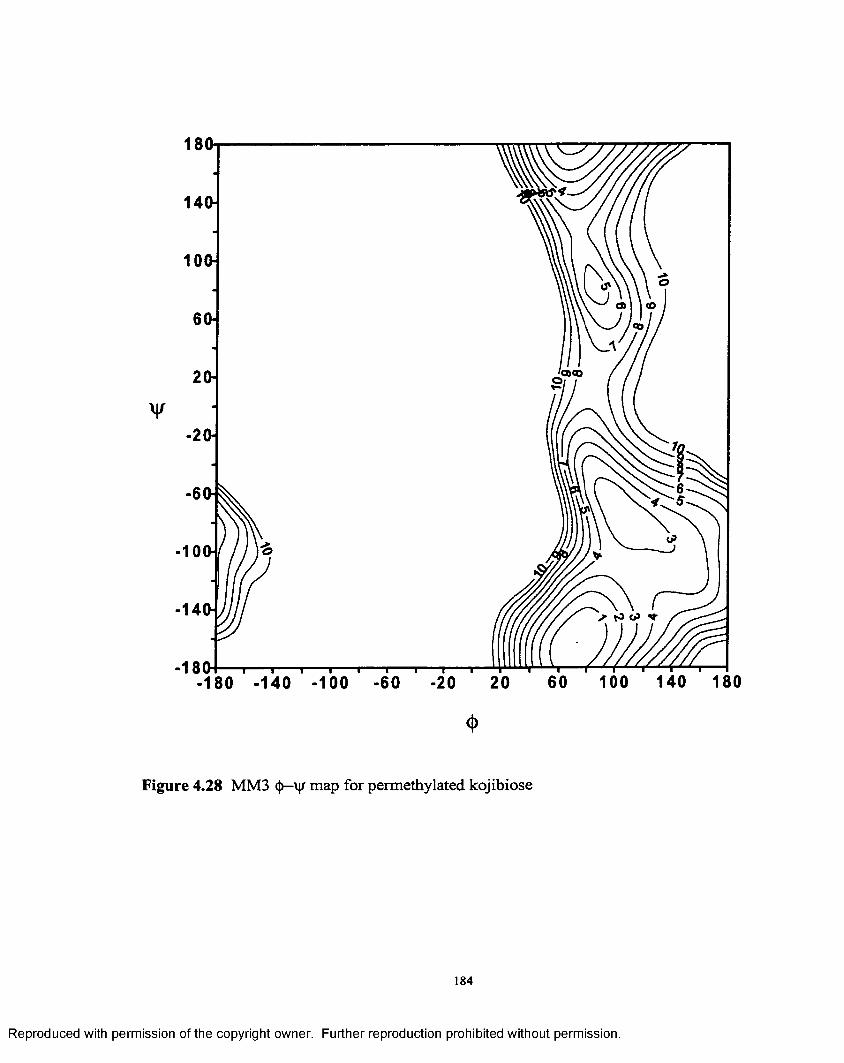
180
140
100
a>6 0
20 o.
¥-20
-140
-18060 100 140 18020-20
«>
Figure 4.28 MM3 <])—\y map for permethylated kojibiose
184
Reproduced with permission of the copyright owner. Further reproduction prohibited without permission.
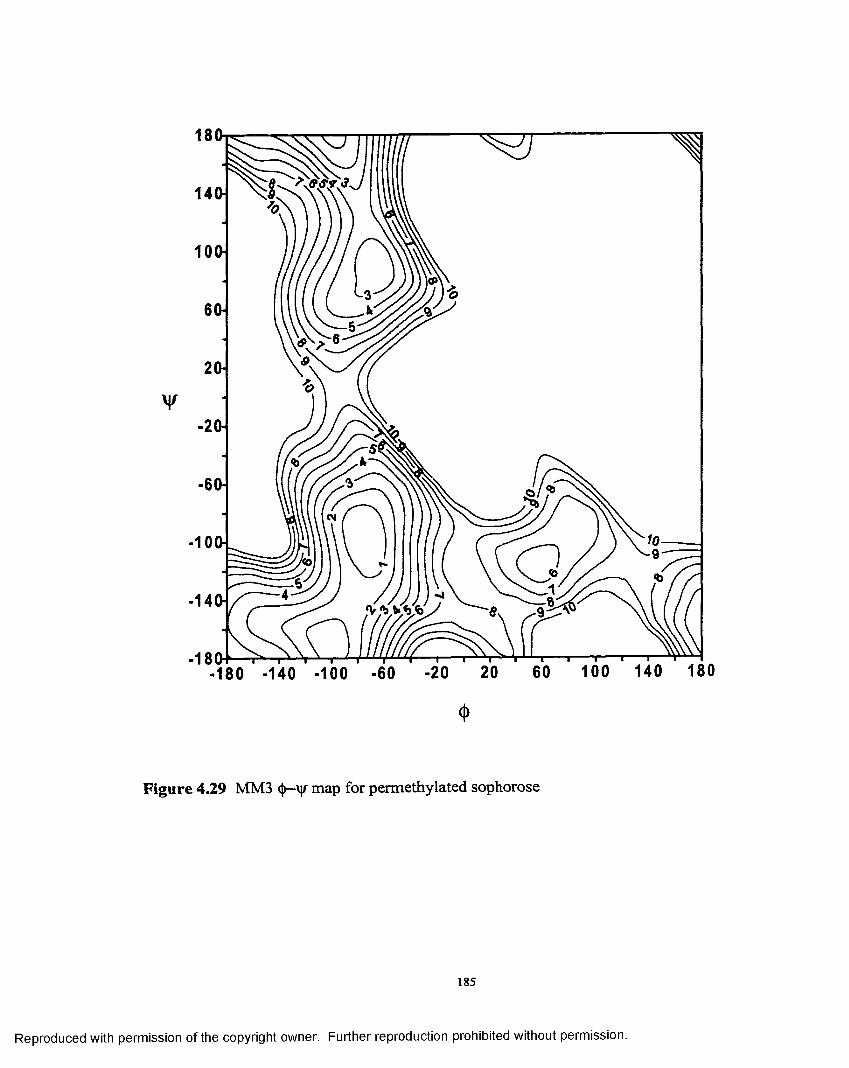
180
140
60-
¥
-60-
-140-<V /b yfijb
-180 100 140 180-20
<l>
Figure 4.29 MM3 (jj-vjr map for permethylated sophorose
185
Reproduced with permission of the copyright owner. Further reproduction prohibited without permission.
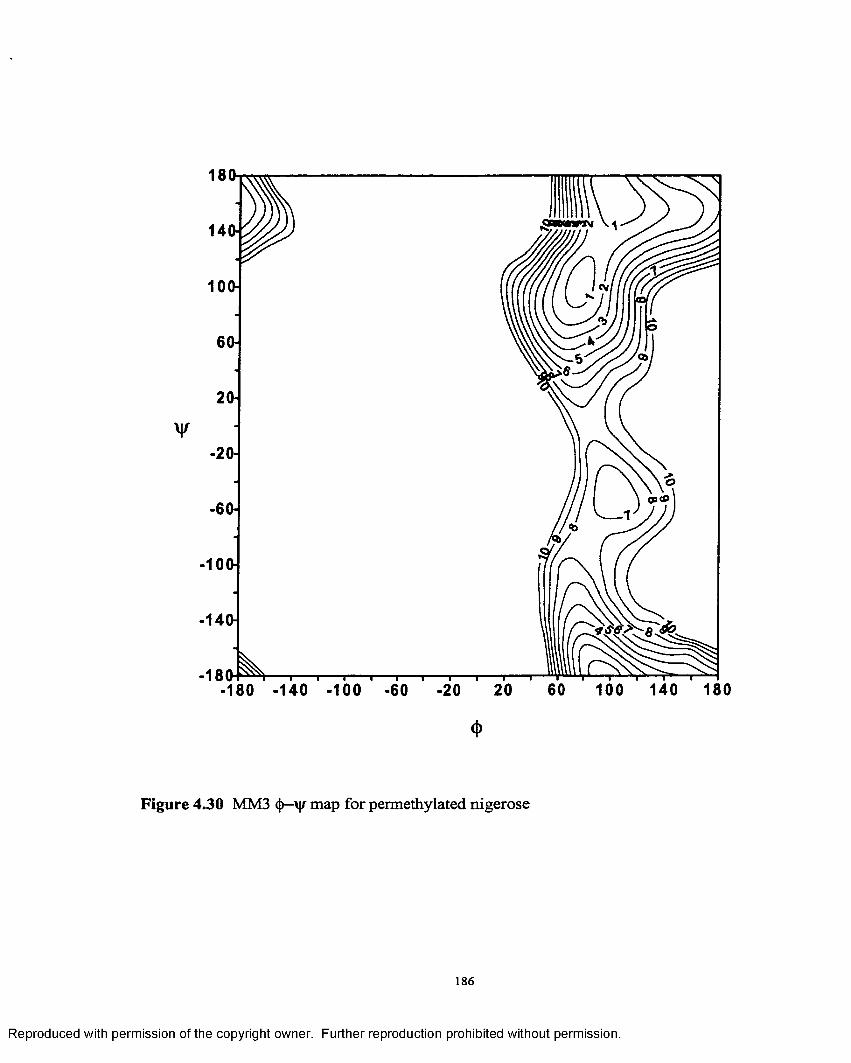
180
140H
10CH
6(H
2<H
V-20H
-6<H
10(H
-180100 140 180-180 -140 -100 -20
Figure 4.30 MM3 <|)—y map for permethylated nigerose
186
Reproduced with permission of the copyright owner. Further reproduction prohibited without permission.
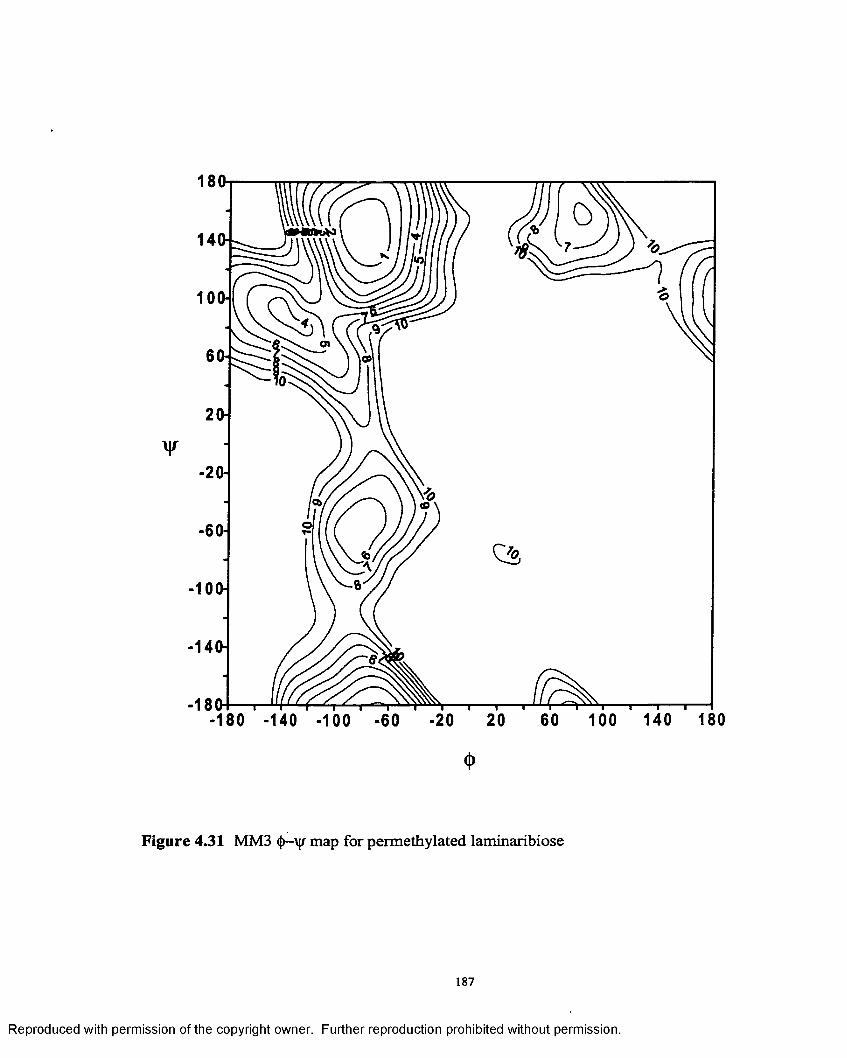
i s a
10CH
2<H
¥-2 Oh
-60H
-1OOH
-140H
- isa100 140 180-20
Figure 4.31 MM3 §—\\r map for permethylated laminaribiose
187
Reproduced with permission of the copyright owner. Further reproduction prohibited without permission.
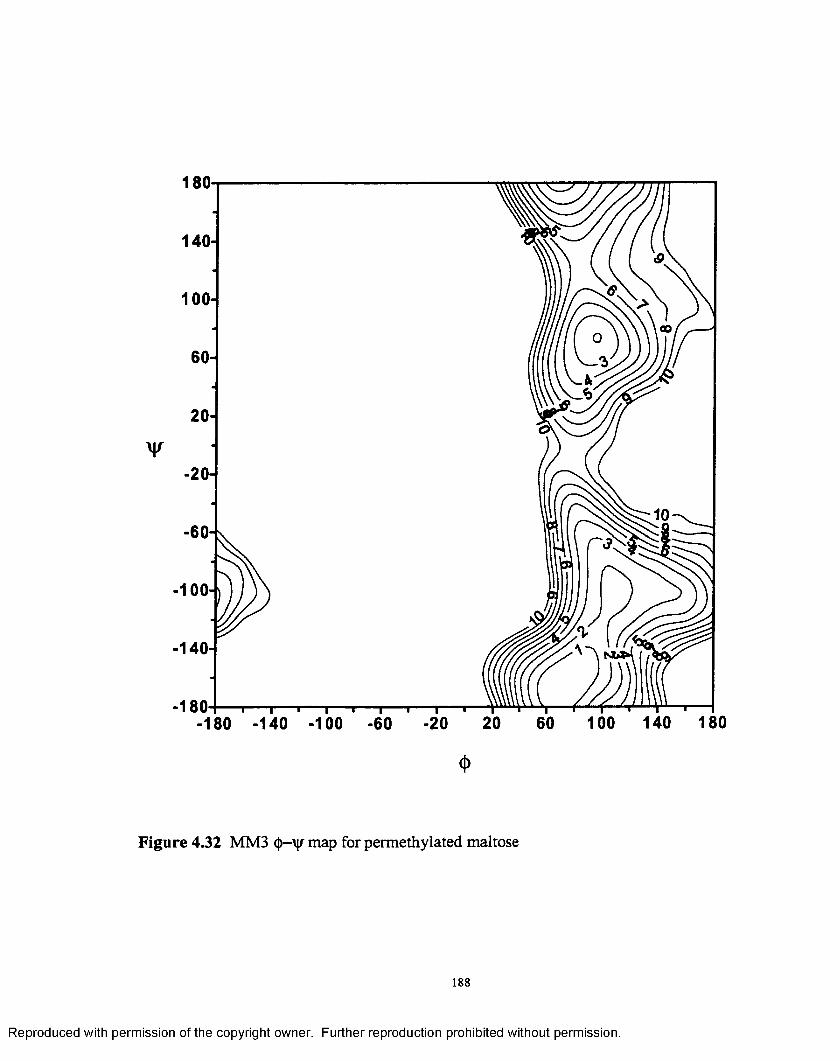
180
140-
100 -
00
60-
20 -
¥- 20 -
-60
- 100 -
-140-
-18060 100 140 18020180 -140 -100 -60 -20
<l>
Figure 4.32 MM3 <{>-\|r map for permethylated maltose
188
Reproduced with permission of the copyright owner. Further reproduction prohibited without permission.
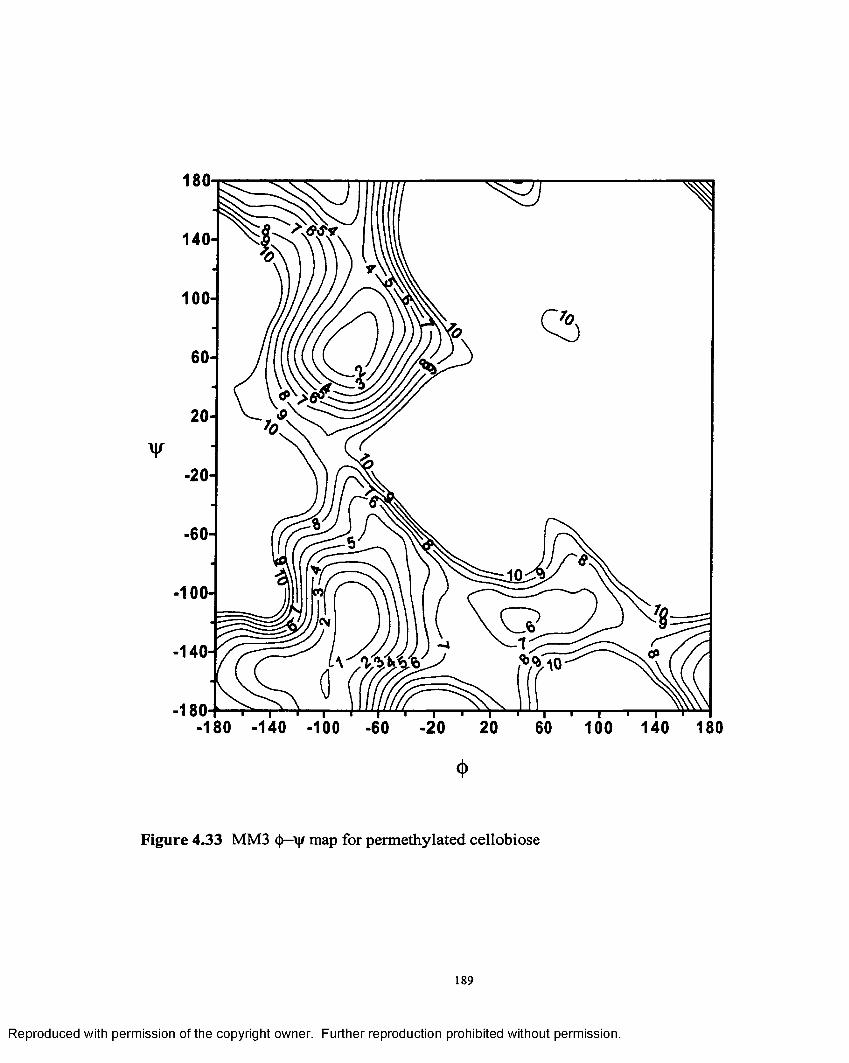
180
140H
iooH
60-j
20H
-20H
-60H
-100H
-140H
-180 -140 -100 -60 20 20 60 100 140 180
<i>
Figure 4.33 MM3 (j>—\|/ map for permethylated cellobiose
Reproduced with permission of the copyright owner. Further reproduction prohibited without permission.
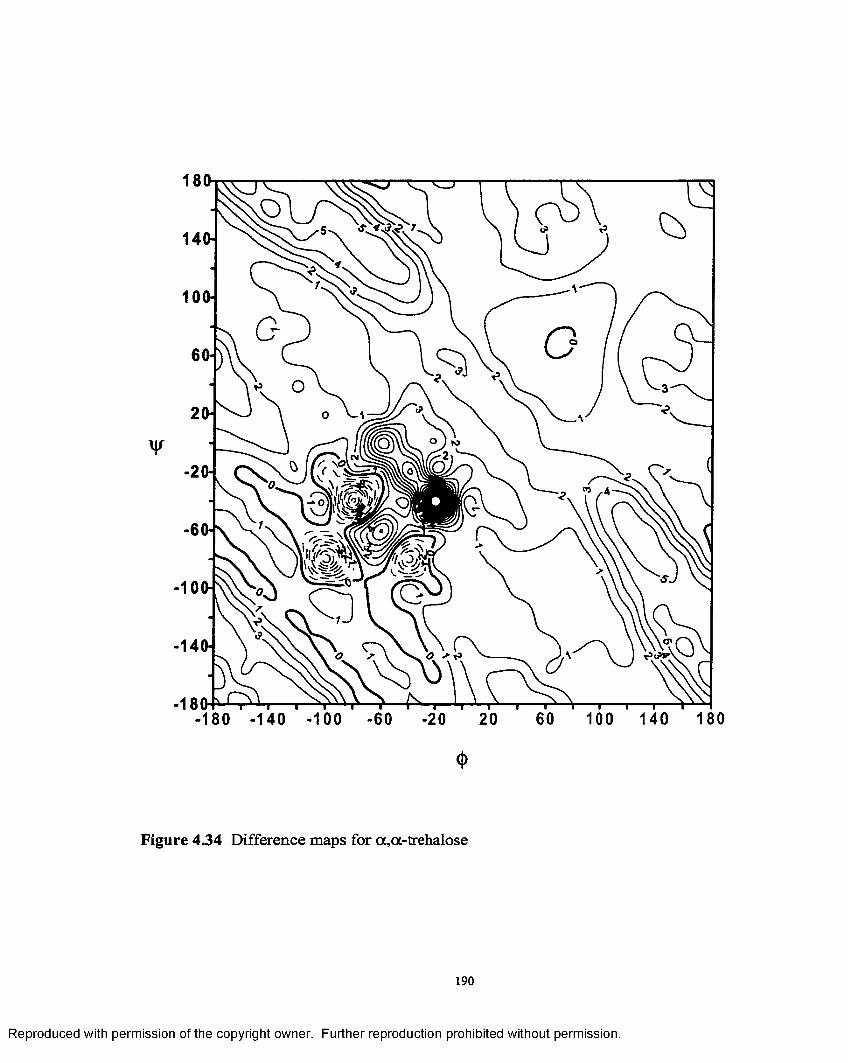
Figure 4.34 Difference maps for oc,a-trehalose
190
Reproduced with permission of the copyright owner. Further reproduction prohibited without permission.
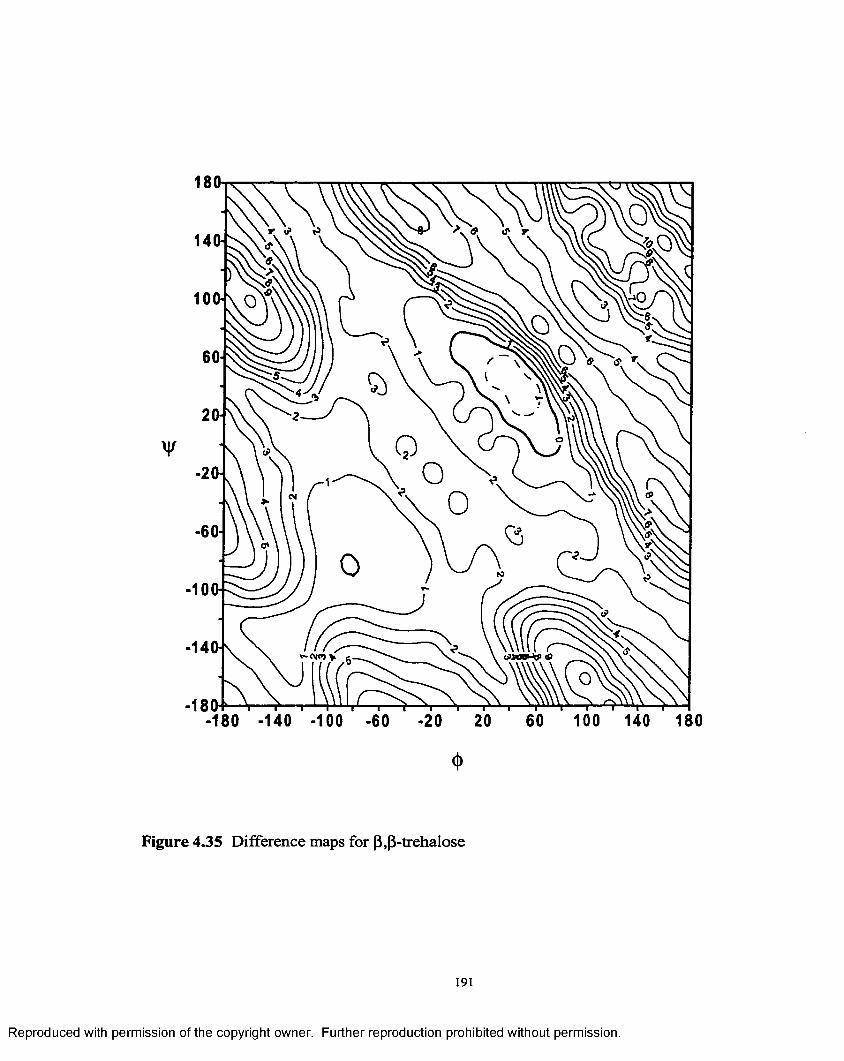
180
14W
10CH
-20
-60-
-10
-140i
-188-180 -140 -100 -60 -20 20 60 100 140 180
*
Figure 4.35 Difference maps for (3,(3-trehalose
191
Reproduced with permission of the copyright owner. Further reproduction prohibited without permission.
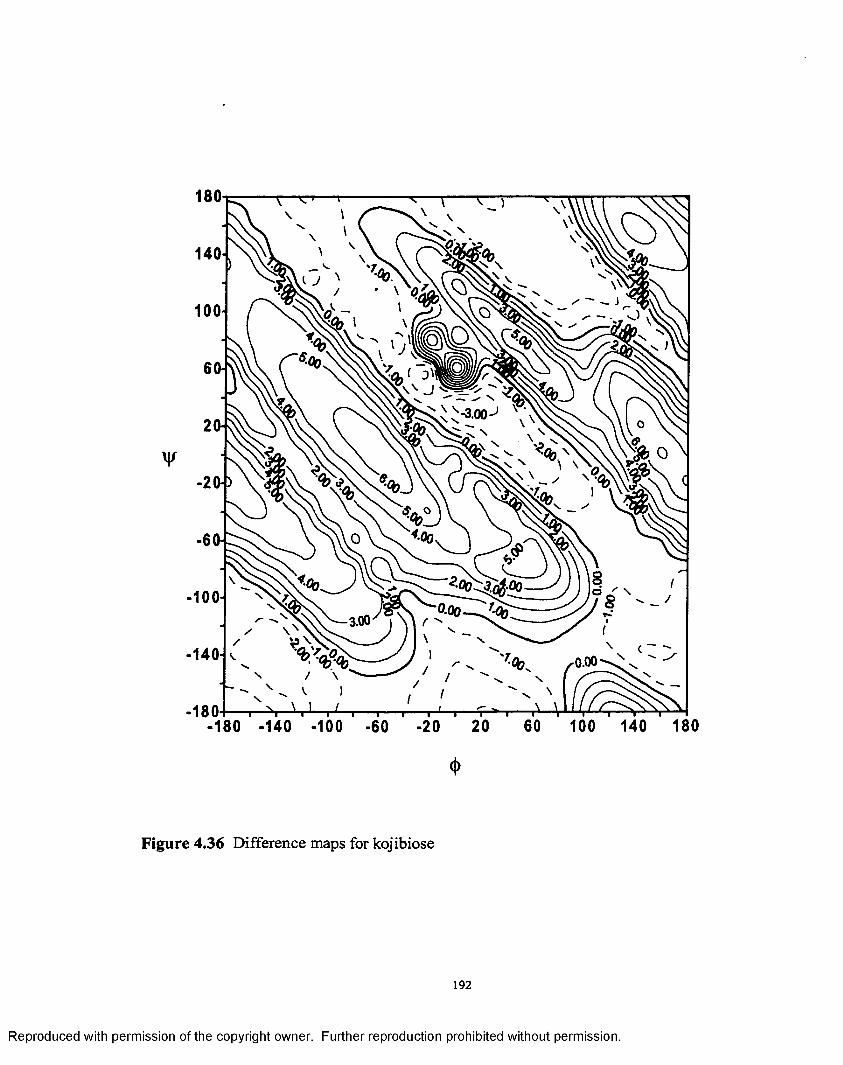
Figure 4.36 Difference maps for kojibiose
192
Reproduced with permission of the copyright owner. Further reproduction prohibited without permission.
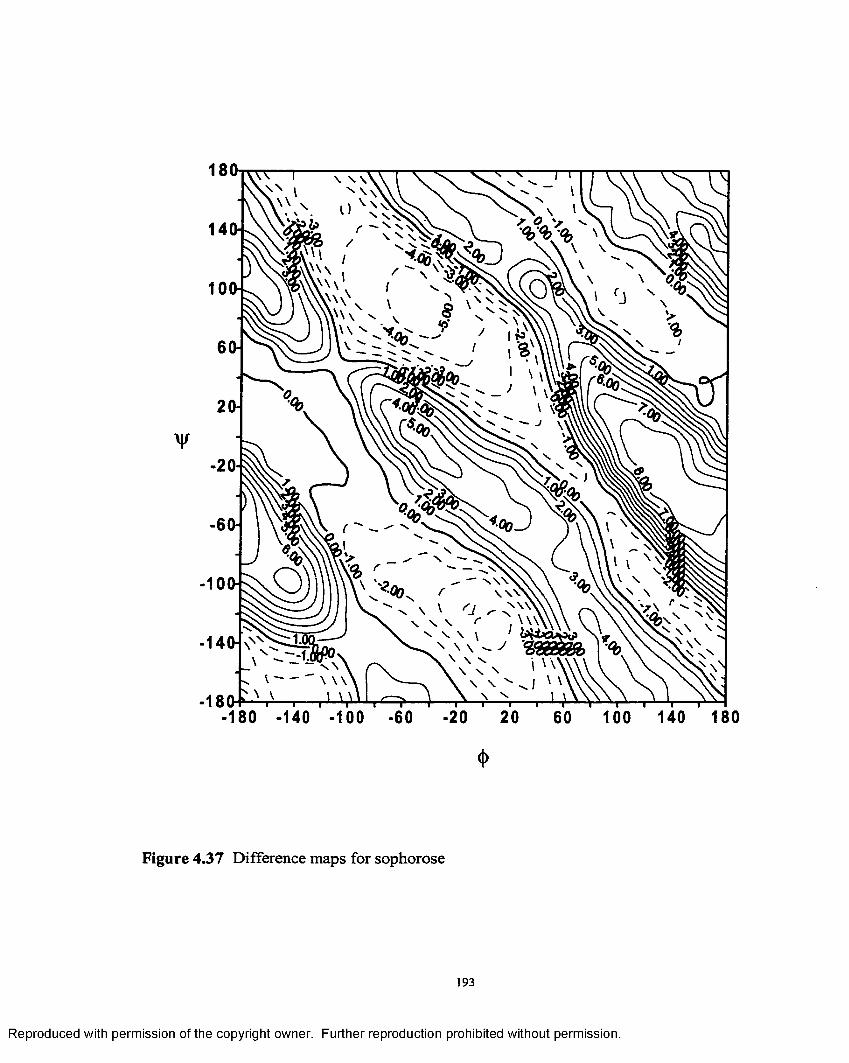
Figure 4.37 Difference maps for sophorose
193
Reproduced with permission of the copyright owner. Further reproduction prohibited without permission.
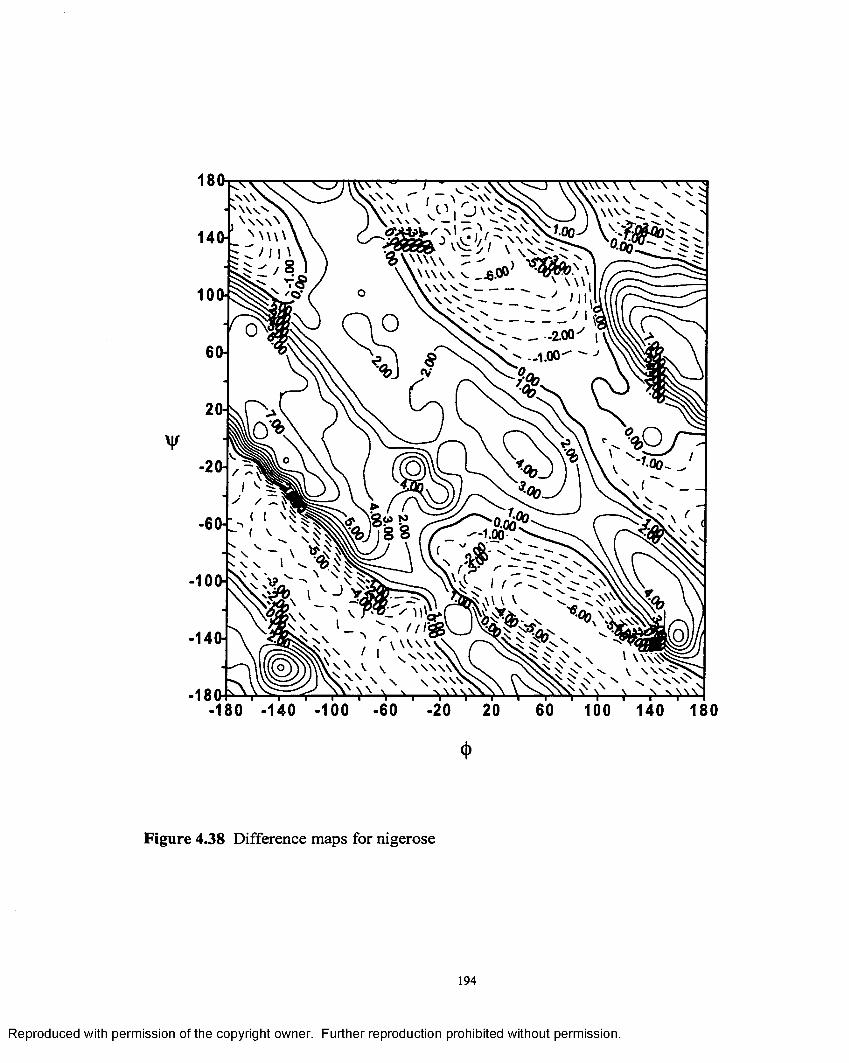
180
14ft
10ft
<x\v^\ \ \ \ \
.s &
W \ \ \
#
6/ , x \ ' W vS
^ xN x
-1 0 ft
-14ft
■180-180 -140 -100 -60 180
<t>
Figure 4.38 Difference maps for nigerose
194
Reproduced with permission of the copyright owner. Further reproduction prohibited without permission.
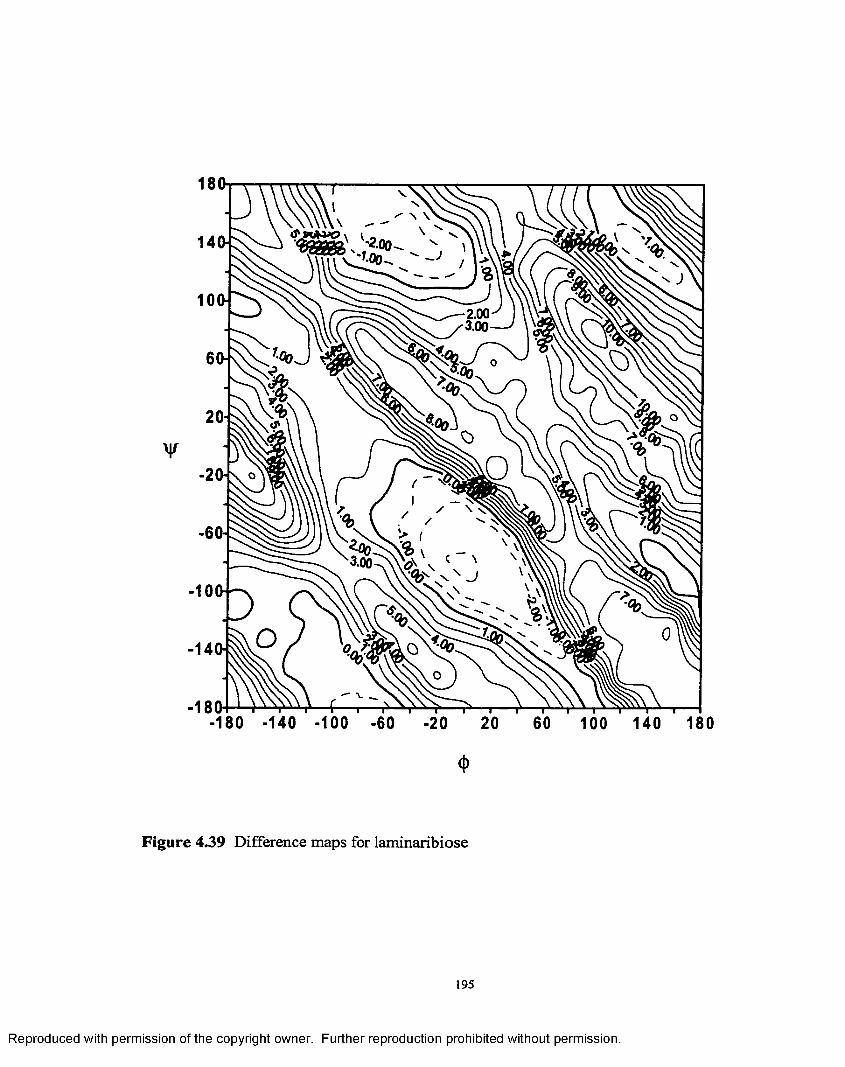
-180 -140 -100 -60 -20 20 60 100 140 180
4>
Figure 4.39 Difference maps for laminaribiose
195
Reproduced with permission of the copyright owner. Further reproduction prohibited without permission.
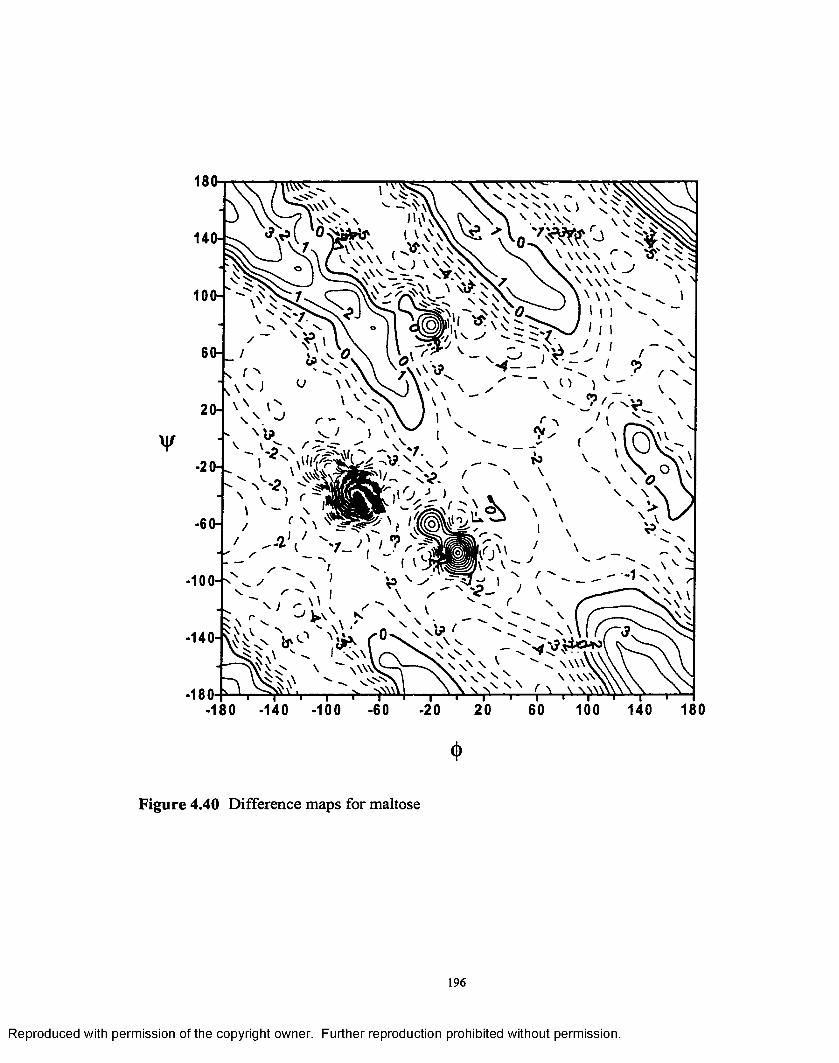
180
¥
y \ \ >. r -s N - • t \ \N N \ \ '•
\ v> ^ N vnv x r ^ \ \ \ W
•100
•140H
-180-180 180
♦
Figure 4.40 Difference maps for maltose
196
Reproduced with permission of the copyright owner. Further reproduction prohibited without permission.
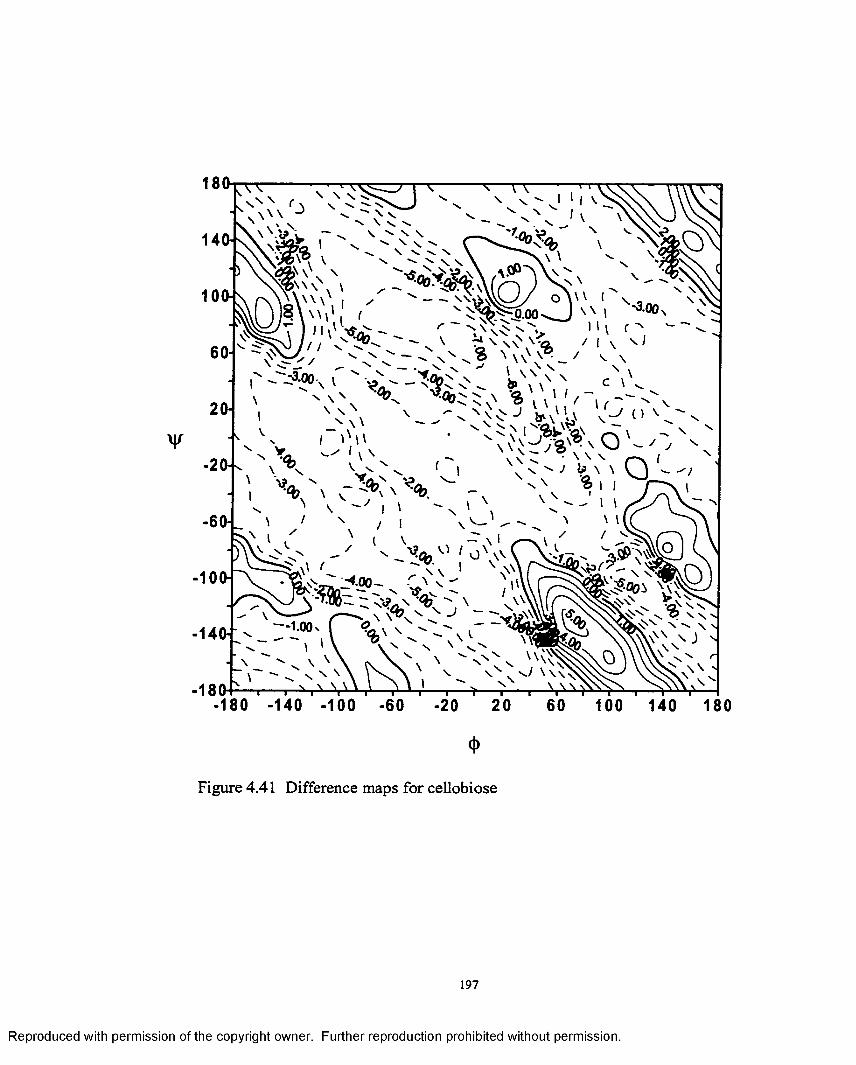
D
v
" I 11 V f
' l \ x^ 0 ^ 3 x \ \ x • _ 7 ^ \' ' - ^ V ^ \ VN> V \
- • ? ! ' ■ * » \ \ \ x, c ' - V ' ' '% n >n'^j VVu [ s o '
' > i M - C > , ' s -
^•00\ I
=&>& ~
■10(W
■140h
-180
% " 1 o \ w ,
: xn\ J \nN
-180 -140 -100 100 140 180
<J>
Figure 4.41 Difference maps for cellobiose
197
Reproduced with permission of the copyright owner. Further reproduction prohibited without permission.
Addition of methyl groups for <x,a and (3,(3—trehalose, kojibiose and sophorose makes the
molecule more conformationally restricted. In contrast permethylation does not have
much of an effect on the energy surfaces of nigerose, laminaribiose, maltose and
cellobiose. However methylation causes a shift in the position o f the global minimum for
both the 1—>3 and 1—>4 linked disaccharides. The flexibility values for the various
disaccharides calculated indicate that diequatorial linkages have a greater flexibility than
the corresponding axial-equatorial linkages.
References
1. Hakomori, S.I. J. Biochem. 1964,55,205
2. Cicanu, I.; Kerek, F. Carb. Res. 1984, 131, 209
3. Mendonca, S.; Cole, R.B.; French, A.D., Johnson, G. P.; Zhu, J.; Cai, Y.; Laine, R.A.In preparation
4. Sasisekharaan, V. Stereochemical Criteria fo r Polypepetides and Proteins. Collagen, Proc. Symp. Madras, India, 1962, Vol. 1060, pp 39-78. Rao, V.S.R., Sundarajan,P.R.; Ramakrishnan, C and Ramachandran, G.N. Conformation in Biopolymer. Academic Press, London, 1963
5. Allinger, N.L.; Rahman, M.; Lii, J.H. J. Am. Chem. Soc. 1990, 112, 8293
6. French, A.D.; Tran, V .H .; Perez, S. ACS Symp. Ser 1989, 430, 120
7. French, A.D.; Tran, V .H .; Perez, S. ACS Symp. Ser 1990, 430, 191
8. Von der Lieth, C.W.; Kozar, T.; Hull, W.E. J. Mol. Str. (Theochem) 1997, 395, 225
9. Rao, V .S.R .; Sundarajan, P.R.; Ramakrishnan, C.; Ramachandran, G.N.Conformation o f Biopolymers, G.N. Ramachandran ed.; Academic Press, New Y ork, London 1967, p721.
10. Rao, V.S.R.; Yathindra, N.; Sundarajan, P.R. Biopolymers 1969, 8, 325
11. Rees, D.A.; Skerrett, R.J. Carb. Res. 1968,7, 334
198
Reproduced with permission of the copyright owner. Further reproduction prohibited without permission.
12. Santis, de P.; Giglio, E.; Liquori, A.M.; Ripamonti, A. Nature, 1965,206,456
13. Brant, D.A.; Flory, P.J. J. Am. Chem. Soc. 1965,87,2791
14. Kitaygorodsky, A.I. Tetrehedron 1961, 14, 230
15. Satyanarayana, B.K.; Rao, V.S.R. Biopolymers 1971, 10, 1605
16. Satyanarayana, B.K.; Rao, V.S.R. Biopolymers 1972, 11, 1379
17. Rees, D.A.; Scott, W.E. J. Chem. Soc.; Series B. 1971,469-479 (1971)
18. Giacomini, M.; Pullman, B.; Maigret, B. Theor. ChimicaActa, 1970, 19, 347
19. Lemieux, R.U.; Bock, K.; Delbaere, L.T. J.; Koto, S; Rao, V.S.R. Can. J. Chem. 1980, 58, 631
20. Thogerson, H.; Lemieux, R.U.; Bock, K.; Meyer, B. Can. J. Chem. 1982, 60,44
21. Perez, S.; Tavaroska, I. Carb. Res. 1986, 149, 389
22. Ha, S.N .; Madsen, L.J.; Brady, J.W. Biopolymers 1988,27, 1927
23. Goebel, C .V .; Dimpfl, W.L.; Brant, D.A. Macromolecules 1970, 3, 644
24. Rees, D.A.; Smith, P.J.C. J. Chem. Soc. Perkin 27 1975, 836
25. Perez, S.; Roux, M.; Revol, J.F.; Marchessault, R.H. J. Mol. Biol. 1979, 129, 113
26. Perez, S; Roux, M.; Vergelati, C. Polym. Bull. 1987, 17, 141
27. Gelin, B.R.; Karplus, M. J. Am. Chem. Soc. 1975, 97, 6996
28. French A.D.; Brady J.W. ACS Symposium Series 430, American Chemical Society, Washington DC, 1990, ppl-19
29. Ha, S.N .; Giammona, A.; Field, M.; Brady, J.W. Carb Res. 1988, 180, 207
30. Homan, S.W. Biochemistry 1990, 29, 9110
31. Hagler, A.T.; Lifson, S.; Dauber, P. J. Am. Chem. Soc. 1979, 101, 5122
32. Imberty, A.; Hardman, K.D.; Carver, J.P.; Perez, S. Glycobiology, 1991, 1, 456
33. Burkert, U.; Allinger, N.L. Molecular Mechanics, ACS Washington DC 1982, pl77
199
Reproduced with permission of the copyright owner. Further reproduction prohibited without permission.
34. Melberg, S.; Rasmussen, K. Carb. Res. 1979, 69 ,27
35. Melberg, S.; Rasmussen, K. Carb. Res. 1979, 71,25
36. Tvaroska, I. Biopolymers 1982, 21, 1887
37. Tvaroska, I. Biopolymers 1984,23, 1951
38. Engelsen, S.B.; Rasmussen, K_ Int. J. Biol. Macromol. 1993,15, 56
39. Tvaroska, I.; Perez, S. Carb. Res. 1986, 149, 389
40. Tvaroska, I.; Vaclavik, L. Carb. Res. 1987, 160, 137
41. French, A.D. Biopolymers, 1988, 27, 1519
42. Tran, V.; Buleon, A.; Imberty, A.; Perez, S. Biopolymers 1989,28, 679
43. Dowd, M .K .; Zeng, J.; French, A.D.; Reilly, P.J. Carb. Res. 1992, 230,223
44. Dowd, M.K.; French A.D.; Reilly, P.J. Carb. Res. 1992, 15,233
45. Dowd, M.K.; Reilly, P.J.; French, A.D. Biopolymers 1994, 34, 625
46. Dowd, M.K.; Reilly, P.J.; French, A.D. J. Comput. Chem. 1994, 34, 625
47. Dowd, M.K.; Reilly P.J.; French, A.D. J. Carbohydr. Chem. 1993, 12,449
48. Tran, V.; Brady, J.W. Biopolymers 1990,29,961
49. Perez, S. Polysaccharide Interactions with Water and Biological Macromolecules (Westhoff, E. ed. Topics in molecular and Structural Biology, Macmillan press, London., Vol. 17, pp295-320
50. Edge, C.J.; Singh, U.C.; Bazzo, R.; Taylor, G.L.; Dwek, R.A.; Rademacher, T.W. J. Am. Chem. Soc. 1990, 29, 1971
51. Perez, S.; Imberty, A.; Meyer, C. Practical Tools fo r Accurate Molecular Modeling fo r Complex Ccarbohydrates. In Separation and Characterization o f complex Oligosaccharides. Determination by MS and NMR Methods (Reinhold, V and Cummings, D eds.) Academic Press, Orlando, FL, 1994
52. Imberty, A.; Hardman, K.D.; Carver, J.P.; Perez, S. Glycobiology 1991, 1,456
200
Reproduced with permission of the copyright owner. Further reproduction prohibited without permission.
53. Carver, J.P.; Mandel, D.; Michnick, S.W.; Imberty, A.; Brady, J.W. Computer Modeling o f Carbohydrate Molecules (French A.D. and Brady J.W., eds.) ACS symposium series, 430, American Chemical Society, Washington DC 1990, pp266
54. Barbero, J.; Noble, O.; Pfeffer, C.; Perez, S. New J. Chem. 1988, 12, 941
55. Calub,T.M.; Waterhouse, A.L.; French A.D. Carb. Res. 1990,207, 221
56. Liu, H.; Waterhouse, A.L. Carb. Res. 1988,232, 1
57. MM3 is available to academic users from the Quantum Chemistry Program Exchange, Creative arts, Indiana University, Indiana University, Bloomington, IN. Commercial users may obtain MM3 from Tripos Associates, St. Louis, MO
58. Gundertofte, K.; Palm, J.; Pettersson, I.; Stamvik, A. J. Comput. Chem. 1991, 12,
59. Perez, S.; Imberty, A.; Engelson, S.B.; Gruza, J.; Mazeau, K.; Barbero, J.J.; Poveda, A.; Eespinoza, J.F.; Eyck, V.B.; Johnson G.; French, A.D.; Kouwijzer, M.L.; Grootenhuis, P.; Bemadi, A .; Raimondi, L.; Senderowitz, A. ; Durier, V.; Vergoten, G.; Rasmussen, K. Carb. Res. 1998, 314, 141
60. Perez, S.; Meyer, C.; Imberty, A.; French, A.D. In Sweet Taste Chemoreception, Mathlouthi, M.; Kanters, J.A.; Birch, G.G. eds., Elsevier,
London and New York, 1993, pp55-73
61. French, A.D., Kelterer, A.M.; Cramer, C.; Johnson, G.P.; Dowd, M. Carb. Res. 2000,326,305
62. Tvaroska, I.; Carver, J.P. Carb. Res. 1998, 309, 1
64. Tvaroska, I.; Carver, J.P. J. Phys. Chem. B. 1997, 101, 2992
64. Tvaroska, I.; Carver, J.P. J. Mol. Str. (TheoChem.) 1997, 395, 1
201
Reproduced with permission of the copyright owner. Further reproduction prohibited without permission.
Chapter 5
Conclusions and Future Research
Conclusions
The research presented in this dissertation can be divided into three major
headings. The first goal was to synthesize the derivatized anomeric pairs o f linkage
isomeric disaccharides to be used in the mass spectrometry studies. The second goal was
to use electrospray ionization in conjunction with a triple quadrupole mass spectrometer
to develop a method for anomeric discrimination o f the glycosidic bond and to study the
effects o f the added functional groups on glycosidic bond cleavage. The third goal was to
use molecular modeling to rationalize the fragmentation ratios obtained in the mass
spectrometer.
As described in Chapter 2 peralkylated (methyl to pentyl), peresterified and tert-
butyl-dimethyl silyl derivatives o f the different linkage isomers o f glucose-glucose
disaccharides were synthesized to increase the steric crowding in the glycosidic bond.
Further derivatization enhances the surface activity o f the molecule and counteracts the
hydrophylicity of the molecule enhancing its ability to protonate. The aim was to use
these derivatives to discriminate the anomeric configuration and to study the effects o f
the different functional groups on cleavage o f the glycosidic bond by mass spectrometry.
The compounds had synthetic yields ranging from 45%-92%. The mass spectromery
studies were limited in this study to only the peralkylated derivatives o f the 1—>4 and
1—>6 linkage isomers.
In chapter 3 electrospray-collision induced dissociation studies showed that a
discrimination of the anomeric configuration could be attained for the 1—>4 anomers but
202
Reproduced with permission of the copyright owner. Further reproduction prohibited without permission.
In chapter 3 electrospray-collision induced dissociation studies showed that a
discrimination o f the anomeric configuration could be attained for the 1—>4 anomers but
predictably not the 1—>6 linkage pair. The research shows conclusively the dependence of
the spectra on the rotational freedom o f motion of the disaccharide around the glycosidic
bond which directly influenced its cleavage. This was true not only for anomeric
configuration discrimination but also for the effect o f the alkyl groups on glycosidic bond
cleavage. Thus a more sterically crowded derivative cleaved more readily in comparison
to a flexible molecule because o f its inability to dissipate the added collision energy
within its rotational and vibrational modes and concentrated the energy on the weakest
bond in the molecule the glycosidic bond. The perpentylated molecule being the most
sterically restricted cleaved at the highest rate among all the peralkylated derivatives. In
addition to rotational freedom o f the molecule other factors such as the basicity of the
alkyl groups, the conformation o f the molecule and collision crossection also played a
major role in frangibility and fragmentation. Parent ion and daughter ion scans were
carried out to elucidate the fragmentation pathway. Chapter 3 also describes molecular
modeling o f the permethylated 1—>4 linkage disaccharides to corroborate their
fragmentation behavior in the mass spectrometer.
Chapter 4 described the conformational analysis of permethylated derivatives of
1—>1, 1—>2, 1—>3, 1—>4, 1—>6 linked disaccharides. The research shows that methylation
makes only some of the disaccharides like a,a-trehalose, p,|3-trehalose, kojibiose, and
sophorose more conformationally restricted. It, however, makes nigerose, laminaribiose,
maltose and cellobiose more flexible. It also shows that some of the energy surfaces of
the permethylated molecules are very alike the energy surface of the native molecule at
203
Reproduced with permission of the copyright owner. Further reproduction prohibited without permission.
the highest dielectric constant e = 7.5 because o f the decreased hydrogen bonding. This
research is important since it can enhance our understanding o f the properties of
oligosaccharides.
Future Research
The results of the studies in this dissertation show that mass spectrometry can be used for
stereoisomeric differentiation of certain compounds, which has long been the domain of
Nmr spectroscopy. The idea was to begin development o f a sensitive method that can
identify the anomeric configuration of small oligosaccharides. Therefore, the next set of
experiments to be performed is to study the other sterically hindered linkage isomers of
glucose-glucose disaccharides (1—>1, 1—>2, 1—>3) to test the applicability o f the
methodology described in this dissertation to anomeric configuration differentiation.
Then we propose to study heterogeneous residue oligosaccharides like glucose-galactose
or glucose-fucose and see whether this methodology can differentiate not only anomeric
configuration but also the type o f linkage involved. This method would be used to
complement methods like the methylation GC-MS analysis developed by Bjomdal et al.
when amounts are too small to conduct anomeric studies. Experiments should also be
later directed at larger sugars such as tri- and tetra saccharides. Further studies can be
performed on the disaccharides already derivatized with other functional groups such as
esters or silyl, the synthesis o f which have been described in this thesis. Thus, the effect
o f other functional groups on cleavage of the glycosidic bond can be studied. After
carrying out these various experiments, a database could be built. For the anomeric pairs
that are not distinguishable by this method we suggest, instead o f derivatization, the use
o f metals coordinated with the native compound since metals are known to promote
204
Reproduced with permission of the copyright owner. Further reproduction prohibited without permission.
alternative fragmenation pathways and could provide additional discrimination.
Molecular modeling is currently being carried out by our group on the higher alkyl
derivatives to see whether their more facile fragmentation in the mass spectrometer can
be rationalized.
205
Reproduced with permission of the copyright owner. Further reproduction prohibited without permission.
Appendix
List of Abbreviations
El Electron Impact Ionization
Cl Chemical Ionization
FAB Fast atom Bombardment
MALDI Matrix Assisted Laser Desorption Ionization
ESI Electrospray Ionization
CID Collision Induced Dissociation
CA Collision Activation
CAD Collision Activation Dissociation
206
Reproduced with permission of the copyright owner. Further reproduction prohibited without permission.
Vita
Sanford Mendonca was bom in Bombay, India. He is the third o f four children. He
graduated from Campion high school, a very elite school, with honors. He completed his
bachelor’s degree from St. Xavier’s College affiliated with the University o f Bombay. He
completed his master’s degree from the University of Houston. He joined Louisina State
University in fall 1996 to pursue a doctorate degree under the direction o f Professor
Roger Laine. He will receive the degree of Doctor of Philosophy in December of 2000.
He has three adorable children Ninoshka, Nadia, and Natalia.
207
Reproduced with permission of the copyright owner. Further reproduction prohibited without permission.
DOCTORAL EXAMINATION AND DISSERTATION REPORT
Candidate: Sanford Mendonca
Major Field: Chemistry
Title of Dissertation: Structure Determination of Derivatized Disaccharides by Tandem Mass Spectrometry and Molecular Modeling
Approved:
Dean io f 'the Graduate School
EXAMINING COMMITTEE:
Date of Bxamination:
August 30, 2000
Reproduced with permission of the copyright owner. Further reproduction prohibited without permission.