structure and reactivity of zeolite- and carbon-supported...
TRANSCRIPT
Structure and Reactivity of Zeolite- and Carbon-Supported Catalysts for the Oxidative Carbonylation of Alcohols
by
Daniel Neal Briggs
A dissertation submitted in partial satisfaction of the
Requirements for the degree of
Doctor of Philosophy
in
Chemical Engineering
in the
Graduate Division
of the
University of California, Berkeley
Committee in charge:
Professor Alexis T. Bell, Chair Professor Alex Katz
Professor John Arnold
Spring 2010
Structure and Reactivity of Zeolite- and Carbon-Supported Catalysts for the Oxidative Carbonylation of Alcohols
© 2010
by
Daniel Neal Briggs
1
Abstract
Structure and Reactivity of Zeolite- and Carbon-Supported Catalysts for the Oxidative Carbonylation of Alcohols
by
Daniel Neal Briggs
Doctor of Philosophy in Chemical Engineering
University of California, Berkeley
Professor Alexis T. Bell, Chair
The oxidative carbonylation of alcohols to produce dialkyl carbonates is a process that takes place commercially in a slurry of cuprous chloride in the appropriate alcohol. While this process is chemically efficient, it incurs costs in terms of energy (for product separation) and materials attrition (due to the corrosive nature of the chloride anion) that can be alleviated in a gas-phase process. Efforts to develop a supported copper catalyst for making dialkyl carbonates have been undertaken, using carbons or oxidic supports (including zeolites). However, the activity, selectivity and stability of the supported catalysts are not yet competitive with the slurry process. Little is understood regarding the nature of the active species or the mechanism by which carbonates and byproducts are formed. Catalyst properties that lead to favorable activity and selectivity have not been clearly outlined. To improve supported catalysts for this process, we have carried out detailed investigations of the structure and catalytic behavior of zeolite- and carbon-supported Cu catalysts for the synthesis of dimethyl or diethyl carbonates.
The aim of the work on Cu+-exchanged zeolites was to establish the effects of zeolite
structure/chemical composition on the activity and selectivity of Cu-exchanged Y (Si/Al = 2.5), ZSM-5 (Si/Al = 12), and Mordenite (Si/Al = 10) for the oxidative carbonylation of methanol to DMC. Catalysts were prepared by solid-state ion-exchange of the H-form of each zeolite with CuCl, and were then characterized by FTIR and X-ray absorption spectroscopy (XAS). The XANES portion of the XAS data showed that all of the copper is present as Cu+ cations, and analysis of the EXAFS portion of the data shows the Cu+ cations have a Cu-O coordination number of ~2.1 on Cu-Y and ~2.7 on Cu-ZSM-5 and Cu-MOR. Dimethyl carbonate (DMC) was observed as the primary product when a mixture of CH3OH/CO/O2 was passed over Cu-Y, whereas dimethoxy methane was the primary product over Cu-ZSM-5 and Cu-MOR. The higher activity and selectivity of Cu-Y for the oxidative carbonylation of CO is attributed to the weaker adsorption of CO on the Cu+ cations exchanged into Y zeolite. In situ infrared observations reveal that under reaction conditions, adsorbed CO is displaced by methoxide groups bound to the Cu+ cations. The kinetics of DMC synthesis suggests that the rate-limiting step in the formation of this product is the insertion of CO into Cu-OCH3 bonds. The yield of DMC is
2
observed to decline with methanol conversion due very likely to the hydrolysis of DMC to methanol and carbon dioxide.
Next, the investigation turned to the synthesis of diethyl carbonate (DEC) by oxidative
carbonylation of ethanol, using catalysts prepared by the dispersion of CuCl2 and PdCl2 on amorphous carbon. Catalysts were characterized extensively by XRD, XAFS, SEM and TEM with the aim of establishing their composition and structure after preparation, pretreatment, and use. It was observed that after preparation and pretreatment in He at 423 K, copper is present almost exclusively as Cu(I), most likely in the form of [CuCl2]
- anions, whereas palladium is present as large PdCl2 particles. Catalysts prepared exclusively with copper or palladium chloride are inactive for DEC synthesis, indicating that both components must be present together. Evidence from XANES and EXAFS suggests that the DEC synthesis may occur on [PdCl2-x][CuCl2]x species deposited on the surface of the PdCl2 particles. As-prepared catalysts exhibited an increase in DEC synthesis activity and selectivity with time on stream, but then reached a maximum activity and selectivity, followed by a slow decrease in DEC activity. The loss of DEC activity was accompanied by a loss in Cl from the catalyst and the appearance of paratacamite.
Further work was undertaken on carbon-supported catalysts, building on insights
regarding the active species, this time with activated carbon or carbon nanofibers as the support. The objectives of this last study were to establish the effects of carbon support structure and pretreatment on the dispersion of the catalytically active components and, in turn, on the activity and selectivity of the catalyst for DEC synthesis. At the same surface loading of CuCl2 and PdCl2, partially oxidized carbon nanofibers resulted in a higher dispersion of the active components and a higher DEC activity than could be achieved on activated carbon. Catalyst characterization revealed that nearly atomic dispersion of CuCl2 and PdCl2 could be achieved on the edges of the graphene sheets comprising the carbon nanofibers. Over oxidation of the edges or their removal by heat treatment of the nanofibers resulted in a loss of catalyst activity. The loss of catalyst activity with time on stream could be overcome by the addition of ppm levels of CCl4 to the feed. While catalysts prepared with CuCl2 alone were active, a five-fold increase in activity was realized by using a PdCl2/CuCl2 ratio of 1/20. It was proposed that the Pd2+ cations interact with [CuCl2]
- anions to form Pd[CuCl2]2 complexes that are stabilized through dative bonds formed with oxygen groups present at the edges of the graphene sheets of the support. A mechanism for DEC synthesis was outlined and a role for the Pd2+ cations as part of this mechanism was proposed.

i
To Karen –
I been lovin’ you since you was a child, girl ’Cause you and me is two of a kind
ii
Table of Contents
Table of Contents ............................................................................................................................ ii List of Figures ................................................................................................................................ iv List of Tables ................................................................................................................................. ix Acknowledgments.......................................................................................................................... xi 1. Introduction ...........................................................................................................................1
1.1. Alkyl carbonates ............................................................................................................1 1.2. Zeolite-supported catalysts ............................................................................................1 1.3. Carbon-supported catalysis ............................................................................................2 1.4. Objectives ......................................................................................................................2 1.5. Thesis outline .................................................................................................................3 1.6. References......................................................................................................................3
2. Effects of zeolite structure and composition on the synthesis of dimethyl carbonate by
oxidative carbonylation of methanol on Cu-exchanged Y, ZSM-5, and mordenite .......5
2.1. Introduction....................................................................................................................5 2.2. Experimental ..................................................................................................................5 2.3. Results ...........................................................................................................................7 2.4. Discussion ....................................................................................................................19 2.5. Conclusions .................................................................................................................21 2.6. References....................................................................................................................22
3. An investigation of carbon-supported CuCl2/PdCl2 catalysts for diethyl carbonate
synthesis ...............................................................................................................................23
3.1. Introduction..................................................................................................................23 3.2. Experimental ................................................................................................................25 3.3. Results .........................................................................................................................28 3.4. Discussion ....................................................................................................................48 3.5. Conclusions .................................................................................................................49
iii
3.6. References....................................................................................................................50 4. Effects of support composition and pretreatment on the activity and selectivity of
carbon-supported PdCunClx catalysts for the synthesis of diethyl carbonate ..............52
4.1. Introduction..................................................................................................................52 4.2. Experimental ................................................................................................................53 4.3. Results .........................................................................................................................57 4.4. Discussion ....................................................................................................................71 4.5. Conclusions .................................................................................................................78 4.6. References....................................................................................................................79
iv
List of Figures
2. Effects of zeolite structure and composition on the synthesis of dimethyl carbonate by oxidative carbonylation of methanol on Cu-exchanged Y, ZSM-5, and mordenite
2.1. IR spectra of catalysts before and after exchange of the zeolite with CuCl: (a) H-Y,
Cu-Y; (b) H-ZSM-5, Cu-ZSM-5; (c) H-MOR, Cu-MOR .............................................8
2.2. Cu K-edge XANES of (a) Cu-Y; (b) Cu-ZSM-5; (c) Cu-MOR ....................................8
2.3. Fourier transforms of experimental data for Cu-exchanged zeolites (k1 weighted, ∆k = 3-13 Å-1, phase-uncorrected) ......................................................................................9
2.4. CO temperature-programmed desorption spectra for (a) Cu-Y, (b) Cu-ZSM-5, and (c)
Cu-MOR ......................................................................................................................10
2.5. IR spectra of Cu-Y in the presence of different gases (from top to bottom: CO, CO/CH3OH, CO/CH3OH/O2) ......................................................................................11
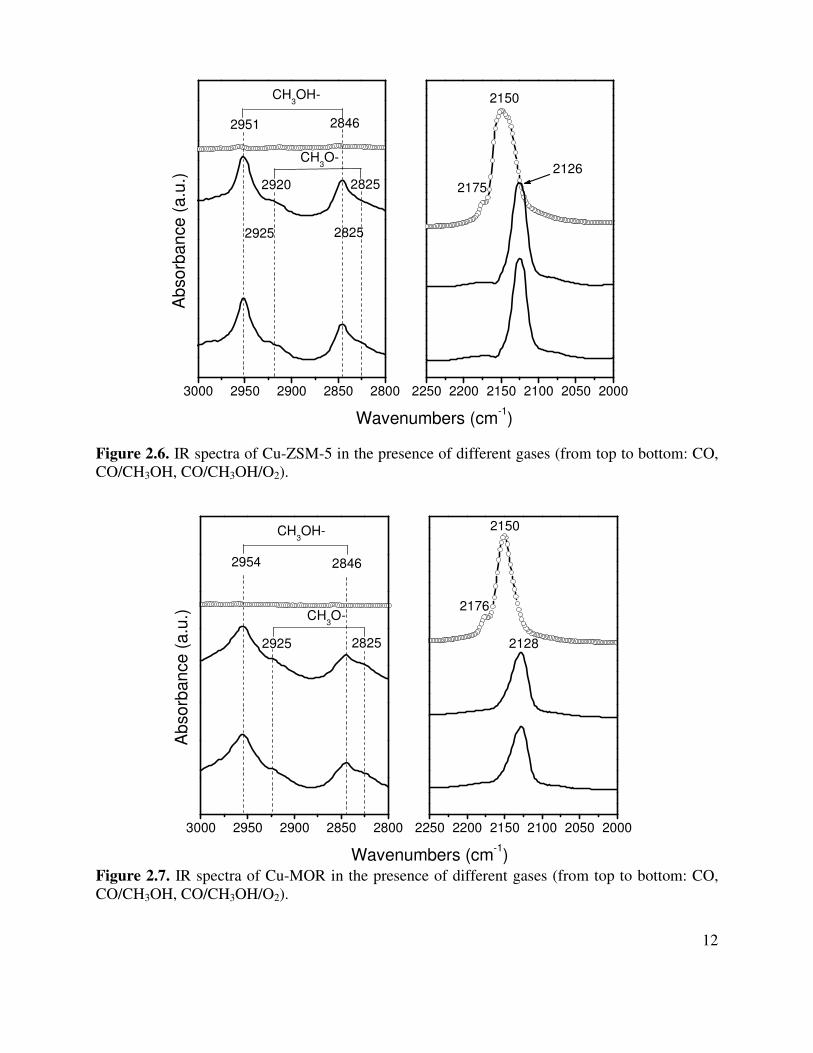
2.6. IR spectra of Cu-ZSM-5 in the presence of different gases (from top to bottom: CO,
CO/CH3OH, CO/CH3OH/O2) ......................................................................................12
2.7. IR spectra of Cu-MOR in the presence of different gases (from top to bottom: CO, CO/CH3OH, CO/CH3OH/O2) ......................................................................................12
2.8. The first derivative curves of Cu K-edge XANES on (a)-(c): Cu-Y; (d)-(f) Cu-ZSM-
5; (g)-(i) Cu-MOR, under different atmospheres ........................................................14
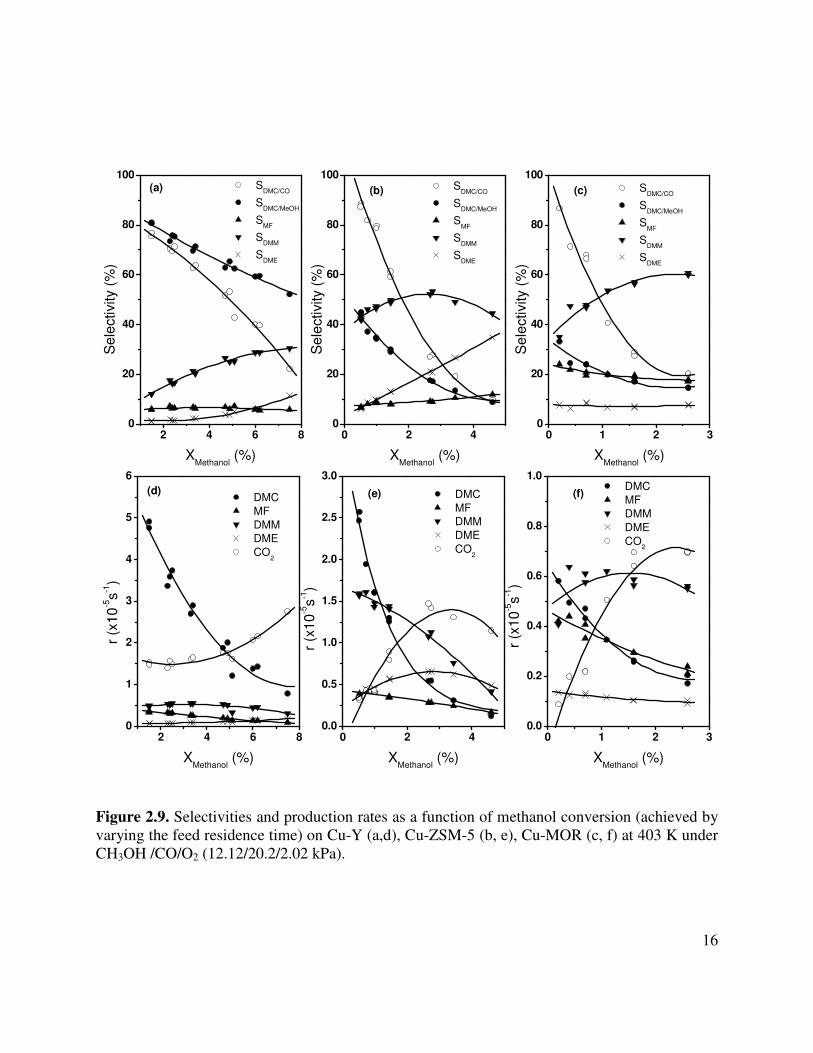
2.9. Selectivities and production rates as a function of methanol conversion (achieved by varying the feed residence time) on Cu-Y (a,d), Cu-ZSM-5 (b, e), Cu-MOR (c, f) at 403 K under CH3OH /CO/O2 (12.12/20.2/2.02 kPa) ...................................................16
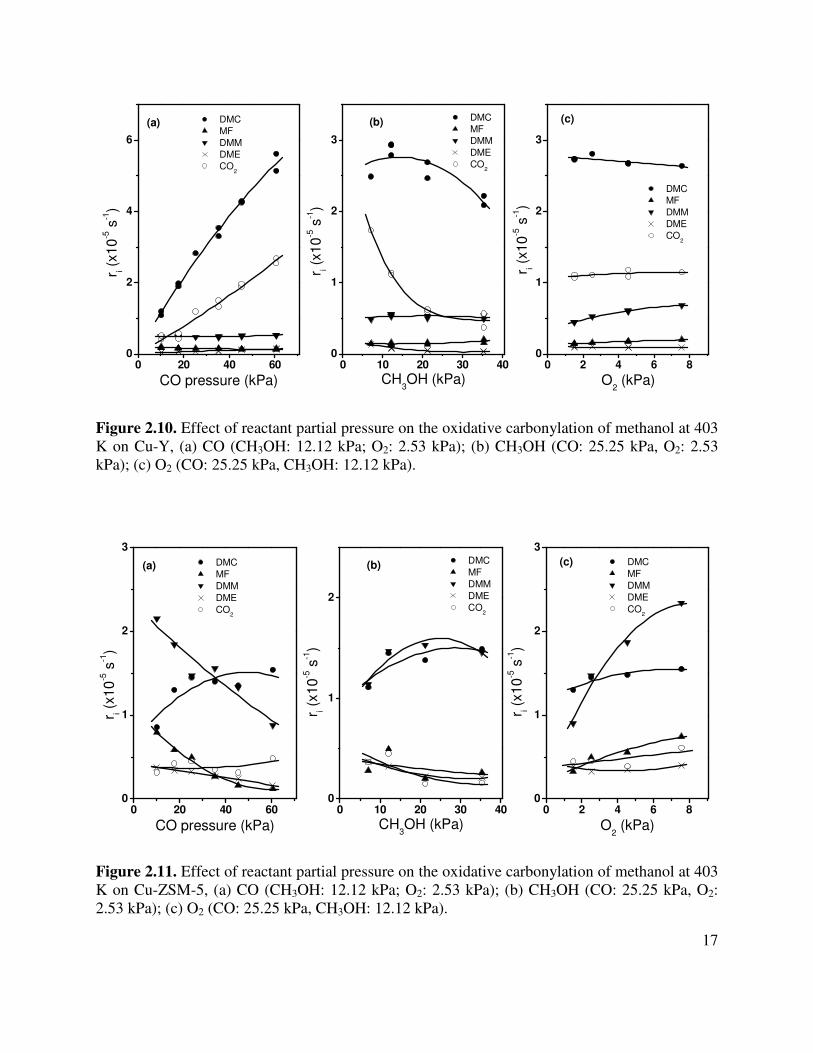
2.10. Effect of reactant partial pressure on the oxidative carbonylation of methanol at 403
K on Cu-Y, (a) CO (CH3OH: 12.12 kPa; O2: 2.53 kPa); (b) CH3OH (CO: 25.25 kPa, O2: 2.53 kPa); (c) O2 (CO: 25.25 kPa, CH3OH: 12.12 kPa) ........................................17
v
2.11. Effect of reactant partial pressure on the oxidative carbonylation of methanol at 403 K on Cu-ZSM-5 (a) CO (CH3OH: 12.12 kPa; O2: 2.53 kPa); (b) CH3OH (CO: 25.25 kPa, O2: 2.53 kPa); (c) O2 (CO: 25.25 kPa, CH3OH: 12.12 kPa) ................................17
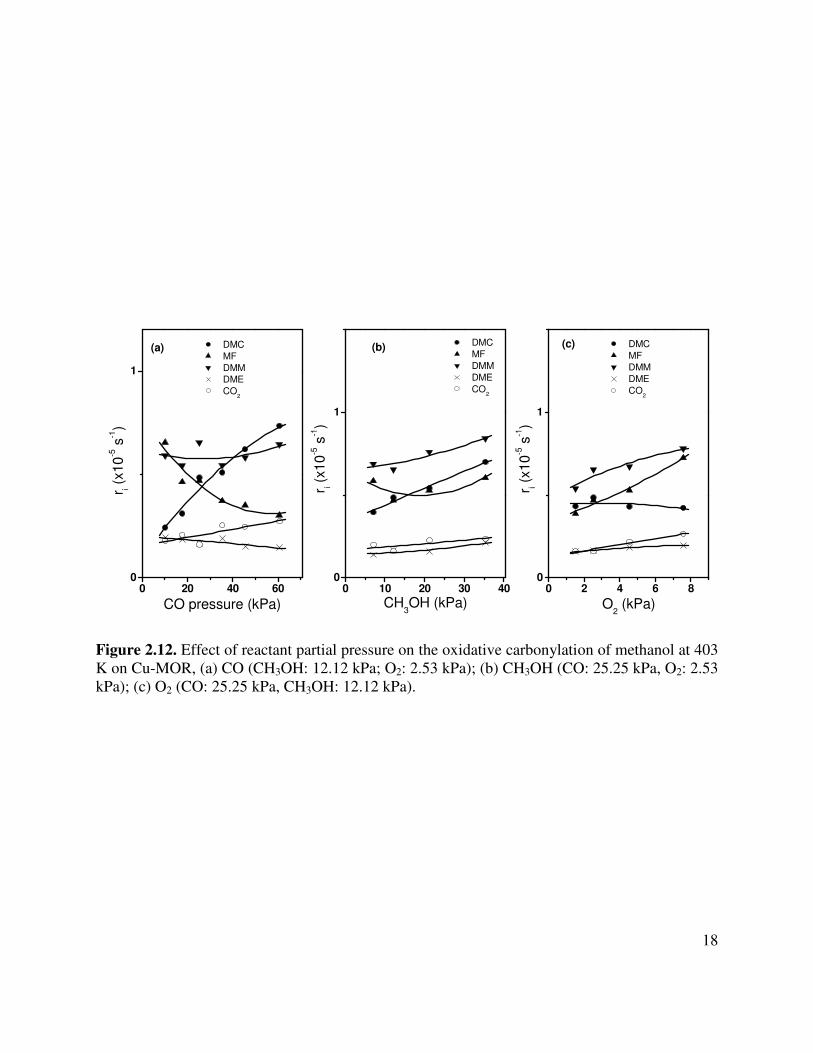
2.12. Effect of reactant partial pressure on the oxidative carbonylation of methanol at 403
K on Cu-MOR (a) CO (CH3OH: 12.12 kPa; O2: 2.53 kPa); (b) CH3OH (CO: 25.25 kPa, O2: 2.53 kPa); (c) O2 (CO: 25.25 kPa, CH3OH: 12.12 kPa) ................................18
3. An investigation of carbon-supported CuCl2/PdCl2 catalysts for diethyl carbonate
synthesis
3.1. Activity and selectivity for the KNCPAC catalyst. Reaction conditions: T = 423 K, P = 3.1 bar, CO/O2/EtOH = 61/5/13, F = 69 cm3/min (STP), catalyst = 150 mg ...........29
3.2. To investigate the effect of Pd loading on KNCPAC activity, four catalysts (KNCAC,
KNCPAC-LP, KNCPAC, KNCPAC-HP) were compared. (a)-(c): activity to DEC, acetaldehyde, and CO2, in mmol product/gm catalyst/h; (d): ethanol conversion; (e)-(f): DEC selectivities from ethanol and CO. Reaction conditions were identical to those in Figure 3.1 .......................................................................................................31
3.3. To investigate the effect of Cu loading on KNCPAC activity, four catalysts (KPAC,
KNCPAC-LC, KNCPAC, KNCPAC-HC) were compared. (a)-(c): activity to DEC, acetaldehyde, and CO2, in mmol product/gm catalyst/h; (d): ethanol conversion; (e)-(f): DEC selectivities from ethanol and CO. Reaction conditions were identical to those in Figure 3.1 .......................................................................................................32
3.4. To investigate the effect of He pretreatment on KNCPAC activity, the catalyst was
treated for 1 h at 573 K in He, then cooled to 423 K for the reaction. (a)-(c): activity to DEC, acetaldehyde, and CO2, in mmol product/gm catalyst/h; (d): ethanol conversion; (e)-(f): DEC selectivities from ethanol and CO. Reaction conditions were identical to those in Figure 3.1 ....................................................................................33
3.5. To investigate the effect of KCl and NaOH on KNCPAC activity, three catalysts
(CPAC, KCPAC, KNCPAC) were compared. (a)-(c): activity to DEC, acetaldehyde, and CO2, in mmol product/gm catalyst/h; (d): ethanol conversion; (e)-(f): DEC selectivities from ethanol and CO. Reaction conditions were identical to those in Figure 3.1 .....................................................................................................................34
3.6. X-ray diffraction spectra for the activated carbon support and KNCPAC, before and
after reaction ................................................................................................................36
3.7. TEM for KNCPAC as prepared. The inset shows the fast Fourier transform of this TEM image ..................................................................................................................37
vi
3.8. TEM of a PdCl2 particle found in the KNCPAC catalyst as prepared. The inset shows
the fast Fourier transform of this TEM image .............................................................38
3.9. SEM images of the as prepared KNCPAC catalyst at a magnification of (a) 400x, (b) 4000x. Numbers indicate points where elemental analysis was measured. Values in the tables are concentrations in mol% .........................................................................39
3.10. SEM images of the KNCPAC catalyst after reaction conditions at a magnification of
(a) 400x, (b) 4000x. Numbers indicate points where elemental analysis was measured. Values in the tables are concentrations in mol% ........................................39
3.11. Cu XANES for KNCPAC and three Cu standards. The inset shows the derivative
spectrum for the XANES in the region where the 1s→3d transition occurs for Cu(II) compounds ...................................................................................................................40
3.12. Non-phase corrected, k3-weighted χ(k) spectra of the Cu EXAFS for KNCPAC.
Spectra are shown before reaction and during in situ treatment with He or reaction gases. Each of the spectra is characterized by a single scattering shell at ~1.7 Å .......42
3.13. Fits to Cu EXAFS data for KNCPAC (a) as prepared, (b) under reaction conditions.
Experimental data (symbols) are shown with the corresponding fits (lines)...............43
3.14. Non-phase corrected, k3-weighted χ(k) spectra of the Pd EXAFS for KNCPAC. Spectra are shown before reaction and during in situ treatment with He or reaction gases. PdCl2 and Pd metal standards are also shown for comparison. Each of the experimental spectra for KNCPAC is characterized by a single scattering shell at ~1.9 Å ..................................................................................................................................45
3.15. Fits to Pd EXAFS data for KNCPAC (a) as prepared, (b) under reaction conditions.
Experimental data (symbols) are shown with the corresponding fits (lines)...............46
3.16. Cl XANES for KNCPAC, before and after reaction. CuCl and CuCl2 standards are shown for comparison..................................................................................................47
4. Effects of support composition and pretreatment on the activity and selectivity of
carbon-supported PdCunClx catalysts for the synthesis of diethyl carbonate
4.1. HR-TEM images of the carbon supports. (a) KCP/AC. Top inset (reproduced by permission [66]): a sketch of the turbostratic graphene planes that make up AC; bottom inset: finite Fourier transform (FFT) of the TEM image. (b) KCP/CNF. The cartoon illustrates the “deck of cards” character of platelet-type CNF. (c) KCP/CNF-
vii
HT. The cartoon depicts the edge folding that takes place when a platelet-type CNF is subjected to heat treatment ..........................................................................................58
4.2. Transmission IR spectra were collected for the supports used in this study. Each
support was diluted to 0.1 wt% in KBr........................................................................59
4.3. At 600x magnification, these SEM images illustrate differences in KCl dispersion between the as prepared catalysts. The bright spots in the images are KCl particles, and were identified by EDX. (a) KCP/AC is decorated heavily with poorly dispersed KCl. (b) KCP/CNF has some KCl clusters but generally exhibits much better dispersion. (c) KCP/CNF-HT displays poor KCl dispersion. The EDX composition at a few points is summarized in the attached table to illustrate the variation of KCl content between dark and bright spots ........................................................................61
4.4. SEM data exposes differences in the dispersion of CuClx species. (a) KCP/AC
exhibits the worst CuClx dispersion, with patches of large CuClx crystals visible (4,000x). (b) The distribution of Cu, K, and Cl at several points on the KCP/CNF catalyst shows uniformly high dispersion. No regions of concentrated CuClx species could be found. (c) The distribution of Cu, K and Cl at several points on the KCP/CNF-HT catalyst show some highly dispersed CuClx, as well as some regions that are highly concentrated in CuClx species. Like KCP/AC, the latter regions could be found throughout the catalyst..................................................................................62
4.5. HR-TEM images of the KCP/CNF catalyst, illustrating the variation of intensity
while changing the focus of the electron beam. (a) At an underfocus of 10.8 nm, Cu and Pd atoms can be distinguished as bright spots; (b) at an overfocus of 3.6 nm, the spot contrast has decreased significantly; (c) the maximum contrast for each spot ....63
4.6. To investigate the effect of carbon support on activity, three catalysts (KCP/CNF,
KCP/CNF-HT, KCP/AC) were tested. (a)-(c): activity to DEC, acetaldehyde, and CO2, normalized by moles of Cu; (d): ethanol conversion; (e)-(f): DEC selectivities from ethanol and CO. Reaction conditions: T = 423 K, P = 3.1 bar, CO/O2/EtOH = 61/5/13, F = 69 cm3/min (STP), catalyst = 150 mg. Catalyst compositions are shown in Table 4.2 ..................................................................................................................65
4.7. To investigate the effect of KCl and PdCl2 on KCP/CNF activity, three catalysts
(KCP/CNF, CP/CNF, C/CNF) were tested. DEC activity is normalized by moles of Cu. Selectivities to DEC from ethanol (open symbols) and CO (closed symbols) are also shown. Reaction conditions are identical to those in Figure 4.6, and catalyst compositions are in Table 4.2. The data for KCP/CNF is truncated at 20 h in this figure; the full data set can be examined in Figure 4.6 ................................................66
4.8. The effect of oxidizing the CNF support before preparing the catalyst is illustrated.
DEC activity is normalized by moles of Cu. Selectivities to DEC from ethanol (open
viii
symbols) and CO (closed symbols) are also shown. Reaction conditions are identical to those in Figure 4.6, and catalyst compositions are in Table 4.2. The data for KCP/CNF is truncated at 20 h in this figure; the full data set can be examined in Figure 4.6 .....................................................................................................................67
4.9. The stabilizing effect of adding CCl4 to the feed stream is illustrated for KCP/AC
(Table 4.2). Activity to DEC is normalized by moles of Cu. Selectivities to DEC from ethanol (open symbols) and CO (closed symbols) are also shown. Reaction conditions are identical to those in Figure 4.6, except where addition of CCl4 is noted...............69
4.10. The stabilizing effect of adding CCl4 to the feed stream is illustrated for the catalysts
KCP/CNF and KCP/CNF-0.5OX (Table 4.2). Activity to DEC is normalized by moles of Cu. Selectivities to DEC from ethanol (open symbols) and CO (closed symbols) are also shown. Reaction conditions are identical to those in Figure 4.6, except the addition of CCl4 to the feed. KCP/CNF was tested with 2.7 ppm CCl4, and the last point at 56 h was taken at slightly elevated pressure, 3.3 bar. KCP/CNF-0.5OX was tested over a range of CCl4 concentration, starting at 27 ppm and decreasing to 2.7 ppm CCl4 after 20 h .........................................................................70
4.11. Illustration of some of the oxygen-containing groups on a carbon support: (a) ether,
(b) phenol, (c) carboxylic acid, (d) quinone, (e) carboxylic anhydride, (f) lactone, (g) aromatic network constituting the basal plane of carbons ...........................................73
4.12. Proposed bonding of [CuCl2]
-Pd2+[CuCl2]- and [CuCl2]
- to the support, via oxygen attached to the support surface. C+ represents electron deficiencies in the graphene network, as discussed above. Dashed lines indicate dative bonding interactions with the support. ..................................................................................................................76
ix
List of Tables
2. Effects of zeolite structure and composition on the synthesis of dimethyl carbonate by oxidative carbonylation of methanol on Cu-exchanged Y, ZSM-5, and mordenite
2.1. Fit parameters of EXAFS spectra (∆k: 3-13 Å-1, ∆R: 1.0-2.0 Å) and variances for
model spectra of Cu-Y, Cu-ZSM-5 and Cu-MOR ........................................................9 3. An investigation of carbon-supported CuCl2/PdCl2 catalysts for diethyl carbonate
synthesis
3.1. Physical properties of DMC and DEC.........................................................................23
3.2. Summary of catalysts prepared in this study. For catalysts whose compositions were measured by elemental analysis, the measured loadings of each component are shown. The loadings for other catalysts are those used during impregnation .............25
3.3. Summary of Cu EXAFS fitting parameters for KNCPAC. The Cu-Cl bond distances
for CuCl and CuCl2 are shown for comparison ...........................................................44
3.4. Cu-Cl bond lengths for various chlorocuprate anions in the literature ........................44
3.5. Pd EXAFS fitting parameters ......................................................................................47 4. Effects of support composition and pretreatment on the activity and selectivity of
carbon-supported PdCunClx catalysts for the synthesis of diethyl carbonate
4.1. Summary of carbon supports used in this study ..........................................................53 4.2. Summary of catalysts prepared in this study. The metal loadings (in wt%) are those
used during impregnation ............................................................................................54
4.3. Summary of the oxygen analysis of the carbon supports used in this study. PZC analysis probes oxidation extent by measuring the relative acidity of the carbons .....59
x
4.4. DEC activity is compared with a summary of the structural characterization of each catalyst .........................................................................................................................68
4.5. Effect of CO, O2, and H2O on steady state CO2 activity for the KCP/AC catalyst. In
addition to the gases listed in the table, 104 ppm CCl4 was flowed continuously during this experiment to maintain catalyst activity. DEC synthesis produces H2O as a byproduct (Equation 2); the reactant concentrations for yH2O and the other gases are initial quantities as the gases enter the catalyst bed .....................................................71
xi
Acknowledgments
The Book of Mormon begins with the account of an ancient Israelite named Lehi and his family, as they journeyed for eight years through the wilderness of the Arabian peninsula. Their exodus from Jerusalem culminated in the construction of a ship that would eventually carry these hardy souls, under the direction and protection of their God, to the American continent, which they termed their “promised land.” The experience of Lehi’s family has become a particularly apt metaphor for my sojourn with my family in graduate school.
I suppose that Lehi and his family did not have any idea of the struggles they would
eventually have to pass through in their quest for the promised land. Likewise, Karen, my beautiful wife, and I, really did not know what we were getting into when we made the decision to leave our comfortable surroundings in Utah and set down roots in the new world of the Bay Area. With challenges also came great blessings, friendships, and valuable life lessons that we could only have learned by going on this adventure. What I have learned here as a graduate student, husband, and father are lessons of hard work, persistence, and patience. I discovered that nothing is more important or brings me more happiness than spending time with my family, but a balance must be struck between family and other important priorities.
Success in life’s endeavors is difficult to achieve alone. Lehi relied heavily on support
from his son, Nephi, and others who supported his decision to leave Jerusalem. Likewise, I have been surrounded by colleagues who made this experience memorable. The D-team – Fuat, Anthony, Justin and Reed – was instrumental in surviving early years of coursework and general confusion. My most enjoyable and productive research involved working alongside my colleagues (particularly on EXAFS trips). Ian, Yihua, and Jason were cherished mentors. Working with Emiel – both a great scientist and a great friend – was a singular experience that I was fortunate to have. Undergraduate research assistants Michael Lin, Andrew Pangestan, Ken Lawrence, Kevin Oei, Gabriella Lestari, Gerry Bong, and Eric Leong consistently impressed me with their dedication, work ethic, and compassion. They deserve much credit for my success as a graduate student. Finally, I thank Fooz and Anfer again for their friendship. On countless occasions, a quick chat (okay, occasionally there were some rather long political discussions that stretched out over days), or a little commiseration provided much needed relief from the daily grind.
I could not have chosen a better advisor. Alex’s ability to balance high expectations with
compassion is truly remarkable. After two years in the program, it was Alex’s encouragement and faith in me that helped me decide to continue onward. I’ve captured video footage of Alex

xii
dancing with Brazilians in Natal and eavesdropped on his conversations with Tatiana in Russian. Alex never ceases to amaze me with his work ethic, as well as his propensity for mixing humor into science. At one research meeting, Alex compared the “intimate” interaction between Cu and Pd (required to achieve high activity on our catalyst) to the “intimate” interaction necessary for the baby-making that Karen and I are apparently good at. I express my deepest gratitude to you, Alex, for your patience, for sharing your expertise and advice, and especially for believing in me when I did not believe in myself.
Just after they began their journey, Lehi wisely sent his sons back to Jerusalem to invite a
daughter-laden family to come with them into the wilderness. I am blessed to be married to a strong, supportive and wonderful wife. Karen kept me going when all either of us could see was a dark tunnel of unknown destination up ahead. Her steadiness, faith, and willingness to endure life in a small apartment, with a meager paycheck, with two, then three, then four, then five kids, has been incredible. If I could have borrowed a fraction of her work ethic, mental fortitude, perseverance and common sense, it would have served me well in my graduate studies. I cannot express enough gratitude for her sacrifices and love. I love you, girl! You are amazing and beautiful, and you deserve this degree more than I do.
Maxwell, Doman, Lincoln, Cali, and Will: you kids make my life worth living. I love
going out and reliving my childhood with you after work: playing at parks, going to Target, the bookstore, McDonald’s Playplace, rock climbing, the steam trains, museums… the list goes on and on. You are each so special to me, and I love you!
Finally, I gratefully acknowledge the hand of God in guiding, comforting, and protecting
me and my family during this journey, and leading us through what sometimes felt like a wilderness, to our own “promised land.” I have felt His concern for me and my family many times, and I know that He has watched over us.
1
Chapter 1
Introduction 1.1. Alkyl carbonates
Alkyl carbonates are an important class of chemicals that have been considered as potential fuel oxygenates [1, 2]. These compounds can also function as eco-friendly alternatives to phosgene and alkyl halides for alkoxycarbonylation and alkylation reactions, respectively. Alkyl carbonates also find significant application as solvents for fuel cells, and diphenyl carbonate is a precursor to bisphenol-A for the manufacture of plastics.
Historically, alkyl carbonates were made by reaction of alcohols with phosgene. This process readily formed the alkyl carbonate, but phosgene is highly toxic, and the process released stoichiometric quantities of HCl. A more eco-friendly process to make alkyl carbonates by oxidative carbonylation of alcohols is now catalyzed commercially by a cuprous chloride slurry [3]. However, this process also has drawbacks: high cost of materials, impact on the environment, and high energy consumption for product separations.
To address these issues, some effort has been devoted to developing supported catalysts that operate in a gas phase configuration. To this end, investigations have been carried out using CuCl2 and CuCl in combination with PdCl2 and other additives such as KCl and NaOH supported on activated carbon (AC), silica, alumina, and zeolites. Of the systems studied, AC-supported catalysts have been found to be the most active and selective to alkyl carbonates. However, the stability of such catalysts is an issue, and the observed loss of activity with time on stream has been attributed to the loss of Cl.
Supported catalysts can offer high surface areas and correspondingly high catalyst activity. The interaction between the catalyst support and the catalytic metal (in this case, Cu) can effect changes in product selectivity and also has a bearing on the stability of the supported catalyst, since poor catalyst-support interaction can result in leaching of the active species from the system. Because of these considerations, and because the oxidative carbonylation mechanism is relatively complex, it has been difficult to identify the active species for DMC and DEC synthesis.
This work comprised studies of two main classes of catalysts. Copper-exchanged zeolites were investigated for the synthesis of dimethyl carbonate (DMC); and CuCl2 and PdCl2, promoted with KCl and NaOH and supported on carbon, was investigated for the synthesis of diethyl carbonate (DEC).
1.2. Zeolite-supported catalysts
King reported the first zeolite-supported catalyst for DMC synthesis [4]. Zeolites are silicoaluminate structures (SiO2/AlO2
- = 1 to ∞) that bear a net negative charge which requires
2
compensation by extraframework cations. As prepared, zeolites are often charge-compensated by Na+, for example. Compensating cations are largely immobile, bound to zeolite framework oxygen atoms in regions where negative charge is localized (i.e. near framework Al atoms). Cation exchange of zeolites may be done in aqueous media; however, Cu+ is easily oxidized in aqueous environments to Cu2+ (not active for DMC synthesis), and post-exchange treatment at high temperature leaves a significant Cu2+ fraction in the zeolite. Solid state ion exchange (SSIE) preparation of CuY avoids the ambiguity of Cu2+ contamination and yields a catalyst that is suitable for precise characterization and quantitative analysis [5].
Zeolite-supported catalysts offer the advantage of “single site” catalysis; that is, each Cu+ atom is expected to be situated in a well-defined relationship with respect to the zeolite support. Because the exchange sites are relatively uniform and their structure characterized, we can gain significant mechanistic insights from the study of zeolite-supported catalysts. By changing the Si/Al ratio of the zeolite, the electronic properties of the support can be varied; furthermore, there are many different types of zeolites, with different channel and cage structures, which react differently and offer additional insights into the catalyst mechanism.
1.3. Carbon-supported catalysts Activated carbon (AC) contrasts sharply with zeolites as a catalyst support. Instead of a
well-defined Cu+ exchange site, activated carbon has a wide distribution of non-uniform adsorption sites [6]. During catalyst preparation, it is very difficult to ascertain the interactions taking place between catalyst precursor and the support. It is said that no two adsorption sites in AC are the same. Because of these properties, activated carbon is very difficult to characterize. However, the high surface area (up to 1500 m2/gm or more) and porosity of AC often leads to high catalyst activities.
For the oxidative carbonylation of alcohols, AC-supported catalysts exhibit at least an order of magnitude greater activity (per mole of supported Cu) than zeolites [5, 7]. However, as mentioned above, catalyst activity decreases with time on stream due to the loss of Cl. In addition, CO selectivity of these catalysts is low, due to high CO2 activity. More information is needed regarding the nature of the active species on this catalyst, in order to begin the process of intelligently addressing problems with catalyst stability and selectivity. 1.4. Objectives
The purpose of this investigation was to elucidate poorly understood aspects of alkyl carbonate synthesis on supported catalysts, with the overall aim of increasing the activity and stability of gas-phase DMC and DEC synthesis. Our objectives included (1) obtaining insights into the mechanism of alkyl carbonates synthesis; (2) identifying the active species responsible for catalyst activity on carbon supports; and (3) combining insights from structural characterization with catalysis data, in order to determine catalyst and support properties that are conducive to active catalysts for this process.
3
1.5. Thesis outline Three major studies were carried out to accomplish the objectives of this work. Chapter 2
is an investigation of Cu+-exchanged zeolites, used for the oxidative carbonylation of methanol to DMC. The effect of zeolite structure on DMC synthesis was studied by comparing three zeolites – Y, ZSM-5, and mordenite. Cu+-Y was the most active of these catalysts, and structural characterization of the three catalysts was carried out in order to understand the factors that led to high activity in Cu+-Y. Using IR, we found that weak Cu+-CO interactions are essential in order to allow the adsorption of methanol and formation of the methoxide groups that later react with CO to form DMC. Cu+-Y showed a much weaker affinity towards CO than Cu+-ZSM-5 and Cu+-mordenite. Furthermore, Cu XANES revealed that the coordination environment of Cu+-Y (average Cu-O = 2.1) is much less saturated than the other two catalysts (Cu-O = 2.7). In an unsaturated condition, Cu+ is more reactive towards DMC synthesis.
Chapter 3 details our first attempt to understand AC-supported catalysts. Starting with a
catalyst known to be active for DMC and DEC synthesis (KCl-NaOH-CuCl2-PdCl2/AC), we established activity profiles and corresponding structural data to better understand the deactivation process. Catalysts were characterized extensively by XRD, XAFS, SEM and TEM with the aim of establishing their composition and structure after preparation, pretreatment, and use. The active Pd and Cu species were identified as PdCl2 and [CuCl2]
-, respectively, and it was anticipated that significantly higher DEC activity and better stability could be achieved by altering the means by which Pd was introduced onto the support.
Chapter 4 details the implementation of insights from Chapter 3, resulting in the design
of a superior catalyst, with high PdCl2 dispersion, and correspondingly higher DEC activities. The oxidative carbonylation of ethanol to diethyl carbonate (DEC) on various carbon-supported catalysts was studied, with the aim of stabilizing catalyst activity, increasing understanding of the active species in the reaction, and elucidating the carbon support properties that favor the formation of that species. Changes in activity between different carbon supports were found to depend strongly on the extent of support oxidation, which was required for high activity. However, strong oxidation was detrimental to activity and selectivity. A bimetallic Pd/Cu complex with Cl- and O- bridging was proposed as the active species. High-resolution transmission electron microscopy showed evidence for Cu and Pd in close proximity. Finally, the addition of ~1-100 ppm CCl4 to the feed stabilized the catalyst activity to DEC, and this effect was enhanced by mild HNO3 oxidation of the CNF support. This was the first report of continuous regenerability for CuCl2/carbon catalysts. 1.6. References 1. M. A. Pacheco, C. L. Marshall, Energy Fuels 11 (1997) 2-29. 2. A.-A. G. Shaikh, S. Sivaram, Chem. Rev. 96 (1996) 951-976. 3. U. Romano, R. Tesei, G. Cipriani, L. Micucci, USP 4,218,391 (1980). 4. S. T. King, J. Catal. 161 (1996) 530-538. 5. I. J. Drake, Y. H. Zhang, D. Briggs, B. Lim, T. Chau, A. T. Bell, J. Phys. Chem. B 110
(2006) 11654-11664.

4
6. H. Marsh, F. Rodríguez-Reinoso, Applicability of Activated Carbon. In Activated
Carbon, Elsevier Science Ltd: Oxford, 2006; pp 383-453. 7. D. N. Briggs, K. H. Lawrence, A. T. Bell, Appl. Catal. A-Gen. 366 (2009) 71-83.
5
Chapter 2
Effects of zeolite structure and composition on the synthesis of dimethyl carbonate by oxidative carbonylation of methanol on Cu-
exchanged Y, ZSM-5, and mordenite 2.1. Introduction
Dimethyl carbonate (DMC) can be used as a fuel additive to replace methyl tert-butyl ether (MTBE), a precursor for synthesis of carbonic acid derivatives, as a methylating agent to replace methyl halides and dimethyl sulfate, and as an intermediate in the synthesis of polycarbonates and isocyanates [1-3]. Cu-exchanged zeolites have been shown to be active catalysts for the oxidative carbonylation of methanol to dimethyl carbonate, the principal by-products being dimethoxymethane (DMM) and methyl formate (MF) [4-9]. Prior studies have shown that the structure and chemical composition of the zeolite influence the activity and selectivity of Cu-exchanged zeolites. For example, Root et al. [7] have reported that Cu-X has a higher activity and selectivity for DMC formation than Cu-ZSM-5. The authors proposed that CO adsorption has a negative effect on the formation of DMC. However, the mechanism by which zeolite structure and chemical composition affect the adsorptive and catalytic properties of the catalyst were not investigated.
The present study was undertaken with the aim of assessing the effects of zeolite structure on the activity and selectivity of Cu-exchanged zeolites for the synthesis of DMC. Catalysts were prepared by solid-state ion exchange of H-Y, H-ZSM-5, and H-MOR with CuCl under conditions chosen to minimize the retention of occluded CuCl [8-10]. All catalysts were characterized after preparation by infrared spectroscopy to establish the extent to which Brönsted acid OH groups had been exchanged for copper cations and by XANES to establish the valence of the exchanged copper cations. The coordination of Cu to framework oxygen atoms was probed by EXAFS. The activity and selectivity of Cu-Y, Cu-ZSM-5, and Cu-MOR were then explored for a variety of conditions. In situ infrared and XANES measurements were carried out as well in order to identify the nature of the adsorbed species associated with the copper cations and the oxidation state of the copper cations during the oxidative carbonylation of methanol. 2.2. Experimental 2.2.1. Catalyst preparation and characterization
Cu-exchanged zeolites were prepared by solid-state ion exchange (SSIE) of the protonated form of each zeolite (Y: Si/Al = 2.5, Strem; ZSM-5: Si/Al = 12, ALSI-PENTA; MOR: Si/Al = 10, Zeolyst) with CuCl at elevated temperature in a flow of He. Details of this procedure are described elsewhere [8-11]. Freshly prepared catalysts, designated as Cu-Y, Cu-
6
ZSM-5 and Cu-MOR, were stored in a drybox prior to use. The level of proton exchange was monitored by observing the intensity of the infrared band for residual Brönsted acid sites.
The oxidation state of Cu in the Cu-exchanged zeolites was determined by Cu K-edge X-ray absorption near-edge spectroscopy (XANES). These data were acquired in transmission mode at the Stanford Synchrotron Radiation Laboratory (SSRL) on Beamline 2-3. This beamline is equipped with a double crystal monochromator, Si(111), detuned to 70% intensity to minimize the presence of higher harmonics. The samples were pressed into self-supporting wafers (calculated to have an absorbance of 2.5) and then mounted in a controlled-atmosphere cell operated at 101 kPa. Following characterization by XAS, each sample was cooled to 298 K before exposure to a particular gas or gas mixture. In separate experiments, pretreated Cu-exchanged zeolites were exposed to a mixture of He/CH3OH, He/CO, He/CO/O2/CH3OH. Methanol vapor was introduced using a gas saturator containing liquid methanol at 298 K. To examine the effects of gas adsorption, the sample was exposed to a flow of gas at room temperature and the temperature was then raised at 10 K min-1 to 403 K and held at this level for 1 h. All XAS measurements were made in situ. Cu XANES data were analyzed with the IFEFFIT package [12, 13]. Pre-edge absorptions due to the background and detector were subtracted with the use of a linear fit to the data in the range from -200 to -50 eV, relative to the sample edge energy (E0). Each spectrum was normalized by a constant determined by the average absorption in the range of 100 to 300 eV relative to E0. The edge energy of each sample and reference was taken at the first inflection point beyond any pre-edge peaks.
Extraction of the EXAFS data from the measured absorption spectra was performed with the XDAP code [14]. The pre-edge was subtracted using a modified Victoreen curve. The background was subtracted by employing cubic spline routines with a continuously adjustable smooth parameter. Normalization was performed by dividing the data by the height of the absorption edge at 50 eV.
Data analysis was performed by multiple-shell fitting in R-space using the EXAFS data-analysis program XDAP, which allows one to minimize the residuals between both the magnitude and the imaginary part of the Fourier transforms of the data and the fit. R-space fitting has significant advantages compared to the usually applied fitting in k-space, and is discussed extensively in a recent paper by Koningsberger et al. [15]. Theoretical phase shift and backscattering amplitude for the Cu-O absorber-scatterer pair were used in EXAFS data analysis, which were generated utilizing the FEFF8 code. The theoretical references were calibrated with using experimental data for Cu2O, employing the procedure as described in [10, 16]. 2.2.2. Catalytic performance
Measurements of catalyst activity and selectivity were carried out using 150 mg of catalyst loaded into a 10-mm inner diameter, tubular flow reactor made of quartz. Prior to exposure to reactants, the catalyst was pretreated at 873 K for 1 h in a stream of high purity He (99.999%). For the catalytic experiment, a CO/O2 mixture (25.0% CO, 2.5% O2, balance He) and He (99.999%) were used. Methanol (CH3OH) was introduced by passing the CO/O2 mixture through a saturator maintained at a constant temperature of 293 K. The reaction products were analyzed by gas chromatography equipped with a capillary column (Alltech, AT aquawax; polyethylene glycol stationary phase) connected to a flame ionization detector (FID) and by a packed column (Alltech, Haysep DB packing) connected to a thermal conductivity detector (TCD).
7
The effects of feed space velocity were investigated using a CH3OH/O2/CO/He mixture (4.0/1.0/9.0/19.3). The flow rate of this mixture was varied from 3-80 cm3/min while maintaining the catalyst temperature at 403 K. A second series of experiments designed to study the effects of CO, CH3OH, and O2 partial pressures on reaction rate and product selectivity was carried out using a fresh sample of Cu-exchanged zeolite. In this case the total flow rate of feed was maintained at 20 cm3/min and the catalyst temperature was 403 K.
Product selectivity has been determined using the following equation:
SDMC/CO = [DMC]/([DMC]+[CO2])
Si/CH3OH = n[i]/(2[DMC]+2[MF]+3[DMM]+2[DME]) i: DMC, MF, DMM, DME; n: number of carbon atoms derived from methanol
2.2.3. Infrared characterization of adsorbed species
Infrared spectra were recorded on a Nicolet Nexus 670 FTIR spectrometer equipped with an MCT-A detector. Measurements were taken using a resolution of 4 cm-1. The catalysts were pressed into 15 mg self-supporting pellets and then placed into an infrared cell equipped with CaF2 windows. Prior to absorbate exposure, the catalyst was heated in He at 673 K. 2.3. Results 2.3.1. Catalyst characterization
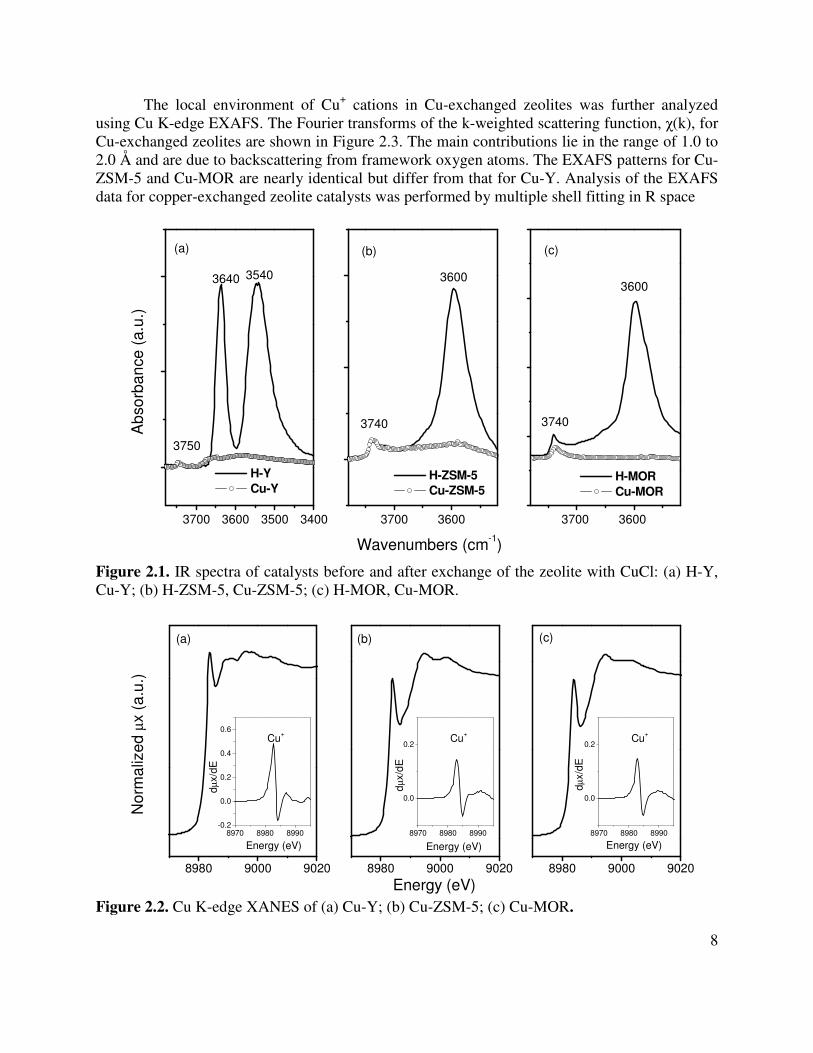
Figure 2.1 illustrates the infrared spectrum for the O-H stretching region. Spectra are shown for zeolites before and after SSIE. Two bands located at 3640 and 3540 cm-1 for H-Y, which are attributable to the Brönsted acid O-H stretching vibrations located in the supercage and sodalite cage, respectively [8, 17, 18]. The small band at 3750 cm-1 is due to the silanol groups in zeolite Y. The infrared spectrum of H-ZSM-5 has only a single band at 3600 cm-1 characteristic of the Brönsted acid OH groups and small silanol band at 3740 cm-1 [19]. The infrared spectrum of H-MOR is very similar to that of H-ZSM-5, exhibiting a bands at 3600 and 3740 cm-1 for Brönsted acid OH and silanol groups, respectively [20]. As shown in Figure 2.1, bridging hydroxyl stretches disappeared after H-Y, H-ZSM-5 and H-MOR were exchanged with CuCl, suggesting that the Brönsted acid sites are replaced quantitatively by Cu+ cations.
Cu K-edge XANES was used to determine the oxidation state of copper cations exchanged into each zeolite. Figure 2.2 displays the XANES spectra of Cu-Y, Cu-ZSM-5 and Cu-MOR and their corresponding first derivative curves. A single, well-defined pre-edge peak at 8983.8 eV is observed on all three catalysts. This feature has been assigned to the degenerate 1s-4px,y electron transition of Cu+ cations, which are doubly or triply coordinated in a linear or planar configuration, respectively [10, 21, 22]. The absence of Cu2+ and Cu0 features rules out the presence of CuO or Cu metal species in copper exchanged samples. The absence of a peak at 8987.3 eV in the XANES region also suggests the absence of any bulk CuCl. The intensity of the pre-edge feature for Cu-Y is higher than that for Cu-ZSM-5 or Cu-MOR, implying that Cu+ sites in Cu-Y have a more unsaturated coordination to zeolite framework.
8
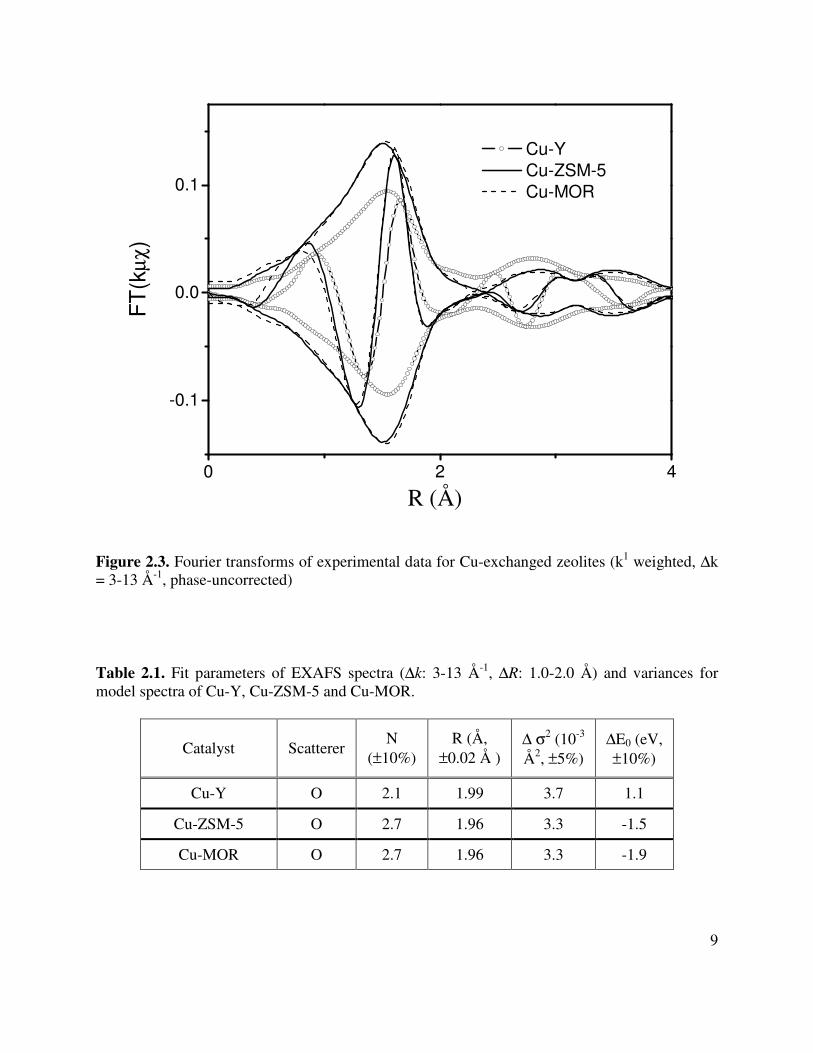
The local environment of Cu+ cations in Cu-exchanged zeolites was further analyzed using Cu K-edge EXAFS. The Fourier transforms of the k-weighted scattering function, χ(k), for Cu-exchanged zeolites are shown in Figure 2.3. The main contributions lie in the range of 1.0 to 2.0 Å and are due to backscattering from framework oxygen atoms. The EXAFS patterns for Cu-ZSM-5 and Cu-MOR are nearly identical but differ from that for Cu-Y. Analysis of the EXAFS data for copper-exchanged zeolite catalysts was performed by multiple shell fitting in R space
Figure 2.1. IR spectra of catalysts before and after exchange of the zeolite with CuCl: (a) H-Y, Cu-Y; (b) H-ZSM-5, Cu-ZSM-5; (c) H-MOR, Cu-MOR.
Figure 2.2. Cu K-edge XANES of (a) Cu-Y; (b) Cu-ZSM-5; (c) Cu-MOR.
3700 3600 3500 3400 3700 36003700 3600
H-Y
Cu-Y
Ab
so
rba
nce
(a
.u.)
35403640
3750
(a)
H-MOR
Cu-MOR
Wavenumbers (cm-1)
3600
3740
(c)
H-ZSM-5
Cu-ZSM-5
3600
3740
(b)
8980 9000 9020
8970 8980 8990-0.2
0.0
0.2
0.4
0.6
8980 9000 9020
8970 8980 8990
0.0
0.2
8980 9000 9020
8970 8980 8990
0.0
0.2
No
rma
lize
d µ
x (
a.u
.)
(a)
Energy (eV)
dµx/d
E
Cu+
(b)
Energy (eV)
dµx/d
E
Cu+
Energy (eV)
(c)
Energy (eV)
dµx/d
E
Cu+
9
Figure 2.3. Fourier transforms of experimental data for Cu-exchanged zeolites (k1 weighted, ∆k = 3-13 Å-1, phase-uncorrected) Table 2.1. Fit parameters of EXAFS spectra (∆k: 3-13 Å-1, ∆R: 1.0-2.0 Å) and variances for model spectra of Cu-Y, Cu-ZSM-5 and Cu-MOR.
Catalyst Scatterer N
(±10%) R (Å,
±0.02 Å ) ∆ σ2 (10-3 Å2, ±5%)
∆E0 (eV, ±10%)
Cu-Y O 2.1 1.99 3.7 1.1
Cu-ZSM-5 O 2.7 1.96 3.3 -1.5
Cu-MOR O 2.7 1.96 3.3 -1.9
0 2 4
-0.1
0.0
0.1
Cu-Y
Cu-ZSM-5
Cu-MOR
FT
(kµ
χ)
R (Å)
10
over the range of 1 < R < 2 Å. Cl backscattering was not included for the fitting, for which the contribution has been proven to be negligible [10]. The EXAFS coordination parameters are given in Table 2.1. For Cu-Y, the Cu-O first shell coordination number is 2.1 and the Cu-O bond distance is 1.99±0.02 Å. By contrast, for Cu-ZSM-5 and Cu-MOR the Cu-O coordination number is 2.7 and the Cu-O bond distance is 1.96±0.02 Å. These observations agree with the XANES observation, which show a more intense pre-edge feature on Cu-Y than Cu-ZSM-5 or Cu-MOR, implying the more unsaturated local coordination for Cu+ sites in Cu-Y. 2.3.2. CO-TPD
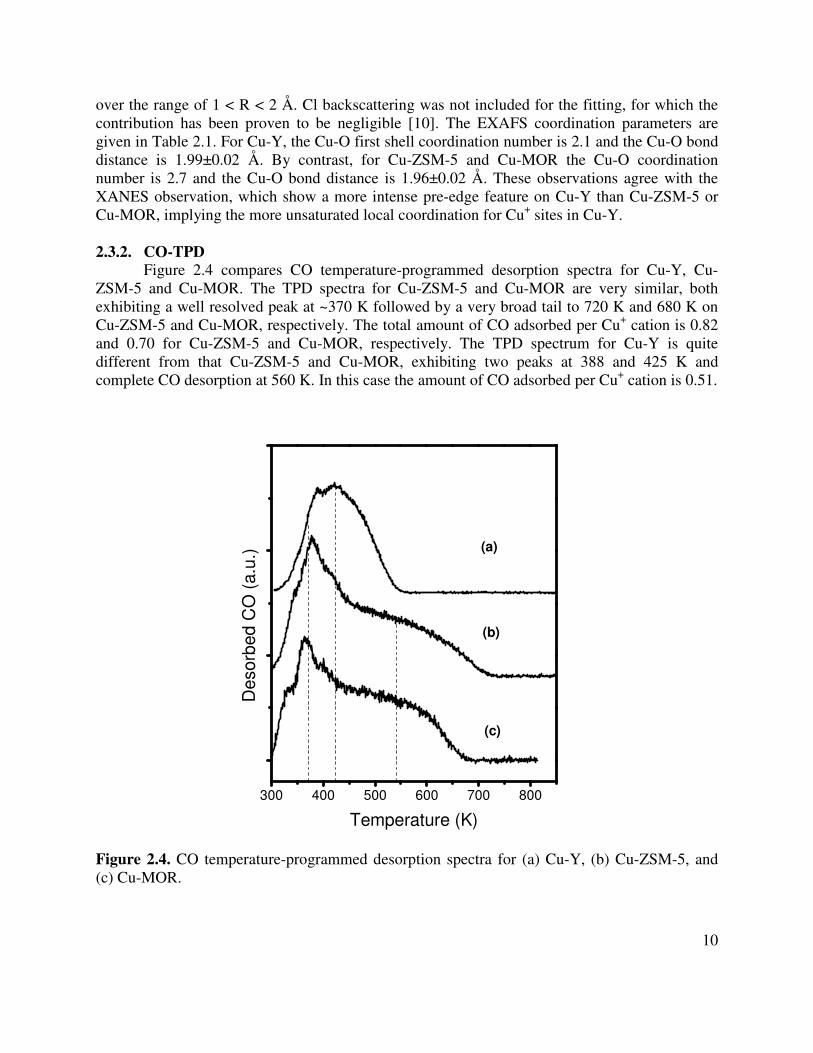
Figure 2.4 compares CO temperature-programmed desorption spectra for Cu-Y, Cu-ZSM-5 and Cu-MOR. The TPD spectra for Cu-ZSM-5 and Cu-MOR are very similar, both exhibiting a well resolved peak at ~370 K followed by a very broad tail to 720 K and 680 K on Cu-ZSM-5 and Cu-MOR, respectively. The total amount of CO adsorbed per Cu+ cation is 0.82 and 0.70 for Cu-ZSM-5 and Cu-MOR, respectively. The TPD spectrum for Cu-Y is quite different from that Cu-ZSM-5 and Cu-MOR, exhibiting two peaks at 388 and 425 K and complete CO desorption at 560 K. In this case the amount of CO adsorbed per Cu+ cation is 0.51.
Figure 2.4. CO temperature-programmed desorption spectra for (a) Cu-Y, (b) Cu-ZSM-5, and (c) Cu-MOR.
300 400 500 600 700 800
(c)
(b)
Desorb
ed
CO
(a.u
.)
Temperature (K)
(a)
11
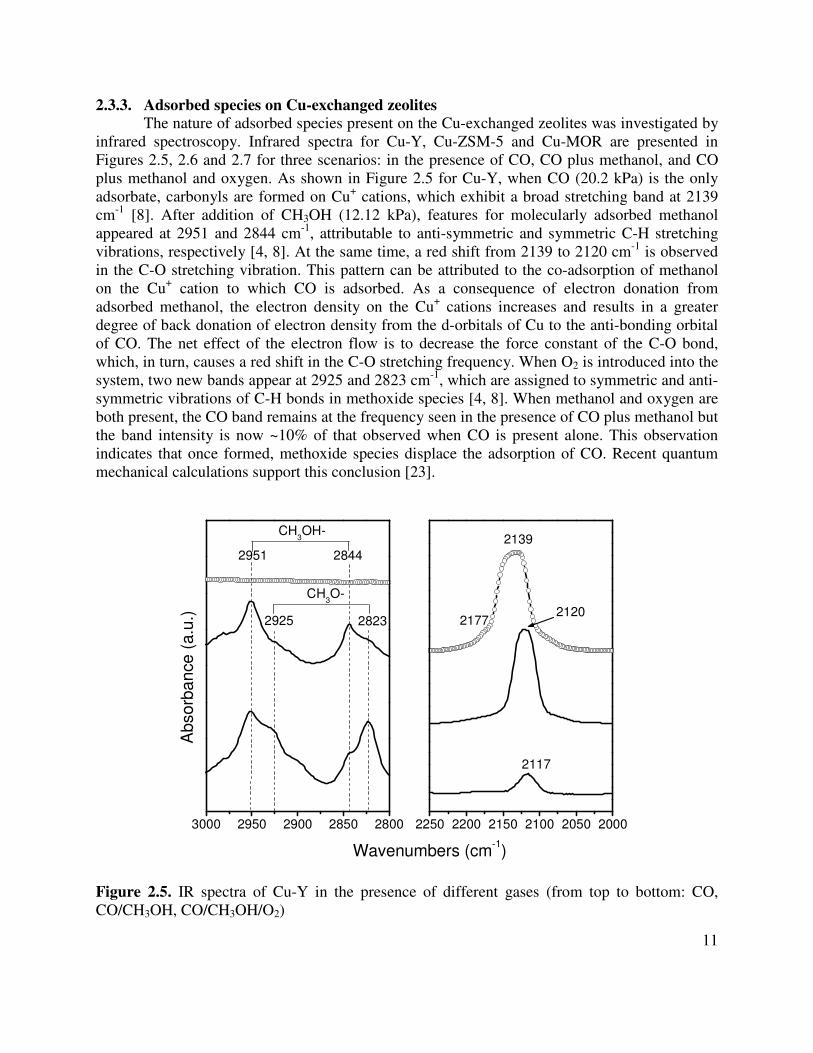
2.3.3. Adsorbed species on Cu-exchanged zeolites The nature of adsorbed species present on the Cu-exchanged zeolites was investigated by
infrared spectroscopy. Infrared spectra for Cu-Y, Cu-ZSM-5 and Cu-MOR are presented in Figures 2.5, 2.6 and 2.7 for three scenarios: in the presence of CO, CO plus methanol, and CO plus methanol and oxygen. As shown in Figure 2.5 for Cu-Y, when CO (20.2 kPa) is the only adsorbate, carbonyls are formed on Cu+ cations, which exhibit a broad stretching band at 2139 cm-1 [8]. After addition of CH3OH (12.12 kPa), features for molecularly adsorbed methanol appeared at 2951 and 2844 cm-1, attributable to anti-symmetric and symmetric C-H stretching vibrations, respectively [4, 8]. At the same time, a red shift from 2139 to 2120 cm-1 is observed in the C-O stretching vibration. This pattern can be attributed to the co-adsorption of methanol on the Cu+ cation to which CO is adsorbed. As a consequence of electron donation from adsorbed methanol, the electron density on the Cu+ cations increases and results in a greater degree of back donation of electron density from the d-orbitals of Cu to the anti-bonding orbital of CO. The net effect of the electron flow is to decrease the force constant of the C-O bond, which, in turn, causes a red shift in the C-O stretching frequency. When O2 is introduced into the system, two new bands appear at 2925 and 2823 cm-1, which are assigned to symmetric and anti-symmetric vibrations of C-H bonds in methoxide species [4, 8]. When methanol and oxygen are both present, the CO band remains at the frequency seen in the presence of CO plus methanol but the band intensity is now ~10% of that observed when CO is present alone. This observation indicates that once formed, methoxide species displace the adsorption of CO. Recent quantum mechanical calculations support this conclusion [23].
Figure 2.5. IR spectra of Cu-Y in the presence of different gases (from top to bottom: CO, CO/CH3OH, CO/CH3OH/O2)
3000 2950 2900 2850 2800 2250 2200 2150 2100 2050 2000
Absorb
ance
(a.u
.)
Wavenumbers (cm-1)
2951 2844
2925 2823
CH3OH-
CH3O-
2177
2139
2120
2117
12
Figure 2.6. IR spectra of Cu-ZSM-5 in the presence of different gases (from top to bottom: CO, CO/CH3OH, CO/CH3OH/O2). Figure 2.7. IR spectra of Cu-MOR in the presence of different gases (from top to bottom: CO, CO/CH3OH, CO/CH3OH/O2).
3000 2950 2900 2850 2800 2250 2200 2150 2100 2050 2000
Ab
so
rban
ce
(a
.u.)
Wavenumbers (cm-1)
2954
2925
2846
2825
2150
2176
2128
CH3OH-
CH3O-
3000 2950 2900 2850 2800 2250 2200 2150 2100 2050 2000
Ab
so
rba
nce
(a
.u.)
Wavenumbers (cm-1)
2951
2920
2846
2825 2175
2150
2126
CH3OH-
CH3O-
2925 2825
13
Figure 2.6 shows infrared spectra for a series of experiments using Cu-ZSM-5, which are similar to those shown in Figure 2.5 for Cu-Y. The carbonyl species on Cu-ZSM-5 is located at 2150 cm-1 [9]. When methanol and CO are present together the position of the CO band red shifts to 2126 cm-1. However, in contrast to what is observed for Cu-Y the addition of oxygen to the gas stream present over the catalyst does not further alter the spectrum and very little evidence for the formation of methoxide species is observed in the C-H stretching region of the spectrum. This clearly indicates that the concentration of surface methoxide species is much lower on Cu-ZSM-5 than on Cu-Y. Figure 2.7 shows that the behavior of Cu-MOR is similar to that of Cu-ZSM-5 and, again, different from that of Cu-Y. 2.3.4. Cu XANES for Cu-exchanged zeolites in DMC synthesis
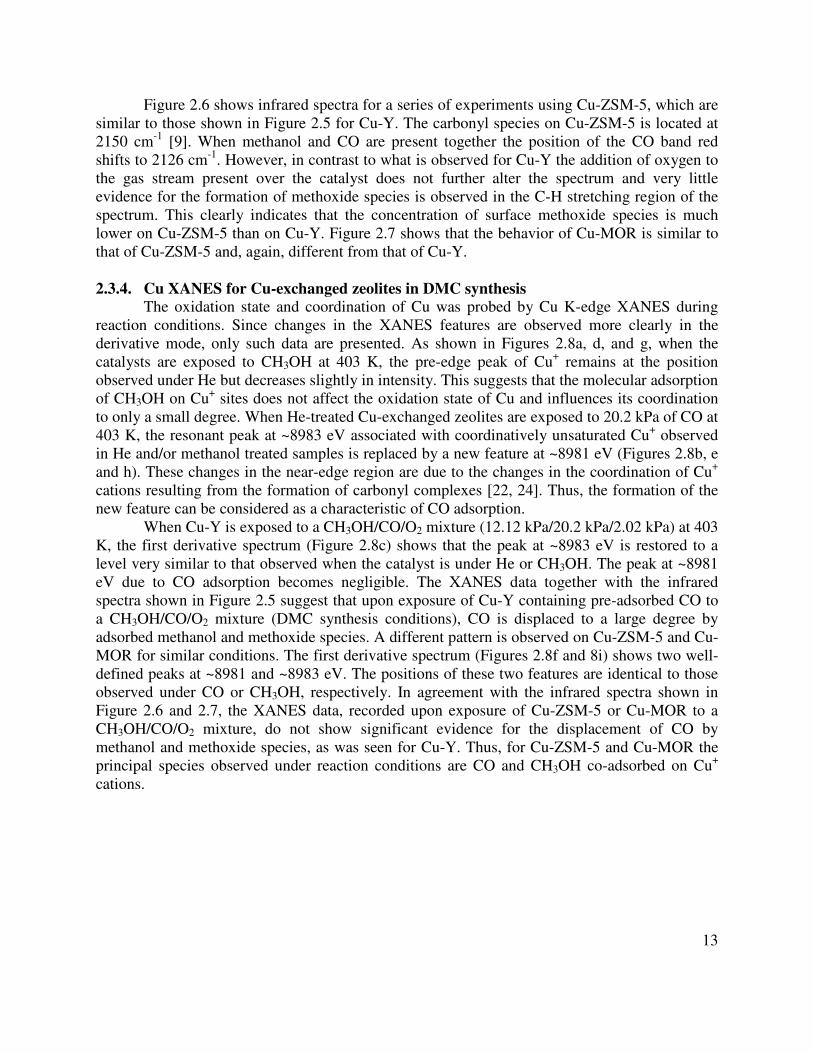
The oxidation state and coordination of Cu was probed by Cu K-edge XANES during reaction conditions. Since changes in the XANES features are observed more clearly in the derivative mode, only such data are presented. As shown in Figures 2.8a, d, and g, when the catalysts are exposed to CH3OH at 403 K, the pre-edge peak of Cu+ remains at the position observed under He but decreases slightly in intensity. This suggests that the molecular adsorption of CH3OH on Cu+ sites does not affect the oxidation state of Cu and influences its coordination to only a small degree. When He-treated Cu-exchanged zeolites are exposed to 20.2 kPa of CO at 403 K, the resonant peak at ~8983 eV associated with coordinatively unsaturated Cu+ observed in He and/or methanol treated samples is replaced by a new feature at ~8981 eV (Figures 2.8b, e and h). These changes in the near-edge region are due to the changes in the coordination of Cu+ cations resulting from the formation of carbonyl complexes [22, 24]. Thus, the formation of the new feature can be considered as a characteristic of CO adsorption.
When Cu-Y is exposed to a CH3OH/CO/O2 mixture (12.12 kPa/20.2 kPa/2.02 kPa) at 403 K, the first derivative spectrum (Figure 2.8c) shows that the peak at ~8983 eV is restored to a level very similar to that observed when the catalyst is under He or CH3OH. The peak at ~8981 eV due to CO adsorption becomes negligible. The XANES data together with the infrared spectra shown in Figure 2.5 suggest that upon exposure of Cu-Y containing pre-adsorbed CO to a CH3OH/CO/O2 mixture (DMC synthesis conditions), CO is displaced to a large degree by adsorbed methanol and methoxide species. A different pattern is observed on Cu-ZSM-5 and Cu-MOR for similar conditions. The first derivative spectrum (Figures 2.8f and 8i) shows two well-defined peaks at ~8981 and ~8983 eV. The positions of these two features are identical to those observed under CO or CH3OH, respectively. In agreement with the infrared spectra shown in Figure 2.6 and 2.7, the XANES data, recorded upon exposure of Cu-ZSM-5 or Cu-MOR to a CH3OH/CO/O2 mixture, do not show significant evidence for the displacement of CO by methanol and methoxide species, as was seen for Cu-Y. Thus, for Cu-ZSM-5 and Cu-MOR the principal species observed under reaction conditions are CO and CH3OH co-adsorbed on Cu+ cations.
14
Figure 2.8. The first derivative curves of Cu K-edge XANES on (a)-(c): Cu-Y; (d)-(f) Cu-ZSM-5; (g)-(i) Cu-MOR, under different atmospheres.
0.00
0.05
0.10
0.15
8970 8980 8990 9000-0.02
0.00
0.02
0.04
0.06
0.08
-0.1
0.0
0.1
0.2
0.3
-0.1
0.0
0.1
0.2
-0.02
0.00
0.02
0.04
0.06
0.08
0.10
8970 8980 8990 9000-0.02
0.00
0.02
0.04
0.06
0.08
8970 8980 8990 9000-0.1
0.0
0.1
0.2
0.3 CH3OH/CO/O
2
No
rma
lized
dµµ µµx
/dx
c
0.0
0.1
0.2
CO
b
-0.2
0.0
0.2
0.4
0.6 He
CH3OH
a
CO
e
CH3OH/CO/O
2
Photon Energy (eV)
f
He
CH3OH
d He
CH3OH
g
COh
CH3OH/CO/O
2
i
15
2.3.5. Catalytic activity and selectivity Figure 2.9 displays the effects of methanol conversion on the rates of product formation
and the corresponding product selectivities for Cu-Y, Cu-ZSM-5, and Cu-MOR. All experiments were carried out at 403 K and 101 kPa with a feed containing CH3OH/CO/O2 in the ratio 12.12/20.2/2.02 kPa. In each case, 150 mg of catalyst was used and the methanol conversion was varied by changing the flow rate of the feed mixture. The carbon-containing products observed included DMC, DMM, MF, DME, and CO2. The overall activity at a given methanol conversion is highest for Cu-Y and declines in the order Cu-Y > Cu-ZSM-5 >> Cu-MOR. The distribution of products is also a strong function of zeolite structure. For an extrapolated conversion of zero, the selectivity to DMC is about 84% for Cu-Y but is 50% for Cu-ZSM-5 and only 35% for Cu-MOR. However, with increasing methanol conversion the selectivity to DMC for all catalysts decreases and is paralleled by an increase in the rate of CO2 formation.
DMM is the second most prevalent product formed from methanol. At zero conversion the selectivity to DMM from methanol is 10% for Cu-Y, 40% for Cu-ZSM-5, and 35% for Cu-MOR. The selectivity to this product rises with increasing methanol conversion. Small amounts of MF and DME are formed on all three catalysts. For an extrapolated conversion of zero the selectivity to MF is highest on Cu-MOR, 25%, and lowest on Cu-Y, 5%. Only small changes in the selectivity to MF are observed for any of the catalysts with increasing methanol conversion. DME is formed to a very limited extent on Cu-Y; however, modest selectivities to this product are seen for Cu-ZSM-5 and Cu-MOR. The selectivity to DME increases with methanol conversion for both Cu-Y and Cu-ZSM-5 but is almost constant for Cu-MOR.
The influence of reactant partial pressures are shown in Figures 2.10-2.12. All of these data were obtained at 403 K, a total pressure of 101 kPa, and a fixed space time. An increase in CO partial pressure causes a strong increase in the rate of DMC and CO2 formation on Cu-Y but has little effect on the formation of DMM, MF, or DME. A similar pattern with respect to DMC and CO2 formation is observed for Cu-MOR but in this case, the rate of DMM formation is relatively insensitive to the CO partial pressure, whereas the rates of MF and DME formation decline with increasing CO partial pressure. For Cu-ZSM-5 the rates of DMC and CO2 formation show a more modest increase with increasing CO partial pressure than was seen for Cu-Y or Cu-MOR. However, in contrast to the other catalysts, the rates of DMM, MF, and DME formation exhibit a decrease with increasing CO partial pressure.
The rate of DMC formation for Cu-Y and Cu-ZSM-5 pass through a broad maximum with increasing methanol partial pressure, whereas for Cu-MOR the rate of DMC formation increases monotonically with increasing methanol partial pressure. For Cu-Y the rates of DMM and MF formation show negligible changes with increasing methanol partial pressure, whereas the rates of CO2 and DME formation decrease with increasing methanol partial pressure. The dependence of the rate of DMM formation on Cu-ZSM-5 is similar to that observed for DMC, whereas the rates of all other products decrease with increasing methanol partial pressure. By contrast, for Cu-MOR the rate of MF formation passes through a shallow minimum but the rate of all DMM, DME, and CO2 increase with increasing methanol partial pressure.
The effects of O2 partial pressure on the rates of product formation are more similar for all three catalysts than those observed for changes in the CO and methanol partial pressures. The rate of DMC formation decreases slightly with increasing O2 partial pressure for Cu-Y and Cu-MOR but increases for Cu-ZSM-5. However, the rates of DMM, MF, and CO2 formation increase with increasing O2 partial pressure for all three catalysts.
16
Figure 2.9. Selectivities and production rates as a function of methanol conversion (achieved by varying the feed residence time) on Cu-Y (a,d), Cu-ZSM-5 (b, e), Cu-MOR (c, f) at 403 K under CH3OH /CO/O2 (12.12/20.2/2.02 kPa).
0 2 40
20
40
60
80
100
2 4 6 80
20
40
60
80
100
0 1 2 30
20
40
60
80
100
SDMC/CO
SDMC/MeOH
SMF
SDMM
SDME
Se
lectivity (
%)
XMethanol
(%)
(b) SDMC/CO
SDMC/MeOH
SMF
SDMM
SDME
Se
lectivity (
%)
XMethanol
(%)
(a) SDMC/CO
SDMC/MeOH
SMF
SDMM
SDME
Se
lectivity (
%)
XMethanol
(%)
(c)
0 2 40.0
0.5
1.0
1.5
2.0
2.5
3.0
2 4 6 80
1
2
3
4
5
6
0 1 2 30.0
0.2
0.4
0.6
0.8
1.0
DMC
MF
DMM
DME
CO2
XMethanol
(%)
(e)
r (x
10
-5s
-1)
r (x
10
-5s
-1)
DMC
MF
DMM
DME
CO2
r (x
10
-5s
-1)
XMethanol
(%)
(d) DMC
MF
DMM
DME
CO2
XMethanol
(%)
(f)
17
Figure 2.10. Effect of reactant partial pressure on the oxidative carbonylation of methanol at 403 K on Cu-Y, (a) CO (CH3OH: 12.12 kPa; O2: 2.53 kPa); (b) CH3OH (CO: 25.25 kPa, O2: 2.53 kPa); (c) O2 (CO: 25.25 kPa, CH3OH: 12.12 kPa).
Figure 2.11. Effect of reactant partial pressure on the oxidative carbonylation of methanol at 403 K on Cu-ZSM-5, (a) CO (CH3OH: 12.12 kPa; O2: 2.53 kPa); (b) CH3OH (CO: 25.25 kPa, O2: 2.53 kPa); (c) O2 (CO: 25.25 kPa, CH3OH: 12.12 kPa).
0 2 4 6 80
1
2
3
0 20 40 600
2
4
6
0 10 20 30 400
1
2
3
r i (x1
0-5 s
-1)
DMC
MF
DMM
DME
CO2
O2 (kPa)
r i (x1
0-5 s
-1)
DMC
MF
DMM
DME
CO2
DMC
MF
DMM
DME
CO2
CO pressure (kPa)
(a) (b) (c)
r i (x1
0-5 s
-1)
CH3OH (kPa)
0 2 4 6 80
1
2
3
0 20 40 600
1
2
3
0 10 20 30 400
1
2
r i (x10
-5 s
-1)
DMC
MF
DMM
DME
CO2
O2 (kPa)
r i (x10
-5 s
-1)
DMC
MF
DMM
DME
CO2
DMC
MF
DMM
DME
CO2
CO pressure (kPa)
(a) (b) (c)
r i (x10
-5 s
-1)
CH3OH (kPa)
18
Figure 2.12. Effect of reactant partial pressure on the oxidative carbonylation of methanol at 403 K on Cu-MOR, (a) CO (CH3OH: 12.12 kPa; O2: 2.53 kPa); (b) CH3OH (CO: 25.25 kPa, O2: 2.53 kPa); (c) O2 (CO: 25.25 kPa, CH3OH: 12.12 kPa).
0 2 4 6 80
1
0 20 40 600
1
0 10 20 30 400
1
r i (x1
0-5 s
-1)
DMC
MF
DMM
DME
CO2
O2 (kPa)
r i (x10
-5 s
-1)
DMC
MF
DMM
DME
CO2
DMC
MF
DMM
DME
CO2
CO pressure (kPa)
(a) (b) (c)
r i (
x1
0-5 s
-1)
CH3OH (kPa)
19
2.4. Discussion 2.4.1. Catalyst characterization
Complete exchange of Brönsted acid protons in H-Y, H-ZSM-5, and H-MOR by copper cations is achieved by SSIE, as evidenced by disappearance of the infrared band for Brönsted acid hydroxyl groups, and Cu K-edge XANES demonstrates that independent of the zeolite framework structure and Si/Al ratio all of the exchanged copper is present as Cu+ in the as-prepared catalyst. Differences in the Cu-O coordination and bond lengths are revealed by Cu K-edge EXAFS. The Cu-O coordination number decreases in the sequence of NCu-ZSM-5 = NCu-MOR > NCu-Y, whereas the average Cu-O bond distance increases in the sequence of RCu-ZSM-5 = RCu-MOR
< NCu-Y. The infrared spectroscopy of adsorbed CO provides limited evidence for differences in
the properties of Cu+ cation exchanged into zeolites Y, ZSM-5, and MOR. As shown in Figures 2.5-2.7, the infrared spectrum of adsorbed CO consists of two or more overlapping bands occurring in the region of 2139-2150 cm-1. The band for CO adsorbed on Cu-Y is broader than that for CO adsorbed on either Cu-ZSM-5 or Cu-MOR, particularly on the low-frequency side, and it is notable that the band for CO adsorbed on Cu-ZSM-5 and Cu-MOR are very similar in shape and position. DFT calculations for CO adsorbed on Cu-ZSM-5 and Cu-Y show that the vibrational frequencies for the two zeolites are very similar and that there is no obvious correlation of band position with zeolite framework structure or Si/Al ratio [25].
The most significant effect of zeolite structure and Si/Al ratio on the properties of Cu+ exchanged Y, ZSM-5, and MOR is provided by the CO TPD spectra presented in Figure 2.4. It is evident here that the complete desorption of CO occurs at a significantly lower temperature for Cu-Y than for Cu-ZSM-5 and Cu-MOR, for which the TPD spectra are very similar. The total amount of CO adsorbed at 298 K per Cu+ cation also reflects the zeolite structure and the Si/Al ratio. For Cu-Y CO/Cu = 0.51, whereas CO/Cu = 0.82 for Cu-ZSM-5 and 0.70 for Cu-MOR. These results are consistent with experimentally measured heats of CO adsorption. Calorimetric measurements of the heat of CO adsorption on Cu-Y are reported to be in the range of 15.5-19.1 kcal/mol [26], whereas values between 23.8 and 31 kcal/mol have been reported for Cu-ZSM-5 [27, 28]. DFT calculations have shown that the heat of CO adsorption in Cu-Y is 15.0 kcal/mol, whereas it is between 24-33 kcal/mol for Cu-ZSM-5 [25]. These calculations have also shown that the strength of CO adsorption is more sensitive to the Si/Al ratio than to the local structure of the exchange site, which reflects the framework structure of the zeolite. Thus, the lower heat of CO adsorption for Cu-Y is a direct consequence of its lower Si/Al ratio (2.5) than that of Cu-ZSM-5 (12) or Cu-MOR (10). 2.4.2. Catalyst activity and selectivity
The results presented in Figures 2.9 and 2.10 demonstrate clearly that Cu-Y is a more active catalyst for DMC synthesis than either Cu-ZSM-5 or Cu-MOR. The rate of DMC synthesis increases significantly with increasing CO partial pressure, is independent of O2 partial pressure, and passes through a broad maximum with CH3OH partial pressure. Some DMM is produced over Cu-Y but at low methanol conversion the selectivity to this product is only 10%. The only other product seen in significant concentration is CO2. The formation of CO2 also rises strongly with CO partial pressure, is insensitive to O2 partial pressure, and decreases with increasing CH3OH partial pressure. As the conversion of methanol increases the rate of DMC
20
synthesis declines while the rate of CO2 formation increases. A probable cause for this trend is the reaction of DMC and H2O, both of which are formed under reaction conditions, to produce methanol and CO2 via the reaction [1]
H2O + (CH3O)2CO → 2 CH3OH + CO2
Since ∆Go for this reaction is – 12.2 kcal/mol, it should occur spontaneously. Insights into the processes involved in the formation of DMC can be gained from the in
situ infrared and XANES spectra appearing in Figures 2.5 and 2.8, respectively. Figure 2.5 shows that under DMC synthesis conditions the amount of adsorbed CO decreases considerably relative to what was observed in the presence of CO alone, and the position of the CO band is red-shifted by 22 cm-1. Features for adsorbed methanol and methoxide species are also clearly seen under reaction conditions. The derivative XANES patterns shown in Figure 2.8 confirm that under DMC synthesis conditions the fraction of the Cu+ cations interacting with CO diminishes significantly relative to that observed in the presence of CO alone. These observations suggest that under reaction conditions methoxide species are formed at the Cu+ sites and that the formation of these species inhibits the adsorption of CO. Quantum calculations indicate that CO could adsorb weakly on a Cu+ cation containing a single methoxide species, but not on one containing a methoxide species and a second ligand, such as OH, OOH, or OCH3 [23]. It is noted further that when the formation of methoxide species is limited, as is the case on Cu-ZSM-5 and Cu-MOR, the rate of DMC formation is reduced significantly (see Figures 2.9e and f). Therefore, the formation of methoxide species appears to be an essential first step along the pathway to the formation of DMC. As shown below, DMC may form via one of two pathways. The first is by the addition of gas-phase or weakly adsorbed CO to a species such as Z-[Cu+(OH)(OCH3)] to produce Z-[Cu+(OH)(O(CO)CH3)], Reaction 2. The addition of CH3OH to the latter species would produce DMC and H2O, Reaction 3. This pathway is similar to that proposed by King [4, 5] and by Anderson and Root [6, 7]. Alternatively, CH3OH may add first to Z-[Cu+(OH)(OCH3)] to produce Z-[Cu+(OCH3)2] plus water via Reaction 4, after which CO reacts with the dimethoxide to form DMC, Reaction 5. The latter route appears to be preferred, since the exposure of Cu-Y containing methoxide species prepared by exposure of the catalyst to a mixture of CH3OH and O2 at 403 K to CO in He results in the immediate appearance of DMC in the gas phase and the observation by infrared spectroscopy of bands attributable to DMC adsorbed on Cu-Y.
Z[CuO] + CH3OH → Z[Cu(OH)(OCH3)] (1) Z[Cu(OH)(OCH3)] + CO → Z[Cu(OH)(O(CO)CH3)] (2) Z[Cu(OH)(O(CO)CH3)] + CH3OH → ZCu + (CH3O)2CO + H2O (3) Z[Cu(OH)(OCH3)] + CH3OH → Z[Cu(OCH3)2] + H2O (4) Z[Cu(OCH3)2] + CO → ZCu + (CH3O)2CO (5) In contrast to Cu-Y, Cu-ZSM-5 and Cu-MOR exhibit significantly lower activities for
DMC synthesis. The rates of DMC formation on the latter two catalysts increase with increasing CO partial pressure, in a manner similar to that observed for Cu-Y. Likewise, the rate of DMC formation is not very sensitive to the partial pressure of O2. Increasing the partial pressure of O2 leads to an increase in the rate of DMM formation on Cu-ZSM-5 and Cu-MOR.
21
As noted earlier, both infrared spectroscopy and XANES spectra taken in situ demonstrate that the concentration of surface methoxide species on Cu-ZSM-5 and Cu-MOR is much lower than on Cu-Y and that the majority of Cu+ cations are occupied by adsorbed methanol and CO. The strongly adsorbed CO appears to inhibit the formation of methoxide species and thus the formation of DMC. Thus, Reactions 3 and 5 (see above) appear to be strongly suppressed on Cu-ZSM-5 and Cu-MOR.
DMM is formed on all three catalysts. The rates of formation of this product are comparable on Cu-Y and Cu-MOR and noticeably higher for Cu-ZSM-5. The participation of O2 in the formation of this product is essential since the overall stoichiometry of DMM formation is 3 CH3OH + ½ O2 → (CH3O)2CH2 + 2 H2O. Consistent with this, it is observed in Figures 2.10-2.12 that the rate of DMM formation increases with increasing partial pressures of both CH3OH and O2. Since the rate of DMM formation does not appear to correlate with the formation of methoxide species, DMM may form via a concerted reaction involving CH3OH and O2; however the results of the present study are insufficient to provide a basis for suggesting what this mechanism might be. 2.5. Conclusions
Cu in Cu-Y, Cu-ZSM-5, and Cu-MOR prepared by solid-state exchange of H-Y, H-ZSM-5, and H-MOR with CuCl is present exclusively as Cu+. The average coordination number of the Cu+ is close to 2 for Cu-Y and between 2 and 3 for Cu-ZSM-5 and Cu-MOR. Under identical reaction conditions, the activity and selectivity of these catalysts for the oxidative carbonylation of methanol is a function of the zeolite structure and Si/Al ratio. The highest activity and selectivity are found for Cu-Y. Cu-ZSM-5 and Cu-MOR exhibit significantly lower DMC synthesis activities than Cu-Y and higher selectivities for DMM synthesis. The superior activity and selectivity of Cu-Y for DMC synthesis are associated with its weaker adsorption of CO. Under reaction conditions, CO adsorbed on Cu-Y is gradually displaced by methoxide species attached to the Cu+ cations. This process also occurs on Cu-ZSM-5 and Cu-MOR but to a much lesser extent. The ability of methoxide groups to displace adsorbed CO from the Cu+ cations of Cu-Y is closely related to the weaker binding of CO. Theoretical calculations suggest that the lower binding energy of CO to Cu+ cations in Cu-Y than in Cu-ZSM-5 or Cu-MOR is due to the lower Si/Al ratio of Cu-Y. The rate of DMC synthesis was found to increase strongly with CO partial pressure, weakly with O2 partial pressure, and to be virtually independent of CH3OH partial pressure. These trends, in combination with in situ infrared observations, suggest that the rate-limiting step for the formation of DMC is likely to be the insertion of CO into a Cu-OCH3 bond. A loss in DMC yield with increasing methanol conversion was observed and is attributed to the hydrolysis of DMC to methanol and carbon dioxide, a reaction that is thermodynamically favorable.
22
2.6. References 1. M. A. Pacheco, and C. L. Marshall, Energ Fuel 11 (1997) 2-29. 2. Y. Ono, Pure Appl. Chem. 68 (1996) 367-375. 3. Y. Ono, Appl. Catal. A-Gen 155 (1997) 133-166. 4. S. T. King, J. Catal. 161 (1996) 530-538. 5. S. T. King, Catal. Today 33 (1997) 173-182. 6. S. A. Anderson, and T. W. Root, J. Catal. 217 (2003) 396-405. 7. S. A. Anderson, and T. W. Root, J. Mol. Catal. A-Chem. 220 (2004) 247-255. 8. I. J. Drake, Y. H. Zhang, D. Briggs, B. Lim, T. Chau, and A. T. Bell, J. Phys. Chem. B
110 (2006) 11654-11664. 9. Y. H. Zhang, I. J. Drake, D. N. Briggs, and A. T. Bell, J. Catal. 244 (2006) 219-229. 10. Y. H. Zhang, I. J. Drake, and A. T. Bell, Chem. Mater. 18 (2006) 2347-2356. 11. I. J. Drake, Y. H. Zhang, M. K. Gilles, C. N. T. Liu, P. Nachimuthu, R. C. C. Perera, H.
Wakita, and A. T. Bell, J. Phys. Chem. B 110 (2006) 11665-11676. 12. M. Newville, J. Synchrotron Radiat. 8 (2001) 322-324. 13. B. Ravel, and M. Newville, J. Synchrotron. Radiat. 12 (2005) 537-541. 14. M. Vaarkamp, J. C. Linders, and D. C. Koningsberger, Physica B 209 (1995) 159-160. 15. D. C. Koningsberger, B. L. Mojet, G. E. van Dorssen, and D. E. Ramaker, Topics Catal.
10 (2000) 143-155. 16. Y. H. Zhang, M. L. Toebes, A. van der Eerden, W. E. O'Grady, K. P. de Jong, and D. C.
Koningsberger, J. Phys. Chem. B 108 (2004) 18509-18519. 17. U. Eichler, M. Brandle, and J. Sauer, J. Phys. Chem. B 101 (1997) 10035-10050. 18. M. W. Anderson, and J. Klinowski, Zeolites 6 (1986) 455-466. 19. A. Zecchina, S. Bordiga, G. Spoto, D. Scarano, G. Petrini, G. Leofanti, M. Padovan, and
C. O. Arean, J. Chem. Soc. Faraday Trans. 88 (1992) 2959-2969. 20. C. Lamberti, S. Bordiga, A. Zecchina, M. Salvalaggio, F. Geobaldo, and C. O. Arean, J.
Chem. Soc. Faraday Trans. 94 (1998) 1519-1525. 21. C. Lamberti, S. Bordiga, M. Salvalaggio, G. Spoto, A. Zecchina, F. Geobaldo, G. Vlaic,
and M. Bellatreccia, J. Phys. Chem. B 101 (1997) 344-360. 22. C. Lamberti, S. Bordiga, F. Bonino, C. Prestipino, G. Berlier, L. Capello, F. D'Acapito, F.
X. L. I. Xamena, and A. Zecchina, Phys. Chem. Chem. Phys. 5 (2003) 4502-4509. 23. X. Zheng, Y. Zhang, and A. T. Bell, unpublished work. 24. P. Kumashiro, Y. Kuroda, and M. Nagao, J. Phys. Chem. B 103 (1999) 89-96. 25. X. Zheng, Y. Zhang, and A. T. Bell, J. Phys. Chem. C., submitted. 26. G. D. Borgard, S. Molvik, P. Balaraman, T. W. Root, and J. A. Dumesic, Langmuir 11
(1995) 2065-2070. 27. Y. Kuroda, Y. Yoshikawa, S. Emura, R. Kumashiro, and M. Nagao, J. Phys. Chem. B
103 (1999) 2155-2164. 28. A. Gervasini, C. Picciau, and A. Auroux, Micropor. Mesopor. Matl. 35-6 (2000) 457-469.
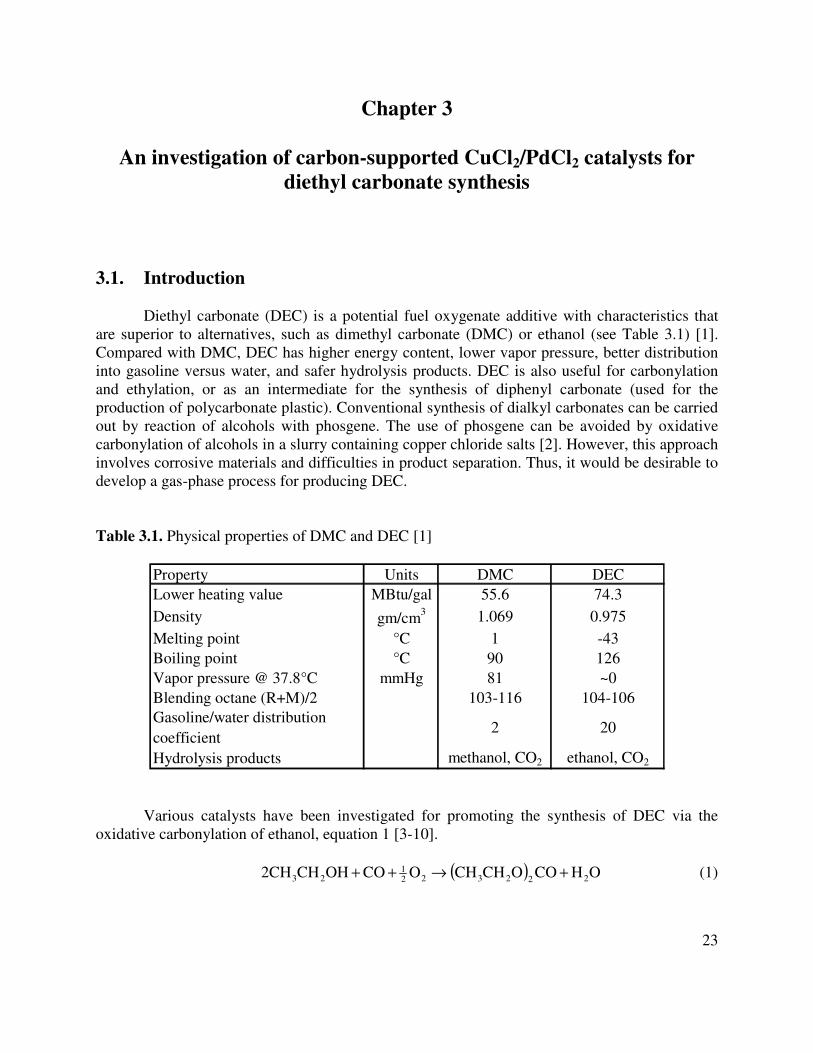
23
Chapter 3
An investigation of carbon-supported CuCl2/PdCl2 catalysts for diethyl carbonate synthesis
3.1. Introduction
Diethyl carbonate (DEC) is a potential fuel oxygenate additive with characteristics that are superior to alternatives, such as dimethyl carbonate (DMC) or ethanol (see Table 3.1) [1]. Compared with DMC, DEC has higher energy content, lower vapor pressure, better distribution into gasoline versus water, and safer hydrolysis products. DEC is also useful for carbonylation and ethylation, or as an intermediate for the synthesis of diphenyl carbonate (used for the production of polycarbonate plastic). Conventional synthesis of dialkyl carbonates can be carried out by reaction of alcohols with phosgene. The use of phosgene can be avoided by oxidative carbonylation of alcohols in a slurry containing copper chloride salts [2]. However, this approach involves corrosive materials and difficulties in product separation. Thus, it would be desirable to develop a gas-phase process for producing DEC.
Table 3.1. Physical properties of DMC and DEC [1]
Property Units DMC DECLower heating value MBtu/gal 55.6 74.3Density gm/cm3 1.069 0.975Melting point °C 1 -43Boiling point °C 90 126Vapor pressure @ 37.8°C mmHg 81 ~0Blending octane (R+M)/2 103-116 104-106Gasoline/water distributioncoefficient
2 20
Hydrolysis products methanol, CO2 ethanol, CO2 Various catalysts have been investigated for promoting the synthesis of DEC via the
oxidative carbonylation of ethanol, equation 1 [3-10]. ( ) OHCOOCHCHOCOOHCH2CH 222322
123 +→++ (1)
24
Virtually all of these materials are prepared by dispersing CuCl2 or CuCl2 and PdCl2 onto a support. Early studies showed that activated carbon (AC) was a particularly good catalyst support [5, 11]. A comparison of CuCl2/PdCl2 supported on silica, alumina, and AC revealed that a ten-fold higher activity to DEC could be achieved using AC rather than silica or alumina as the support [4]. The type of AC has been shown to have a significant impact on catalytic activity in DMC synthesis [3], as well as pretreatment of the AC support with HNO3, KOH, H2O, air or H2 before adding the catalytically active components [12].
Various promoters, such as alkali chlorides, hydroxides, and acetates, have been found to improve catalyst activity and stability [4, 8, 10-15]. Alkali chlorides are thought to reduce the loss of Cl from the catalysts, one of the mechanisms by which DEC activity is lost (see below), whereas alkali hydroxides are thought to reduce support acidity, which can contribute to the decomposition of DEC. Alkali hydroxides have also been hypothesized to promote the formation of copper hydroxychlorides, such as paratacamite, Cu2Cl(OH)3. The roles of these species are discussed below.
A number of investigators have noted that AC-based catalysts deactivate with time. Explanations of the cause of deactivation have focused on the loss of chlorine as a primary culprit [8, 10, 11, 16]. Catalyst activity can be regenerated by offline treatment with a chlorine-containing gas, such as HCl [11] or methyl chloroacetate [8]. It is also interesting to note that chlorine loss also occurs during catalyst activation when a freshly prepared catalyst is first exposed to reactants, suggesting that an optimal Cl/Cu ratio may exist [6]. Three other deactivation modes have been proposed. These include sintering of CuCl and reduction of PdCl2 for a CuCl-PdCl2/AC catalyst [17] and a transformation from one copper hydroxychloride phase to another [16].
The composition and structure of the active species for DEC synthesis and their relationship to the composition of the precursors used for catalyst preparation are not well understood. Several studies of CPAC catalysts have concluded that copper hydroxychlorides are formed during preparation and that these Cu species promote the synthesis of DEC or promote the reoxidation of Pd0 [4, 8, 10, 13, 15, 16, 18, 19]. Structural characterization of CPAC-type catalysts [6, 8, 10-13, 15, 16, 19] has shown that CuCl2 and PdCl2 are well-dispersed on the catalyst surface. After pretreatment or reaction, the Cl/Cu has been observed to decline relative to that in the as-prepared catalyst and the formation of copper hydroxychlorides has been reported in some cases.
While significant progress has been made towards identifying an active catalyst for the gas-phase synthesis of DEC, reports of high DEC yields on activated carbon-based catalysts are tempered by the observation that activity declines with time on stream. In addition, there is a lack of consensus regarding the identity and structure of active species in these catalysts. The aim of the present investigation was to carry out a detailed study of the factors affecting catalyst activity, selectivity, and stability for DEC. Measurements of catalyst activity and selectivity were combined with structural characterization using XRD, TEM, SEM-EDS, XANES, and EXAFS. Our results provide new evidence regarding the nature of Cu and Pd species in CPAC catalysts, as well as the role of KCl and NaOH additives.
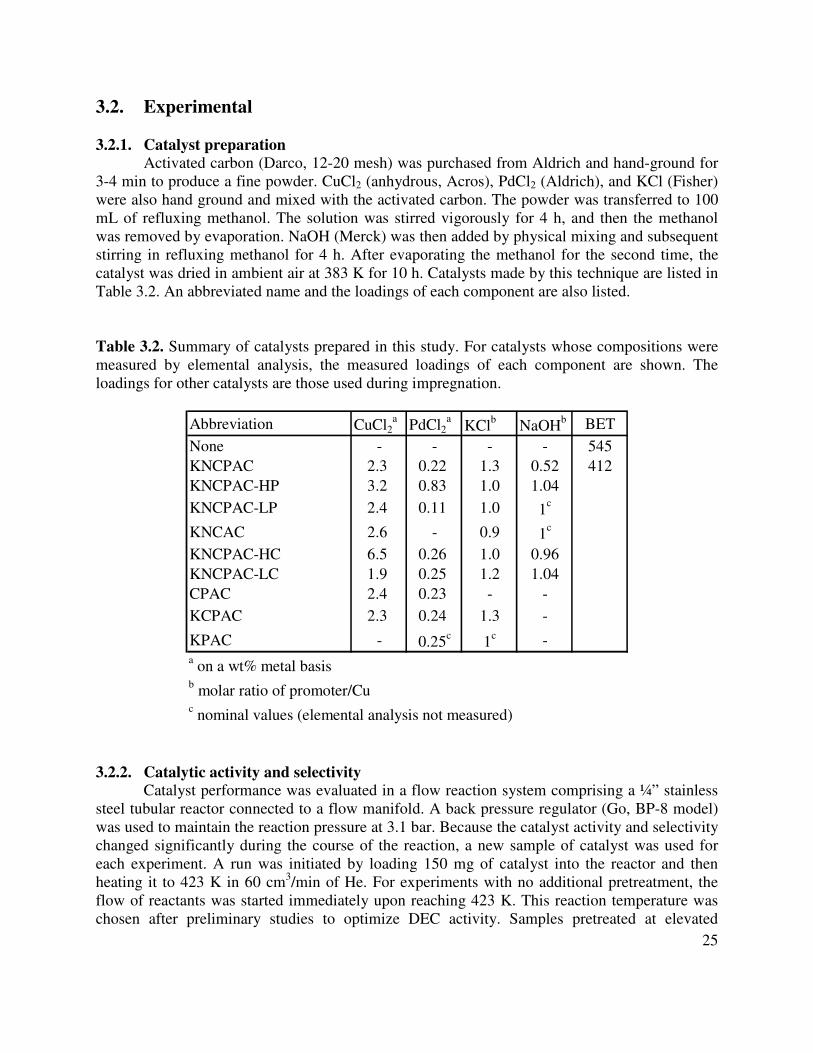
25
3.2. Experimental 3.2.1. Catalyst preparation
Activated carbon (Darco, 12-20 mesh) was purchased from Aldrich and hand-ground for 3-4 min to produce a fine powder. CuCl2 (anhydrous, Acros), PdCl2 (Aldrich), and KCl (Fisher) were also hand ground and mixed with the activated carbon. The powder was transferred to 100 mL of refluxing methanol. The solution was stirred vigorously for 4 h, and then the methanol was removed by evaporation. NaOH (Merck) was then added by physical mixing and subsequent stirring in refluxing methanol for 4 h. After evaporating the methanol for the second time, the catalyst was dried in ambient air at 383 K for 10 h. Catalysts made by this technique are listed in Table 3.2. An abbreviated name and the loadings of each component are also listed. Table 3.2. Summary of catalysts prepared in this study. For catalysts whose compositions were measured by elemental analysis, the measured loadings of each component are shown. The loadings for other catalysts are those used during impregnation.
Abbreviation CuCl2a PdCl2
a KClb NaOHb BETNone - - - - 545KNCPAC 2.3 0.22 1.3 0.52 412KNCPAC-HP 3.2 0.83 1.0 1.04KNCPAC-LP 2.4 0.11 1.0 1c
KNCAC 2.6 - 0.9 1c
KNCPAC-HC 6.5 0.26 1.0 0.96KNCPAC-LC 1.9 0.25 1.2 1.04CPAC 2.4 0.23 - -KCPAC 2.3 0.24 1.3 -
KPAC - 0.25c 1c -a on a wt% metal basisb molar ratio of promoter/Cuc nominal values (elemental analysis not measured)
3.2.2. Catalytic activity and selectivity
Catalyst performance was evaluated in a flow reaction system comprising a ¼” stainless steel tubular reactor connected to a flow manifold. A back pressure regulator (Go, BP-8 model) was used to maintain the reaction pressure at 3.1 bar. Because the catalyst activity and selectivity changed significantly during the course of the reaction, a new sample of catalyst was used for each experiment. A run was initiated by loading 150 mg of catalyst into the reactor and then heating it to 423 K in 60 cm3/min of He. For experiments with no additional pretreatment, the flow of reactants was started immediately upon reaching 423 K. This reaction temperature was chosen after preliminary studies to optimize DEC activity. Samples pretreated at elevated
26
temperatures in He were cooled to 423 K before starting reaction gases. The reactant feed composition was chosen to favor activity towards DEC. High CO pressure and low O2 pressure helped suppress undesired oxidation reactions (see equations 2, 4, and 5 below). Except where noted, the reactant gases CO (61%), O2 (5%), ethanol (13%) and He (24%) were passed over the catalyst at 69 cm3/min (STP). Ethanol was supplied to the gas stream from a bubbler maintained at 329 K. After reaction, catalysts were cooled in He and then stored at ambient conditions. All catalysts were tested for 9 h.
The reaction products were identified and quantified by gas chromatography (Agilent 6890GC) at 19-minute intervals for at least 8 h after the reaction gases were introduced to the catalyst. The gas chromatograph (GC) was equipped with two columns: a packed column (Alltech, Haysep DB packing) connected to a TCD detector for measuring CO, O2, and CO2; and a capillary column (Alltech, AT Aquawax; polyethylene glycol stationary phase) connected to an FID detector for measuring ethanol, DEC, and other organic byproducts. GC peak areas were converted to product concentrations by direct calibration for CO, O2, CO2, and ethanol. Concentrations of DEC, acetaldehyde, and 1,1-diethoxyethane (acetal) were calculated using relative response factors and the ethanol calibration. Because the identity of the active species in these catalysts was unclear, activities were normalized to the weight of catalyst used, reported in units of (mmol product/gm catalyst/hr). Only a portion of the Cu may be active in catalyzing the synthesis of DEC, acetaldehyde, or CO2. Some catalysis may also take place on Pd species.
CO2, acetaldehyde and 1,1-diethoxyethane (acetal) were the only significant byproducts detected. While water was observed in the reaction products, its concentration was not measured. For selectivity calculations, CO2 was considered to be derived from the combustion of CO (equation 1; or via equations 2 and 3 combined), whereas acetaldehyde and acetal were considered byproducts derived from ethanol (equations 4 and 5, respectively). Equation 6 was used to calculate selectivities from ethanol or CO. In this equation ni is the net moles of ethanol or CO required to make the ith product; ri is the rate of formation of the ith product; and the summation is over all products.
222
1 COOCO →+ (2)
( ) 2232223 COOHCH2CHOHCOOCHCH +→+ (3)
OHCHOCHOOHCHCH 23221
23 +→+ (4)
( ) OHCHCHOCHCHOHCH2CHCHOCH 232223233 +→+ (5)
∑
=
j
jj
ii
irn
rnS
(6)
3.2.3. X-ray absorption fine structure (XAFS)
Cu K edge experiments. X-ray absorption spectroscopy was carried out using beamline 2-3 at the Stanford Synchrotron Radiation Laboratory (SSRL). Catalyst powder was pressed into a rectangular pellet (4.3 x 1.86 mm) and mounted in a stainless steel cell designed for measuring x-ray absorption spectra in transmission mode under gas and temperature treatments [20]. Equation 7 was used to calculate the sample weight w. In this equation Acs is the pellet cross sectional area and PCS is the photoabsorption cross section (tabulated for each element at www-cxro.lbl.gov).
27
The sample absorbance, Ae, is the desired absorbance at 50 eV past the absorption edge, and was set at 2.5 to optimize the signal to noise ratio in the XAFS data.
cs
e
APCS
Aw
⋅= (7)
The x-ray energy was selected using a double crystal Si(111) monochromator. The
monochromator was detuned by 30% at 500 eV above the Cu K-edge to eliminate harmonic x-ray energies. Slits were situated before the first detector to constrain the beam size to a 10 mm x 0.5 mm rectangle. Three ionization chambers filled with N2 were used to measure the x-ray intensity (i) incident to the sample; (ii) after passing through the sample and before passing through a Cu foil standard; (iii) after passing through the Cu foil standard. The Cu foil was used as a reference to align experimental data spectra.
Because of constraints associated with the EXAFS experimental setup, the reaction conditions were modified from those used in the lab. CO (66%), O2 (3%), EtOH (5%), and He (balance) were flowed at 67 cm3/min and a total pressure of 1 bar. The temperature was maintained at 423 K. Further details of the x-ray absorption experiment have been reported earlier [21].
To assess the effect of the high-energy x-ray beam on the catalyst, we took several EXAFS scans of the as prepared catalyst over a period of hours before applying any gas or temperature treatments. There were no changes in the x-ray absorption spectrum of the catalyst during this period, confirming that significant changes in the catalyst did not occur due to interactions with the x-ray beam.
Pd K edge experiments. The experimental setup for Pd K edge experiments was identical to those for the Cu K edge, except that the post-edge absorbance Ae could not be constrained to 2.5 in the catalyst samples, due to low Pd loading. For these samples, the post-edge absorbance was set at 0.3. While this value is far outside the optimal range (2.5-4), useful EXAFS data could still be collected and analyzed.
Cl K edge experiments. Cl XANES were measured in fluorescence mode on beamline
9.3.1 at the Advanced Light Source, located at the Lawrence Berkeley National Laboratory. Powder samples were pressed onto carbon tape and mounted in a vacuum chamber (1x10⁻⁸ torr). The XANES signal was extracted by taking the ratio of fluorescent photons to incident photons, as in equation 8.
0I
IA
f= (8)
XAFS data analysis. XANES and EXAFS data were analyzed using the Athena and Artemis applications in the IFEFFIT software package [22], as described previously [23].
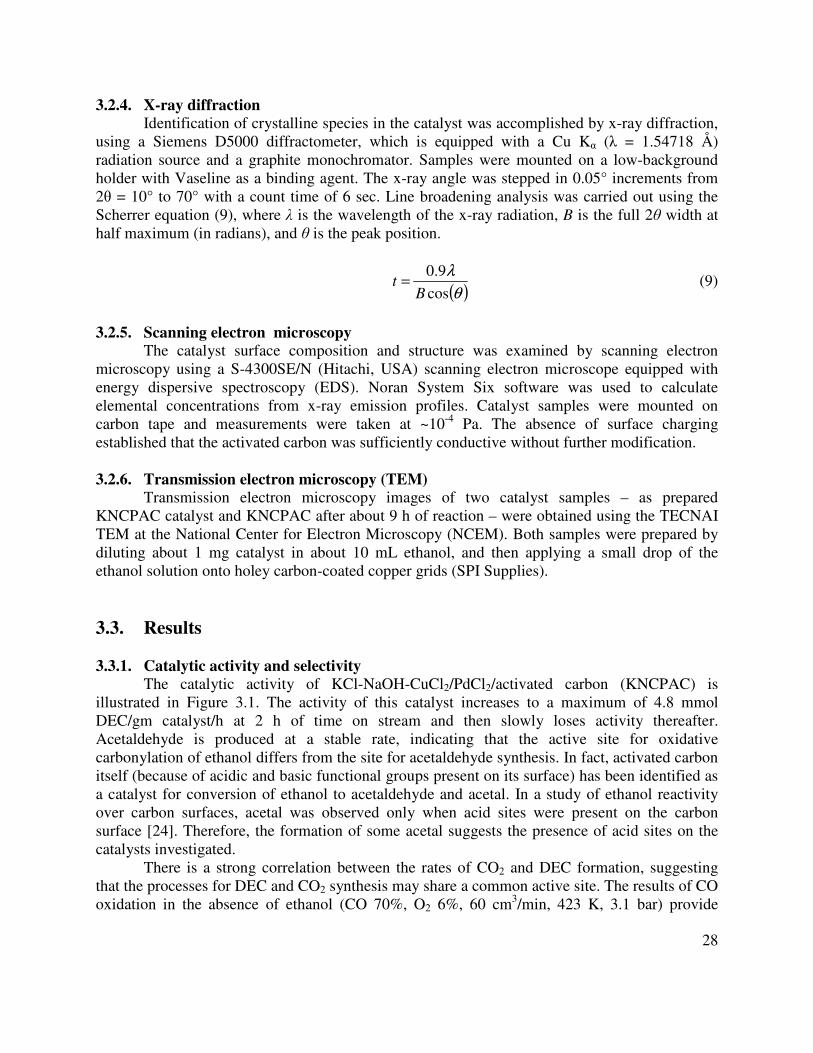
28
3.2.4. X-ray diffraction Identification of crystalline species in the catalyst was accomplished by x-ray diffraction,
using a Siemens D5000 diffractometer, which is equipped with a Cu Kα (λ = 1.54718 Å) radiation source and a graphite monochromator. Samples were mounted on a low-background holder with Vaseline as a binding agent. The x-ray angle was stepped in 0.05° increments from 2θ = 10° to 70° with a count time of 6 sec. Line broadening analysis was carried out using the Scherrer equation (9), where λ is the wavelength of the x-ray radiation, B is the full 2θ width at half maximum (in radians), and θ is the peak position.
( )θ
λ
cos9.0
Bt = (9)
3.2.5. Scanning electron microscopy
The catalyst surface composition and structure was examined by scanning electron microscopy using a S-4300SE/N (Hitachi, USA) scanning electron microscope equipped with energy dispersive spectroscopy (EDS). Noran System Six software was used to calculate elemental concentrations from x-ray emission profiles. Catalyst samples were mounted on carbon tape and measurements were taken at ~10-4 Pa. The absence of surface charging established that the activated carbon was sufficiently conductive without further modification. 3.2.6. Transmission electron microscopy (TEM)
Transmission electron microscopy images of two catalyst samples – as prepared KNCPAC catalyst and KNCPAC after about 9 h of reaction – were obtained using the TECNAI TEM at the National Center for Electron Microscopy (NCEM). Both samples were prepared by diluting about 1 mg catalyst in about 10 mL ethanol, and then applying a small drop of the ethanol solution onto holey carbon-coated copper grids (SPI Supplies).
3.3. Results 3.3.1. Catalytic activity and selectivity
The catalytic activity of KCl-NaOH-CuCl2/PdCl2/activated carbon (KNCPAC) is illustrated in Figure 3.1. The activity of this catalyst increases to a maximum of 4.8 mmol DEC/gm catalyst/h at 2 h of time on stream and then slowly loses activity thereafter. Acetaldehyde is produced at a stable rate, indicating that the active site for oxidative carbonylation of ethanol differs from the site for acetaldehyde synthesis. In fact, activated carbon itself (because of acidic and basic functional groups present on its surface) has been identified as a catalyst for conversion of ethanol to acetaldehyde and acetal. In a study of ethanol reactivity over carbon surfaces, acetal was observed only when acid sites were present on the carbon surface [24]. Therefore, the formation of some acetal suggests the presence of acid sites on the catalysts investigated.
There is a strong correlation between the rates of CO2 and DEC formation, suggesting that the processes for DEC and CO2 synthesis may share a common active site. The results of CO oxidation in the absence of ethanol (CO 70%, O2 6%, 60 cm3/min, 423 K, 3.1 bar) provide
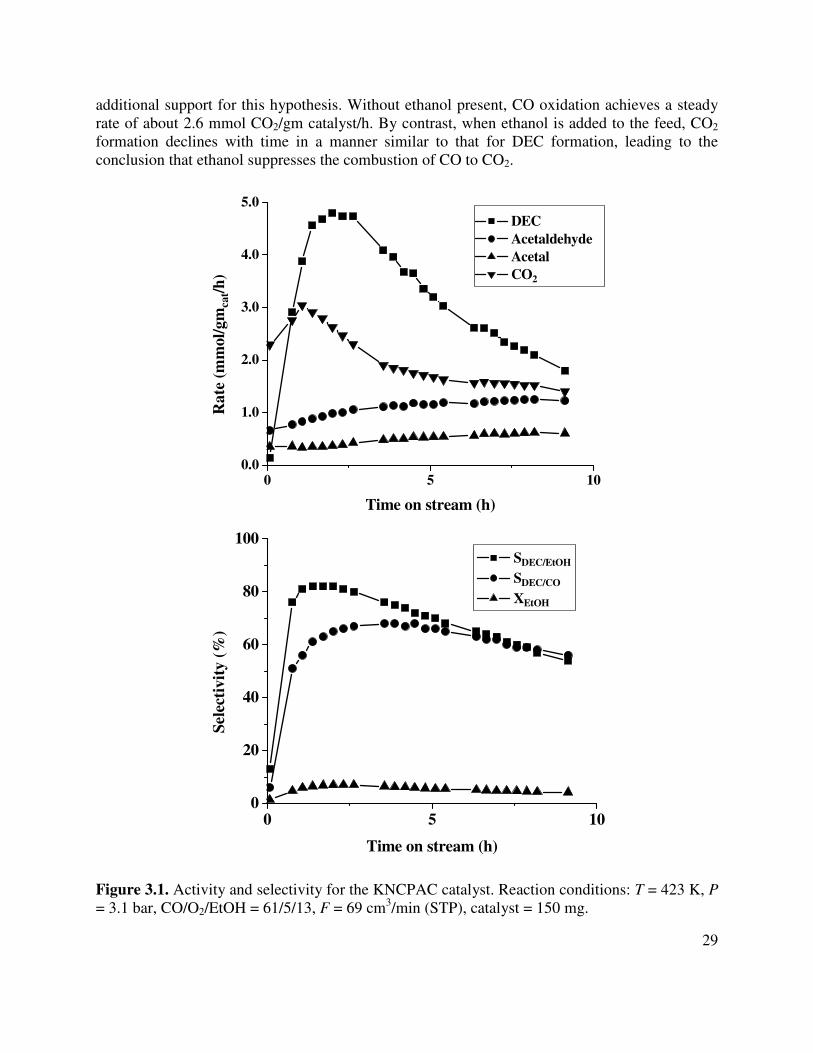
29
additional support for this hypothesis. Without ethanol present, CO oxidation achieves a steady rate of about 2.6 mmol CO2/gm catalyst/h. By contrast, when ethanol is added to the feed, CO2 formation declines with time in a manner similar to that for DEC formation, leading to the conclusion that ethanol suppresses the combustion of CO to CO2.
0 5 100.0
1.0
2.0
3.0
4.0
5.0R
ate
(mm
ol/g
mca
t/h)
Time on stream (h)
DEC Acetaldehyde Acetal CO2
0 5 100
20
40
60
80
100 SDEC/EtOH
SDEC/CO
XEtOH
Sele
ctiv
ity
(%)
Time on stream (h)
Figure 3.1. Activity and selectivity for the KNCPAC catalyst. Reaction conditions: T = 423 K, P = 3.1 bar, CO/O2/EtOH = 61/5/13, F = 69 cm3/min (STP), catalyst = 150 mg.
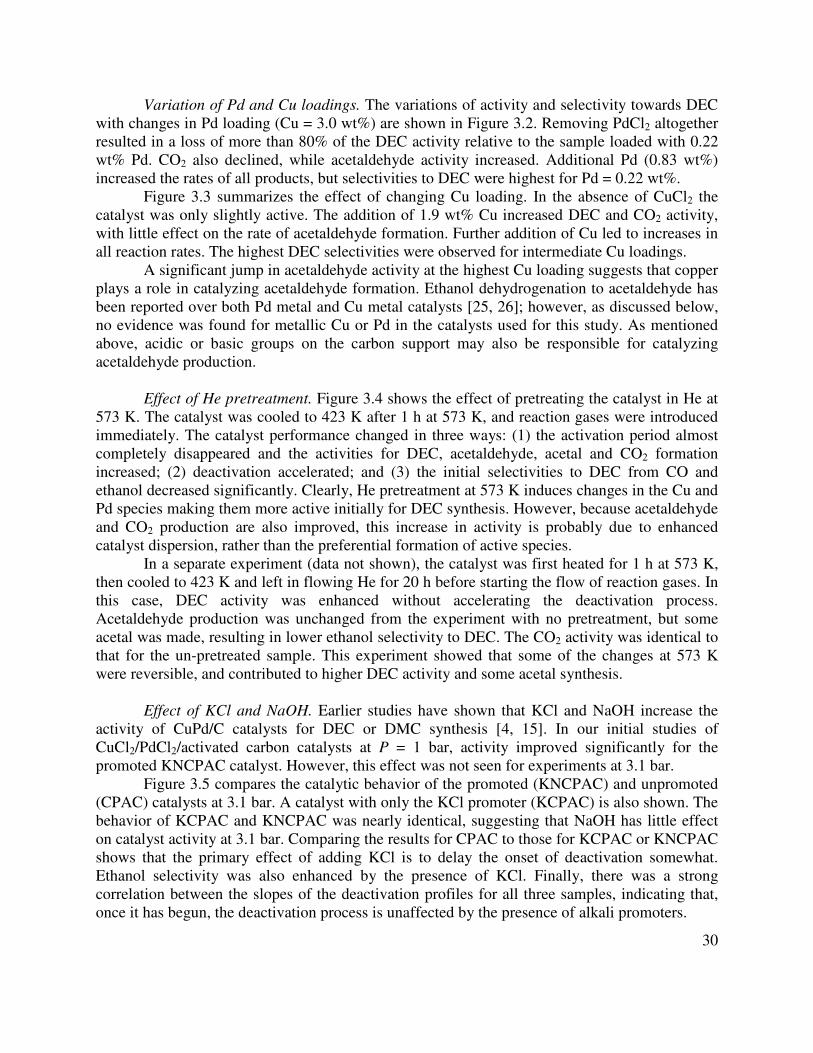
30
Variation of Pd and Cu loadings. The variations of activity and selectivity towards DEC with changes in Pd loading (Cu = 3.0 wt%) are shown in Figure 3.2. Removing PdCl2 altogether resulted in a loss of more than 80% of the DEC activity relative to the sample loaded with 0.22 wt% Pd. CO2 also declined, while acetaldehyde activity increased. Additional Pd (0.83 wt%) increased the rates of all products, but selectivities to DEC were highest for Pd = 0.22 wt%.
Figure 3.3 summarizes the effect of changing Cu loading. In the absence of CuCl2 the catalyst was only slightly active. The addition of 1.9 wt% Cu increased DEC and CO2 activity, with little effect on the rate of acetaldehyde formation. Further addition of Cu led to increases in all reaction rates. The highest DEC selectivities were observed for intermediate Cu loadings.
A significant jump in acetaldehyde activity at the highest Cu loading suggests that copper plays a role in catalyzing acetaldehyde formation. Ethanol dehydrogenation to acetaldehyde has been reported over both Pd metal and Cu metal catalysts [25, 26]; however, as discussed below, no evidence was found for metallic Cu or Pd in the catalysts used for this study. As mentioned above, acidic or basic groups on the carbon support may also be responsible for catalyzing acetaldehyde production.
Effect of He pretreatment. Figure 3.4 shows the effect of pretreating the catalyst in He at 573 K. The catalyst was cooled to 423 K after 1 h at 573 K, and reaction gases were introduced immediately. The catalyst performance changed in three ways: (1) the activation period almost completely disappeared and the activities for DEC, acetaldehyde, acetal and CO2 formation increased; (2) deactivation accelerated; and (3) the initial selectivities to DEC from CO and ethanol decreased significantly. Clearly, He pretreatment at 573 K induces changes in the Cu and Pd species making them more active initially for DEC synthesis. However, because acetaldehyde and CO2 production are also improved, this increase in activity is probably due to enhanced catalyst dispersion, rather than the preferential formation of active species.
In a separate experiment (data not shown), the catalyst was first heated for 1 h at 573 K, then cooled to 423 K and left in flowing He for 20 h before starting the flow of reaction gases. In this case, DEC activity was enhanced without accelerating the deactivation process. Acetaldehyde production was unchanged from the experiment with no pretreatment, but some acetal was made, resulting in lower ethanol selectivity to DEC. The CO2 activity was identical to that for the un-pretreated sample. This experiment showed that some of the changes at 573 K were reversible, and contributed to higher DEC activity and some acetal synthesis.
Effect of KCl and NaOH. Earlier studies have shown that KCl and NaOH increase the activity of CuPd/C catalysts for DEC or DMC synthesis [4, 15]. In our initial studies of CuCl2/PdCl2/activated carbon catalysts at P = 1 bar, activity improved significantly for the promoted KNCPAC catalyst. However, this effect was not seen for experiments at 3.1 bar.
Figure 3.5 compares the catalytic behavior of the promoted (KNCPAC) and unpromoted (CPAC) catalysts at 3.1 bar. A catalyst with only the KCl promoter (KCPAC) is also shown. The behavior of KCPAC and KNCPAC was nearly identical, suggesting that NaOH has little effect on catalyst activity at 3.1 bar. Comparing the results for CPAC to those for KCPAC or KNCPAC shows that the primary effect of adding KCl is to delay the onset of deactivation somewhat. Ethanol selectivity was also enhanced by the presence of KCl. Finally, there was a strong correlation between the slopes of the deactivation profiles for all three samples, indicating that, once it has begun, the deactivation process is unaffected by the presence of alkali promoters.
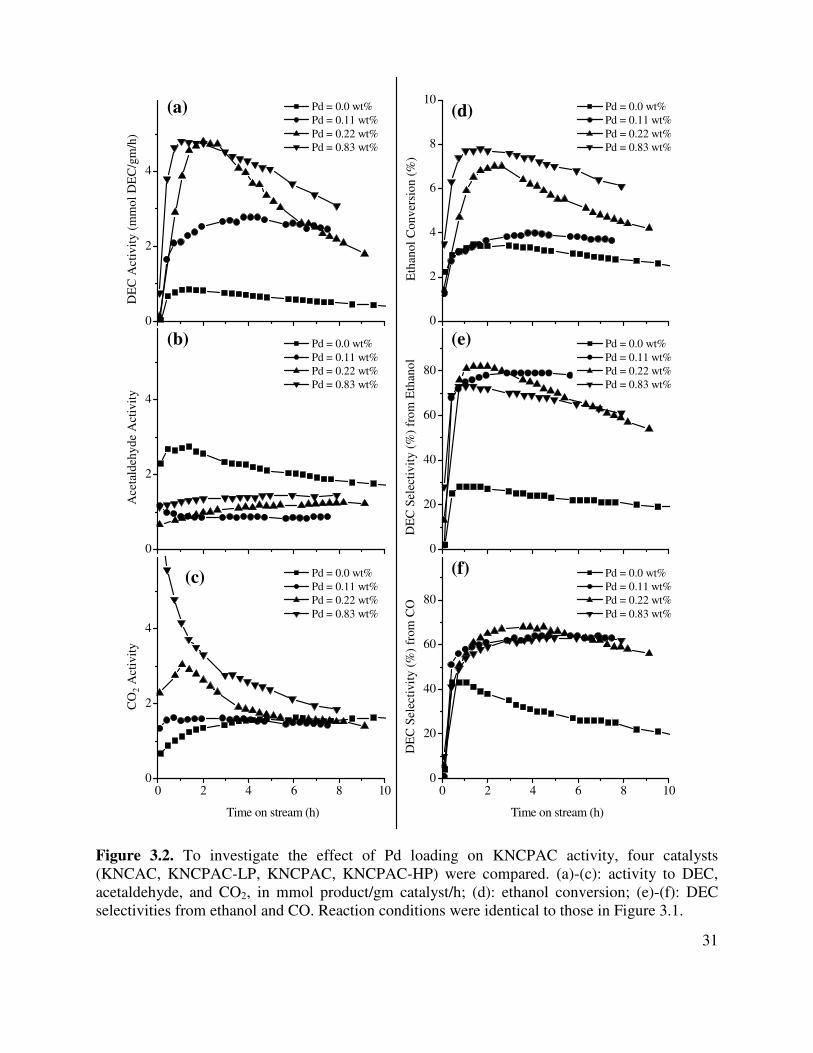
31
Figure 3.2. To investigate the effect of Pd loading on KNCPAC activity, four catalysts (KNCAC, KNCPAC-LP, KNCPAC, KNCPAC-HP) were compared. (a)-(c): activity to DEC, acetaldehyde, and CO2, in mmol product/gm catalyst/h; (d): ethanol conversion; (e)-(f): DEC selectivities from ethanol and CO. Reaction conditions were identical to those in Figure 3.1.
0
2
4
Pd = 0.0 wt% Pd = 0.11 wt% Pd = 0.22 wt% Pd = 0.83 wt%
DE
C A
ctiv
ity (
mm
ol D
EC
/gm
/h)
(a)
0
2
4
(b) Pd = 0.0 wt% Pd = 0.11 wt% Pd = 0.22 wt% Pd = 0.83 wt%
Ace
tald
ehyd
e A
ctiv
ity
0
20
40
60
80
(e) Pd = 0.0 wt% Pd = 0.11 wt% Pd = 0.22 wt% Pd = 0.83 wt%
DE
C S
elec
tivity
(%
) fr
om E
than
ol
0 2 4 6 8 100
2
4
(c)
Time on stream (h)
Pd = 0.0 wt% Pd = 0.11 wt% Pd = 0.22 wt% Pd = 0.83 wt%
CO
2 A
ctiv
ity
0 2 4 6 8 100
20
40
60
80
Pd = 0.0 wt% Pd = 0.11 wt% Pd = 0.22 wt% Pd = 0.83 wt%
Time on stream (h)
(f)
DE
C S
elec
tivity
(%
) fr
om C
O
0
2
4
6
8
10
(d) Pd = 0.0 wt% Pd = 0.11 wt% Pd = 0.22 wt% Pd = 0.83 wt%
Eth
anol
Con
vers
ion
(%)
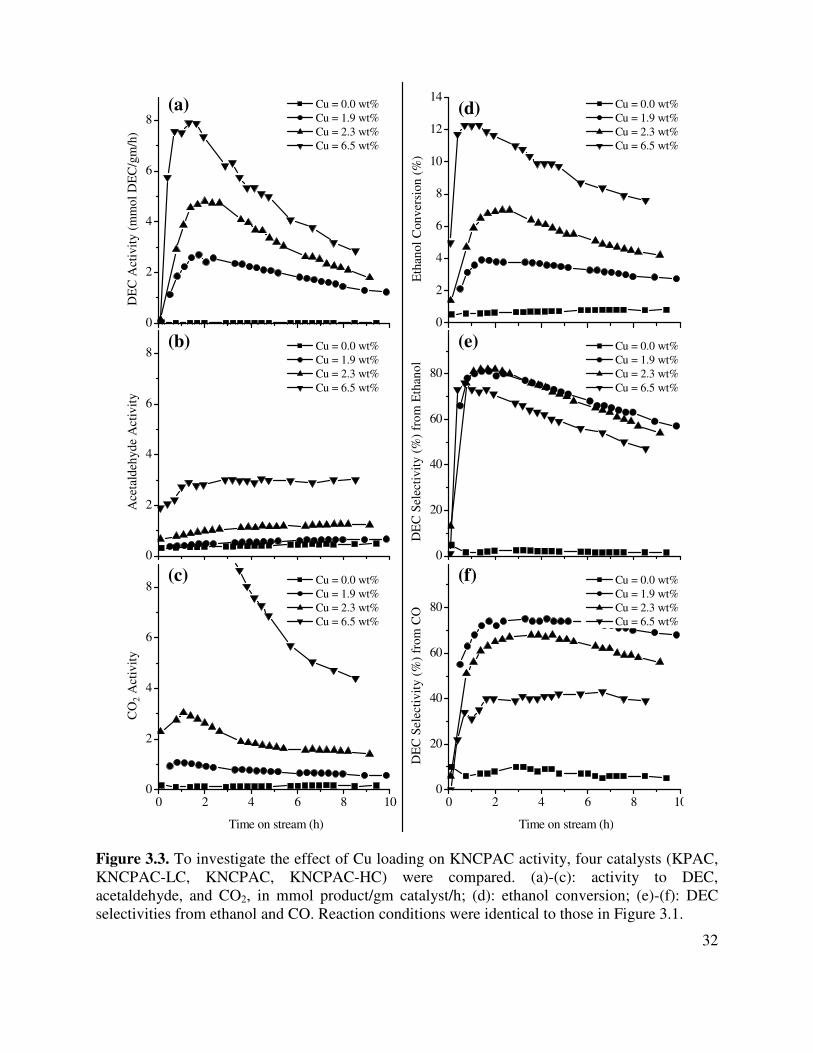
32
Figure 3.3. To investigate the effect of Cu loading on KNCPAC activity, four catalysts (KPAC, KNCPAC-LC, KNCPAC, KNCPAC-HC) were compared. (a)-(c): activity to DEC, acetaldehyde, and CO2, in mmol product/gm catalyst/h; (d): ethanol conversion; (e)-(f): DEC selectivities from ethanol and CO. Reaction conditions were identical to those in Figure 3.1.
0
2
4
6
8
Cu = 0.0 wt% Cu = 1.9 wt% Cu = 2.3 wt% Cu = 6.5 wt%
DE
C A
ctiv
ity (
mm
ol D
EC
/gm
/h)
(a)
0
2
4
6
8
(b) Cu = 0.0 wt% Cu = 1.9 wt% Cu = 2.3 wt% Cu = 6.5 wt%
Ace
tald
ehyd
e A
ctiv
ity
0
20
40
60
80
(e) Cu = 0.0 wt% Cu = 1.9 wt% Cu = 2.3 wt% Cu = 6.5 wt%
DE
C S
elec
tivity
(%
) fr
om E
than
ol
0 2 4 6 8 100
2
4
6
8(c)
Time on stream (h)
Cu = 0.0 wt% Cu = 1.9 wt% Cu = 2.3 wt% Cu = 6.5 wt%
CO
2 A
ctiv
ity
0 2 4 6 8 100
20
40
60
80
Cu = 0.0 wt% Cu = 1.9 wt% Cu = 2.3 wt% Cu = 6.5 wt%
Time on stream (h)
(f)
DE
C S
elec
tivity
(%
) fr
om C
O
0
2
4
6
8
10
12
14
(d) Cu = 0.0 wt% Cu = 1.9 wt% Cu = 2.3 wt% Cu = 6.5 wt%
Eth
anol
Con
vers
ion
(%)
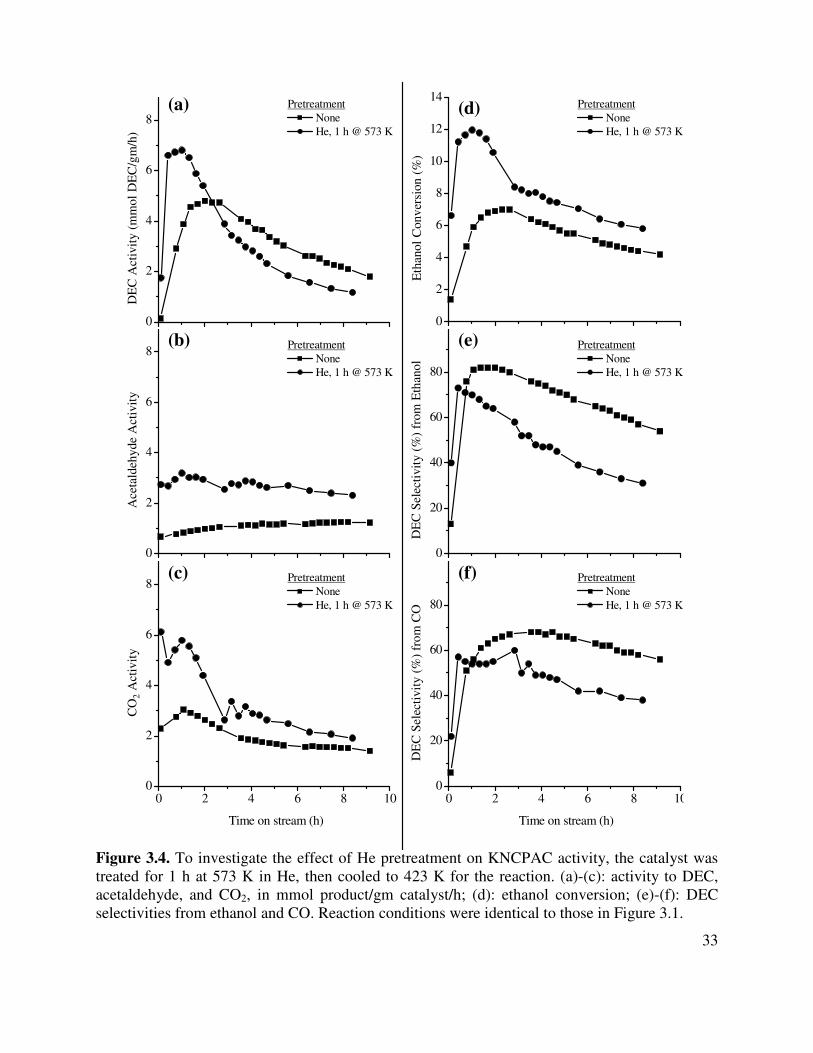
33
Figure 3.4. To investigate the effect of He pretreatment on KNCPAC activity, the catalyst was treated for 1 h at 573 K in He, then cooled to 423 K for the reaction. (a)-(c): activity to DEC, acetaldehyde, and CO2, in mmol product/gm catalyst/h; (d): ethanol conversion; (e)-(f): DEC selectivities from ethanol and CO. Reaction conditions were identical to those in Figure 3.1.
0
2
4
6
8
Pretreatment None He, 1 h @ 573 K
DE
C A
ctiv
ity (
mm
ol D
EC
/gm
/h)
(a)
0
2
4
6
8
(b) Pretreatment None He, 1 h @ 573 K
Ace
tald
ehyd
e A
ctiv
ity
0
20
40
60
80
(e) Pretreatment None He, 1 h @ 573 K
DE
C S
elec
tivity
(%
) fr
om E
than
ol
0 2 4 6 8 100
2
4
6
8(c)
Time on stream (h)
Pretreatment None He, 1 h @ 573 K
CO
2 A
ctiv
ity
0 2 4 6 8 100
20
40
60
80
Pretreatment None He, 1 h @ 573 K
Time on stream (h)
(f)
DE
C S
elec
tivity
(%
) fr
om C
O
0
2
4
6
8
10
12
14
(d) Pretreatment None He, 1 h @ 573 K
Eth
anol
Con
vers
ion
(%)
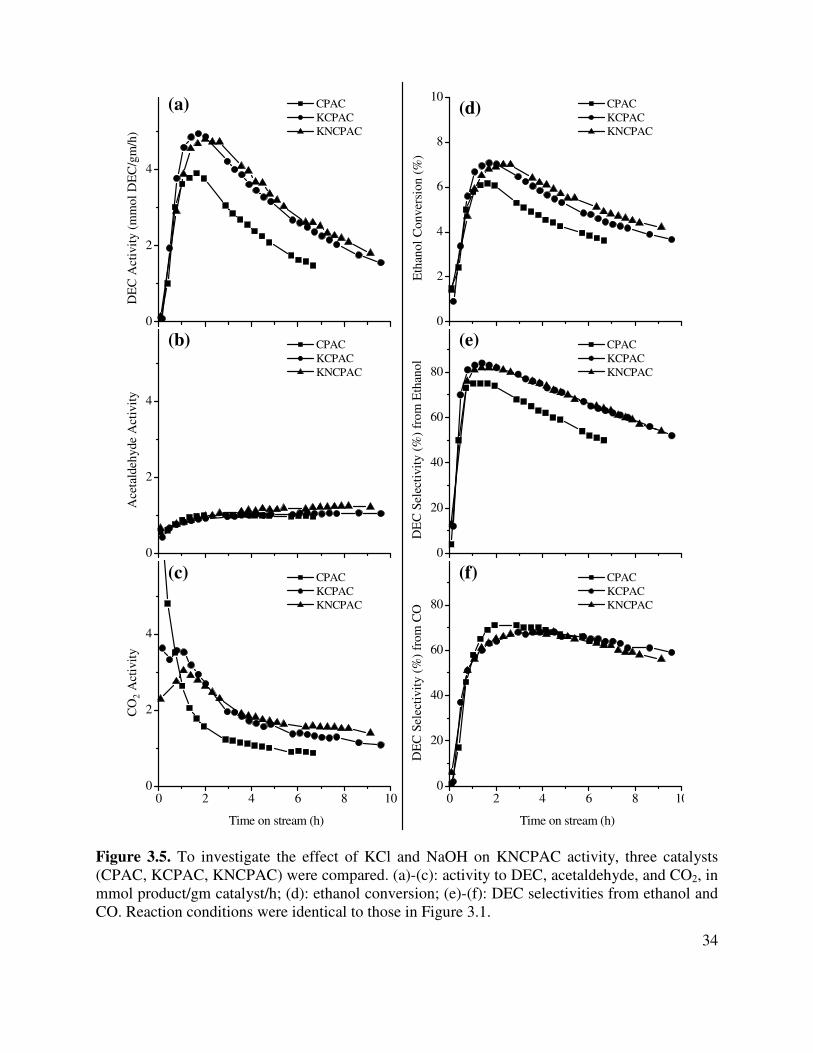
34
Figure 3.5. To investigate the effect of KCl and NaOH on KNCPAC activity, three catalysts (CPAC, KCPAC, KNCPAC) were compared. (a)-(c): activity to DEC, acetaldehyde, and CO2, in mmol product/gm catalyst/h; (d): ethanol conversion; (e)-(f): DEC selectivities from ethanol and CO. Reaction conditions were identical to those in Figure 3.1.
0
2
4
CPAC KCPAC KNCPAC
DE
C A
ctiv
ity (
mm
ol D
EC
/gm
/h)
(a)
0
2
4
(b) CPAC KCPAC KNCPAC
Ace
tald
ehyd
e A
ctiv
ity
0
20
40
60
80
(e) CPAC KCPAC KNCPAC
DE
C S
elec
tivity
(%
) fr
om E
than
ol
0 2 4 6 8 100
2
4
(c)
Time on stream (h)
CPAC KCPAC KNCPAC
CO
2 A
ctiv
ity
0 2 4 6 8 100
20
40
60
80
CPAC KCPAC KNCPAC
Time on stream (h)
(f)
DE
C S
elec
tivity
(%
) fr
om C
O
0
2
4
6
8
10
(d) CPAC KCPAC KNCPAC
Eth
anol
Con
vers
ion
(%)

35
3.3.2. X-ray diffraction
The XRD data for KNCPAC are summarized in Figure 3.6. The as-prepared sample exhibits features for activated carbon (very broad background peaks at 23° and 43°), KCl, and NaCl, as well as silica impurities in the activated carbon support. The absence of any features for Cu reflects the high dispersion of this component, whereas the absence of features for Pd may be due to the low loading of this element. It is evident that some of the NaOH from the preparation is converted to NaCl, possibly via equations 10 or 11.
( ) kJ/mol291∆H,OHClCu3NaCl2CuClNaOH 0
322 −=+→+ (10)
( ) kJ/mol164.5∆H,OHCu2NaClCuCl2NaOH 022 −=+→+ (11)
Three changes occur after the catalyst has been exposed to reaction conditions: (i) after 2
h, the NaCl peak height increases considerably, and then decreases after 10 h; (ii) some reduction in the KCl peak height takes place; (iii) a peak at 2θ = 16.3° (probably paratacamite; see below) appears after 2 h and grows significantly after 10 h. The slight increase in NaCl is likely due to reaction of the remaining NaOH in the sample with CuClx species via equation 10, which could also account for growth of the peak at 16.3°. The loss of intensity for the KCl peak may be due to increased dispersion on the support or to the interaction of KCl with CuCl to form a molten salt mixture (Tm = 423 K). Equation 12 describes one of the reactions purported to take place in KCl-CuCl systems [27]. (As discussed below, CuCl2 is converted to a Cu(I) chloride species under reaction conditions.)
32CuClKCuCl2KCl →+ (12) Paratacamite or related copper compounds may be responsible for the peak at 16.3°. In
KNCPAC samples with a Cu loading of 6.0 wt% (data not shown), the appearance of a second peak at 32.4° helps to identify this species as paratacamite (Cu2Cl(OH)3). Other authors have identified Cu2Cl(OH)3 as the active species in CuCl2/PdCl2 catalyst systems (see above, Introduction). The data in Figure 3.6 indicate that paratacamite begins to form XRD-visible crystals at the time that the catalyst reaches its peak activity for DEC formation. And as the DEC activity declines, paratacamite-like species increase in concentration. This observation suggests that paratacamite may not be the active species for DEC formation, but an inactive phase formed during deactivation of the catalyst. On the other hand, if paratacamite is, indeed, the active Cu phase, the increase in paratacamite peak intensity during deactivation could also be attributed to sintering of paratacamite particles and a resulting loss in surface area for reaction.
Line broadening analysis was carried out for KCl and NaCl. For the as-prepared catalyst, average particle sizes of 56 and 37 nm were calculated for KCl and NaCl, respectively. After He pretreatment, the average size of KCl and NaCl particles decreased by about 25%; no further decrease in particle size was observed after reaction.
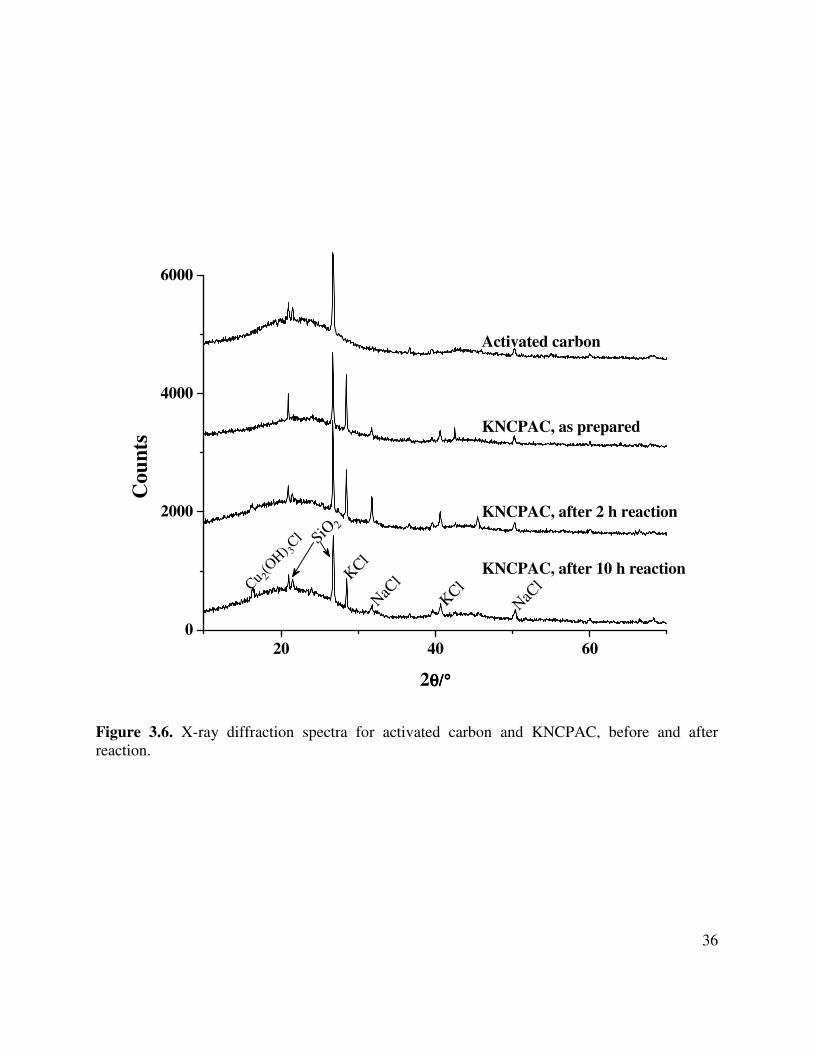
36
20 40 600
2000
4000
6000
Cu 2(OH) 3
Cl
NaCl
KNCPAC, after 2 h reaction
KNCPAC, after 10 h reaction
Activated carbon
KNCPAC, as prepared
Cou
nts
2θ/°θ/°θ/°θ/°
SiO 2
KCl
NaCl
KCl
Figure 3.6. X-ray diffraction spectra for activated carbon and KNCPAC, before and after reaction.
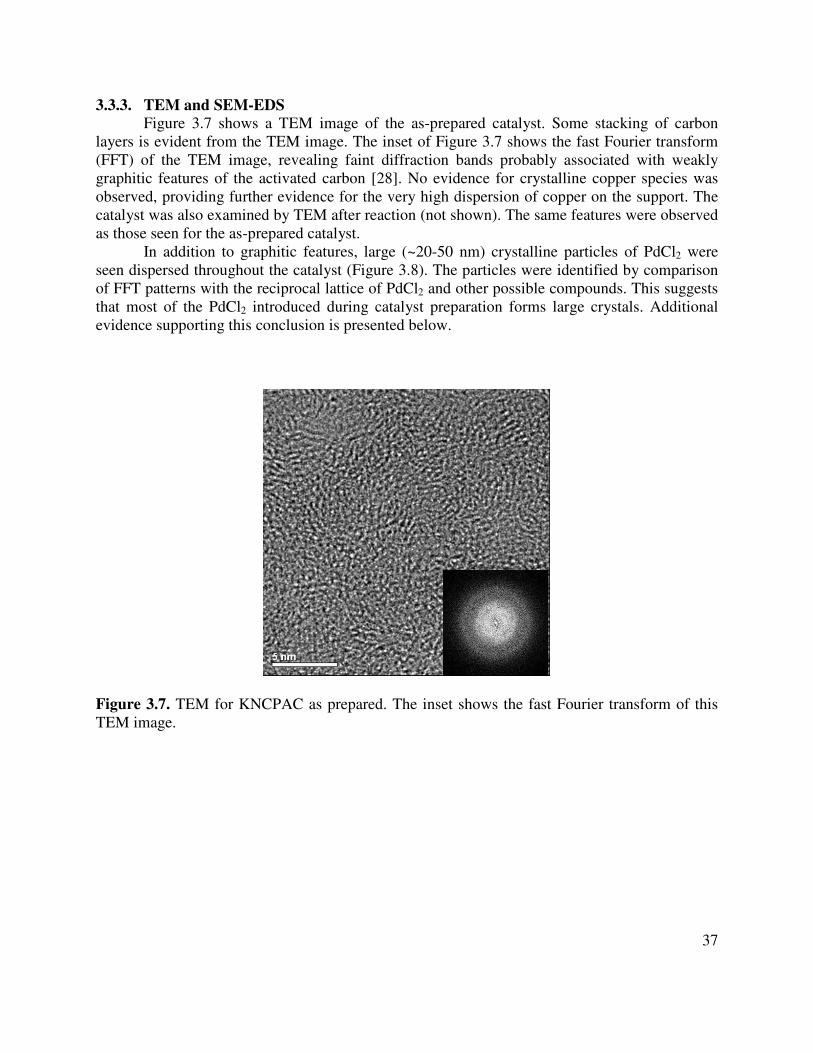
37
3.3.3. TEM and SEM-EDS Figure 3.7 shows a TEM image of the as-prepared catalyst. Some stacking of carbon
layers is evident from the TEM image. The inset of Figure 3.7 shows the fast Fourier transform (FFT) of the TEM image, revealing faint diffraction bands probably associated with weakly graphitic features of the activated carbon [28]. No evidence for crystalline copper species was observed, providing further evidence for the very high dispersion of copper on the support. The catalyst was also examined by TEM after reaction (not shown). The same features were observed as those seen for the as-prepared catalyst.
In addition to graphitic features, large (~20-50 nm) crystalline particles of PdCl2 were seen dispersed throughout the catalyst (Figure 3.8). The particles were identified by comparison of FFT patterns with the reciprocal lattice of PdCl2 and other possible compounds. This suggests that most of the PdCl2 introduced during catalyst preparation forms large crystals. Additional evidence supporting this conclusion is presented below.
Figure 3.7. TEM for KNCPAC as prepared. The inset shows the fast Fourier transform of this TEM image.
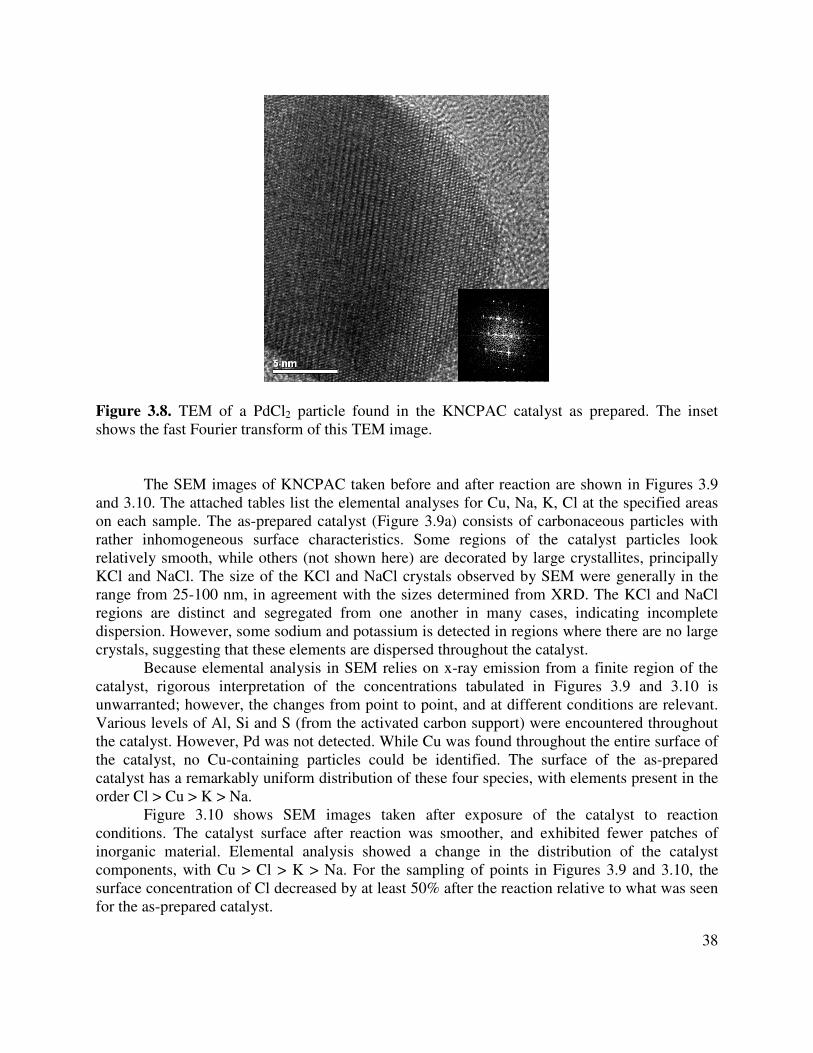
38
Figure 3.8. TEM of a PdCl2 particle found in the KNCPAC catalyst as prepared. The inset shows the fast Fourier transform of this TEM image.
The SEM images of KNCPAC taken before and after reaction are shown in Figures 3.9 and 3.10. The attached tables list the elemental analyses for Cu, Na, K, Cl at the specified areas on each sample. The as-prepared catalyst (Figure 3.9a) consists of carbonaceous particles with rather inhomogeneous surface characteristics. Some regions of the catalyst particles look relatively smooth, while others (not shown here) are decorated by large crystallites, principally KCl and NaCl. The size of the KCl and NaCl crystals observed by SEM were generally in the range from 25-100 nm, in agreement with the sizes determined from XRD. The KCl and NaCl regions are distinct and segregated from one another in many cases, indicating incomplete dispersion. However, some sodium and potassium is detected in regions where there are no large crystals, suggesting that these elements are dispersed throughout the catalyst.
Because elemental analysis in SEM relies on x-ray emission from a finite region of the catalyst, rigorous interpretation of the concentrations tabulated in Figures 3.9 and 3.10 is unwarranted; however, the changes from point to point, and at different conditions are relevant. Various levels of Al, Si and S (from the activated carbon support) were encountered throughout the catalyst. However, Pd was not detected. While Cu was found throughout the entire surface of the catalyst, no Cu-containing particles could be identified. The surface of the as-prepared catalyst has a remarkably uniform distribution of these four species, with elements present in the order Cl > Cu > K > Na.
Figure 3.10 shows SEM images taken after exposure of the catalyst to reaction conditions. The catalyst surface after reaction was smoother, and exhibited fewer patches of inorganic material. Elemental analysis showed a change in the distribution of the catalyst components, with Cu > Cl > K > Na. For the sampling of points in Figures 3.9 and 3.10, the surface concentration of Cl decreased by at least 50% after the reaction relative to what was seen for the as-prepared catalyst.
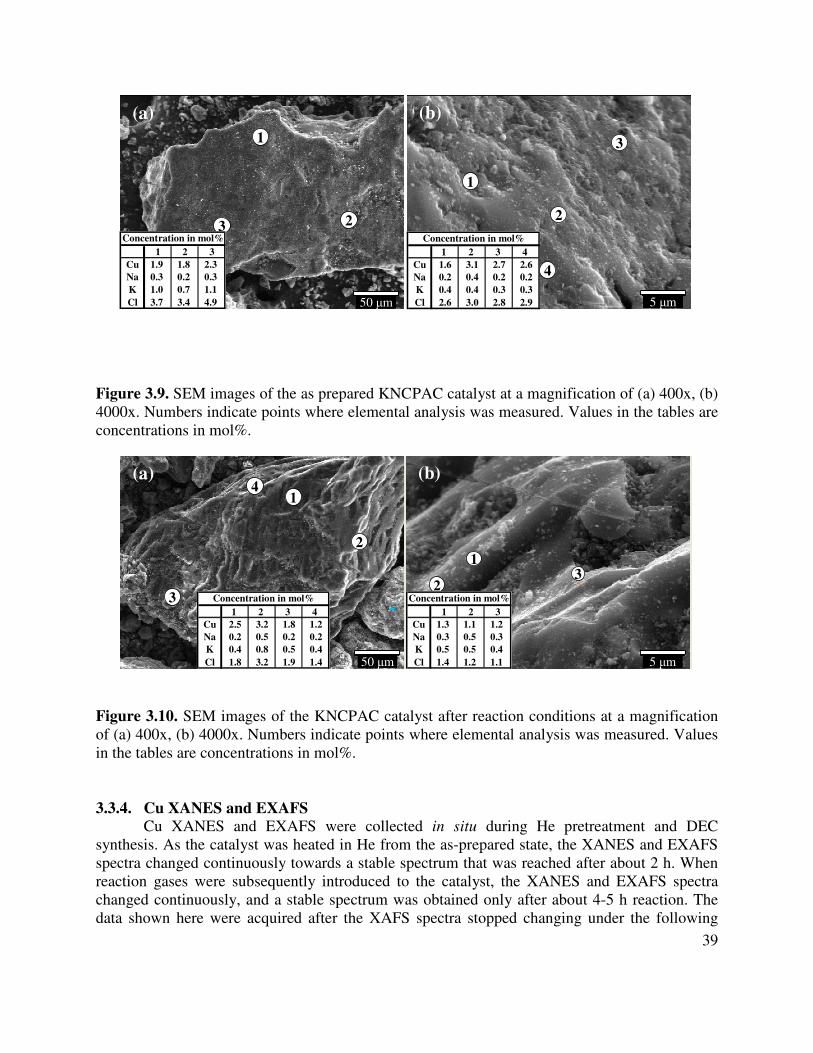
39
Figure 3.9. SEM images of the as prepared KNCPAC catalyst at a magnification of (a) 400x, (b) 4000x. Numbers indicate points where elemental analysis was measured. Values in the tables are concentrations in mol%.
Figure 3.10. SEM images of the KNCPAC catalyst after reaction conditions at a magnification of (a) 400x, (b) 4000x. Numbers indicate points where elemental analysis was measured. Values in the tables are concentrations in mol%. 3.3.4. Cu XANES and EXAFS
Cu XANES and EXAFS were collected in situ during He pretreatment and DEC synthesis. As the catalyst was heated in He from the as-prepared state, the XANES and EXAFS spectra changed continuously towards a stable spectrum that was reached after about 2 h. When reaction gases were subsequently introduced to the catalyst, the XANES and EXAFS spectra changed continuously, and a stable spectrum was obtained only after about 4-5 h reaction. The data shown here were acquired after the XAFS spectra stopped changing under the following
1
23
50 µm
1
2
3
4
5 µm
1 2 3Cu 1.9 1.8 2.3Na 0.3 0.2 0.3K 1.0 0.7 1.1Cl 3.7 3.4 4.9
Concentration in mol%1 2 3 4
Cu 1.6 3.1 2.7 2.6Na 0.2 0.4 0.2 0.2K 0.4 0.4 0.3 0.3Cl 2.6 3.0 2.8 2.9
Concentration in mol%
(a) (b)1
23
50 µm
1
23
50 µm50 µm
1
2
3
4
5 µm
1
2
3
4
5 µm5 µm
1 2 3Cu 1.9 1.8 2.3Na 0.3 0.2 0.3K 1.0 0.7 1.1Cl 3.7 3.4 4.9
Concentration in mol%1 2 3 4
Cu 1.6 3.1 2.7 2.6Na 0.2 0.4 0.2 0.2K 0.4 0.4 0.3 0.3Cl 2.6 3.0 2.8 2.9
Concentration in mol%
(a) (b)
1
2
3
4
50 µm
32
1
5 µm
1 2 3 4Cu 2.5 3.2 1.8 1.2Na 0.2 0.5 0.2 0.2K 0.4 0.8 0.5 0.4Cl 1.8 3.2 1.9 1.4
Concentration in mol%1 2 3
Cu 1.3 1.1 1.2Na 0.3 0.5 0.3K 0.5 0.5 0.4Cl 1.4 1.2 1.1
Concentration in mol%
(a) (b)1
2
3
4
50 µm
1
2
3
4
50 µm50 µm
32
1
5 µm
32
1
5 µm5 µm
1 2 3 4Cu 2.5 3.2 1.8 1.2Na 0.2 0.5 0.2 0.2K 0.4 0.8 0.5 0.4Cl 1.8 3.2 1.9 1.4
Concentration in mol%1 2 3
Cu 1.3 1.1 1.2Na 0.3 0.5 0.3K 0.5 0.5 0.4Cl 1.4 1.2 1.1
Concentration in mol%
(a) (b)
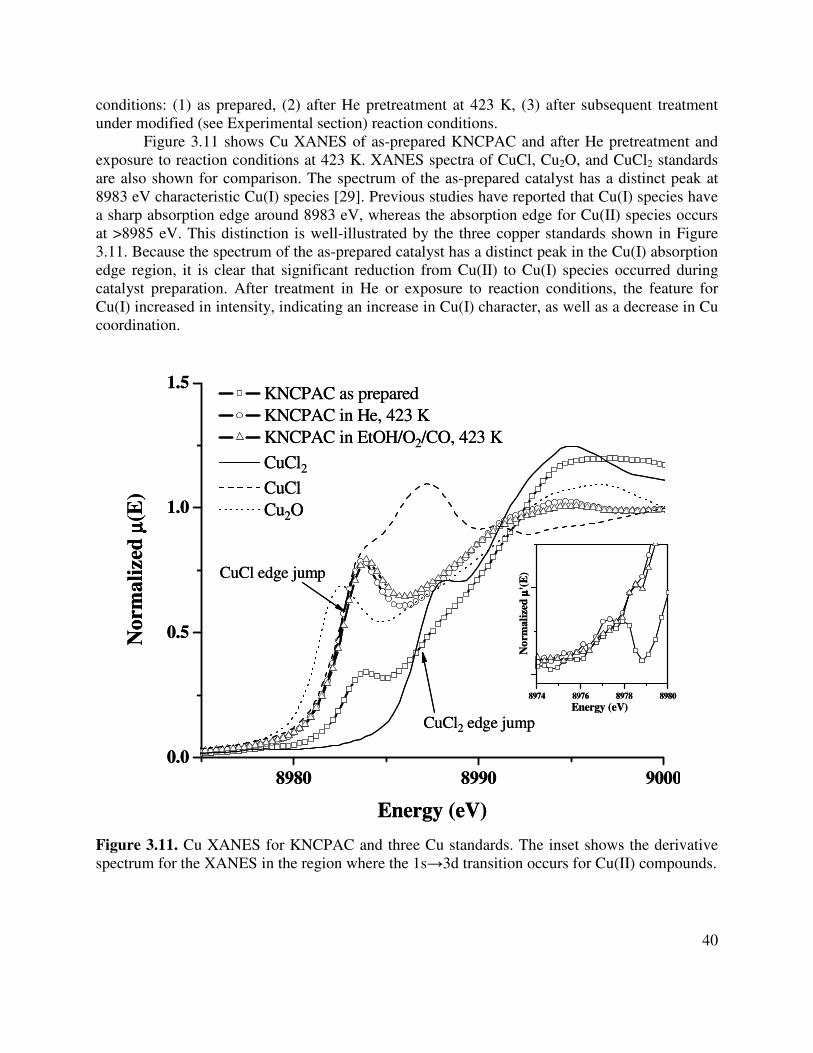
40
conditions: (1) as prepared, (2) after He pretreatment at 423 K, (3) after subsequent treatment under modified (see Experimental section) reaction conditions.
Figure 3.11 shows Cu XANES of as-prepared KNCPAC and after He pretreatment and exposure to reaction conditions at 423 K. XANES spectra of CuCl, Cu2O, and CuCl2 standards are also shown for comparison. The spectrum of the as-prepared catalyst has a distinct peak at 8983 eV characteristic Cu(I) species [29]. Previous studies have reported that Cu(I) species have a sharp absorption edge around 8983 eV, whereas the absorption edge for Cu(II) species occurs at >8985 eV. This distinction is well-illustrated by the three copper standards shown in Figure 3.11. Because the spectrum of the as-prepared catalyst has a distinct peak in the Cu(I) absorption edge region, it is clear that significant reduction from Cu(II) to Cu(I) species occurred during catalyst preparation. After treatment in He or exposure to reaction conditions, the feature for Cu(I) increased in intensity, indicating an increase in Cu(I) character, as well as a decrease in Cu coordination.
Figure 3.11. Cu XANES for KNCPAC and three Cu standards. The inset shows the derivative spectrum for the XANES in the region where the 1s→3d transition occurs for Cu(II) compounds.
8980 8990 90000.0
0.5
1.0
1.5
CuCl edge jump
KNCPAC as prepared KNCPAC in He, 423 K KNCPAC in EtOH/O2/CO, 423 K CuCl2 CuCl Cu2O
Nor
mal
ized
µµ µµ(E
)
Energy (eV)
CuCl2 edge jump
8974 8976 8978 8980
N
orm
aliz
ed µµ µµ
'(E
)
Energy (eV)
8980 8990 90000.0
0.5
1.0
1.5
CuCl edge jump
KNCPAC as prepared KNCPAC in He, 423 K KNCPAC in EtOH/O2/CO, 423 K CuCl2 CuCl Cu2O
Nor
mal
ized
µµ µµ(E
)
Energy (eV)
CuCl2 edge jump
8974 8976 8978 8980
N
orm
aliz
ed µµ µµ
'(E
)
Energy (eV)
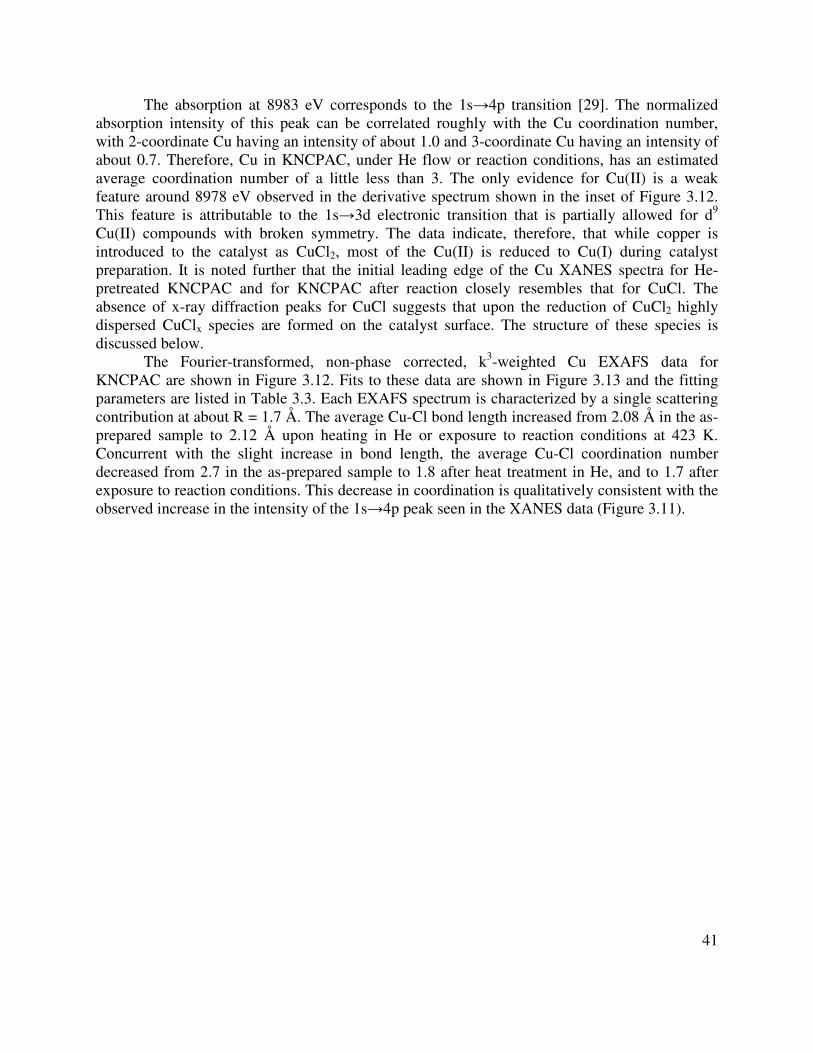
41
The absorption at 8983 eV corresponds to the 1s→4p transition [29]. The normalized absorption intensity of this peak can be correlated roughly with the Cu coordination number, with 2-coordinate Cu having an intensity of about 1.0 and 3-coordinate Cu having an intensity of about 0.7. Therefore, Cu in KNCPAC, under He flow or reaction conditions, has an estimated average coordination number of a little less than 3. The only evidence for Cu(II) is a weak feature around 8978 eV observed in the derivative spectrum shown in the inset of Figure 3.12. This feature is attributable to the 1s→3d electronic transition that is partially allowed for d9 Cu(II) compounds with broken symmetry. The data indicate, therefore, that while copper is introduced to the catalyst as CuCl2, most of the Cu(II) is reduced to Cu(I) during catalyst preparation. It is noted further that the initial leading edge of the Cu XANES spectra for He-pretreated KNCPAC and for KNCPAC after reaction closely resembles that for CuCl. The absence of x-ray diffraction peaks for CuCl suggests that upon the reduction of CuCl2 highly dispersed CuClx species are formed on the catalyst surface. The structure of these species is discussed below.
The Fourier-transformed, non-phase corrected, k3-weighted Cu EXAFS data for KNCPAC are shown in Figure 3.12. Fits to these data are shown in Figure 3.13 and the fitting parameters are listed in Table 3.3. Each EXAFS spectrum is characterized by a single scattering contribution at about R = 1.7 Å. The average Cu-Cl bond length increased from 2.08 Å in the as-prepared sample to 2.12 Å upon heating in He or exposure to reaction conditions at 423 K. Concurrent with the slight increase in bond length, the average Cu-Cl coordination number decreased from 2.7 in the as-prepared sample to 1.8 after heat treatment in He, and to 1.7 after exposure to reaction conditions. This decrease in coordination is qualitatively consistent with the observed increase in the intensity of the 1s→4p peak seen in the XANES data (Figure 3.11).
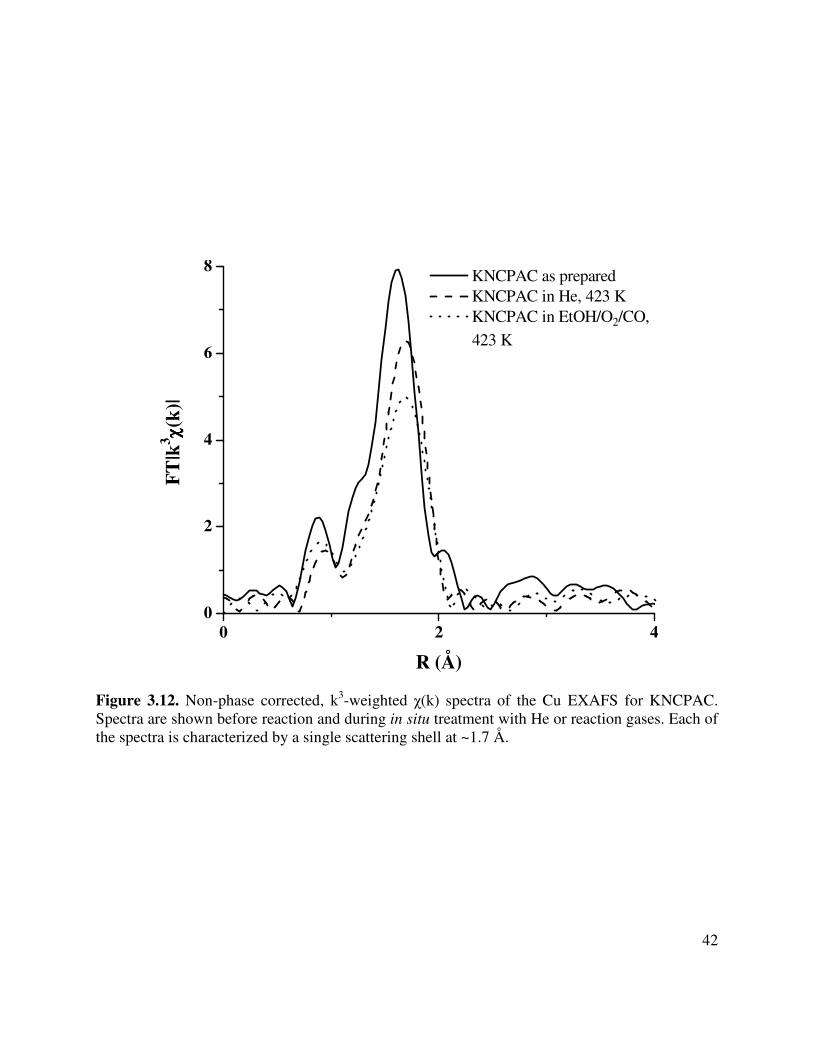
42
0 2 40
2
4
6
8 KNCPAC as prepared KNCPAC in He, 423 K KNCPAC in EtOH/O2/CO,
423 K
FT
|k3 χχ χχ
(k)|
R (Å) Figure 3.12. Non-phase corrected, k3-weighted χ(k) spectra of the Cu EXAFS for KNCPAC. Spectra are shown before reaction and during in situ treatment with He or reaction gases. Each of the spectra is characterized by a single scattering shell at ~1.7 Å.
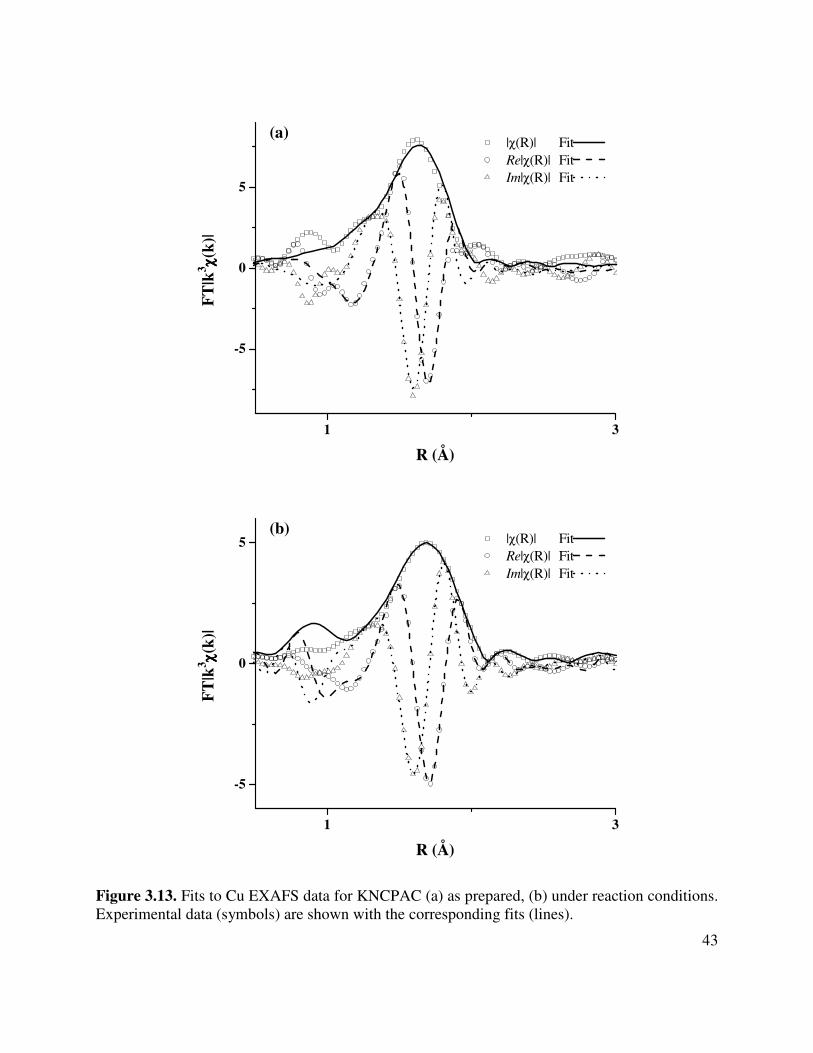
43
1 3
-5
0
5
|χ(R)| Fit Re|χ(R)| Fit Im|χ(R)| Fit
FT
|k3 χχ χχ
(k)|
R (Å)
(a)
1 3
-5
0
5(b)
|χ(R)| Fit Re|χ(R)| Fit Im|χ(R)| Fit
FT
|k3 χχ χχ
(k)|
R (Å)
Figure 3.13. Fits to Cu EXAFS data for KNCPAC (a) as prepared, (b) under reaction conditions. Experimental data (symbols) are shown with the corresponding fits (lines).
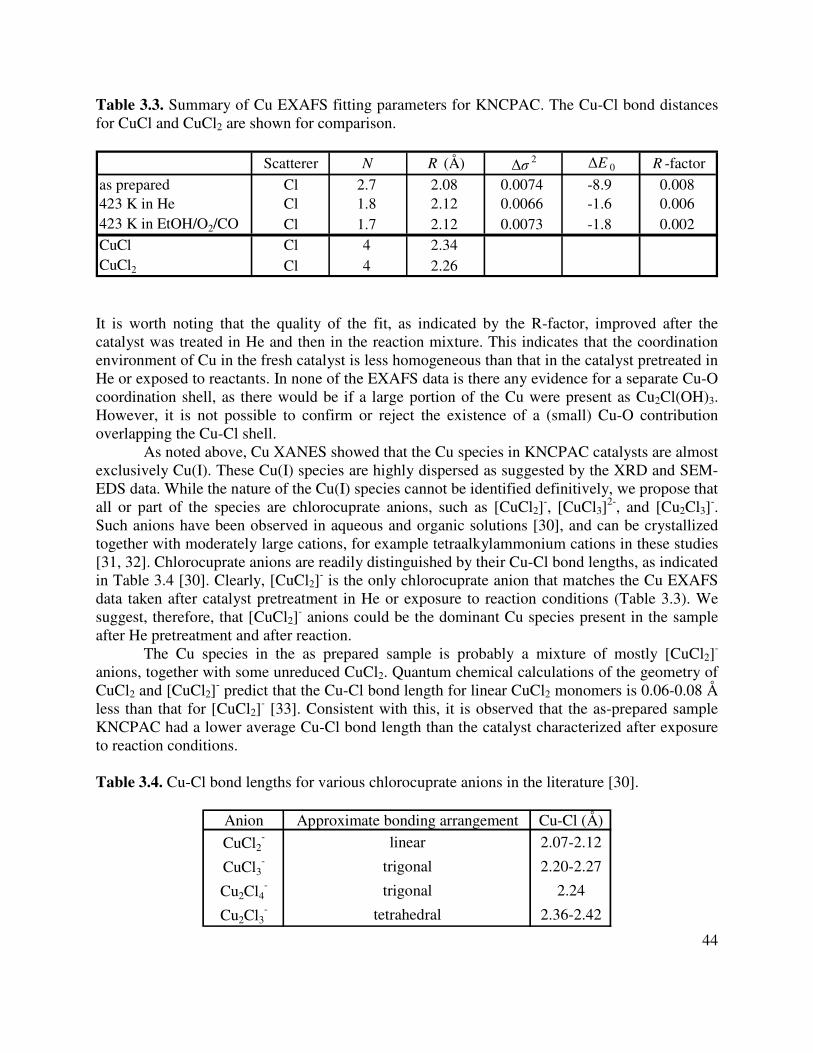
44
Table 3.3. Summary of Cu EXAFS fitting parameters for KNCPAC. The Cu-Cl bond distances for CuCl and CuCl2 are shown for comparison.
Scatterer N R (Å) ∆σ2 ∆E 0 R -factor
as prepared Cl 2.7 2.08 0.0074 -8.9 0.008423 K in He Cl 1.8 2.12 0.0066 -1.6 0.006423 K in EtOH/O2/CO Cl 1.7 2.12 0.0073 -1.8 0.002CuCl Cl 4 2.34CuCl2 Cl 4 2.26 It is worth noting that the quality of the fit, as indicated by the R-factor, improved after the catalyst was treated in He and then in the reaction mixture. This indicates that the coordination environment of Cu in the fresh catalyst is less homogeneous than that in the catalyst pretreated in He or exposed to reactants. In none of the EXAFS data is there any evidence for a separate Cu-O coordination shell, as there would be if a large portion of the Cu were present as Cu2Cl(OH)3. However, it is not possible to confirm or reject the existence of a (small) Cu-O contribution overlapping the Cu-Cl shell.
As noted above, Cu XANES showed that the Cu species in KNCPAC catalysts are almost exclusively Cu(I). These Cu(I) species are highly dispersed as suggested by the XRD and SEM-EDS data. While the nature of the Cu(I) species cannot be identified definitively, we propose that all or part of the species are chlorocuprate anions, such as [CuCl2]
-, [CuCl3]2-, and [Cu2Cl3]
-. Such anions have been observed in aqueous and organic solutions [30], and can be crystallized together with moderately large cations, for example tetraalkylammonium cations in these studies [31, 32]. Chlorocuprate anions are readily distinguished by their Cu-Cl bond lengths, as indicated in Table 3.4 [30]. Clearly, [CuCl2]
- is the only chlorocuprate anion that matches the Cu EXAFS data taken after catalyst pretreatment in He or exposure to reaction conditions (Table 3.3). We suggest, therefore, that [CuCl2]
- anions could be the dominant Cu species present in the sample after He pretreatment and after reaction.
The Cu species in the as prepared sample is probably a mixture of mostly [CuCl2]-
anions, together with some unreduced CuCl2. Quantum chemical calculations of the geometry of CuCl2 and [CuCl2]
- predict that the Cu-Cl bond length for linear CuCl2 monomers is 0.06-0.08 Å less than that for [CuCl2]
- [33]. Consistent with this, it is observed that the as-prepared sample KNCPAC had a lower average Cu-Cl bond length than the catalyst characterized after exposure to reaction conditions.
Table 3.4. Cu-Cl bond lengths for various chlorocuprate anions in the literature [30].
Anion Approximate bonding arrangement Cu-Cl (Å)
CuCl2- linear 2.07-2.12
CuCl3- trigonal 2.20-2.27
Cu2Cl4- trigonal 2.24
Cu2Cl3- tetrahedral 2.36-2.42

45
3.3.5. Pd EXAFS The Fourier-transformed, non-phase corrected, k3-weighted Pd EXAFS data for
KNCPAC are shown in Figure 3.14 for as-prepared KNCPAC and after subsequent pretreatment of this material in He or exposure to reaction gases. The spectra for PdCl2 and Pd are also shown for comparison. Fits to the EXAFS spectra are shown in Figure 3.15, and the corresponding EXAFS fitting parameters are given in Table 3.5. The as-prepared catalyst strongly resembles crystalline PdCl2. Upon He pretreatment or exposure to reaction gases at 423 K, the Pd-Cl coordination number decreased from 3.7 to 3.0 (compared to 4.0 for PdCl2) and the disorder parameter, ∆σ2, increased, indcating an increase in the disorder of the Pd-Cl coordination shell. However, this change is not accompanied by an increase in Pd-Pd coordination (a scattering contribution would be expected at ~2.5 Å) that would signal the reduction of Pd(II) to Pd(0).
0 2 40
5
10
15
KNCPAC as prepared KNCPAC in He, 423 K KNCPAC in EtOH/O2/CO, 423 K PdCl2 Pd × 0.5
FT
|k3 χχ χχ
(k)|
R (Å)
Figure 3.14. Non-phase corrected, k3-weighted χ(k) spectra of the Pd EXAFS for KNCPAC. Spectra are shown before reaction and during in situ treatment with He or reaction gases. PdCl2 and Pd metal standards are also shown for comparison. Each of the experimental spectra for KNCPAC is characterized by a single scattering shell at ~1.9 Å.
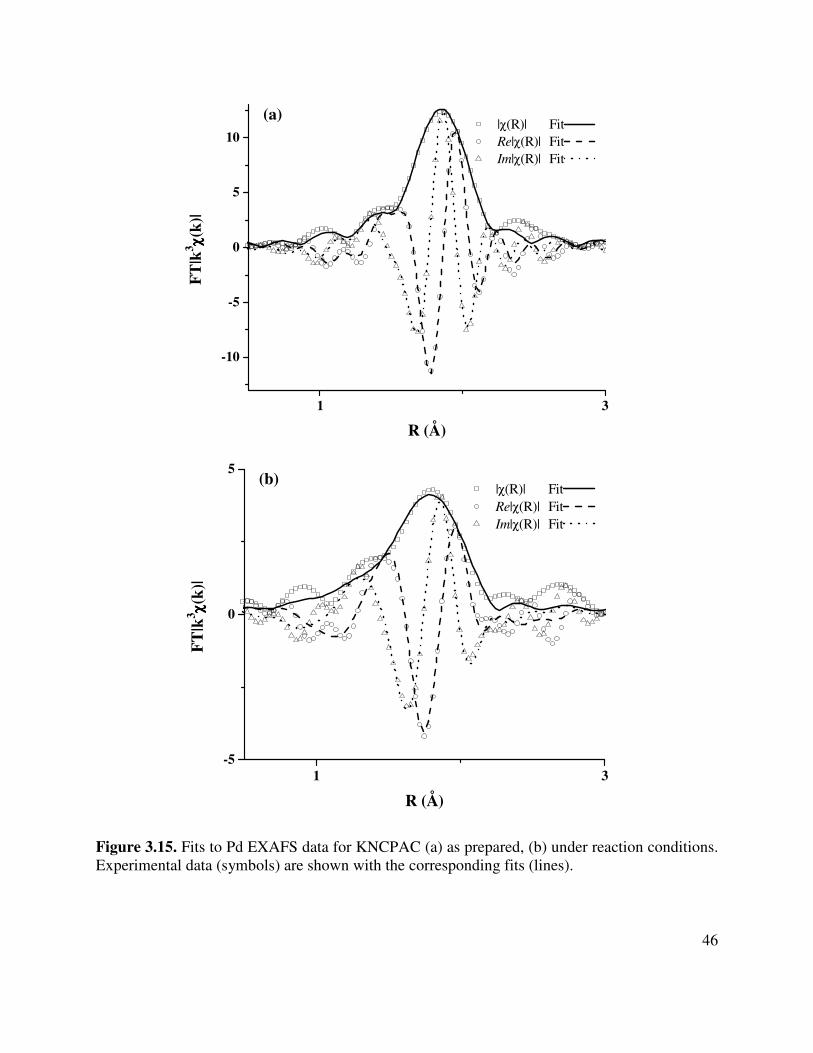
46
Figure 3.15. Fits to Pd EXAFS data for KNCPAC (a) as prepared, (b) under reaction conditions. Experimental data (symbols) are shown with the corresponding fits (lines).
1 3-5
0
5(b)
|χ(R)| Fit Re|χ(R)| Fit Im|χ(R)| Fit
FT
|k3 χχ χχ
(k)|
R (Å)
1 3
-10
-5
0
5
10
(a) |χ(R)| Fit Re|χ(R)| Fit Im|χ(R)| Fit
FT
|k3 χχ χχ
(k)|
R (Å)
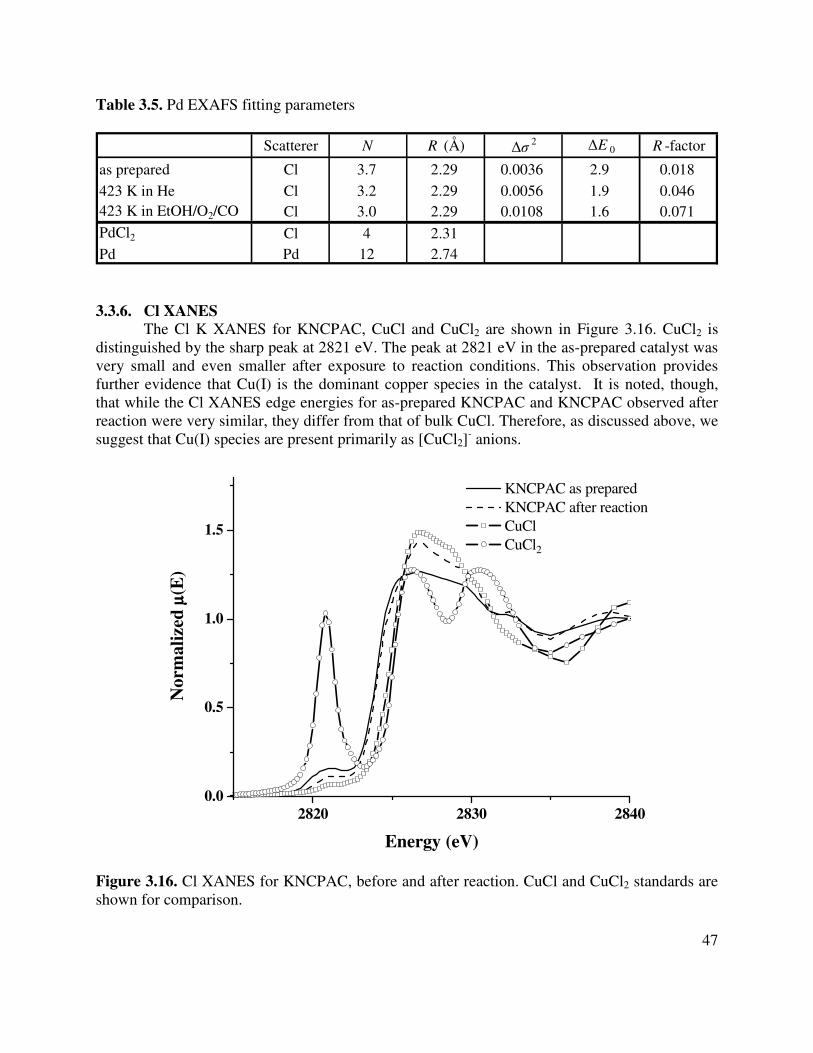
47
Table 3.5. Pd EXAFS fitting parameters
Scatterer N R (Å) ∆σ2 ∆E 0 R -factor
as prepared Cl 3.7 2.29 0.0036 2.9 0.018423 K in He Cl 3.2 2.29 0.0056 1.9 0.046423 K in EtOH/O2/CO Cl 3.0 2.29 0.0108 1.6 0.071PdCl2 Cl 4 2.31Pd Pd 12 2.74 3.3.6. Cl XANES
The Cl K XANES for KNCPAC, CuCl and CuCl2 are shown in Figure 3.16. CuCl2 is distinguished by the sharp peak at 2821 eV. The peak at 2821 eV in the as-prepared catalyst was very small and even smaller after exposure to reaction conditions. This observation provides further evidence that Cu(I) is the dominant copper species in the catalyst. It is noted, though, that while the Cl XANES edge energies for as-prepared KNCPAC and KNCPAC observed after reaction were very similar, they differ from that of bulk CuCl. Therefore, as discussed above, we suggest that Cu(I) species are present primarily as [CuCl2]
- anions.
2820 2830 28400.0
0.5
1.0
1.5
KNCPAC as prepared KNCPAC after reaction CuCl CuCl2
Nor
mal
ized
µµ µµ(E
)
Energy (eV)
Figure 3.16. Cl XANES for KNCPAC, before and after reaction. CuCl and CuCl2 standards are shown for comparison.
48
Normalized XANES spectra are characterized by an “edge step,” calculated from the absolute difference in the mass absorption coefficient before and after the absorption occurring at an x-ray absorption edge. For x-ray fluorescence experiments with thin samples and low absorber concentrations, the magnitude of the edge step is proportional to the concentration of the absorbing element in a sample, and can therefore be used to determine changes in the concentration of the absorbing element [34]. The magnitude of the edge step in the Cl XANES spectrum was used as a qualitative measure of the Cl content before and after reaction. Before reaction, the edge step was 0.27 and after reaction, the edge step decreased to 0.12, confirming that a loss of Cl from the catalyst had occurred during reaction. The decrease of 56% agrees well with the loss of Cl observed by SEM-EDS (see above). 3.4. Discussion
The results presented in this study clearly demonstrate that as-prepared catalysts exhibit little activity initially for the formation of DEC, but slowly activate over several hours under reaction conditions, reach a maximum activity, and then lose activity. The major organic byproduct of DEC is acetaldehyde, and the rate of formation of this product rises slowly with time on stream but does not reach a maximum during 10 h of reaction. While KNCAC shows a modest activity for DEC synthesis, the rate of DEC synthesis and the selectivity to DEC based on ethanol are significantly enhanced by the inclusion of PdCl2 in the catalyst formulation. PdCl2 supported on activated carbons shows no activity for DEC synthesis, but only a low activity for acetaldehyde synthesis. Increasing the ratio of CuCl2 to PdCl2 in the catalyst formulation increases the rate of DEC formation, but also the rate of acetaldehyde formation. As a consequence, the selectivity to DEC from ethanol passes through a maximum at a CuCl2/PdCl2 ratio of about 10/1. The addition of KCl to the catalyst formulation enhances somewhat the maximum rate of DEC formation, without affecting the rate of acetaldehyde formation, contributing to an increase in the maximum selectivity to DEC from ethanol. Pretreatment of fresh KNCPAC in He at 573 K for 1 h enhances the maximum rate of DEC formation and to an even greater degree, the rate of acetaldehyde formation, leading to a decrease in the maximum DEC selectivity from ethanol. He pretreatment also accelerates the rate of activity loss after the maximum in the rate of DEC formation is attained.
The observed changes in DEC activity with time on stream suggest that changes occur in the catalyst composition and structure with increasing exposure of the catalyst to reaction conditions. This view is supported by the observed changes in the physical characteristics of the catalyst. XANES and EXAFS clearly show that while copper is introduced as CuCl2, the Cu(II) cations are reduced to Cu(I) cations during catalyst preparation. This change is accompanied by a decrease in the Cu-Cl coordination number and reduction in the intensity of the Cl XANES signal. After exposure to DEC synthesis conditions, the Cu-Cl coordination number decreases further and the Cu(I) pre-edge feature in the XANES spectrum increases in intensity. TEM and SEM micrographs, as well as XRD data, show no evidence for crystalline CuCl, either in the freshly prepared catalyst or after exposure of the catalyst to reaction conditions, leading to the conclusion that CuClx species are very highly dispersed. While these species could not be imaged, the Cu-Cl bond distance determined by analysis of Cu K-edge EXAFS data acquired after catalyst use suggest that Cu is present in the form of [CuCl2]
- anions. By contrast, TEM
49
shows that Pd is present in the form of 30 nm crystallites of PdCl2, a conclusion that is also supported by analysis of Pd K-edge EXAFS data. These data also show a small decrease in the Pd-Cl coordination number upon exposure of the catalyst to reaction conditions. Combining the data obtained on the structure and form of the dispersed CuClx and PdClx species together with the observation that the presence of Pd strongly enhances the formation of DEC, we hypothesize that the active centers for DEC synthesis may be species of the form [PdCl2-x][CuCl2]x formed on the surface of PdCl2 crystallites.
The pattern of catalyst activation up to a maximum DEC activity followed by a loss in activity has been reported previously [11, 12], but the causes for this evolution in catalyst activity are poorly understood. We propose that activation involves the further dispersion of CuClx species on the surface of activated carbon, which may in part be facilitated by the reaction of CuCl with KCl to form K2CuCl3, a compound that has a melting point of 423 K, the temperature at which DEC synthesis is carried out. It is noted, though, that no direct evidence for K2CuCl3 was observed. The formation of [PdCl2-x][CuCl2]x is also likely to occur, or be enhanced during exposure of the catalyst to reaction conditions. The loss in catalyst activity is accompanied by a decrease in the Cl content of the catalyst, observed by SEM, Cl-XANES, and the presence of C2H5Cl in the reaction products. Similar attributions of activity loss have been reported in the literature [11], and it has been noted that catalyst activity can be restored by treatment of the catalyst with a Cl-containing compound, such as HCl. Another loss mechanism that has been proposed is the conversion of CuCl to paratacamite, Cu2Cl(OH)3. Evidence for the formation of paratacamite was observed in the XRD patterns of spent catalyst, and it can be hypothesized that this compound is formed by the reaction 2 CuCl + 0.5 O2 + H2O + C2H5OH → Cu2Cl(OH)3 + C2H5Cl, where CuCl may be formed by abstraction of chlorine from [CuCl2]
- by a cationic species such as H+. 3.5. Conclusions
The present investigation has shown that carbon-supported catalysts prepared from CuCl2 and PdCl2 are active for the synthesis of DEC by oxidative carbonylation, but undergo significant changes in both activity and selectivity with time. The DEC activity and selectivity of a freshly prepared catalyst at first increase with time, then reach a maximum, and finally steadily decrease. The structure of the catalyst is complex and changes with pretreatment and exposure to reaction conditions. While copper is introduced as Cu(II) in the form of CuCl2, it is almost completely reduced to Cu(I) in the form of highly dispersed species, very likely [CuCl2]
- anions, during catalyst preparation. Palladium, on the other hand, which is introduced as PdCl2, retains its oxidation state and is present in the form of large PdCl2 particles. It is further observed that, alone, neither PdCl2 nor [CuCl2]
- species are active for DEC synthesis and that DEC synthesis activity is observed only when both species are present together. It is hypothesized that the active form of the catalyst involves the formation of [PdCl2-x][CuCl2]x species on the surface of the PdCl2 particles. The loss of DEC activity is accompanied by a loss in Cl content of the catalyst and the appearance of small amounts of C2H5Cl. Deactivation is also accompanied by the appearance of paratacamite that is believed to form via the overall reaction 2 CuCl + 0.5 O2 + H2O + C2H5OH → Cu2Cl(OH)3 + C2H5Cl. The addition of KCl to the catalyst enhances its DEC activity slightly, but NaOH addition has little effect on the DEC activity.
50
3.6. References 1. M. A. Pacheco, C. L. Marshall, Energy Fuels 11 (1997) 2-29. 2. U. Romano, R. Tesei, M. M. Mauri, P. Rebora, Ind. Eng. Chem. Prod. Res. Dev. 19
(1980) 396-403. 3. Y. J. Wang, Y. Q. Zhao, B. G. Yuan, B. C. Zhang, J. S. Cong, Appl. Catal., A 171 (1998)
255-260. 4. B. C. Dunn, C. Guenneau, S. A. Hilton, J. Pahnke, E. M. Eyring, Energy Fuels 16 (2002)
177-181. 5. G. L. Curnutt, U.S. Patent 4,625,044 (1986). 6. K. Tomishige, T. Sakaihori, S. Sakai, K. Fujimoto, Appl. Catal. A 181 (1999) 95-102. 7. H. Itoh, Y. Watanabe, K. Mori, H. Umino, Green Chem. 5 (2003) 558-562. 8. R. X. Jiang, S. F. Wang, X. Q. Zhao, Y. J. Wang, C. F. Zhang, Applied Catalysis a-
General 238 (2003) 131-139. 9. M. Graziani, Uguaglia.P, G. Carturan, J. Organomet. Chem. 27 (1971) 275-&. 10. R. X. Jiang, Y. J. Wang, X. Q. Zhao, S. F. Wang, C. Q. Jin, C. F. Zhang, J. Mol. Catal. A:
Chem. 185 (2002) 159-166. 11. G. L. Curnutt, U.S. Patent 5,004,827 (1991). 12. P. Yang, Y. Cao, W.-L. Dai, J.-F. Deng, K.-N. Fan, Appl. Catal., A 243 (2003) 323-331. 13. A. Punnoose, M. S. Seehra, B. C. Dunn, E. M. Eyring, Energy Fuels 16 (2002) 182-188. 14. Y. Cao, P. Yang, C.-Z. Yao, N. Yi, W.-L. Feng, W.-L. Dai, K.-N. Fan, Appl. Catal., A
272 (2004) 15-22. 15. Z. Zhang, X. B. Ma, J. Zhang, F. He, S. P. Wang, J. Mol. Catal. A: Chem. 227 (2005)
141-146. 16. Z. Zhang, X. B. Ma, P. B. Zhang, Y. M. Li, S. P. Wang, J. Mol. Catal. A: Chem. 266
(2007) 202-206. 17. T. C. Liu, C. S. Chang, Appl. Catal., A 304 (2006) 72-77. 18. X. B. Ma, R. Z. Zhao, G. H. Xu, F. He, H. F. Chen, Catal. Today 30 (1996) 201-206. 19. M. S. Han, B. G. Lee, B. S. Ahn, H. S. Kim, D. J. Moon, S. I. Hong, J. Mol. Catal. A:
Chem. 203 (2003) 137-143. 20. R. E. Jentoft, S. E. Deutsch, B. C. Gates, Rev. Sci. Instrum. 67 (1996) 2111-2112. 21. Y. Zhang, D. N. Briggs, E. de Smit, A. T. Bell, J. Catal. 251 (2007) 443-452. 22. M. Newville, J. Synchrotron Rad. 8 (2001) 322-324. 23. I. J. Drake, Y. H. Zhang, D. Briggs, B. Lim, T. Chau, A. T. Bell, J. Phys. Chem. B 110
(2006) 11654-11664. 24. G. S. Szymanski, G. Rychlicki, A. P. Terzyk, Carbon 32 (1994) 265-271. 25. A. B. Sánchez, N. Homs, J. L. G. Fierro, P. R. de la Piscina, Catal. Today 107-108 (2005)
431-435. 26. S. Velu, L. Wang, M. Okazaki, K. Suzuki, S. Tomura, Microporous Mesoporous Mater.
54 (2002) 113-126. 27. D. E. Etter, C. J. Wiedenheft, Sol. Energy Mater. 2 (1980) 423-431. 28. L.-W. Yin, M.-S. Li, D.-S. Sun, J.-J. Cui, Mater. Lett. 48 (2001) 21-25. 29. L. S. Kau, D. J. Spirasolomon, J. E. Pennerhahn, K. O. Hodgson, E. I. Solomon, J. Am.
Chem. Soc. 109 (1987) 6433-6442.
51
30. I. Persson, M. Sandstrom, A. T. Steel, M. J. Zapatero, R. Akesson, Inorg. Chem. 30 (1991) 4075-4081.
31. S. Andersson, S. Jagner, Acta Chem. Scand. A 40 (1986) 52-57. 32. S. Andersson, S. Jagner, Acta Chem. Scand. A 40 (1986) 177-181. 33. X.-B. Wang, L.-S. Wang, R. Brown, P. Schwerdtfeger, D. Schroder, H. Schwarz, J.
Chem. Phys. 114 (2001) 7388-7395. 34. R. E. Shaffer, J. O. Cross, S. L. Rose-Pehrsson, W. T. Elam, Anal. Chim. Acta 442
(2001) 295-304.
52
Chapter 4
Effects of support composition and pretreatment on the activity and selectivity of carbon-supported PdCunClx catalysts for the synthesis
of diethyl carbonate 4.1. Introduction
Diethyl carbonate (DEC) is a potential fuel oxygenate, which possesses lower volatility, better fuel/water partitioning coefficient, and more benign hydrolysis products than dimethyl carbonate (DMC), while retaining similar blending octane properties [1, 2]. Commercial production of DEC and other alkyl carbonates can be carried out by oxidative carbonylation of the appropriate alcohol (Equation 1) in a slurry containing cuprous chloride to catalyze the reaction [3].
( ) OHCOROOCO2ROH 22CuCl
221 + →++ (1)
Inherent difficulties with the slurry process (e.g. corrosion and product separation) have inspired efforts to develop a heterogeneous catalyst for gas-phase synthesis of alkyl carbonates. To this end, investigations have been carried out using CuCl2 and CuCl in combination with PdCl2 and other additives such as KCl and NaOH supported on activated carbon (AC) [4-13], silica [7, 14, 15], alumina [7, 16], and zeolites [17-20]. Of the systems studied, AC-supported catalysts have been found to be the most active and selective to alkyl carbonates. However, the stability of such catalysts is an issue, and the observed loss of activity with time on stream has been attributed to the loss of Cl [4, 5, 10, 13]. Several studies have shown that catalyst activity can be restored by ex situ regeneration using HCl [4, 5], but continuous regeneration of catalyst activity by the addition of HCl or other Cl-containing compounds to the feed has only been successful for an alumina-supported catalyst [16].
AC-supported catalysts have usually been made by impregnating the support with an aqueous solution of CuCl2 and promoters (including PdCl2, alkali chlorides and alkali hydroxides) [7, 13]. While it has been established that the promoters enhance catalyst activity and alkyl carbonate selectivity, relatively little is known about structure of the active species. In a recent report, we have presented details about the structure of the active species in a KCl-NaOH-PdCl2-CuCl2/AC catalyst, obtained using x-ray absorption spectroscopy and electron microscopy [13]. While CuCl2 was used as a precursor, virtually all of the Cu was present as very highly dispersed Cu(I) species after catalyst use. Information obtained from Cu K-edge XANES and EXAFS, and from Cl K-edge XANES suggest that the Cu+ cations exist as linear [CuCl2]
- anions. Pd was present exclusively as PdCl2, mostly in the form of 30 nm crystallites. The interaction between cuprous chloride and KCl was thought to lead to the formation of potassium chlorocuprate compounds, which melt at the reaction temperature (423 K) and could increase the mobility and Cl coordination of Cu. DEC activity was attributed primarily to interactions between [CuCl2]
- and PdCl2, since both are required for high activity. An important
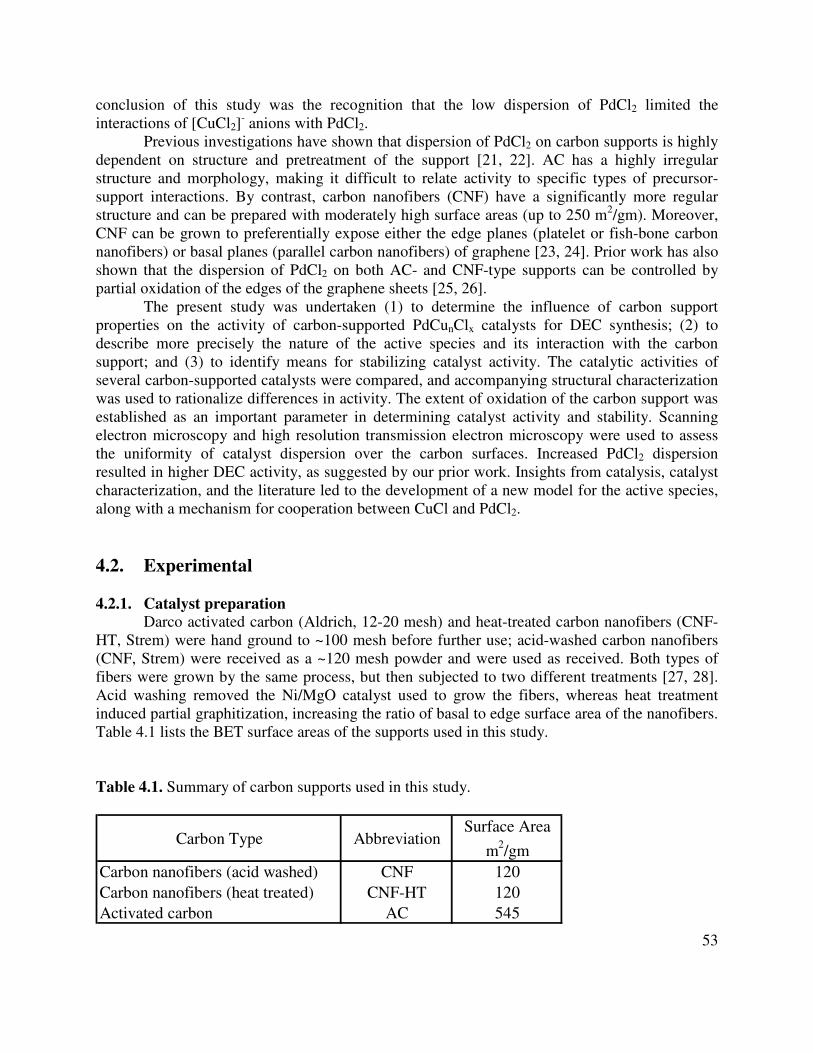
53
conclusion of this study was the recognition that the low dispersion of PdCl2 limited the interactions of [CuCl2]
- anions with PdCl2. Previous investigations have shown that dispersion of PdCl2 on carbon supports is highly
dependent on structure and pretreatment of the support [21, 22]. AC has a highly irregular structure and morphology, making it difficult to relate activity to specific types of precursor-support interactions. By contrast, carbon nanofibers (CNF) have a significantly more regular structure and can be prepared with moderately high surface areas (up to 250 m2/gm). Moreover, CNF can be grown to preferentially expose either the edge planes (platelet or fish-bone carbon nanofibers) or basal planes (parallel carbon nanofibers) of graphene [23, 24]. Prior work has also shown that the dispersion of PdCl2 on both AC- and CNF-type supports can be controlled by partial oxidation of the edges of the graphene sheets [25, 26].
The present study was undertaken (1) to determine the influence of carbon support properties on the activity of carbon-supported PdCunClx catalysts for DEC synthesis; (2) to describe more precisely the nature of the active species and its interaction with the carbon support; and (3) to identify means for stabilizing catalyst activity. The catalytic activities of several carbon-supported catalysts were compared, and accompanying structural characterization was used to rationalize differences in activity. The extent of oxidation of the carbon support was established as an important parameter in determining catalyst activity and stability. Scanning electron microscopy and high resolution transmission electron microscopy were used to assess the uniformity of catalyst dispersion over the carbon surfaces. Increased PdCl2 dispersion resulted in higher DEC activity, as suggested by our prior work. Insights from catalysis, catalyst characterization, and the literature led to the development of a new model for the active species, along with a mechanism for cooperation between CuCl and PdCl2. 4.2. Experimental 4.2.1. Catalyst preparation
Darco activated carbon (Aldrich, 12-20 mesh) and heat-treated carbon nanofibers (CNF-HT, Strem) were hand ground to ~100 mesh before further use; acid-washed carbon nanofibers (CNF, Strem) were received as a ~120 mesh powder and were used as received. Both types of fibers were grown by the same process, but then subjected to two different treatments [27, 28]. Acid washing removed the Ni/MgO catalyst used to grow the fibers, whereas heat treatment induced partial graphitization, increasing the ratio of basal to edge surface area of the nanofibers. Table 4.1 lists the BET surface areas of the supports used in this study.
Table 4.1. Summary of carbon supports used in this study.
Carbon Type AbbreviationSurface Area
m2/gmCarbon nanofibers (acid washed) CNF 120Carbon nanofibers (heat treated) CNF-HT 120Activated carbon AC 545
54
The effect of mild or strong surface oxidation was investigated by pretreating the acid-washed carbon nanofiber (CNF) in 0.5 M HNO3 (mild oxidation) or a 1:1 mixture of concentrated HNO3 and H2SO4 (strong oxidation). The conditions chosen for oxidation of the support were based on previously reported studies [22, 29]. Oxidation was carried out by contacting acid-washed nanofibers in a round-bottomed flask with a solution of the desired acid (25 mL solution/gm carbon). This mixture was stirred and heated at reflux (368-373 K) for one hour, then filtered and washed until the filtrate was neutral. Supports thus oxidized were then dried overnight at 383 K.
CuCl2 (anhydrous, Acros), PdCl2 (Aldrich) and KCl (Fisher) were introduced onto the carbon supports by incipient wetness impregnation (IWI), using an aqueous solution of each salt or mixture of salts. While cuprous species are known to catalyze the oxidative carbonylation of alcohols (see above, Introduction), the solubility of CuCl in aqueous solution is poor, while CuCl2 dissolves readily. As we have reported previously, the interactions of the CuCl2 precursor with the support results in the reduction of CuCl2 to cuprous chloride species [13]. Details of the reduction process are presented in the Discussion.
The amount of solution needed to wet each support (1.7 mL H2O/gm AC; 1.5 mL H2O/gm carbon nanofibers) was determined by dropwise addition of water to the support until the onset of visible wetness. Catalyst loadings were adjusted according to the surface area of the support (Tables 4.1 and 4.2). Complete dissolution of the precursors (especially PdCl2) took several hours and was sometimes assisted by sonication. The resulting homogeneous green-brown solution of CuCl2, PdCl2 and KCl was added dropwise under ambient conditions to the support, which was pre-dried at 383 K. To ensure uniform distribution of the precursors over the support surface, the powder was mixed thoroughly after every 3-5 drops of solution. Any excess liquid was removed under gentle nitrogen flow while stirring. The catalyst was dried for 5 h at 383 K in air, and then stored at room temperature until use. The preparation conditions for catalysts in this study are summarized in Table 4.2. Table 4.2. Summary of catalysts prepared in this study. The metal loadings (in wt%) are those used during impregnation. Catalyst designation CuCl2
a PdCl2a Cu/Pdb KClc Notes
KCP/AC 3.0 0.25 20 1.0KCP/CNF 0.66 0.06 19 1.0KCP/CNF-HT 0.66 0.06 19 1.0KCP/CNF-0.5OX 0.66 0.06 19 1.0 CNF support oxidized in 0.5 M HNO3
KCP/CNF-15OX 0.66 0.06 19 1.0CNF support oxidized in 1:1 mixture of 15 M HNO3 and 18 M H2SO4
C/CNF 0.66 - - - CuCl2 only
CP/CNF 0.66 0.06 19 - CuCl2 and PdCl2 onlya on a wt% metal basisb atomic ratio of Cu/Pdc molar ratio of KCl/Cu
55
4.2.2. Catalytic activity and selectivity The apparatus used to investigate catalyst activity and selectivity was identical to that
described previously [13]. Because the catalyst activity and selectivity changed during the course of the reaction, a new sample of catalyst was used for each experiment. A run was initiated by loading 150 mg of catalyst into the reactor and then heating it to 423 K in 60 cm3/min of He. The flow of reactants was started immediately upon reaching 423 K. The feed to the reactor contained CO (61%), O2 (5%), ethanol (13%) and He (24%), which were flowed over the catalyst at a total flow rate of 69 cm3/min (STP). For stability experiments, CCl4 (0-104 ppm) was also added to the feed. All reactions were carried out at 3.1 bar. After reaction, catalysts were cooled in He and then stored at ambient conditions. All catalysts were tested for at least 10 h to assess the extent of catalyst deactivation.
The reaction products were identified and quantified by gas chromatography (Agilent 6890GC) at 45-min intervals. Details of the GC analysis have been presented in Ref. 13. Because catalyst loadings were adjusted for surface area, and because CuClx was the majority component relative to PdCl2, activities were usually normalized to the moles of Cu in the catalyst (mmol product/mol Cu/sec). CO2, acetaldehyde and 1,1-diethoxyethane (acetal) were the only significant byproducts detected. While water was observed in the reaction products, its concentration was not quantified.
For selectivity calculations, CO2 was considered to be derived from the oxidation of CO (equation 3). Evidence from other studies of DMC synthesis indicates that CO2 formation can also occur by hydrolysis of alkyl carbonates (equation 4, ∆G0 = -12.2 kcal/mol) [20], but the overall pathway (Equations 2 and 4) is equivalent to CO oxidation for the purposes of calculating selectivity. CO2 activity was negligible when only ethanol and O2 were passed over the catalyst, and consequently, direct combustion of ethanol was not considered as a path to CO2.
Acetaldehyde and acetal were derived from ethanol (equations 5 and 6, respectively). Equation 7 was used to calculate product selectivities from ethanol or CO. In this equation ni is the net moles of ethanol or CO required to make the ith product; ri is the rate of formation of the ith product; and the summation is over all products. For example, the selectivities from ethanol were calculated with nDEC = 2, nacetaldehyde = 1, and nacetal = 3; and the selectivities from CO were calculated with nDEC = 1 and nCO2 = 1.
( ) OHCOOCHCHOCOOHCH2CH 222322
123 +→++ (2)
2221 COOCO →+ (3)
( ) 2232223 COOHCH2CHOHCOOCHCH +→+ (4)
OHCHOCHOOHCHCH 23221
23 +→+ (5)
( ) OHCHCHOCHCHOHCH2CHCHOCH 232223233 +→+ (6)
∑
=
j
jj
ii
irn
rnS
(7)
4.2.3. Elemental analysis and determination of the point of zero charge (PZC)
Elemental analyses for Cl (IC); CH (combustion); and O (pyrolysis) were carried out by Galbraith Laboratories. The PZC of the carbon supports, i.e., the pH at which the net surface
56
charge is zero, was determined by the mass titration method [30]. The equilibrium pH was measured after vigorously shaking aqueous suspensions of support in water of increasing carbon/water ratio. A plot of pH versus carbon wt% reached a plateau between 10-20 wt% carbon, and the pH at the plateau value was taken as the PZC of the carbon.
4.2.4. Infrared spectroscopy
To acquire infrared spectra, each carbon sample was dried at 383 K and diluted to 0.1 wt% in dry IR-quality KBr (Fisher). Pellets (1 cm dia.) were formed from 100 mg of the diluted carbon-KBr powder using a hydraulic press held at 8000 psi for 2 min. A reference pellet of 100 mg KBr was also pressed.
Transmission IR spectra were acquired on a Nicolet 750 Magna-IR spectrometer. After installing the pellet in the infrared cell, dry nitrogen was flowed continuously to eliminate most atmospheric interference. A single beam spectrum was acquired by collecting 200 scans from 4000 cm-1 to 600 cm-1 at 2 cm-1 resolution. A single beam spectrum I was acquired for each carbon sample (Icarbon) and for the pure KBr pellet (IKBr). Single beam spectra of the open atmosphere (Iatm) and the nitrogen-flushed chamber (IN2) were also obtained for use in processing the spectra, as described below.
Absorbance spectra of carbon samples (Acarbon) were calculated using the spectrum of pure KBr as the background spectrum (Equation 8). Absorbance spectra for the KBr pellet (AKBr) and for the atmosphere (Aatm) were calculated using the nitrogen spectrum as background (Equations 9 and 10).
−=
KBr
carbon
carbonI
IA log (8)
−=
2
logN
KBr
KBrI
IA (9)
−=
2
logN
atm
atmI
IA (10)
( )atmKBrcarboncarbon AkAkAA ∗−∗−= 21* (11) The Acarbon spectra were refined further by adjusting factors k1 and k2 in Equation 11 such
that a KBr artifact at 1384 cm-1 and atmospheric contamination were minimized in Acarbon*. Acarbon* spectra were then baseline corrected (to remove background tilt) and smoothed. Finally, each Acarbon* spectrum was baseline corrected in the region from 1750 cm-1 to 750 cm-1, and these spectra were compared on a common absorbance scale to assess the type and relative abundance of oxygen groups present on the different supports.
4.2.5. Scanning electron microscopy (SEM)
The catalyst surface composition and structure was examined by scanning electron microscopy using a S-4300SE/N (Hitachi, USA) scanning electron microscope equipped with energy dispersive x-ray spectroscopy (EDX). The accelerating voltage of the microscope was
57
15.0-20.0 kV. Catalyst samples were mounted on carbon tape and evacuated at ~10-4 Pa. Noran System Six software derived atomic concentrations from x-ray emission profiles.
4.2.6. High resolution transmission electron microscopy (HR-TEM)
Images of the catalyst surface at 0.5 Å resolution were obtained with the TEAM 0.5 microscope at the National Center for Electron Microscopy (NCEM). TEM samples were prepared by suspending approximately 1 mg catalyst in 1 mL ethanol, sonicating the solution for 5 min, and then applying a small drop of the ethanol suspension onto holey carbon-coated copper grids (SPI Supplies). 4.3. Results 4.3.1. Support characterization
Structure of the carbon (HR-TEM). HR-TEM was employed to examine the nanoscale structure of the carbon supports. The images in Figure 4.1 illustrate the differences between KCP/AC (a), KCP/CNF (b), and KCP/CNF-HT (c), all shown after catalyst preparation. The image of AC shown in Figure 4.1a is typical for activated carbons. A Fourier transform of this image (bottom inset) reveals rings with spacings characteristic of graphite [31], suggesting that AC is made up of highly disordered graphene layers (top inset).
In contrast to AC, the graphene layers in CNF (Figure 4.1b) and CNF-HT (Figure 4.1c) are clearly distinguishable. The edges of platelet-type CNF are visible in Figure 4.1b, and the inset illustrates the “deck of cards” structure of platelet-like CNF. Figure 4.1c illustrates the effect of heat treatment on CNF, which causes the edges to close and bond together, forming envelopes that now expose curved basal planes instead of edge surfaces. The inset gives a simplified illustration of the closed loops formed during heat treatment.
Oxygen content of the carbon supports. The oxygen content of the carbon supports was characterized by three techniques. The PZC of the supports was measured to determine their acidity, and elemental analysis was carried out to measure oxygen content. (The oxygen content of AC could not be analyzed reliably due to interference from silica and alumina impurities.) Finally, the nature and distribution of oxygen-containing functional groups were determined by infrared spectroscopy.
Table 4.3 lists the PZC and oxygen content for each support. The oxygen content of the CNF-HT support was below the pyrolysis detection limit of 0.5 wt%. Oxygen content increased progressively in the order CNF < CNF-0.5OX < CNF-15OX, consistent with the trend of increasing acidity observed by PZC analysis. The strongly oxidized CNF-15OX support has significantly higher oxygen content than the other supports, indicating the probable formation of larger O complexes on the surface, including carboxylic acids, lactones and carbonates.
Characterization of O-containing functional groups by IR spectroscopy is summarized in Figure 4.2. Bands are observed in the regions of 1000-1400 cm-1, characteristic of C-O stretching vibrations in ethers, phenols, esters, lactones, carboxylic acids, and carbonates and to O-H bending modes in phenols; a broad band is observed at 1580 cm-1, due to aromatic C=C stretching vibrations, enhanced by the presence of O-containing functional groups [32].
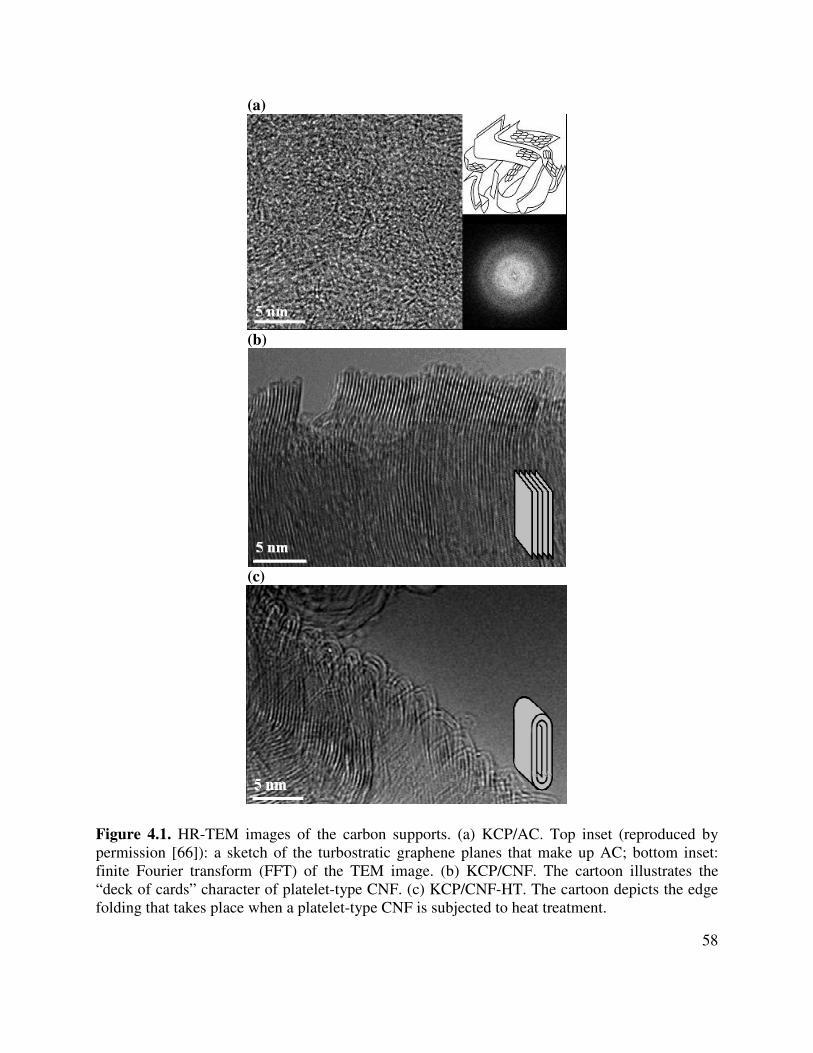
58
(a)
(b)
(c)
Figure 4.1. HR-TEM images of the carbon supports. (a) KCP/AC. Top inset (reproduced by permission [66]): a sketch of the turbostratic graphene planes that make up AC; bottom inset: finite Fourier transform (FFT) of the TEM image. (b) KCP/CNF. The cartoon illustrates the “deck of cards” character of platelet-type CNF. (c) KCP/CNF-HT. The cartoon depicts the edge folding that takes place when a platelet-type CNF is subjected to heat treatment.
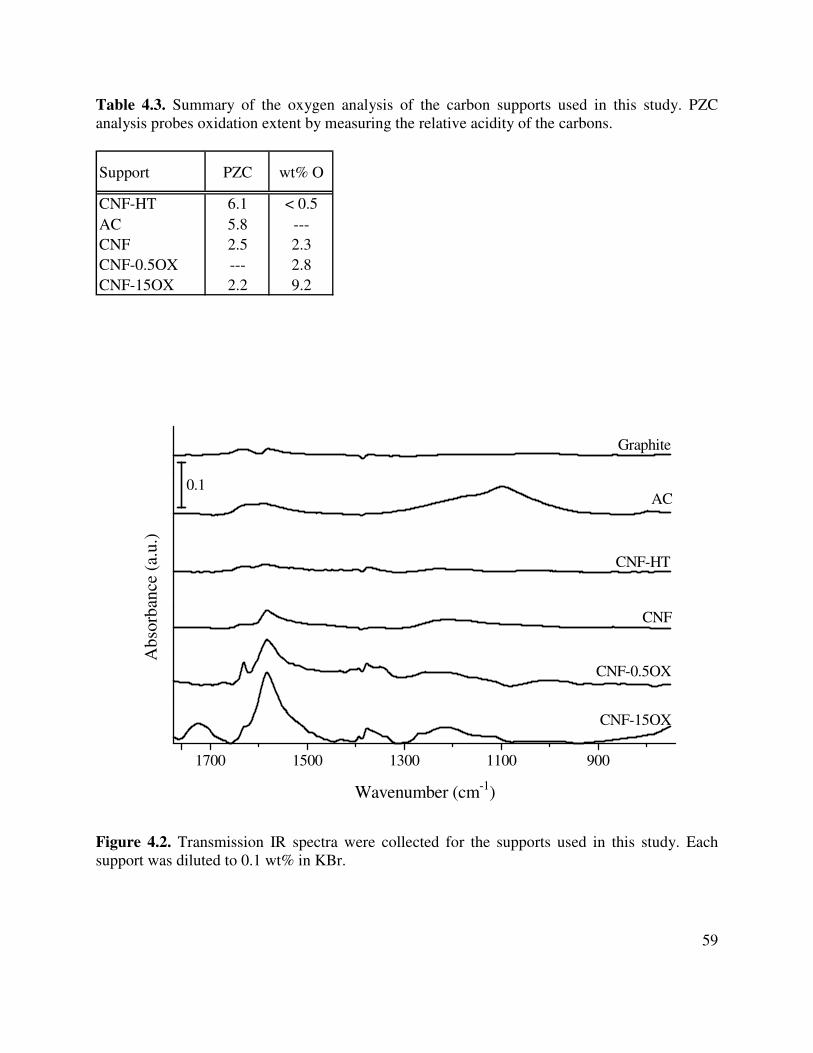
59
Table 4.3. Summary of the oxygen analysis of the carbon supports used in this study. PZC analysis probes oxidation extent by measuring the relative acidity of the carbons.
Support PZC wt% O
CNF-HT 6.1 < 0.5AC 5.8 ---CNF 2.5 2.3CNF-0.5OX --- 2.8CNF-15OX 2.2 9.2
1700 1500 1300 1100 900
Abs
orba
nce
(a.u
.)
Wavenumber (cm-1)
Graphite
AC
CNF-HT
CNF
CNF-0.5OX
CNF-15OX
0.1
Figure 4.2. Transmission IR spectra were collected for the supports used in this study. Each support was diluted to 0.1 wt% in KBr.
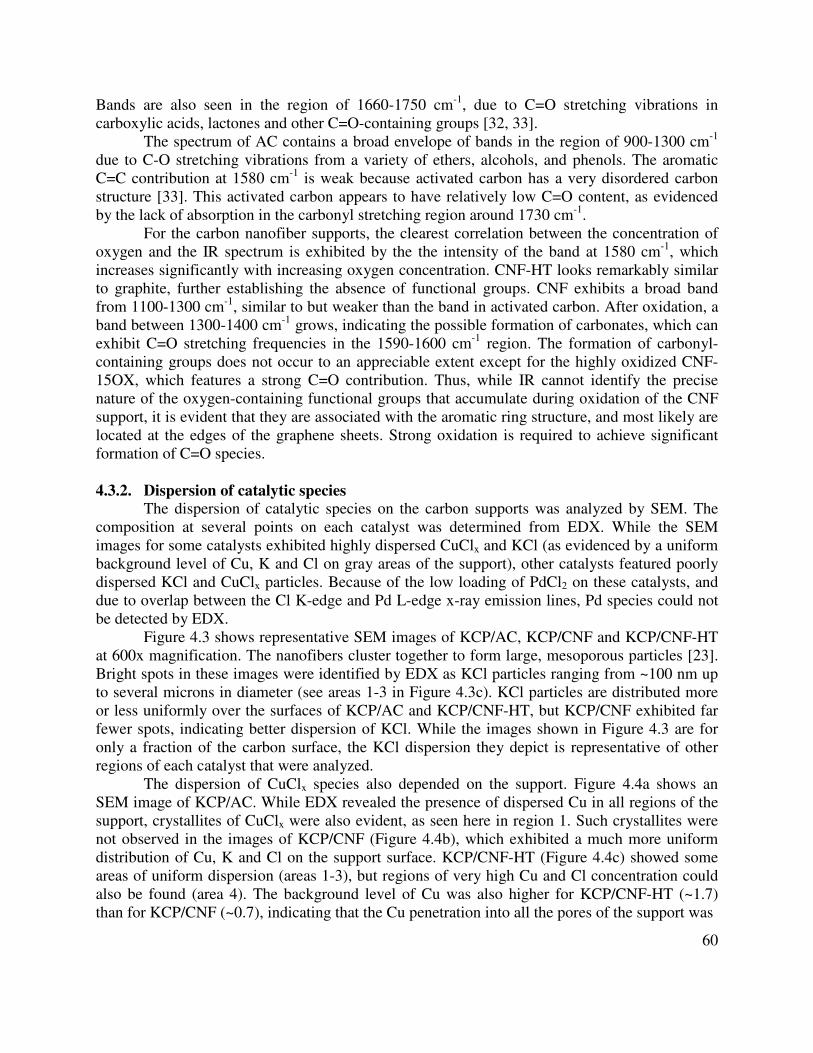
60
Bands are also seen in the region of 1660-1750 cm-1, due to C=O stretching vibrations in carboxylic acids, lactones and other C=O-containing groups [32, 33].
The spectrum of AC contains a broad envelope of bands in the region of 900-1300 cm-1 due to C-O stretching vibrations from a variety of ethers, alcohols, and phenols. The aromatic C=C contribution at 1580 cm-1 is weak because activated carbon has a very disordered carbon structure [33]. This activated carbon appears to have relatively low C=O content, as evidenced by the lack of absorption in the carbonyl stretching region around 1730 cm-1.
For the carbon nanofiber supports, the clearest correlation between the concentration of oxygen and the IR spectrum is exhibited by the the intensity of the band at 1580 cm-1, which increases significantly with increasing oxygen concentration. CNF-HT looks remarkably similar to graphite, further establishing the absence of functional groups. CNF exhibits a broad band from 1100-1300 cm-1, similar to but weaker than the band in activated carbon. After oxidation, a band between 1300-1400 cm-1 grows, indicating the possible formation of carbonates, which can exhibit C=O stretching frequencies in the 1590-1600 cm-1 region. The formation of carbonyl-containing groups does not occur to an appreciable extent except for the highly oxidized CNF-15OX, which features a strong C=O contribution. Thus, while IR cannot identify the precise nature of the oxygen-containing functional groups that accumulate during oxidation of the CNF support, it is evident that they are associated with the aromatic ring structure, and most likely are located at the edges of the graphene sheets. Strong oxidation is required to achieve significant formation of C=O species.
4.3.2. Dispersion of catalytic species
The dispersion of catalytic species on the carbon supports was analyzed by SEM. The composition at several points on each catalyst was determined from EDX. While the SEM images for some catalysts exhibited highly dispersed CuClx and KCl (as evidenced by a uniform background level of Cu, K and Cl on gray areas of the support), other catalysts featured poorly dispersed KCl and CuClx particles. Because of the low loading of PdCl2 on these catalysts, and due to overlap between the Cl K-edge and Pd L-edge x-ray emission lines, Pd species could not be detected by EDX.
Figure 4.3 shows representative SEM images of KCP/AC, KCP/CNF and KCP/CNF-HT at 600x magnification. The nanofibers cluster together to form large, mesoporous particles [23]. Bright spots in these images were identified by EDX as KCl particles ranging from ~100 nm up to several microns in diameter (see areas 1-3 in Figure 4.3c). KCl particles are distributed more or less uniformly over the surfaces of KCP/AC and KCP/CNF-HT, but KCP/CNF exhibited far fewer spots, indicating better dispersion of KCl. While the images shown in Figure 4.3 are for only a fraction of the carbon surface, the KCl dispersion they depict is representative of other regions of each catalyst that were analyzed.
The dispersion of CuClx species also depended on the support. Figure 4.4a shows an SEM image of KCP/AC. While EDX revealed the presence of dispersed Cu in all regions of the support, crystallites of CuClx were also evident, as seen here in region 1. Such crystallites were not observed in the images of KCP/CNF (Figure 4.4b), which exhibited a much more uniform distribution of Cu, K and Cl on the support surface. KCP/CNF-HT (Figure 4.4c) showed some areas of uniform dispersion (areas 1-3), but regions of very high Cu and Cl concentration could also be found (area 4). The background level of Cu was also higher for KCP/CNF-HT (~1.7) than for KCP/CNF (~0.7), indicating that the Cu penetration into all the pores of the support was
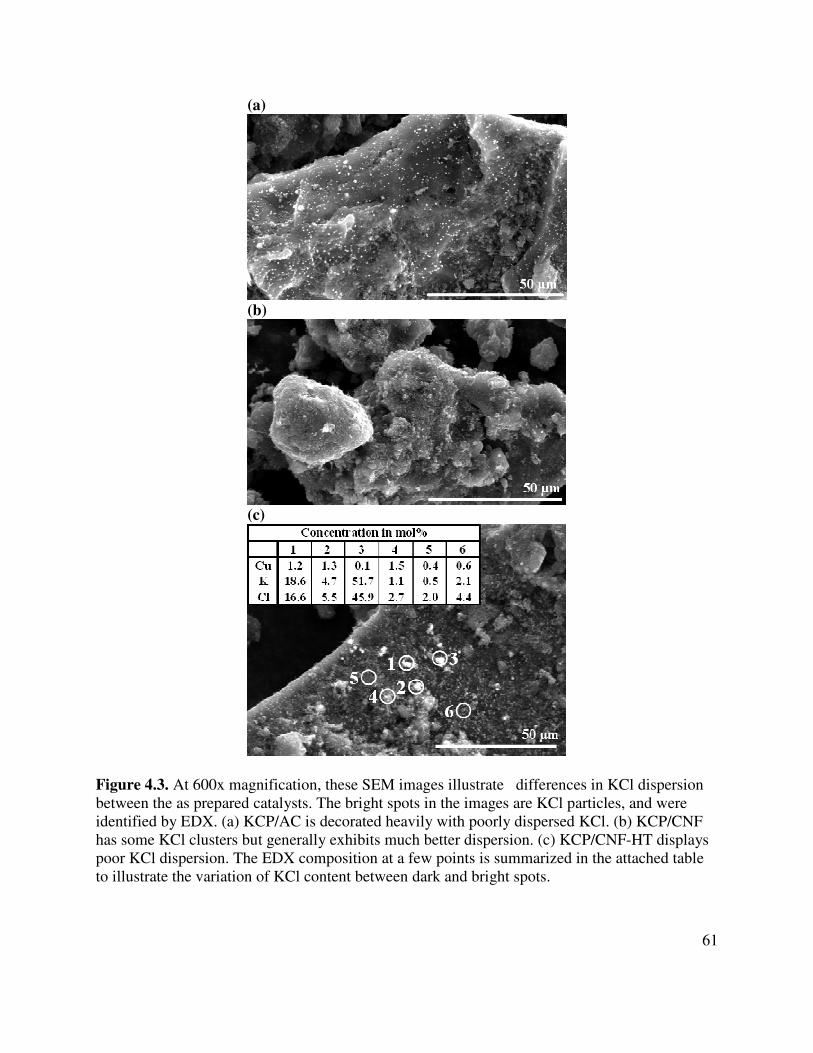
61
(a)
(b)
(c)
Figure 4.3. At 600x magnification, these SEM images illustrate differences in KCl dispersion between the as prepared catalysts. The bright spots in the images are KCl particles, and were identified by EDX. (a) KCP/AC is decorated heavily with poorly dispersed KCl. (b) KCP/CNF has some KCl clusters but generally exhibits much better dispersion. (c) KCP/CNF-HT displays poor KCl dispersion. The EDX composition at a few points is summarized in the attached table to illustrate the variation of KCl content between dark and bright spots.
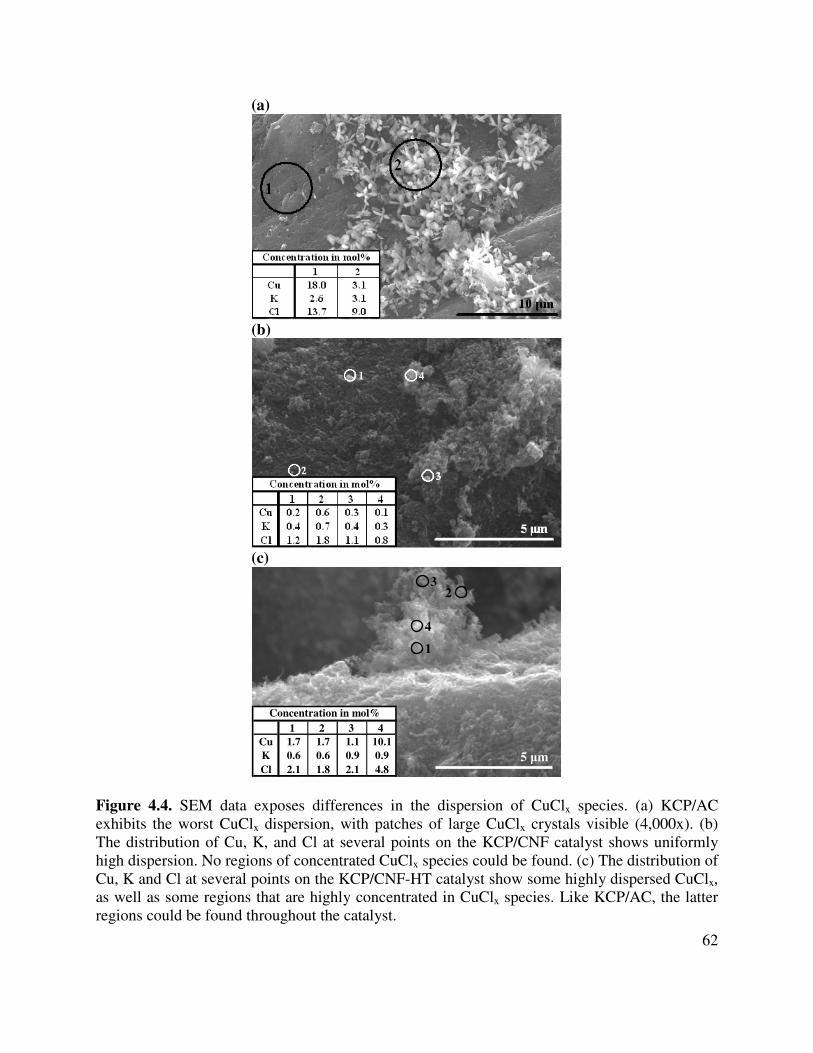
62
(a)
(b)
(c)
5 µm5 µm
1
2 3
4
1 2 3 4Cu 1.7 1.7 1.1 10.1K 0.6 0.6 0.9 0.9Cl 2.1 1.8 2.1 4.8
Concentration in mol%
Figure 4.4. SEM data exposes differences in the dispersion of CuClx species. (a) KCP/AC exhibits the worst CuClx dispersion, with patches of large CuClx crystals visible (4,000x). (b) The distribution of Cu, K, and Cl at several points on the KCP/CNF catalyst shows uniformly high dispersion. No regions of concentrated CuClx species could be found. (c) The distribution of Cu, K and Cl at several points on the KCP/CNF-HT catalyst show some highly dispersed CuClx, as well as some regions that are highly concentrated in CuClx species. Like KCP/AC, the latter regions could be found throughout the catalyst.

63
(c) Figure 4.5. HR-TEM images of the KCP/CNF catalyst, illustrating the variation of intensity while changing the focus of the electron beam. (a) At an underfocus of 10.8 nm, Cu and Pd atoms can be distinguished as bright spots; (b) at an overfocus of 3.6 nm, the spot contrast has decreased significantly; (c) the maximum contrast for each spot.
32
5
1
4
8 6
7
(b)
5 nm
32
5
1
4
8 6
7
32
5
1
4
8 6
7
(b)
5 nm
3 (Cu)2 (Cu)
5 (Cu)
1 (carbon)
4 (Cu)
8 (Pd) 6 (Cu)
7 (Pd)
(a)
5 nm
3 (Cu)2 (Cu)
5 (Cu)
1 (carbon)
4 (Cu)
8 (Pd) 6 (Cu)
7 (Pd)
3 (Cu)2 (Cu)
5 (Cu)
1 (carbon)
4 (Cu)
8 (Pd) 6 (Cu)
7 (Pd)
(a)
5 nm
1 2 3 4 5 6 7 80
5
10
15
20
Expected PMC for Cu
Max
imum
Con
tras
t (%
)
Analysis Point (see image)
Carbon background Copper Palladium
Expected PMC for Pd
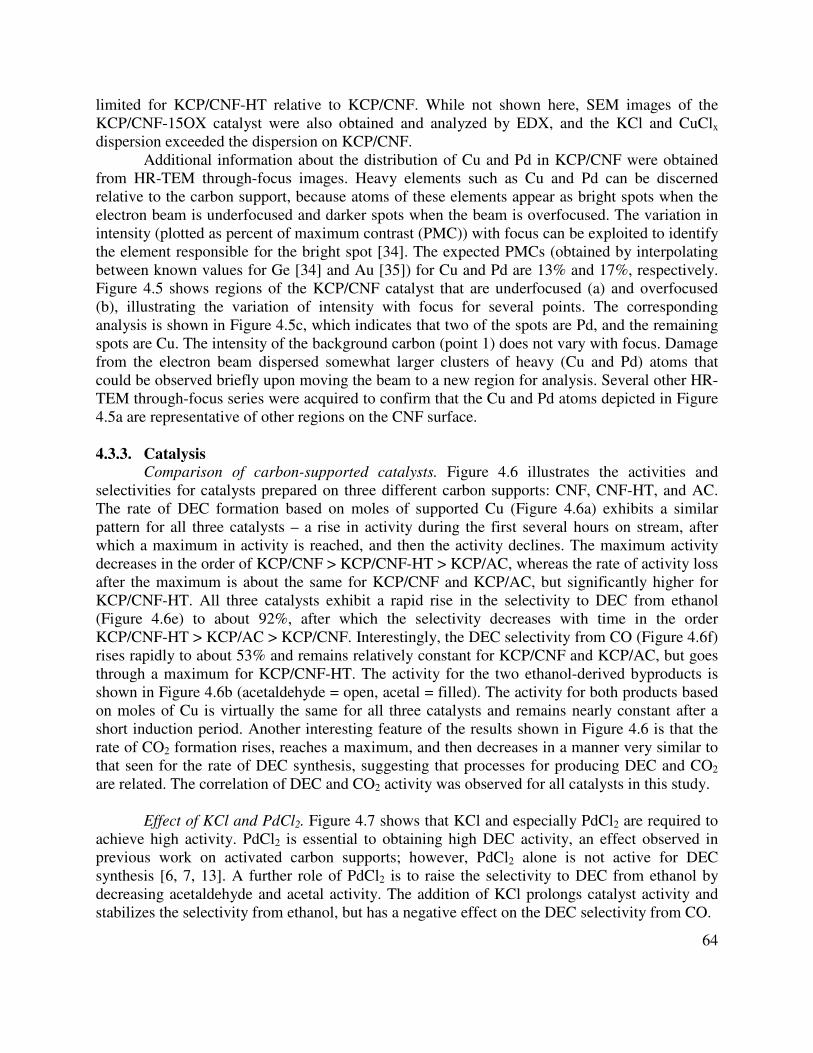
64
limited for KCP/CNF-HT relative to KCP/CNF. While not shown here, SEM images of the KCP/CNF-15OX catalyst were also obtained and analyzed by EDX, and the KCl and CuClx dispersion exceeded the dispersion on KCP/CNF.
Additional information about the distribution of Cu and Pd in KCP/CNF were obtained from HR-TEM through-focus images. Heavy elements such as Cu and Pd can be discerned relative to the carbon support, because atoms of these elements appear as bright spots when the electron beam is underfocused and darker spots when the beam is overfocused. The variation in intensity (plotted as percent of maximum contrast (PMC)) with focus can be exploited to identify the element responsible for the bright spot [34]. The expected PMCs (obtained by interpolating between known values for Ge [34] and Au [35]) for Cu and Pd are 13% and 17%, respectively. Figure 4.5 shows regions of the KCP/CNF catalyst that are underfocused (a) and overfocused (b), illustrating the variation of intensity with focus for several points. The corresponding analysis is shown in Figure 4.5c, which indicates that two of the spots are Pd, and the remaining spots are Cu. The intensity of the background carbon (point 1) does not vary with focus. Damage from the electron beam dispersed somewhat larger clusters of heavy (Cu and Pd) atoms that could be observed briefly upon moving the beam to a new region for analysis. Several other HR-TEM through-focus series were acquired to confirm that the Cu and Pd atoms depicted in Figure 4.5a are representative of other regions on the CNF surface.
4.3.3. Catalysis
Comparison of carbon-supported catalysts. Figure 4.6 illustrates the activities and selectivities for catalysts prepared on three different carbon supports: CNF, CNF-HT, and AC. The rate of DEC formation based on moles of supported Cu (Figure 4.6a) exhibits a similar pattern for all three catalysts – a rise in activity during the first several hours on stream, after which a maximum in activity is reached, and then the activity declines. The maximum activity decreases in the order of KCP/CNF > KCP/CNF-HT > KCP/AC, whereas the rate of activity loss after the maximum is about the same for KCP/CNF and KCP/AC, but significantly higher for KCP/CNF-HT. All three catalysts exhibit a rapid rise in the selectivity to DEC from ethanol (Figure 4.6e) to about 92%, after which the selectivity decreases with time in the order KCP/CNF-HT > KCP/AC > KCP/CNF. Interestingly, the DEC selectivity from CO (Figure 4.6f) rises rapidly to about 53% and remains relatively constant for KCP/CNF and KCP/AC, but goes through a maximum for KCP/CNF-HT. The activity for the two ethanol-derived byproducts is shown in Figure 4.6b (acetaldehyde = open, acetal = filled). The activity for both products based on moles of Cu is virtually the same for all three catalysts and remains nearly constant after a short induction period. Another interesting feature of the results shown in Figure 4.6 is that the rate of CO2 formation rises, reaches a maximum, and then decreases in a manner very similar to that seen for the rate of DEC synthesis, suggesting that processes for producing DEC and CO2 are related. The correlation of DEC and CO2 activity was observed for all catalysts in this study.
Effect of KCl and PdCl2. Figure 4.7 shows that KCl and especially PdCl2 are required to
achieve high activity. PdCl2 is essential to obtaining high DEC activity, an effect observed in previous work on activated carbon supports; however, PdCl2 alone is not active for DEC synthesis [6, 7, 13]. A further role of PdCl2 is to raise the selectivity to DEC from ethanol by decreasing acetaldehyde and acetal activity. The addition of KCl prolongs catalyst activity and stabilizes the selectivity from ethanol, but has a negative effect on the DEC selectivity from CO.
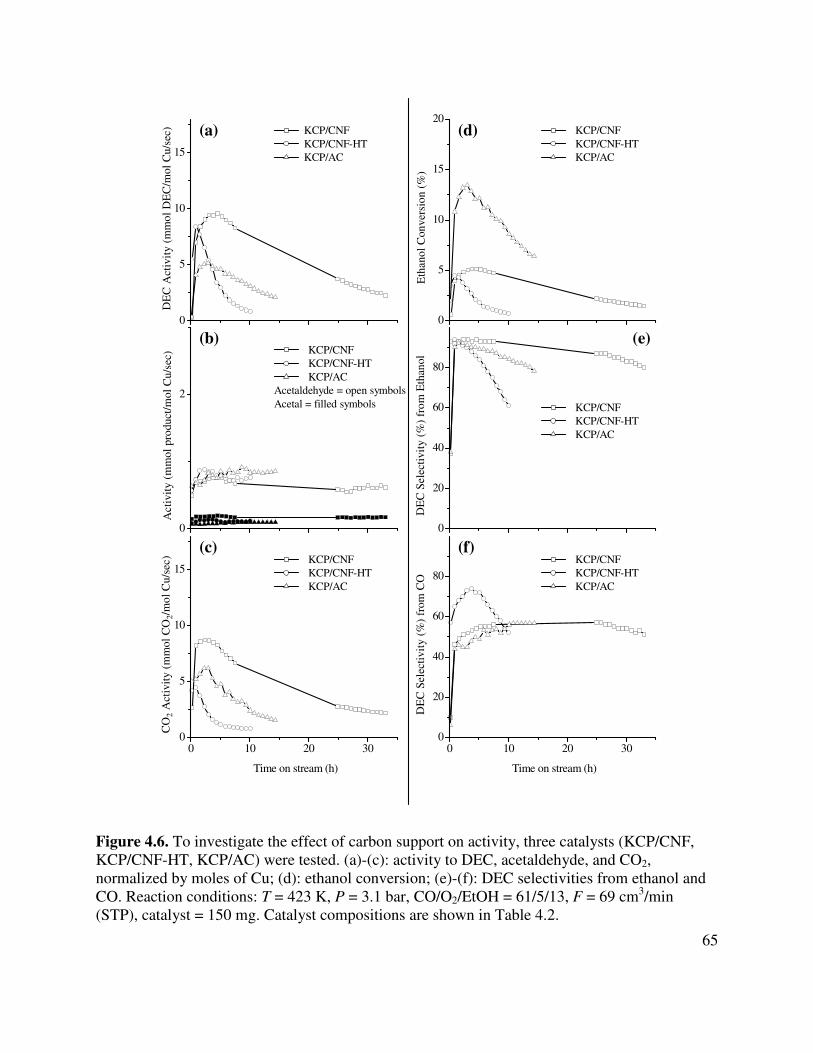
65
0
5
10
15
(a) KCP/CNFKCP/CNF-HTKCP/AC
KCP/CNFKCP/CNF-HTKCP/AC
Acetaldehyde = open symbolsAcetal = filled symbols
DE
C A
ctiv
ity (
mm
ol D
EC
/mol
Cu/
sec)
0
2
(b)
Act
ivity
(m
mol
pro
duct
/mol
Cu/
sec)
0
20
40
60
80
(e)
KCP/CNFKCP/CNF-HTKCP/AC
DE
C S
elec
tivity
(%
) fr
om E
than
ol
0 10 20 300
5
10
15KCP/CNFKCP/CNF-HTKCP/AC
(c)
Time on stream (h)
CO
2 A
ctiv
ity (
mm
ol C
O2/
mol
Cu/
sec)
0 10 20 300
20
40
60
80KCP/CNFKCP/CNF-HTKCP/AC
Time on stream (h)
(f)
DE
C S
elec
tivity
(%
) fr
om C
O
0
5
10
15
20(d) KCP/CNF
KCP/CNF-HTKCP/AC
Eth
anol
Con
vers
ion
(%)
Figure 4.6. To investigate the effect of carbon support on activity, three catalysts (KCP/CNF, KCP/CNF-HT, KCP/AC) were tested. (a)-(c): activity to DEC, acetaldehyde, and CO2, normalized by moles of Cu; (d): ethanol conversion; (e)-(f): DEC selectivities from ethanol and CO. Reaction conditions: T = 423 K, P = 3.1 bar, CO/O2/EtOH = 61/5/13, F = 69 cm3/min (STP), catalyst = 150 mg. Catalyst compositions are shown in Table 4.2.
66
0
5
10
15
KCP/CNF CP/CNF C/CNF
DE
C A
ctiv
ity (
mm
ol D
EC
/mol
Cu/
sec)
0 5 10 15 200
20
40
60
80
Time (h)
Open symbols: DEC selectivity from ethanolClosed symbols: DEC selectivity from CO
DE
C S
elec
tivity
(%
)
Figure 4.7. To investigate the effect of KCl and PdCl2 on KCP/CNF activity, three catalysts (KCP/CNF, CP/CNF, C/CNF) were tested. DEC activity is normalized by moles of Cu. Selectivities to DEC from ethanol (open symbols) and CO (closed symbols) are also shown. Reaction conditions are identical to those in Figure 4.6, and catalyst compositions are in Table 4.2. The data for KCP/CNF is truncated at 20 h in this figure; the full data set can be examined in Figure 4.6.
Support oxidation. Figure 4.8 shows the change in catalyst behavior if CNF is oxidized before adding the catalytically active components. Mild oxidation (KCP/CNF-0.5OX) decreases the activity and selectivity of the catalyst somewhat, whereas strong oxidation (KCP/CNF-15OX) leads to nearly complete loss of DEC activity. It is also evident that oxidation of CNF decreases the selectivities to DEC from both ethanol and CO. As discussed below, a modest amount of CNF oxidation is desirable to disperse the catalytically active component but excessive oxidation is detrimental.
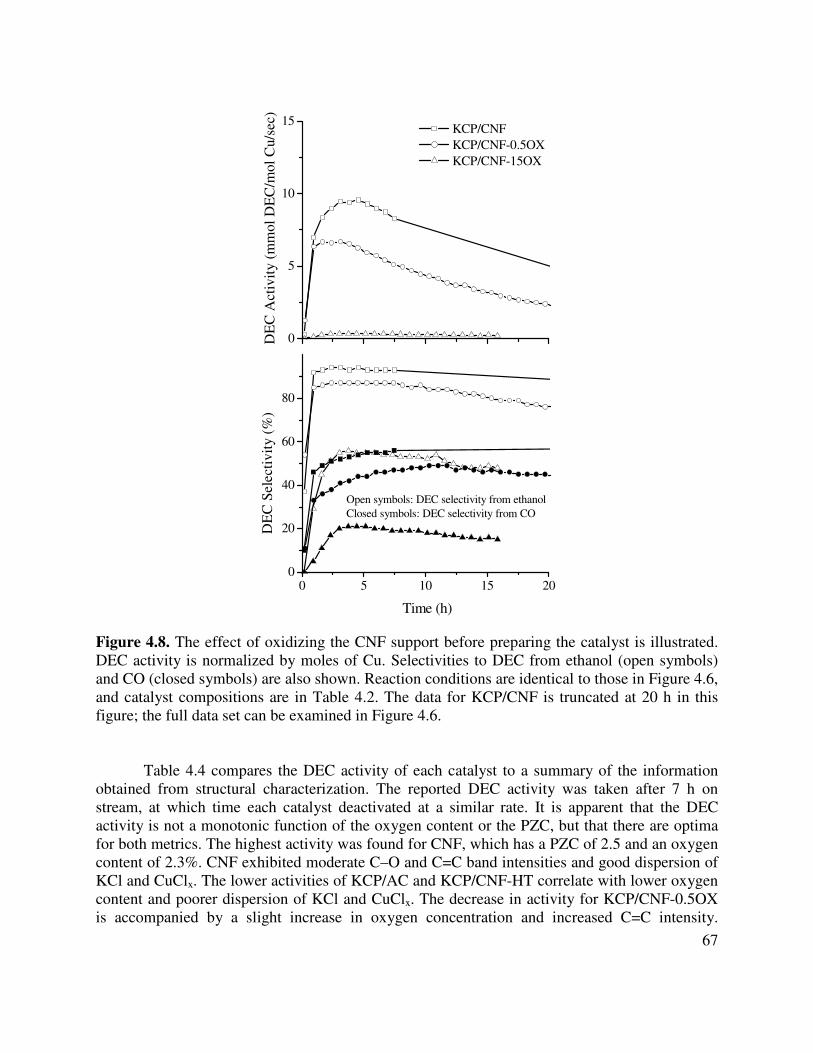
67
0
5
10
15
KCP/CNF KCP/CNF-0.5OX KCP/CNF-15OX
DE
C A
ctiv
ity (
mm
ol D
EC
/mol
Cu/
sec)
0 5 10 15 200
20
40
60
80
Time (h)
Open symbols: DEC selectivity from ethanolClosed symbols: DEC selectivity from CO
DE
C S
elec
tivity
(%
)
Figure 4.8. The effect of oxidizing the CNF support before preparing the catalyst is illustrated. DEC activity is normalized by moles of Cu. Selectivities to DEC from ethanol (open symbols) and CO (closed symbols) are also shown. Reaction conditions are identical to those in Figure 4.6, and catalyst compositions are in Table 4.2. The data for KCP/CNF is truncated at 20 h in this figure; the full data set can be examined in Figure 4.6.
Table 4.4 compares the DEC activity of each catalyst to a summary of the information
obtained from structural characterization. The reported DEC activity was taken after 7 h on stream, at which time each catalyst deactivated at a similar rate. It is apparent that the DEC activity is not a monotonic function of the oxygen content or the PZC, but that there are optima for both metrics. The highest activity was found for CNF, which has a PZC of 2.5 and an oxygen content of 2.3%. CNF exhibited moderate C–O and C=C band intensities and good dispersion of KCl and CuClx. The lower activities of KCP/AC and KCP/CNF-HT correlate with lower oxygen content and poorer dispersion of KCl and CuClx. The decrease in activity for KCP/CNF-0.5OX is accompanied by a slight increase in oxygen concentration and increased C=C intensity.
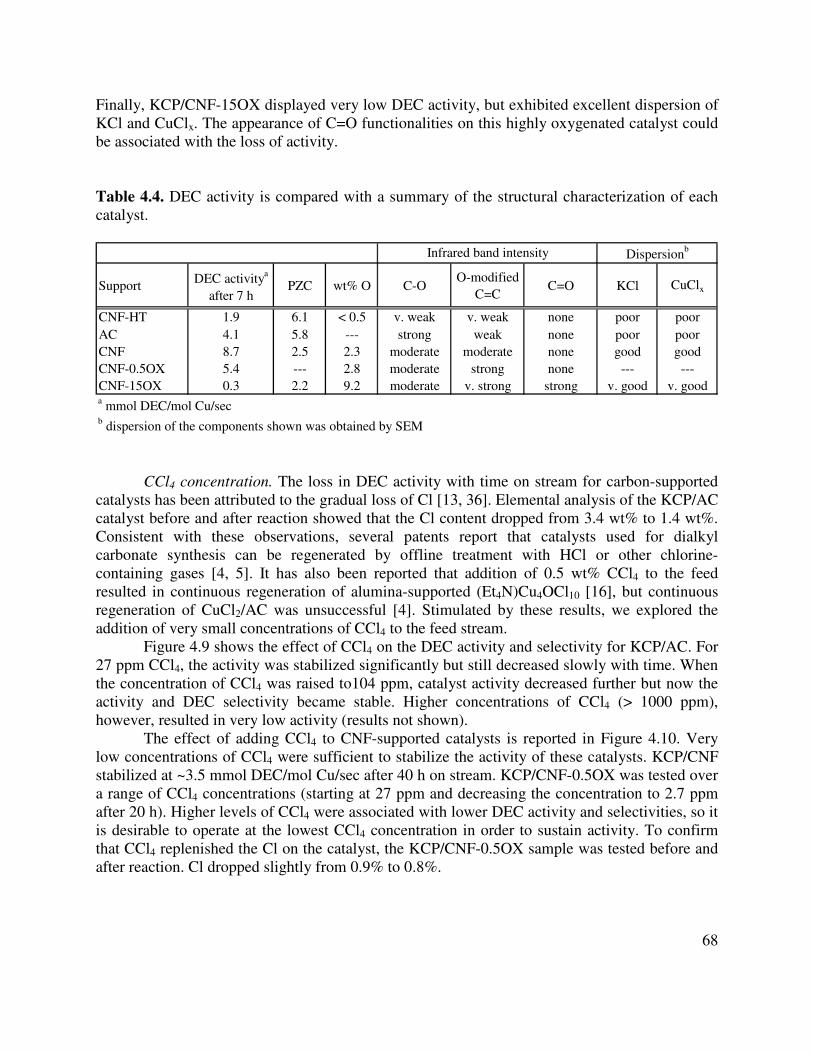
68
Finally, KCP/CNF-15OX displayed very low DEC activity, but exhibited excellent dispersion of KCl and CuClx. The appearance of C=O functionalities on this highly oxygenated catalyst could be associated with the loss of activity. Table 4.4. DEC activity is compared with a summary of the structural characterization of each catalyst.
Support DEC activitya
after 7 hPZC wt% O C-O
O-modified C=C
C=O KCl CuClx
CNF-HT 1.9 6.1 < 0.5 v. weak v. weak none poor poorAC 4.1 5.8 --- strong weak none poor poorCNF 8.7 2.5 2.3 moderate moderate none good goodCNF-0.5OX 5.4 --- 2.8 moderate strong none --- ---CNF-15OX 0.3 2.2 9.2 moderate v. strong strong v. good v. gooda mmol DEC/mol Cu/secb dispersion of the components shown was obtained by SEM
Infrared band intensity Dispersionb
CCl4 concentration. The loss in DEC activity with time on stream for carbon-supported catalysts has been attributed to the gradual loss of Cl [13, 36]. Elemental analysis of the KCP/AC catalyst before and after reaction showed that the Cl content dropped from 3.4 wt% to 1.4 wt%. Consistent with these observations, several patents report that catalysts used for dialkyl carbonate synthesis can be regenerated by offline treatment with HCl or other chlorine-containing gases [4, 5]. It has also been reported that addition of 0.5 wt% CCl4 to the feed resulted in continuous regeneration of alumina-supported (Et4N)Cu4OCl10 [16], but continuous regeneration of CuCl2/AC was unsuccessful [4]. Stimulated by these results, we explored the addition of very small concentrations of CCl4 to the feed stream.
Figure 4.9 shows the effect of CCl4 on the DEC activity and selectivity for KCP/AC. For 27 ppm CCl4, the activity was stabilized significantly but still decreased slowly with time. When the concentration of CCl4 was raised to104 ppm, catalyst activity decreased further but now the activity and DEC selectivity became stable. Higher concentrations of CCl4 (> 1000 ppm), however, resulted in very low activity (results not shown).
The effect of adding CCl4 to CNF-supported catalysts is reported in Figure 4.10. Very low concentrations of CCl4 were sufficient to stabilize the activity of these catalysts. KCP/CNF stabilized at ~3.5 mmol DEC/mol Cu/sec after 40 h on stream. KCP/CNF-0.5OX was tested over a range of CCl4 concentrations (starting at 27 ppm and decreasing the concentration to 2.7 ppm after 20 h). Higher levels of CCl4 were associated with lower DEC activity and selectivities, so it is desirable to operate at the lowest CCl4 concentration in order to sustain activity. To confirm that CCl4 replenished the Cl on the catalyst, the KCP/CNF-0.5OX sample was tested before and after reaction. Cl dropped slightly from 0.9% to 0.8%.
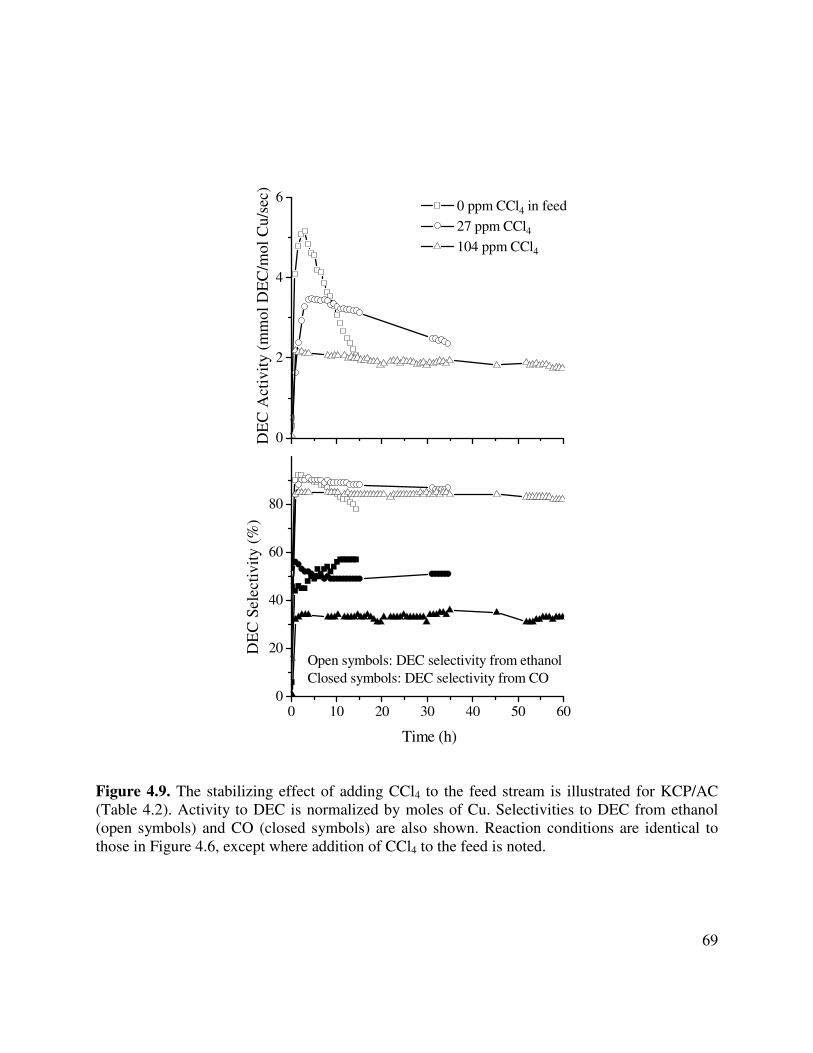
69
0
2
4
6
0 ppm CCl4 in feed 27 ppm CCl4 104 ppm CCl4
DE
C A
ctiv
ity (
mm
ol D
EC
/mol
Cu/
sec)
0 10 20 30 40 50 600
20
40
60
80
Time (h)
Open symbols: DEC selectivity from ethanolClosed symbols: DEC selectivity from CO
DE
C S
elec
tivity
(%
)
Figure 4.9. The stabilizing effect of adding CCl4 to the feed stream is illustrated for KCP/AC (Table 4.2). Activity to DEC is normalized by moles of Cu. Selectivities to DEC from ethanol (open symbols) and CO (closed symbols) are also shown. Reaction conditions are identical to those in Figure 4.6, except where addition of CCl4 to the feed is noted.
70
0
5
10
2.7 ppm CCl4
KCP/CNF, 2.7 ppm CCl4 KCP/CNF-0.5OX, 27-2.7 ppm CCl4
DE
C A
ctiv
ity (
mm
ol D
EC
/mol
Cu/
sec)
27 ppm CCl4
0 10 20 30 40 50 600
20
40
60
80
Time (h)
Open symbols: DEC selectivity from ethanolClosed symbols: DEC selectivity from CO
DE
C S
elec
tivity
(%
)
Figure 4.10. The stabilizing effect of adding CCl4 to the feed stream is illustrated for the catalysts KCP/CNF and KCP/CNF-0.5OX (Table 4.2). Activity to DEC is normalized by moles of Cu. Selectivities to DEC from ethanol (open symbols) and CO (closed symbols) are also shown. Reaction conditions are identical to those in Figure 4.6, except the addition of CCl4 to the feed. KCP/CNF was tested with 2.7 ppm CCl4, and the last point at 56 h was taken at slightly elevated pressure, 3.3 bar. KCP/CNF-0.5OX was tested over a range of CCl4 concentration, starting at 27 ppm and decreasing to 2.7 ppm CCl4 after 20 h.

71
Analysis of CO2 activity. The selectivity to DEC from CO is limited by significant CO2 formation. The previously mentioned correlation between DEC and CO2 activity suggests that CO2 activity originates from a process related to DEC synthesis. This could be explained by a series pathway involving decomposition from DEC to CO2, or by a parallel pathway that competes with DEC for the same active sites. An attempt to diagnose the source of CO2 activity was carried out by varying the reaction conditions for the KCP/AC catalyst. Because H2O is produced as a byproduct of DEC synthesis (Equation 2) and is known to participate in the oxidation of CO [37], the effect of introducing additional H2O to the feed gases was examined.
CCl4 was added to the reactants in order to stabilize the catalyst and allow comparison of activities measured at different times. Table 4.5 shows the results of this investigation. Under regular DEC synthesis conditions (entry 1), the CO2 activity was 7.8 mmol CO2/mol Cu/s. The addition of 0.7 mol% H2O to the feed (entry 2) led to a 58% increase in CO2 activity, confirming that H2O plays a role in catalyzing CO2 synthesis. Entry 3 shows that when CO and O2 were passed over the catalyst, the rate of CO2 formation decreased gradually over a 10-h period until only a trace of activity remained. Finally, the addition of 0.7 mol% H2O (an amount similar to that produced during DEC synthesis) to the CO/O2 feed (entry 4) resulted in restoration of the CO2 activity to levels similar to those observed during DEC synthesis (entry 1). Table 4.5. Effect of CO, O2, and H2O on steady state CO2 activity for the KCP/AC catalyst. In addition to the gases listed in the table, 104 ppm CCl4 was flowed continuously during this experiment to maintain catalyst activity. DEC synthesis produces H2O as a byproduct (Equation 2); the reactant concentrations for yH2O and the other gases are initial quantities as the gases enter the catalyst bed.
yO2 yH2O yCO yEtOH
1 CO/EtOH/O2 7.8 0.053 0 0.42 0.13
2 CO/EtOH/O2/H2O 12.3 0.053 0.007 0.42 0.10
3 CO/O2 0.5 0.053 0 0.42 0
4 CO/O2/H2O 8.4 0.053 0.007 0.42 0
Reactant concentrations (feed values)CO2 activity(mmol CO2/mol Cu/sec)
ReactantsCondition
4.4. Discussion
The results presented in the preceding section demonstrate that the catalysts used in this study are complex and that their activity and selectivity for DEC synthesis are strongly dependent on the structure and pretreatment of the support and on the dispersion of the two principal components from which the catalytically active species are formed, CuCl2 and PdCl2. To develop an understanding of the composition and structure of the active species involved in
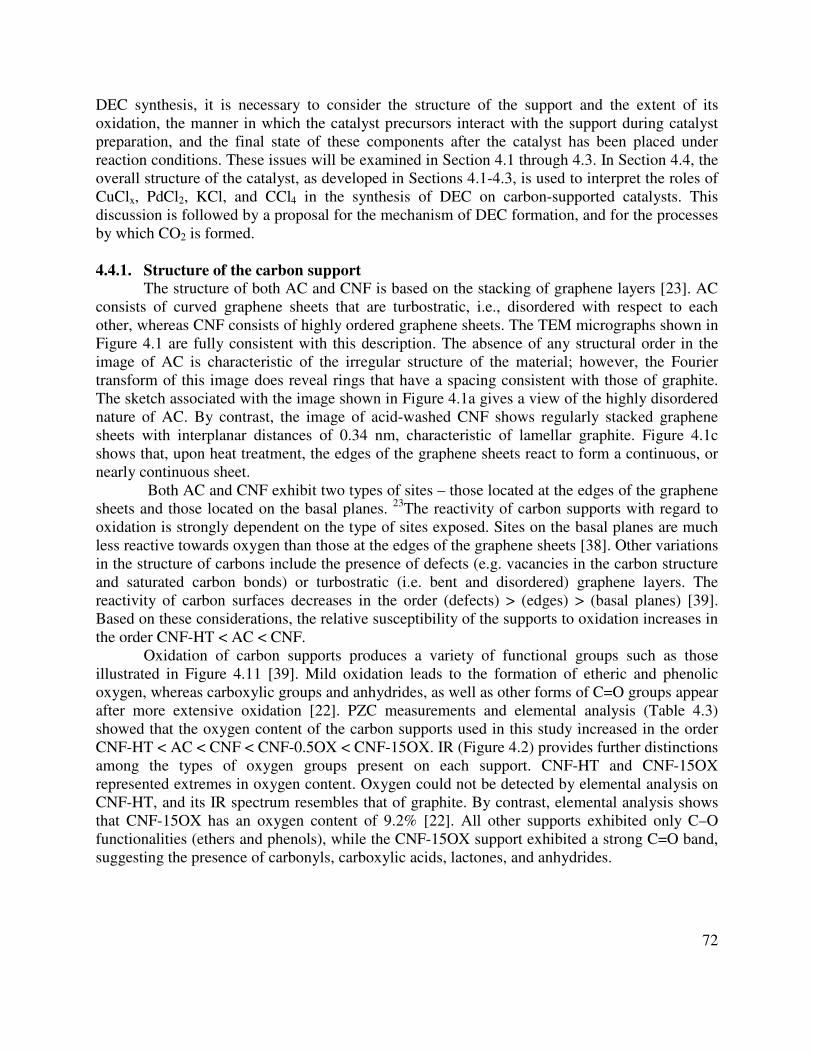
72
DEC synthesis, it is necessary to consider the structure of the support and the extent of its oxidation, the manner in which the catalyst precursors interact with the support during catalyst preparation, and the final state of these components after the catalyst has been placed under reaction conditions. These issues will be examined in Section 4.1 through 4.3. In Section 4.4, the overall structure of the catalyst, as developed in Sections 4.1-4.3, is used to interpret the roles of CuClx, PdCl2, KCl, and CCl4 in the synthesis of DEC on carbon-supported catalysts. This discussion is followed by a proposal for the mechanism of DEC formation, and for the processes by which CO2 is formed.
4.4.1. Structure of the carbon support
The structure of both AC and CNF is based on the stacking of graphene layers [23]. AC consists of curved graphene sheets that are turbostratic, i.e., disordered with respect to each other, whereas CNF consists of highly ordered graphene sheets. The TEM micrographs shown in Figure 4.1 are fully consistent with this description. The absence of any structural order in the image of AC is characteristic of the irregular structure of the material; however, the Fourier transform of this image does reveal rings that have a spacing consistent with those of graphite. The sketch associated with the image shown in Figure 4.1a gives a view of the highly disordered nature of AC. By contrast, the image of acid-washed CNF shows regularly stacked graphene sheets with interplanar distances of 0.34 nm, characteristic of lamellar graphite. Figure 4.1c shows that, upon heat treatment, the edges of the graphene sheets react to form a continuous, or nearly continuous sheet.
Both AC and CNF exhibit two types of sites – those located at the edges of the graphene sheets and those located on the basal planes. 23The reactivity of carbon supports with regard to oxidation is strongly dependent on the type of sites exposed. Sites on the basal planes are much less reactive towards oxygen than those at the edges of the graphene sheets [38]. Other variations in the structure of carbons include the presence of defects (e.g. vacancies in the carbon structure and saturated carbon bonds) or turbostratic (i.e. bent and disordered) graphene layers. The reactivity of carbon surfaces decreases in the order (defects) > (edges) > (basal planes) [39]. Based on these considerations, the relative susceptibility of the supports to oxidation increases in the order CNF-HT < AC < CNF.
Oxidation of carbon supports produces a variety of functional groups such as those illustrated in Figure 4.11 [39]. Mild oxidation leads to the formation of etheric and phenolic oxygen, whereas carboxylic groups and anhydrides, as well as other forms of C=O groups appear after more extensive oxidation [22]. PZC measurements and elemental analysis (Table 4.3) showed that the oxygen content of the carbon supports used in this study increased in the order CNF-HT < AC < CNF < CNF-0.5OX < CNF-15OX. IR (Figure 4.2) provides further distinctions among the types of oxygen groups present on each support. CNF-HT and CNF-15OX represented extremes in oxygen content. Oxygen could not be detected by elemental analysis on CNF-HT, and its IR spectrum resembles that of graphite. By contrast, elemental analysis shows that CNF-15OX has an oxygen content of 9.2% [22]. All other supports exhibited only C–O functionalities (ethers and phenols), while the CNF-15OX support exhibited a strong C=O band, suggesting the presence of carbonyls, carboxylic acids, lactones, and anhydrides.
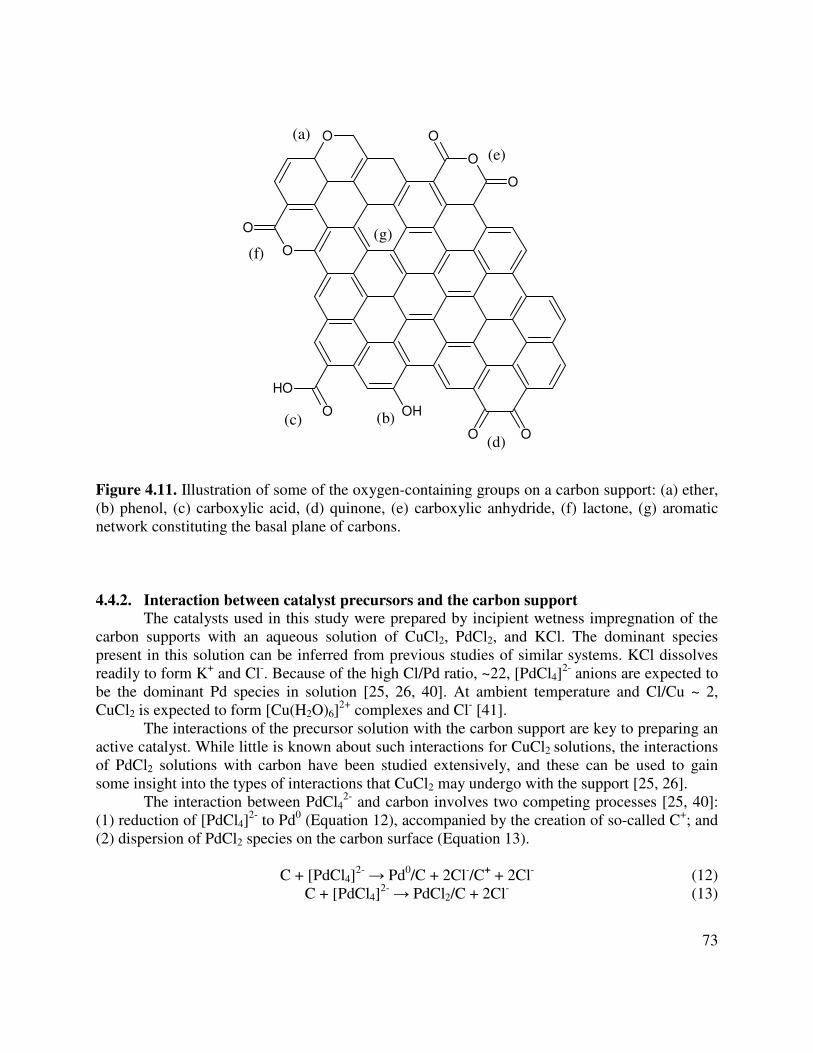
73
O
O
O
O
O
O
OH
OH
O O
O
(f)
(c) (b)
(d)
(e)
(g)
(a)
Figure 4.11. Illustration of some of the oxygen-containing groups on a carbon support: (a) ether, (b) phenol, (c) carboxylic acid, (d) quinone, (e) carboxylic anhydride, (f) lactone, (g) aromatic network constituting the basal plane of carbons.
4.4.2. Interaction between catalyst precursors and the carbon support The catalysts used in this study were prepared by incipient wetness impregnation of the
carbon supports with an aqueous solution of CuCl2, PdCl2, and KCl. The dominant species present in this solution can be inferred from previous studies of similar systems. KCl dissolves readily to form K+ and Cl-. Because of the high Cl/Pd ratio, ~22, [PdCl4]
2- anions are expected to be the dominant Pd species in solution [25, 26, 40]. At ambient temperature and Cl/Cu ~ 2, CuCl2 is expected to form [Cu(H2O)6]
2+ complexes and Cl- [41]. The interactions of the precursor solution with the carbon support are key to preparing an
active catalyst. While little is known about such interactions for CuCl2 solutions, the interactions of PdCl2 solutions with carbon have been studied extensively, and these can be used to gain some insight into the types of interactions that CuCl2 may undergo with the support [25, 26].
The interaction between PdCl42- and carbon involves two competing processes [25, 40]:
(1) reduction of [PdCl4]2- to Pd0 (Equation 12), accompanied by the creation of so-called C+; and
(2) dispersion of PdCl2 species on the carbon surface (Equation 13). C + [PdCl4]
2- → Pd0/C + 2Cl-/C+ + 2Cl- (12) C + [PdCl4]
2- → PdCl2/C + 2Cl- (13)
74
The reducing power of carbonaceous materials is well known, and has been attributed to electrons derived from carbon oxidation (Equation 14) that then move to the surface of the support where they can reduce adsorbed species (Equation 15) [40].
C + H2O → CO + 2H+ + 2e- (14) [PdCl4]
2- + 2e- → Pd + 4Cl- (15) The formation of metallic Pd is minimized, though, when PdCl2 is introduced by
incipient wetness in the presence of excess chloride anions onto partially oxidized carbon, the conditions used in the present study [25]. Thus, consistent with the observation of our previous work2 and those of the present investigation, only PdCl2 is present on the catalyst surface after incipient wetness impregnation. The dispersion of PdCl2, though, is highly dependent on the structure and pretreatment of the surface. On AC, drying produces ~30 nm PdCl2 crystallites [13], whereas on all acid-treated CNF, PdCl2 is atomically dispersed.
Interactions between [Cu(H2O)6]2+ and the support are presumed to follow similar
pathways to PdCl2. [Cu(H2O)6]2+ complexes can react with Cl- to form [CuCl2]
- in the presence of a reductant [42], in this case using electrons from the carbon support (Equation 16). The conditions for PdCl2 dispersion should also favor the dispersion of [CuCl2]
- complexes. [Cu(H2O)6]
2+ + 2Cl- + e- → [CuCl2]- + 6H2O (16)
As in the case of PdCl2, the dispersion of the Cu is highly dependent on the structure and
pretreatment of the support. Upon drying, crystallites of CuCl2 were observed on AC, but on acid-treated CNF, the Cu species are atomically dispersed.
During incipient wetness impregnation, the precursor solution infiltrates the pores of the support and the aqueous solvent evaporates almost immediately. Assuming that K+, Cl-, [CuCl2]
- and [PdCl4]
2- are the dominant species after interaction with the carbon support, the removal of solvent likely leads to the formation of KCl, [CuCl2]
-/C+, PdCl2, and [PdCl4]2-/2C+. Some Cl-
may also be adsorbed to the surface of the carbon [25]. A wide variety of chlorocuprates(I) could be formed as the solvent evaporated from the support [43]. Finally, potassium chlorocuprates such as K2CuCl3 may also form (Equation 17) [44].
2K+ + [CuCl2]
- + Cl- → K2CuCl3 (17) The dispersion of the impregnated species is correlated strongly with the oxygen content
of the support. SEM images (Figures 4.3 and 4.4) showed progressively higher dispersion of K, Cu, and Cl in the order CNF-HT ~ AC << CNF < CNF-15OX. The literature on carbon supports has shown that support oxidation can affect the dispersion of salts in several ways [22]: (1) by increasing the hydrophilicity of the nominally hydrophobic carbon support, thereby facilitating passage of precursor ions throughout the porosity of the support; (2) by altering the electronic properties of the carbon, thereby changing the catalyst-support interaction; and (3) by attracting and anchoring catalyst precursors to the support. All three of these effects are likely to contribute to the high dispersion observed on the oxygen-containing catalysts in this study. The relatively hydrophobic nature of CNF-HT and AC supports very likely hindered full penetration of the aqueous preparation solution into the micropores of the support, resulting in the formation of
75
larger KCl and CuCl2 clusters seen in the SEM images. Several investigators have noted that oxidation of the carbon supports creates acidic centers that favor high dispersion of PdCl2, and CuCl2 by analogy [22, 25, 26, 45-48]. Hence, oxidation of the support makes it more wettable by the precursor solution and enhances interactions of the precursor species with the support.
4.4.3. Structure of the active species and their interactions with the support
It is evident from Figure 4.7 that both CuCl2 and PdCl2 are necessary to achieve high DEC activity and selectivity. While CuCl2 can catalyze the reaction, it is less active than when present with PdCl2 and the selectivity to DEC is lower. The level of Cl in the catalyst must be maintained, since Cl loss leads to a progressive decrease in DEC synthesis activity, a trend that can be offset by continuous addition of CCl4 to the feed (see Figures 4.9 and 4.10). These observations lead to the hypothesis that the catalytically active species involved in DEC formation contain Cu, Pd and Cl, in full agreement with the conclusions of previous authors [13, 49, 50].
Small CuClx clusters have a structure similar to that bulk CuCl2 [51], in which linear chains of Cu are bridged by Cl, and are shown to be active for oxidation and oxidative carbonylation [16, 52-55]. Bulk PdCl2 has a structure similar to CuCl2 [56], and it has been shown that Pd2+ cations can substitute into CuCl2 clusters to form Cu-Cl-Pd bridging structures [57, 58]. Based on these consideration, we propose that high DEC activity of carbon supported catalysts is due to the formation of such Cu-Cl-Pd complexes. As noted in the Introduction, we have reported previously evidence for [CuCl2]
- and PdCl2 for KCP/AC and have suggested that a [CuCl2]
-Pd2+[CuCl2]- species is responsible for DEC formation [13]. As shown in Figure 4.12,
such complexes could be stabilized at the edges of graphene sheets by dative bonding to oxygen-containing species. Since the ratio of Cu/Pd is 20, a significant fraction of the Cu in the catalyst likely exists as M+[CuCl2]
- or CunCln species, where M+ could be K+ or C+ (deficiencies in carbon electronic structure, see Section 4.2). We have shown that KCl extends the lifetime of the catalyst and contributes to the high Cl/Pd ratio during preparation (see Section 4.2), which inhibits the formation of Pd0. As discussed above, K+ may also form potassium chlorocuprate compounds that stabilize active Cu species. Some of the proposed active complexes are illustrated in Figure 4.12.
To summarize, carbon supports for DEC synthesis must contain an intermediate level of oxygen coverage in the form of phenols and ethers. These oxygen functionalities enhance wetting of the surface during catalyst preparation and promote the adsorption of PdCl2 and CuClx species on the support. The catalytically active species are thought to consist of complexes with Cl bridging Cu and Pd atoms formed by the reaction of Pd2+ cations with [CuCl2]
- anions.

76
Figure 4.12. Proposed bonding of [CuCl2]
-Pd2+[CuCl2]- and [CuCl2]
- to the support, via oxygen attached to the support surface. C+ represents electron deficiencies in the graphene network, as discussed above. Dashed lines indicate dative bonding interactions with the support. 4.4.4. Proposed reaction mechanism
Role of CuCl2. Figure 4.7 shows that DEC can be formed when CuCl2 is supported in the absence of PdCl2. A mechanism for the oxidative carbonylation of alcohols to form dialkyl carbonates using a CuCl2 slurry has been proposed [59], and a number of authors have suggested that a similar mechanism is operative for carbon-supported CuCl2 catalysts [13, 17, 20, 36, 60-62]. An important feature of this mechanism is the reduction of Cu2+ to Cu+ species. The presence of CuCl is thought to be essential for the activation of ethanol in the first step of the reaction sequence. As shown in Equation 18, 13cuprous chloride is re-oxidized upon reaction with ethanol and molecular oxygen to form an ethoxide species and releases water.44 While Cu(I) species can perform this chemistry readily, it does not occur for Cu(II) species in homogeneous solution [17, 53]. The insertion of CO to form carboethoxide species may occur directly from the gas phase [17, 61] (Equation 19) or by adsorption (Equation 20) and transfer (Equation 21) from an adjacent Cu species in accordance with the homogeneous mechanism [59, 62]. Finally, the carboethoxide species react with ethoxide species to produce DEC and the two catalytic sites are regenerated (Equation 22).
2CuCl + 2EtOH + ½ O2 → 2Cu(OEt)Cl + H2O (18) Cu(OEt)Cl + CO → Cu(COOEt)Cl (19) CuCl + CO → Cu(CO)Cl (20) Cu(OEt)Cl + Cu(CO)Cl → Cu(COOEt)Cl + CuCl (21)
Cu Pd Cl
C+
O
Cu Pd Cl
C+
O
77
Cu(COOEt)Cl + Cu(OEt)Cl → 2CuCl + (OEt)2CO (22) Role of PdCl2. PdCl2 does not catalyze DEC synthesis independently of CuCl2 (See
Figure 4.7 and Ref. 13). However, it is known that PdCl2 will promote the oxidative carbonylation of alcohols in the presence of a co-oxidant such as LiCl, CuCl2, FeCl3, I
- [49, 63-65]. The latter species are required to form ethoxide species via a process analogous to Equation 18. Therefore, it is thought that the role of PdCl2 must be to accelerate the formation of carboethoxide species. This idea is supported by the observation that PdCl2 will form carboethoxides (in the presence of a base to form the ethoxides) [64]. The overall process is summarized in Equation 23, where B = base (such as those listed above), and R = alkyl.
PdCl(CO)ORBCOPdCl X,BHROH,2 →++
−+ −− (23)
Following this logic, we propose that the combination of PdCl2 and CuCl facilitates the formation of carboethoxide species and the subsequent formation of DEC.
Equations 24-28 demonstrate how Pd and Cu may be involved in the formation of DEC. Since Pd and Cu are bridged through Cl throughout, coordinated species can be shared easily, and the charge distribution on the overall complex can adjust according to the requirements of each step. Cu forms the ethoxide (Equation 24), Pd adsorbs CO (Equation 25), and then an ethoxide migrates to the CO coordinated to the Pd2+ cation to form the carboethoxide species (Equation 26). This step, which is thought to be rate-limiting, should proceed more readily on Pd2+ than Cu+, since the carbonyl group associated with Pd2+ should be a stronger electrophile. The carboethoxide species then reacts with ethoxide species to form DEC and the original Cl coordination of the precursors is restored (Equations 27 and 28). The observation that a large excess of CuCl2 to PdCl2 optimizes the activity suggests that Equations 26 and 27 occur slowly relative to other parts of the mechanism, establishing a need for excess ethoxide.
2CuCl + 2EtOH + ½ O2 → 2Cu(OEt)Cl + H2O (24) PdCl2 + CO → Pd(CO)Cl2 (25) Cu(OEt)Cl + Pd(CO)Cl2 → Pd(COOEt)Cl + CuCl2 (26) Pd(COOEt)Cl + Cu(OEt)Cl → Pd(OEt)(COOEt) + CuCl2 (27) Pd(OEt)(COOEt) + 2CuCl2 → PdCl2 + 2CuCl + (OEt)2CO (28) Role of Cl and catalyst stability. Cl must be retained on KCP/carbon catalysts to maintain
their activity. A similar observation has been made for oxidative carbonylation of alcohols carried out in CuCl2 suspensions [59]. The loss of chlorine from heterogeneous catalysts can be explained by the slow formation of ethyl chloride (Equation 29) and paratacamite, Cu2Cl(OH)3, both of which have been observed in studies of gas-phase synthesis of DEC [13, 36].
2CuCl + ½ O2 + H2O + C2H5OH → Cu2Cl(OH)3 + C2H5Cl (29) Catalyst activity and selectivity to DEC can be maintained by the addition of ppm levels
of CCl4 to the feed; however, high feed concentrations of CCl4 reduce catalytic activity. CCl4 is needed to restore Cl-depleted species, whereas excess CCl4 may lead to the conversion of CuCl to catalytically inactive CuCl2.

78
Formation of CO2. Several processes can be envisioned by which CO2 can be formed.
The first is the oxidation of CO. As shown in Table 4.5, this reaction can be ruled out, since the concentration of CO2 observed for this reaction is an order of magnitude lower than that observed during DEC synthesis. The oxidation of ethanol was investigated, but this reaction was also found to be slow [13]. The decomposition of DEC via the reaction
(CH3O)2CO + H2O → 2 C2H5OH + CO2 (30) is thermodynamically favorable but is too slow to be the major source of CO2, as indicated by a study of DEC decomposition on Cu+-zeolites [60]. The results presented in Table 4.5 suggest that CO2 is formed by the reaction of CO with the H2O produced as a coproduct of DEC synthesis via the water-gas-shift reaction. The H2 produced by this reaction is then combusted, so that the net reaction, as shown by Equations 31 and 32, is the oxidation of CO to CO2.
CO + H2O → CO2 + H2 (31) H2 + 0.5 O2 → H2O (32)
4.5. Conclusions
This study has shown that the activity and selectivity of carbon-supported chlorides of Cu and Pd are strongly dependent on the structure and pretreatment of the support. Highest DEC activity was achieved with acid-pretreated CNF, whereas the lowest activity was found for catalysts supported on AC and heat-treated CNF. Catalyst activity is enhanced by a high proportion of edge versus basal sites on the graphene sheets comprising the support and a modest degree of edge-site oxidation. Maintenance of catalyst activity was achieved by continuous addition of low concentrations of CCl4 (ppm level) to the feed. Characterization of the catalysts by SEM and TEM revealed that the Cu and Pd are atomically dispersed. Based on the results of this investigation and earlier work, it is proposed that the active sites for DEC synthesis consist of Pd[CuCl2]2 species stabilized by dative bonding with oxygen-containing species present at the edges of graphene sheets comprising the support. A mechanism for the formation of DEC is proposed, in which CuCl species adsorb ethanol dissociatively to form ethoxide species, and Pd2+ cations adsorb CO. Migration of ethoxide species to the adsorbed CO results in the formation of carboethoxide species, which then react with an additional ethoxide species to form DEC. While DEC can be formed in the absence of Pd2+, CO adsorbed on Pd2+ is more electrophilic than CO adsorbed on Cu+, and, hence, more reactive towards the addition of ethoxide species, the process that is thought to be rate limiting.
79
4.6. References 1. M. A. Pacheco, C. L. Marshall, Energy Fuels 11 (1997) 2-29. 2. A.-A. G. Shaikh, S. Sivaram, Chem. Rev. 96 (1996) 951-976. 3. U. Romano, R. Tesei, G. Cipriani, L. Micucci, U.S. Patent 4,218,391 (1980). 4. G. L. Curnutt, U.S. Patent 5,004,827 (1991). 5. T. Koyama, M. Tonosaki, N. Yamada, K. Mori, U.S. Patent 5,650,369 (1997). 6. Y. J. Wang, Y. Q. Zhao, B. G. Yuan, B. C. Zhang, J. S. Cong, Appl. Catal. A 171 (1998)
255-260. 7. B. C. Dunn, C. Guenneau, S. A. Hilton, J. Pahnke, E. M. Eyring, Energy Fuels 16 (2002)
177-181. 8. A. Punnoose, M. S. Seehra, B. C. Dunn, E. M. Eyring, Energy Fuels 16 (2002) 182-188. 9. R. X. Jiang, Y. J. Wang, X. Q. Zhao, S. F. Wang, C. Q. Jin, C. F. Zhang, J. Mol. Catal. A:
Chem. 185 (2002) 159-166. 10. P. Yang, Y. Cao, W.-L. Dai, J.-F. Deng, K.-N. Fan, Appl. Catal. A 243 (2003) 323-331. 11. H. Itoh, Y. Watanabe, K. Mori, H. Umino, Green Chem. 5 (2003) 558-562. 12. Z. Zhang, X. B. Ma, J. Zhang, F. He, S. P. Wang, J. Mol. Catal. A: Chem. 227 (2005)
141-146. 13. D. N. Briggs, K. H. Lawrence, A. T. Bell, Appl. Catal. A 366 (2009) 71-83. 14. I. J. Drake, K. L. Fujdala, A. T. Bell, T. D. Tilley, J. Catal. 230 (2005) 14-27. 15. P. B. Zhang, Z. Zhang, S. P. Wang, X. B. Ma, Catal. Comm. 8 (2007) 21-26. 16. D. C. Molzahn, M. E. Jones, G. E. Hartwell, J. Puga, U.S. Patent 5,387,708 (1995). 17. S. T. King, J. Catal. 161 (1996) 530-538. 18. S. A. Anderson, T. W. Root, J. Catal. 217 (2003) 396-405. 19. I. J. Drake, Y. H. Zhang, D. Briggs, B. Lim, T. Chau, A. T. Bell, J. Phys. Chem. B 110
(2006) 11654-11664. 20. Y. Zhang, D. N. Briggs, E. de Smit, A. T. Bell, J. Catal. 251 (2007) 443-452. 21. P. Serp, Figueiredo, J. L., Carbon Materials for Catalysis, John Wiley & Sons, Inc.,
Hoboken, 2009. 22. M. L. Toebes, E. M. P. van Heeswijk, J. H. Bitter, A. J. van Dillen, K. P. de Jong, Carbon
42 (2004) 307-315. 23. K. P. De Jong, J. W. Geus, Catal. Rev. 42 (2000) 481-510. 24. P. Serp, M. Corrias, P. Kalck, Appl. Catal. A-Gen. 253 (2003) 337-358. 25. P. Simonov, S. Troitskii, V. Likholobov, Kinet. Catal. 41 (2000) 255-269. 26. M. L. Toebes, J. A. van Dillen, K. P. de Jong, J. Mol. Catal. A: Chem. 173 (2001) 75-98. 27. H. Wang, R. T. K. Baker, U.S. Patent 6,995,115 (2006). 28. H. Wang, R. T. K. Baker, U.S. Patent 7,001,586 (2006). 29. T. G. Ros, D. E. Keller, A. J. van Dillen, J. W. Geus, D. C. Koningsberger, J. Catal. 211
(2002) 85-102. 30. J. S. Noh, J. A. Schwarz, J. Colloid Interface Sci. 130 (1989) 157-164. 31. L.-W. Yin, M.-S. Li, D.-S. Sun, J.-J. Cui, Mater. Lett. 48 (2001) 21-25. 32. M. Starsinic, R. L. Taylor, P. L. Walker Jr, P. C. Painter, Carbon 21 (1983) 69-74. 33. P. E. Fanning, M. A. Vannice, Carbon 31 (1993) 721-730. 34. D. Alloyeau, B. Freitag, S. Dag, L. W. Wang, C. Kisielowski, Phys. Rev. B 80 (2009).
80
35. C. Kisielowski, B. Freitag, M. Bischoff, H. van Lin, S. Lazar, G. Knippels, P. Tiemeijer, M. van der Stam, S. von Harrach, M. Stekelenburg, M. Haider, S. Uhlemann, H. Muller, P. Hartel, B. Kabius, D. Miller, I. Petrov, E. A. Olson, T. Donchev, E. A. Kenik, A. R. Lupini, J. Bentley, S. J. Pennycook, I. M. Anderson, A. M. Minor, A. K. Schmid, T. Duden, V. Radmilovic, Q. M. Ramasse, M. Watanabe, R. Erni, E. A. Stach, P. Denes, U. Dahmen, Microsc. Microanal. 14 (2008) 469-477.
36. G. L. Curnutt, Harley, Dale A., Copper catalyzed oxidative carbonylation of methanol to dimethyl carbonate. In Oxygen Complexes and Oxygen Activation by Transition Metals, A. E. Martell, Sawyer, D.T., Ed. Plenum Press: New York, 1988; pp 215-232.
37. J. J. Byerley, E. Peters, Can. J. Chem. 47 (1969) 313-321. 38. L. R. Radovic, J. Am. Chem. Soc. 131 (2009) 17166-17175. 39. T. J. Bandosz, Surface Chemistry of Carbon Materials. In Carbon Materials for
Catalysis, P. Serp, J. L. Figueiredo, Eds. John Wiley & Sons, Inc.: Hoboken, New Jersey, 2009; pp 45-92.
40. P. A. Simonov, A. V. Romanenko, I. P. Prosvirin, E. M. Moroz, A. I. Boronin, A. L. Chuvilin, V. A. Likholobov, Carbon 35 (1997) 73-82.
41. J. L. Fulton, M. M. Hoffmann, J. G. Darab, Chem. Phys. Lett. 330 (2000) 300-308. 42. J. L. Fulton, M. M. Hoffmann, J. G. Darab, B. J. Palmer, E. A. Stern, J. Phys. Chem. A
104 (2000) 11651-11663. 43. I. Persson, M. Sandstrom, A. T. Steel, M. J. Zapatero, R. Akesson, Inorg. Chem. 30
(1991) 4075-4081. 44. D. E. Etter, C. J. Wiedenheft, Sol. Energy Mater. 2 (1980) 423-431. 45. K. L. Klein, A. V. Melechko, T. E. McKnight, S. T. Retterer, P. D. Rack, J. D. Fowlkes,
D. C. Joy, M. L. Simpson, J. Appl. Phys. 103 (2008). 46. T. G. Ros, A. J. van Dillen, J. W. Geus, D. C. Koningsberger, ChemPhysChem 3 (2002)
209-214. 47. G. Zhang, S. Sun, D. Yang, J.-P. Dodelet, E. Sacher, Carbon 46 (2008) 196-205. 48. S. Hermans, C. Diverchy, O. Demoulin, V. Dubois, E. M. Gaigneaux, M. Devillers, J.
Catal. 243 (2006) 239-251. 49. D. M. Fenton, Steinwan.Pj, J. Org. Chem. 39 (1974) 701-704. 50. P. Giannoccaro, N. Ravasio, M. Aresta, J. Organomet. Chem. 451 (1993) 243-248. 51. A. F. Wells, J. Chem. Soc. (1947) 1670-1675. 52. R. D. Willett, G. L. Breneman, Inorg. Chem. 22 (1983) 326-329. 53. H. Finkbeiner, A. S. Hay, H. S. Blanchard, G. F. Endres, J. Org. Chem. 31 (1966) 549-
555. 54. B. T. Kilbourn, J. D. Dunitz, Inorg. Chim. Acta 1 (1967) 209-216. 55. J. A. Bertrand, J. A. Kelley, Inorg. Chem. 8 (1969) 1982-1985. 56. A. F. Wells, Z. Kristallogr. 100 (1938) 189-194. 57. T. Hosokawa, M. Takano, S. I. Murahashi, J. Am. Chem. Soc. 118 (1996) 3990-3991. 58. J. T. York, A. Llobet, C. J. Cramer, W. B. Tolman, J. Am. Chem. Soc. 129 (2007) 7990-
7999. 59. U. Romano, R. Tesei, M. M. Mauri, P. Rebora, Ind. Eng. Chem. Prod. Res. Dev. 19
(1980) 396-403. 60. S. A. Anderson, S. Manthata, T. W. Root, Appl. Catal. A 280 (2005) 117-124. 61. Y. Zhang, A. T. Bell, J. Catal. 255 (2008) 153-161.
81
62. P. Koch, G. Cipriani, E. Perrotti, Gazz. Chim. Ital. 104 (1974) 599-605. 63. M. Graziani, Uguaglia.P, G. Carturan, J. Organomet. Chem. 27 (1971) 275-&. 64. F. Ragaini, Dalton Trans. (2009) 6251-6266. 65. C. Amatore, S. Bensalem, S. Ghalem, A. Jutand, D. Fenech, A. Galia, G. Silvestri, C. R.
Chim. 7 (2004) 737-746. 66. H. F. Stoeckli, Carbon 28 (1990) 1.