structure and function of chihuahuan desert … the long-term function and survival of aridland...
TRANSCRIPT

Structure and Function of Chihuahuan Desert Ecosystem The Jornada Basin Long-Term Ecological Research Site
Edited by: Kris Havstad, Laura F. Huenneke, William H. Schlesinger Chapter 16 Reynolds, J.F., Kemp, P.R., Ogle, K., Fernandez, R.J., Gao, Q., Wu, J.
2006
Submitted to Oxford University Press for publication ISBN 13 978-0-19-511776-9

Structure and Function of Chihuahuan Desert Ecosystem The Jornada Basin Long-Term Ecological Research Site
Edited by: Kris Havstad, Laura F. Huenneke, William H. Schlesinger Chapter 16 Reynolds, J.F., Kemp, P.R., Ogle, K., Fernandez, R.J., Gao, Q., Wu, J.
2006
1
16
Modeling the Unique Attributes of Arid Ecosystems: Lessons from
the Jornada Basin
James F. Reynolds, Paul R. Kemp, Kiona Ogle, Roberto J. Fernández, Qiong Gao, and
Jianguo Wu
The Jornada Basin is typical of arid ecosystems of the Southwestern United States and many
other regions of the globe: It is water-limited with low annual net primary production (ANPP)
and low-standing crop (Szarek 1979; Ludwig 1987). Yet paradoxically, arid ecosystems are
structurally and functionally quite complex, exhibiting a remarkable range of species
compositions and system behaviors. This can be attributed in part to the presence of complex
topography and landscape physiography (Mabbutt 1997; see also chapter 2) which, when
combined with extreme variability in precipitation (Cavazos et al. 2002; Weltzin et al. 2003; see
also chapter 3), produces striking spatial and temporal heterogeneity in the availability of
essential limiting resources, such as water and mineral nutrients (MacMahon and Wagner 1985;
see also chapters 5 and 6).
In view of these complexities, one of the long-term objectives of the research in the
Jornada Basin is to develop a synthetic understanding of the mechanisms and processes
governing the complex patterns of aridland structure and functioning. It is clear that
understanding and predicting potential cause–effect relationships will require considerable
insights at multiple spatial and temporal scales (chapter 18). Models are expected to play an

Structure and Function of Chihuahuan Desert Ecosystem The Jornada Basin Long-Term Ecological Research Site
Edited by: Kris Havstad, Laura F. Huenneke, William H. Schlesinger Chapter 16 Reynolds, J.F., Kemp, P.R., Ogle, K., Fernandez, R.J., Gao, Q., Wu, J.
2006
2
important role in this synthesis because most experiments and observations tend to take place at
small spatial (e.g., 1–100 m2) and brief temporal scales (e.g., days, months, one to five years)
(Levin 1992), whereas many ecosystem responses are the result of interacting factors and
feedbacks operating over larger spatial and longer time periods (O’Neill et al. 1989; Levin 1992).
In this chapter, we present a summary of some of the mechanistic models we developed
as part of the Jornada Basin research program. Although our initial goal was largely focused on
the relationship between precipitation and ecosystem functioning in the Jornada Basin, our work
is sufficiently general that it should be applicable to other aridland regions of the world.
Simulation modeling has a key role to play because it is difficult to experimentally examine even
a partial spectrum of ecosystem-level responses that could result from abrupt perturbations, such
as overgrazing and especially longer term external forcings, such as shifts in precipitation.
Models permit us to distill data we have gathered to date, explore the consequences of various
assumptions regarding specific cause–effect relationships, and examine responses of ecosystems
to potential changes in forcing functions.
The majority of our efforts have been devoted to analyses of ecosystem carbon, nutrient,
and water dynamics using the patch arid lands simulator-functional types model (PALS-FT)
(table 16-1). PALS-FT is a physiologically based ecosystem model that simulates one-
dimensional fluxes of carbon (C), water, and nitrogen (N) in a representative patch of desert
vegetation of approximately 1–10 m2 (figure 16-1). For landscape-level phenomena, a spatially
explicit version of PALS-FT (MALS) is used (table 16-1). PALS-FT consists of four principal
modules: (1) soil water distribution and extraction via evaporation and transpiration; (2) soil,
surface, and canopy

Structure and Function of Chihuahuan Desert Ecosystem The Jornada Basin Long-Term Ecological Research Site
Edited by: Kris Havstad, Laura F. Huenneke, William H. Schlesinger Chapter 16 Reynolds, J.F., Kemp, P.R., Ogle, K., Fernandez, R.J., Gao, Q., Wu, J. 2006
3
Table 16-1. Versions of PALS showing specific modules. All patch-level simulations presented in this chapter were conducted using PALS-FT (shaded column).
Patch EcosystemVers. Flowpath
Ecosystem Vers. Key: = implemented; = in progress
PRINCIPAL MODULES
DESCRIPTIONS PALS -SWB
PALS-FT
PALS-CO2 MALS §
KEY REFERENCE(S)
Soil Water Infiltration; flux between soil horizons; soil water potentials, etc
Plant-soil relations: water uptake by roots; plant water potentials; rooting distributions etc.
Moorhead et al. 1989; Kemp et al. 1997; Reynolds et al. 2000; Ogle et al. 2004; Reynolds et al. 2004
Hydrologic surface run-on/run-off: 2-dimensional flow fields between contiguous patches (grid cells)
Gao and Reynolds 2003
Energy Budget
Radiation interception; PET; bulk canopy conductance; etc.
Kemp et al. 1997
Soil Temperature Kemp et al. 1992 Plant
Growth Allocation; respiration; photosynthesis;
growth rates; etc. Reynolds and Cunningham 1981; Reynolds 1986;
Reynolds et al. 1997; Reynolds et al. 1999a; Reynolds et al. 2000; Reynolds et al. 2004; Shen et al. 2004
Seasonal changes in stomatal behavior; photosynthetic temperature acclimation
Ogle and Reynolds 2002
Phenology: seed germination; reproductive/vegetative growth phases; etc.
Bachelet et al. 1988; Kemp and Reynolds 2000
Seed dispersal Gao and Reynolds 2003 CO2 Effects: down-regulation; max
photosynthesis rates; etc. Modules described in Reynolds et al. 1992; Reynolds
et al. 1996a; Chen and Reynolds 1997 Plant FT competition (other than water) Modules described in Brisson and Reynolds 1994;
Brisson and Reynolds 1997 Nutrient Cycling
Decomposition; PALS-CENTURY† (nutrient cycling)
Moorhead and Reynolds 1989a; Kemp et al. 2003
§ Mosaic Arid Land Simulator (includes PALS-FT) † CENTURY model as modified for use as a module in PALS-FT (see Decomposition and Nutrient Cycling)

Structure and Function of Chihuahuan Desert Ecosystem The Jornada Basin Long-Term Ecological Research Site
Edited by: Kris Havstad, Laura F. Huenneke, William H. Schlesinger Chapter 16 Reynolds, J.F., Kemp, P.R., Ogle, K., Fernandez, R.J., Gao, Q., Wu, J.
2006
4
energy budgets; (3) plant growth, including phenological and physiological responses of key
principal plant functional types; and, (4) nutrient cycling, including soil organic matter,
decomposition, availability of inorganic N. We examine the progress that has been made with
respect to the potentials of these models to strengthen understanding of various phenomena—
from physiological responses of plants to highly variable pulses of water and nutrients, to long-
term processes, such as nutrient cycling and landscape dynamics—as well as the critical
limitations of models to accurately represent some of the unique attributes of aridecosystems in
the Jornada Basin.
Fig. 16-1. Schematic depicting the four principal modules of the Patch Arid Lands Simulator (PALS): (1) vertical soil water stratification and its extraction via evaporation and plant transpiration, (2) energy-budget/atmospheric environment, (3) carbon-nitrogen cycling in soil organic matter pools and resulting availability of inorganic N, and, (4) the phenology, physiology, and growth of key principal plant functional types found in the warm deserts of the southwestern United States.

Structure and Function of Chihuahuan Desert Ecosystem The Jornada Basin Long-Term Ecological Research Site
Edited by: Kris Havstad, Laura F. Huenneke, William H. Schlesinger Chapter 16 Reynolds, J.F., Kemp, P.R., Ogle, K., Fernandez, R.J., Gao, Q., Wu, J.
2006
5
Conceptual Framework
Aridland Paradigms As described in several chapters in this volume, heterogeneity in aridlands is exemplified by the
spatial distribution of soil nutrients (e.g., islands of fertility; Charley and West 1975; Virginia
and Jarrell 1983), the vertical partitioning of soil water availability (e.g., the two-layer
hypothesis of Walter 1971), and temporal pulses in nutrient and water availabilities (e.g.,
mineralization rains; Charley 1975). Consequently, many unique nonlinear behaviors emerge,
such as nutrient cycles that are out of phase with abiotic driving variables (Charley 1972),
nonequilibrium relationships among key abiotic and biotic variables (Ellis and Swift 1988; Illius
and O’Connor 1999), and uncertain regeneration and growth pulses of many plant species, which
involve complex survival mechanisms linked to episodic precipitation events and plant
phenology (West et al. 1979; Kemp 1983; Reynolds et al. 2000).
Traditionally, aridland ecologists have sought to explain the complex and variable
responses of aridland systems through simple paradigms. Two widely cited examples—the
pulse-reserve (Noy-Meir 1973) and two-layer (Walter 1971) conceptual models—are often
evoked to explain the translation of episodic rainfall into soil water availability and resultant
plant production. In its simplest form, the pulse-reserve paradigm (figure 16-2a) describes how a
rain event “triggers” a pulse of production (i.e., germination, growth, or reproduction), some of
which is diverted to “reserve” (seed for annuals and perennials; storage organs for perennials).
This paradigm suggests a simple, direct link between discontinuous and unpredictable rainfall
and the long-term function and survival of aridland plant species (see review in Ogle and

Structure and Function of Chihuahuan Desert Ecosystem The Jornada Basin Long-Term Ecological Research Site
Edited by: Kris Havstad, Laura F. Huenneke, William H. Schlesinger Chapter 16 Reynolds, J.F., Kemp, P.R., Ogle, K., Fernandez, R.J., Gao, Q., Wu, J.
2006
6
Reynolds 2004). The two-layer hypothesis, a
complementary paradigm, suggests that seasonal pulses of moisture become vertically separated
into shallow and deep soil water pools that are differentially utilized by plants, notably shallow-
rooted grasses and deeply rooted woody plants.
Though heuristically compelling, these paradigms are not as simple or as straightforward
as they appear. Studies at the Jornada Basin suggest that both paradigms are limited in terms of
explaining productivity responses to rainfall. Rather, productivity is a manifestation of
Fig. 16-2. (A) Pulse-reserve paradigm (as presented in Noy-Meir 1973; based on Bridges and Westoby unpublished). (B) Modified pulse-reserve model, which explicitly identifies three components of the relationship between precipitation and plant production: (1) pulses of precipitation, (2) the role of soil water (e.g., antecedent conditions, soil type), and (3) plant functional types (FTs). Integrating plant water use with soil water availability makes it possible to distinguish “plant responses to” from “plant effects on” soil water. For example, when plants deplete soil water (“-“ effect), this contributes to plant growth (“+” response) and various plant FTs can be good competitors either by being good extractors (effect pathway) or good tolerators (response pathway) (redrawn and modified from Reynolds et al. 2004).

Structure and Function of Chihuahuan Desert Ecosystem The Jornada Basin Long-Term Ecological Research Site
Edited by: Kris Havstad, Laura F. Huenneke, William H. Schlesinger Chapter 16 Reynolds, J.F., Kemp, P.R., Ogle, K., Fernandez, R.J., Gao, Q., Wu, J.
2006
7
interactions among numerous soil, plant, and atmospheric variables that result in complex
patterns of soil water storage and water use by plants (chapter 11). In an effort to achieve a more
explanatory conceptual model, we recently invoked several modifications to the classic pulse-
reserve paradigm (Reynolds et al. 2004). As illustrated in figure 16-2b, the most important of
these include (1) the translation of precipitation into usable “soil moisture pulses,” i.e., soil water
pools (storage), which allow for antecedent soil moisture and may dampen or amplify the effect
of individual rainfall events; and, (2) water use by different plant species.
Modeling Focus Areas Our proposed revision of the pulse-reserve model (compare figure 16-2a and 16-2b) is not meant
to be all-encompassing. Rather, it serves as a general guide for identifying those key processes
that engender observed patterns of structure and functioning in arid ecosystems. Our conceptual
model suggests three indispensable topics of focus, which we discuss next.
Plant Functional Types Plant functional types, which have different phenological, physiological, and morphological
characteristics, are important components of arid ecosystems. As detailed in chapter 10, in the
late 1800s the Jornada Basin consisted largely of warm-season, C4, perennial grasses; a century
later, these communities have largely been replaced C3 shrub-dominated communities. In an
effort to account for the different combinations of plant functional types representative of these
historical grass–shrub transitions, most of the model development and validation reported in this
chapter is based on data collected from the 2,700-m transect (figure 16-3), which encompasses a
variety of plant assemblages and soil types (Wierenga et al. 1987: Cornelius et al. 1999) .

Structure and Function of Chihuahuan Desert Ecosystem The Jornada Basin Long-Term Ecological Research Site
Edited by: Kris Havstad, Laura F. Huenneke, William H. Schlesinger Chapter 16 Reynolds, J.F., Kemp, P.R., Ogle, K., Fernandez, R.J., Gao, Q., Wu, J.
2006
8
In PALS-FT, we group the principal species that occur along the transect into eight plant
functional types based on similarity of rooting patterns, seasonal activity, growth forms, and
physiological responses to soil water deficits (table 16-2).
Fig. 16-3. Schematic of Jornada Basin transect, established in 1982 as part of the Jornada LTER study. Along the 2,700-m transect, 90 sampling stations were established at 30-m intervals, extending from the floor of a small, closed-basin watershed (containing a small ephemeral lake bed or playa), up a broad alluvial slope to the footslopes of an isolated, granitic mountain. Soils along the transect are relatively coarse textured (typic haplargids or torriorthentic haplustolls) with the exception of the playa which contains fine-textured vertisols. Small squares show location of two stations (#35, #65) used in the simulations of grass- vs. shrub-dominated patches (see Patch Types and Variability in Transpiration).

Structure and Function of Chihuahuan Desert Ecosystem The Jornada Basin Long-Term Ecological Research Site
Edited by: Kris Havstad, Laura F. Huenneke, William H. Schlesinger Chapter 16 Reynolds, J.F., Kemp, P.R., Ogle, K., Fernandez, R.J., Gao, Q., Wu, J. 2006
9
Table 16-2. Plant functional types (FTs) used in the PALS-FT simulation model. Complete list of species in the Jornada Basin can be found at http://usda-ars.nmsu.edu/JER/PlantList.htm
Plant FT Brief Description Examples Occurrence of highest cover along LTER I transect (see Fig. 16-3)†
Perennial forbs Active from spring through autumn
leatherweed (Croton pottsii) hairyseed bahia (Bahia absinthifolia)
Playa (stations 1-7) and Mixed Piedmont (broad zone of relatively open, mixed vegetation; stations 11–57)
Deciduous shrubs Winter deciduous honey mesquite (Prosopis glandulosa) Playa Fringe (stations 8–10)
Deciduous subshrubs Winter-dormant desert zinnia (Zinnia acerosa), threadleaf snakeweed (Gutierrezia microcephalum)
Spring annuals Germinate in winter or spring and flower anytime from late spring to late summer
Abert’s buckwheat (Eriogonum abertianum), Steve’s pincushion (Chaenactis stevioides)
Mixed Piedmont (stations 11–57)
Evergreen shrubs Drought-tolerant creosotebush (Larrea tridentata) Shrub Piedmont (stations 58–72)
Winter annuals Germinate in autumn or winter and flower in winter or spring
tansy mustard (Descurainia pinnata), Gordon’s bladderpod (Lesquerella gordonii)
Summer annuals Germinate and flower in summer
sixweeks grama grass (Bouteloua barbata), lemonscent (Pectis angustifolia)
Mixed Piedmont (stations 11–57) and Alluvial Fan (stations 73–90)
Perennial Grasses C4, summer–active
black grama grass (Bouteloua eriopoda), bush muhly (Muhlenbergia porteri), fluffgrass (Dasyochloa pulchella)
Sporadically co-dominant in Mixed Piedmont (stations 11–57) and dominant on Alluvial Fan (stations 73–90)
† Some plant FTs can periodically be found at all locations along the 3 km transect

Structure and Function of Chihuahuan Desert Ecosystem The Jornada Basin Long-Term Ecological Research Site
Edited by: Kris Havstad, Laura F. Huenneke, William H. Schlesinger Chapter 16 Reynolds, J.F., Kemp, P.R., Ogle, K., Fernandez, R.J., Gao, Q., Wu, J.
2006
10
Within a specific plant functional type, there may be some variation in the phenology and growth
of individual species or in species composition from year to year. Nevertheless, the functional
type concept is a powerful tool for modeling collections of relatively similar species (Smith et al.
1997).
Distinct Patch Types Conceptually, the Jornada Basin can be characterized as a two-phase mosaic, which is typical of
many aridecosystems; that is, there are scattered patches of plants with relatively high within-
patch cover interspersed within a matrix of relatively bare soil (Aguiar and Sala 1999). The two-
phase mosaic constitutes the conceptual framework underlying the development of PALS-FT. To
account for the hierarchical nature of aridlands, this conceptual framework is depicted as a
spatially nested hierarchy in table 16-3.
The smallest spatial unit in the hierarchy is an individual plant. Multiple cooccurring
individual plants plus their immediate soil and atmospheric environment constitute a patch
(figure 16-1), which is the basic unit for our ecosystem-level simulations with PALS-FT. We
assume that a patch is internally homogenous, that is, located in a particular soil type where size
is a function of the size of various contiguous plant functional types. Different patch types (e.g.,
grass- or shrub-dominated ones) have different functional (e.g., photosynthesis, reproductive
rate, phenology) and structural (e.g., canopy volume, rooting depth, leaf area) characteristics.
Patch behavior is a function of the various interactions and feedbacks of the patch with
environmental drivers.
A series of connected patches form flowpaths (schematics provided in Reynolds and Wu
1999). Distinct geomorphic surfaces (alluvial fans, piedmonts, etc.) or topographic features

Structure and Function of Chihuahuan Desert Ecosystem The Jornada Basin Long-Term Ecological Research Site
Edited by: Kris Havstad, Laura F. Huenneke, William H. Schlesinger Chapter 16 Reynolds, J.F., Kemp, P.R., Ogle, K., Fernandez, R.J., Gao, Q., Wu, J. 2006
11
Table 16-3. Hierarchical view of ecological systems showing the spatial simulation units used in developing PALS-FT (described in Reynolds et al. 1993; Reynolds and Acock 1997). The level of concern (system L) is itself a component of a higher-level system (L+1), the latter of which may influence (limit, bound, etc.) the behavior of L; in turn, L can be subdivided into components of the next lower level (L-1), which serve as state variables in models of L and are studied to explain the mechanisms operating at L (e.g., leaf-level photosynthesis [L-1] as a component of whole-plant growth [L]). We can generally ignore levels higher than L+3 and lower than L-3 when trying to understand L behavior (O'Neill et al. 1989).While this scheme is arbitrary, it is biased towards plants as the central unit of study, and the distinction between levels is somewhat vague, it serves to illustrate the complexity of multiscaled systems and provides a useful framework for discussion. Furthermore, terms such as ecosystem and landscape may connote very different meanings unless their spatial and temporal limits are explicitly defined. Based on Reynolds et al (1993; 1996b). Shaded row/column indicates patch-level simulations presented in this chapter.
Typical coupling variables System+
Simulation unit:
Spatial scale (m2) §
Structural components
Water Energy / Nutrients Plant Patch Ecosystem
Flowpath Ecosystem
Plant FT 10-4 - 10-1 •Leaves •Stems •Roots •Soil volume
•Soil water •Transpiration •Plant water potential •Water uptake
•Photosynthesis •Respiration •Nutrient uptake •Herbivory
L L-1 L-2
Patch Ecosystem
100 - 104 •Plant FTs •Soil properties •Microbial populations •Surface Litter •Soil organic matter
•Precipitation •Infiltration •Runoff/run-on •Evapotranspiration •Soil water balance
•Net carbon balance •Net ecosystem carbon flux •Nutrient cycling •Decomposition •Trace gas flux
L+1 L L-1
Flowpath ecosystems †
102 – 105 •Patch ecosystems •Toposequences or soil
catenas •Connectivity
•Soil water flux and discharge
[Hillslope Darcian flow dominant]
•Mass flux of sediment •Mass flux of dissolved
nutrients •Aeolian transport
L+2 L+1 L
Landscape 106 - 4x10⁶ •Flowpath ecosystems •Groundwater •Channel storage
Channel flow [Turbulent flow
dominant]
•Dispersal •Trace gas flux
L+3 L+2 L+1
Region† 107 – 1010 •Landscapes (=Integrative flow systems)
•Lakes; rivers
•Hydrologic transport of sediments and nutrients
•Aeolian transport •Migration
L+4 L+3 L+2
§ ‘Typical’ values from Osmond et al. (1980), Woodmansee (1988) and Walker and Walker (1991) † Equivalent to ‘mesoscale’ in Walker and Walker (1991), which includes second-order watersheds + L is the level at which one is interested

Structure and Function of Chihuahuan Desert Ecosystem The Jornada Basin Long-Term Ecological Research Site
Edited by: Kris Havstad, Laura F. Huenneke, William H. Schlesinger Chapter 16 Reynolds, J.F., Kemp, P.R., Ogle, K., Fernandez, R.J., Gao, Q., Wu, J.
2006
12
(e.g., watersheds) often form natural boundaries for flowpaths (chapters 2, 4, and 7). As
illustrated in figure 16-3, the LTER transect consists of a number of contiguous patches arranged
linearly along an elevation and soil gradient. Thus, variable seasonal rainfall, downslope
redistribution of water and organic matter, and soil texture–related variation in infiltration and
water-holding capacity all interact to generate a complex spatial and temporal gradient of patch
types with differing soil water and nitrogen availabilities.
Soil Water Availability One of the main difficulties in understanding and predicting responses of aridecosystems to
variable precipitation stems from the fact that plants and most other ecosystem components (e.g.,
decomposers) respond primarily to soil water, not precipitation per se (see chapter 5). Arid
environments present a unique suite of concerns with respect to soil water, including low and
episodic rainfall, patchy distribution of plant cover, poorly developed soils with variable
textures, vertical redistribution of soil water due to water potential or thermal gradients, and
discontinuous and depth-dependent distributions of soil water (often due to relatively
impermeable layers of calcium carbonate or clay). Accordingly, our modeling activities and
supporting experiments have focused on the extent to which precipitation is translated into soil
water and how this, in turn, affects plant-, patch-, and flowpath-level processes and dynamics
(table 16-3).
Mechanistic Modeling in a Hierarchical Framework Our models are hierarchical in that behavior of the system at any specific level (L) (e.g., organ,
whole plant, community, ecosystem, etc.) is modeled by representing the interactions of the
component systems at one (L-1) or two (L-2) levels smaller in the hierarchy (table 16-3). For
example, whole plant dynamics are modeled via descriptions of organs (e.g., allocation between

Structure and Function of Chihuahuan Desert Ecosystem The Jornada Basin Long-Term Ecological Research Site
Edited by: Kris Havstad, Laura F. Huenneke, William H. Schlesinger Chapter 16 Reynolds, J.F., Kemp, P.R., Ogle, K., Fernandez, R.J., Gao, Q., Wu, J.
2006
13
roots and shoots, leaf photosynthesis), whereas community dynamics is modeled based on whole
plant dynamics (for examples, see Reynolds and Leadley 1992).
The high spatial and temporal variability in aridecosystems presents a challenge for
achieving the appropriate level of detail in models. Linear methods of scaling, such as averaging
or summing over spatial units or through time, are likely to be unsatisfactory because of
extremes and nonlinear relationships. Hence, we must consider both the spatial and temporal
hierarchies in which processes occur. Rainfall, for example, epitomizes this difficulty: There is a
multifarious relationship between the magnitude of a rainfall event, the degree of ecological
responses, and the time scale over which these responses unfold (Schwinning and Sala 2004).
Small pulses of rainfall may trigger germination, but larger (or cumulative) amounts are
necessary to sustain growth, flowering, fruiting, and seed production (Beatley 1974; Bachelet et
al. 1988). A single precipitation event may affect plant survival and growth, but the effect is
dependent on its timing relative to other events (Reynolds et al. 2000).
In summary, addressing questions of how plant functional types may respond to as well as affect
soil water and nutrient availability involves a careful match of scales of observation (patterns),
theory (explanations), and models (mechanistic descriptions involving key processes,
interactions, and feedbacks) (Reynolds et al. 1993). Our goal is to develop models capable of
prediction at the level of interest while avoiding scaling errors.
Modeling Arid Ecosystems
In the following sections, we summarize results from our hierarchical modeling approach,
including plant-, patch-, and flowpath-level processes. We highlight important and often
surprising outcomes of our modeling efforts with the goal of illustrating how model development

Structure and Function of Chihuahuan Desert Ecosystem The Jornada Basin Long-Term Ecological Research Site
Edited by: Kris Havstad, Laura F. Huenneke, William H. Schlesinger Chapter 16 Reynolds, J.F., Kemp, P.R., Ogle, K., Fernandez, R.J., Gao, Q., Wu, J.
2006
14
and results can provide insight into the complex interactions within these arid ecosystems. We
also discuss significant uncertainties and identify some of the many challenges that remain.
Plant Level
Leaf-Level Acclimation in Creosotebush
In most aridecosystems, the physiological and growth behaviors of individual plants are highly
variable with respect to time of day, season, and landscape position (Smith and Nowak 1990).
Many plants tend to grow in seasons or time periods with the most reliable resource availability
(e.g., the rainy season) although a few, such as creosotebush (Larrea tridentata) are
physiologically active throughout most of the year. Although much dogma exists concerning the
ability of creosotebush to cope with extremes in temperature and water availability, surprisingly
few supporting data actually exist. Because of its ecological dominance on bajadas within the
Jornada Basin and its distinct phenology and physiology, creosotebush (evergreen shrub, table
16-2) is an important component of PALS-FT. Thus we were motivated to reassess the
physiological and growth behavior of creosotebush, especially with regard to its magnitude and
mode of temperature acclimation and water-stress response.
We developed A-Season, a semi-mechanistic mathematical model that explicitly links
CO2 assimilation rate (A), stomatal conductance to water vapor (g), leaf internal CO2
concentration (Ci), and plant water potential (Ψp) and incorporates the effects of temperature (T),
atmospheric vapor pressure deficit (VPD), light intensity (photon flux density, PFD), and soil
water availability (as reflected in values of Ψp). See Ogle and Reynolds (2002) for derivation of
models and other details. A-Season contains a standard Fickian diffusion equation for
photosynthesis: A = 0.625⋅g⋅(Ca – Ci), where Ca is atmospheric CO2 concentration and 0.625 is

Structure and Function of Chihuahuan Desert Ecosystem The Jornada Basin Long-Term Ecological Research Site
Edited by: Kris Havstad, Laura F. Huenneke, William H. Schlesinger Chapter 16 Reynolds, J.F., Kemp, P.R., Ogle, K., Fernandez, R.J., Gao, Q., Wu, J.
2006
15
the ratio of the diffusivity of water vapor to CO2 in air. We derived an expression for Ci based on
a linearization of a typical A – Ci curve (A is a saturating function of Ci; see for example
Lambers et al. 1998) making Ci dependent on g (Katul et al. 2000). The A-Season model
assumes that VPD and Ψp affect g, and the threshold function is consistent with a biophysical
model of stomatal regulation of leaf water potential (figure 16-4a; Oren et al. 1999.
We also allow for a temperature acclimation response by expressing maximum daily g
(gmax) as a function of Tgro (average 24-hour, 7-day air temperature) and Ψp (figure 16.4b). We
analyzed A-Season by fitting it to field data from the Jornada Basin collected under a broad
Fig. 16-4. A-Season model predictions of stomatal conductance (g) in creosotebush (Larrea tridentata) as a function of vapor pressure deficit (VPD), plant predawn water potential (Ψp), and average growing temperature (Tgro). (A) Plots of g vs. VPD, where each curve is for a specific value of Ψp. The curves show: (1) stomatal sensitivity to VPD decreases (slope becomes more shallow) as Ψp becomes more negative (increasing water stress), and (2) g exhibits a threshold-type response such that stomata are operating at their maximum (gmax) for VPD < 1.54 kPa. (B) Plots of gmax vs. Tgro (same Ψp values as in panel A). The curves illustrate: (1) gmax is reduced by water stress, (2) stomata acclimate to temperature, whereby gmax depends on Tgro, exhibiting highest values for Tgro between 22 to 27 C, and (3) Tgro and Ψp interact to affect conductance (i.e., the shape and optimum of the gmax vs. Tgro curves vary with Ψp). Reproduced from Ogle and Reynolds (2004).
Structure and Function of Chihuahuan Desert Ecosystem The Jornada Basin Long-Term Ecological Research Site
Edited by: Kris Havstad, Laura F. Huenneke, William H. Schlesinger Chapter 16 Reynolds, J.F., Kemp, P.R., Ogle, K., Fernandez, R.J., Gao, Q., Wu, J.
2006
16
range of environmental conditions and by testing it against data gathered under dissimilar
conditions.
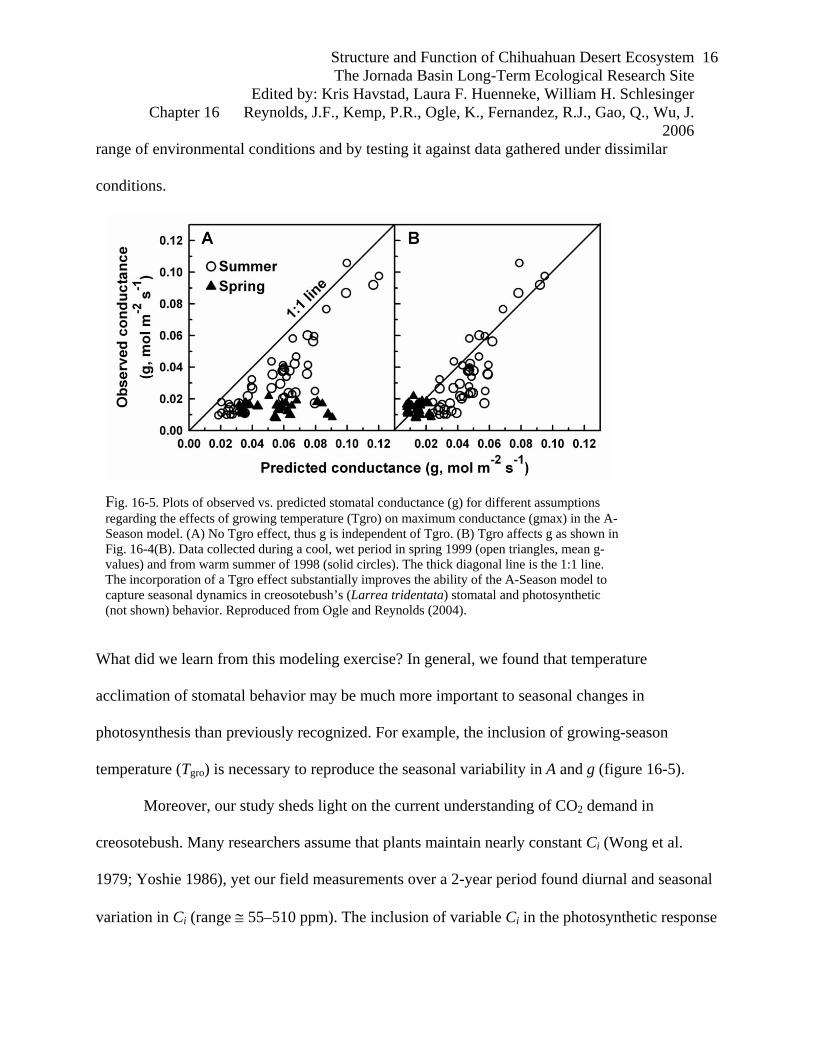
What did we learn from this modeling exercise? In general, we found that temperature
acclimation of stomatal behavior may be much more important to seasonal changes in
photosynthesis than previously recognized. For example, the inclusion of growing-season
temperature (Tgro) is necessary to reproduce the seasonal variability in A and g (figure 16-5).
Moreover, our study sheds light on the current understanding of CO2 demand in
creosotebush. Many researchers assume that plants maintain nearly constant Ci (Wong et al.
1979; Yoshie 1986), yet our field measurements over a 2-year period found diurnal and seasonal
variation in Ci (range ≅ 55–510 ppm). The inclusion of variable Ci in the photosynthetic response
Fig. 16-5. Plots of observed vs. predicted stomatal conductance (g) for different assumptions regarding the effects of growing temperature (Tgro) on maximum conductance (gmax) in the A-Season model. (A) No Tgro effect, thus g is independent of Tgro. (B) Tgro affects g as shown in Fig. 16-4(B). Data collected during a cool, wet period in spring 1999 (open triangles, mean g-values) and from warm summer of 1998 (solid circles). The thick diagonal line is the 1:1 line. The incorporation of a Tgro effect substantially improves the ability of the A-Season model to capture seasonal dynamics in creosotebush’s (Larrea tridentata) stomatal and photosynthetic (not shown) behavior. Reproduced from Ogle and Reynolds (2004).

Structure and Function of Chihuahuan Desert Ecosystem The Jornada Basin Long-Term Ecological Research Site
Edited by: Kris Havstad, Laura F. Huenneke, William H. Schlesinger Chapter 16 Reynolds, J.F., Kemp, P.R., Ogle, K., Fernandez, R.J., Gao, Q., Wu, J.
2006
17
functions enables us to capture the hysteresis in instantaneous Ci that results from a coupling
between Ci and g and large diurnal fluctuations in PFD, T, and VPD (figure 16-6).
Models that neglect stomatal temperature acclimation and/or assume constant Ci may yield
unrealistic predictions of plant and ecosystem carbon and water dynamics.
Root–Soil Interactions
Our work on the aboveground physiology of creosotebush underscores the importance of root–
soil linkages and controls of water uptake within the belowground environment. Root structure,
including density, depth of penetration, and horizontal distribution within the soil matrix, can
have significant effects on transpiration, competition, and growth of plants. However, the
belowground environment represents a challenge in developing models for the Jornada Basin
because (1) quantitative, accurate assessments of root biomass are difficult to obtain; (2) rooting
Fig. 16-6. Predicted and observed diurnal courses of stomatal conductance (g) vs. leaf-internal CO2 concentration (Ci). Open circles are observed means and numbers (1-8) correspond to time (e.g., 1 = first measurement of the day). Predictions of the A-Season model (solid line, dots) are computed from 30-minute averages of climatic variables obtained from a weather station located in the study site; arrows are placed near early morning and point in the direction of increasing time. Plots are for 3 days for which modeled and observed Ci are in close agreement: (A) 7/28/98, Ψp = −1.9 MPa, (B) 7/31/98, Ψp = −2.6 MPa, and (C) 8/4/98, Ψp = −2.1 MPa. The model successfully captures the observed hysteresis patterns, whereby the g vs. Ci trajectory depends on time of day. Reproduced from Ogle and Reynolds (2004).

Structure and Function of Chihuahuan Desert Ecosystem The Jornada Basin Long-Term Ecological Research Site
Edited by: Kris Havstad, Laura F. Huenneke, William H. Schlesinger Chapter 16 Reynolds, J.F., Kemp, P.R., Ogle, K., Fernandez, R.J., Gao, Q., Wu, J.
2006
18
depths vary greatly across life forms and species (e.g., Gibbens and Lenz 2001; Schenk and
Jackson 2002); (3) even within a species, rooting patterns may be quite variable from site to site
and year to year (Brisson and Reynolds 1994; Gibbens and Lenz 2001); (4) root structural
properties may not be good indicators of root functional activity, such as water and nutrient
uptake (Plamboeck et al. 1999).
The majority of our modeling of the belowground environment has been somewhat
empirical. For example, Kemp et al. (1997) used a simple water uptake formulation and
empirical estimates of root distributions in PALS-FT to elucidate the sensitivity of various plant
functional types to changes in root distributions. Recently, Ogle et al. (2004) took a more
mechanistic approach, linking stable isotope technology and a biophysical water flux model to
estimate the vertical distribution of roots for creosotebush. We sought to answer several key
questions, such as where do active roots occur within the soil profile, and how does the spatial or
vertical distribution of active roots interact with soil water availability to affect plant water
sources and soil water dynamics? The emergence of stable isotope technology has proved a
powerful tool to unravel some of the uncertainties with respect to such questions (Brunel et al.
1995). For example, the relative abundance of deuterium and 18O (heavy oxygen) in plant stem
water reflects the specific soil depths from which roots obtain water (Ehleringer and Dawson
1992).
We addressed these questions by developing the root area profile and isotope
deconvolution (RAPID) algorithm, which explicitly couples measurements of plant water
potential, stable isotopes, soil water, and soil physical properties. Details of the RAPID
algorithm, including an outline of the logical steps, a list of assumptions, description of the root

Structure and Function of Chihuahuan Desert Ecosystem The Jornada Basin Long-Term Ecological Research Site
Edited by: Kris Havstad, Laura F. Huenneke, William H. Schlesinger Chapter 16 Reynolds, J.F., Kemp, P.R., Ogle, K., Fernandez, R.J., Gao, Q., Wu, J.
2006
19
uptake model, fits to observed data, and numerous examples, are given in Ogle (2003) and Ogle
et al. (2004). RAPID incorporates a model for root water uptake within a Bayesian statistical
framework with biologically realistic constraints placed on root area profiles. We used a simple
biophysical water flux model (modified from Campbell 1991) that captures key elements of
root–soil–water interactions. The model describes the fraction of water acquired, pi, from soil
layer i as a function of the fraction of active root area in that layer, fr,i. The pi values are then
used to determine the isotopic signature of the stem water that results from a particular root
distribution. The objective is to estimate pi and fr,i. Because the actual root distribution for most
species is unknown, we assume the distribution of active root area can be described by a mixture
of gamma density functions that capture a wide range of unimodal and bimodal root densities
with depth (for equations see Ogle 2003). We then used RAPID to estimate the vertical
distribution of active roots for creosotebush plants at a site in the Jornada Basin and explored the
implications for water uptake during a dry-down period following a summer rainfall event.
At first glance the reconstructed, active root area profile for creosotebush appears
unimodal with about 96% of the active root area between 20 and 45 cm (figure 16-7a). However,
the RAPID algorithm predicts that there is a small but statistically significant fraction of active
root area in the top 2–5 cm (figure 16-7a, inset).
What did we learn from this modeling exercise? Although the small fraction of active
roots in the surface layers normally contribute little to total plant water uptake, their role may be
to acquire water immediately following a rain event (BassiriRad et al. 1999). For example,
nearly 30–60% of the water taken up during the first and second days following a 17-mm rainfall

Structure and Function of Chihuahuan Desert Ecosystem The Jornada Basin Long-Term Ecological Research Site
Edited by: Kris Havstad, Laura F. Huenneke, William H. Schlesinger Chapter 16 Reynolds, J.F., Kemp, P.R., Ogle, K., Fernandez, R.J., Gao, Q., Wu, J.
2006
20
came from the top 10 cm (figure 16-7b, c). This water is probably critical to creosotebush growth
and carbon dynamics because photosynthesis is often enhanced immediately following rain
events (Reynolds et al. 1999b). Essential nutrients are also concentrated in the topsoil (Jobbágy
and Jackson 2001), and the small fraction of active roots near the surface may allow
creosotebush to capitalize on improved nutrient availability following rain (BassiriRad et al.
1999). As the shallow soil dries, the middle layers are the primary water source, and no water is
acquired from the topsoil (figure 16-7d and 16-7f). The large fraction of active roots in the 20–
45-cm range may provide a stable water source essential for maintaining everyday function
throughout the year.
Fig. 16-7. Results using the RAPID algorithm for the posterior estimates of (A) active root area and (B–F) water uptake profiles for creosotebush (Larrea tridentata). (A) White bars depict posterior means for the fraction of active root area in each soil layer (i.e., fr,i) and the whiskers are the 95 percent posterior credible intervals (CrI; i.e., the 2.5th and the 97.5th quantiles posterior samples). The inset is a magnification of the fractions in the top 20 cm. (B–F) The filled bars are the posterior means for the fraction of water taken up from each soil layer (i.e., pi) for five sampling dates; the whiskers are the 95 percent CrIs. The filled circles are the mean bulk soil water potentials (Ψbs,i) for each layer, estimated from soil water content and texture data. The samples were collected after a rain event and during the following dry-down period. Dates associated with each panel are: (B) 7/25/98, 1 day after moderate rainfall (17.2 mm); (C) 7/26/98, 2 days after rain; (D) 7/29/98, 5 days after rain; (E) 7/31/98, 7 days after rain; and (F) 8/2/98, 9 days after rain. Reproduced from Ogle et al. (2004).

Structure and Function of Chihuahuan Desert Ecosystem The Jornada Basin Long-Term Ecological Research Site
Edited by: Kris Havstad, Laura F. Huenneke, William H. Schlesinger Chapter 16 Reynolds, J.F., Kemp, P.R., Ogle, K., Fernandez, R.J., Gao, Q., Wu, J.
2006
21
Patch Scale: Soil Water and Nutrient Cycling
Soil Water and Evapotranspiration
The spatial and temporal distribution of soil water in aridlands governs many biotic and abiotic
processes (Wainwright et al. 1999b). Thus it is vital to have a robust, accurate model of the
availability of water in desert soils. Given that many soil water models have been developed over
the years, our approach for developing a relevant submodel for PALS-FT involved evaluation of
three existing soil water models (2DSOIL, SWB, SW)(table 16-4).
Our goal was to develop a robust model of minimal complexity. By comparing results
from different models for a wide range of soil properties, vegetative cover, precipitation, and
microclimate, we could identify the minimum information necessary to describe soil water
dynamics in the Jornada Basin.
The 2DSOIL model (Pachepsky et al. 1993) is a mechanistic model that emphasizes
physical aspects of soil water fluxes; SWB (Baier and Robertson 1966) is a simple water budget
model that does not consider soil water redistribution and includes simplified schemes for soil
evaporation and transpiration by different plant functional types; and SW (see Kemp et al. 1997)
is a semi-mechanistic model (intermediate in complexity between 2DSOIL and SWB) that
includes soil water fluxes and the physiological control of water loss by different plant life
forms. Transect data (figure 16-3) were used to investigate the comparative behavior of the
models: the models were parameterized using data from 1986 and validated using data from
1987.

Structure and Function of Chihuahuan Desert Ecosystem The Jornada Basin Long-Term Ecological Research Site
Edited by: Kris Havstad, Laura F. Huenneke, William H. Schlesinger Chapter 16 Reynolds, J.F., Kemp, P.R., Ogle, K., Fernandez, R.J., Gao, Q., Wu, J. 2006
22
Table 16-4. Assumptions and functional relationships of the three soil water models used in Kemp et al. (1997) to examine soil water dynamics in the Jornada Basin. Based on this intercomparison, PALS-SWB was developed, which is a modified version of SWB and SW. Key to abbreviations: ψsoil = soil water potential; VPD = vapor pressure deficit; LA = leaf area; WHC = water holding capacity; E = energy; σstom= stomatal conductance. Details and rationale for model formulations provided in Kemp et al. (1997) and Reynolds et al. (2000). Shaded column indicates module used in patch-level simulations presented in this chapter (see Table 16-1).
Model intercomparison
Attributes 2DSOIL SWB SW PALS-SWB TIME STEP Variable 1 day Variable 1 day SOIL LAYERS
• Number (total) 24 6 20 3-20 • Thickness of individual layer§
Variable (1-5 cm) Variable (10 or 20 cm) Variable (1-10 cm) Variable (5-20 cm)
SOIL WATER FLUX Darcy-Richard's equation; Finite element
None Darcy-Richard's equation; Predictor-corrector
None
• Moisture Retention van Genuchten (1980) (to calculate matrix
potential)
Campbell et al. (1993) (to calculate WHC)
Campbell et al. (1993) (to calculate matrix potential)
Campbell et al. (1993) (to calculate WHC)
• Hydraulic Conductivity
Gardner (1958) None Gardner (1958) None
ROOT DISTRIBUTION Uniform Optimized for SWB Estimated from literature Estimated from literature EVAPOTRANSPIRATION
• Transpiration f (Canopy E budget, LA, average ψsoil
f (Canopy E budget) average ψsoil, VPD)
f (VPD, σstom, LA, ψsoil in each layer)
f (VPD, σstom, LA, average root-weighted ψsoil across layers)
• Soil Evaporation f (Surface E budget) f (Surface E budget coupled with model of
Linacre (1973))
f (Surface resistance, vapor gradient)
f (Surface E budget coupled with model of Linacre (1973))
• Water Uptake f (ψsoil in layer) f (Average ψsoil) f (ψsoil in layer) f (Average root-weighted ψsoil across layers)
§ Layers increase in thickness with increasing depth

Structure and Function of Chihuahuan Desert Ecosystem The Jornada Basin Long-Term Ecological Research Site
Edited by: Kris Havstad, Laura F. Huenneke, William H. Schlesinger Chapter 16 Reynolds, J.F., Kemp, P.R., Ogle, K., Fernandez, R.J., Gao, Q., Wu, J.
2006
23
The results of these simulations provide insight into spatial and temporal variation in
evapotranspiration (ET) in the Jornada Basin. Each model predicted variable amounts of
transpiration versus evaporation as a function of location along this transect, which can be
attributed to both vegetation and soil differences (table 16-5).
Table 16-5. Predicted values from three soil water models of evaporation (E), transpiration (T), and T as a percent of total annual evapotranspiration (ET = E+T) at various locations along the LTER I transect during 1986. E and T are cumulative values for the year. Based on Kemp et al. (1997).
Model: 2DSOIL SWB SW
Station§ T E T/ET T E T/ET T E T/ET
20 18.0 12.9 58% 16.7 16.4 50% 22.6 12.8 64%
35 16.0 13.4 54% 12.5 16.5 43% 15.4 20.8 43%
50 14.7 13.1 53% 16.8 15.8 52% 25.2 11.0 70%
65 9.2 15.5 37% 12.7 17.8 42% 10.5 17.3 38%
80 14.1 14.1 50% 16.4 15.8 51% 19.8 12.4 61%
§See Fig. 16-3
All three models predicted lowest transpiration (about 40% of total ET) for the creosotebush
community (Station 65, figure 16-3) with the lowest plant cover (30% peak cover) and highest
transpiration (58–70% of ET) for the mixed vegetation. However, these differences in
transpiration were also a function of soil texture differences between the communities, which can
affect water-holding capacity of surface soils and thus E (i.e., the reverse-texture hypothesis of

Structure and Function of Chihuahuan Desert Ecosystem The Jornada Basin Long-Term Ecological Research Site
Edited by: Kris Havstad, Laura F. Huenneke, William H. Schlesinger Chapter 16 Reynolds, J.F., Kemp, P.R., Ogle, K., Fernandez, R.J., Gao, Q., Wu, J.
2006
24
Noy-Meir 1973). The models were not conclusive regarding the effect of soil texture on soil
evaporation. In comparing two transect locations with similar plant functional type cover but
different soil texture (Station 20 versus 50), 2DSOIL indicated that evaporation was marginally
higher on the coarse-textured soil (Station 50), whereas SW predicted greater evaporation on the
fine-textured soil (Station 20).
What did we learn from this modeling exercise? Experimental studies of ET have shown
that the percentage of total ET attributable to transpiration varies from 7% to 80% in various arid
and semiarid ecosystems in North America (reviewed in Reynolds et al. 2000). Given the
complexity of atmospheric, plant, and soil relationships, it is difficult for experimental studies to
quantify the importance of these interactions, especially given the short time periods of most
studies. An important “take-home lesson” is the importance of the interdependency between
transpiration and evaporation as a result of competition for soil water between the atmosphere
and the plants. Our modeling research suggests that studies attempting to study transpiration or
evaporation in isolation from one another are likely to reach erroneous conclusions regarding the
relative contributions of these processes (see chapter 5). Furthermore, our models suggest that
plant cover and rooting distributions are more important in determining soil water distribution
than physical processes. These findings helped us develop a version of a soil water module
(PALS-SWB, table 16-4) that represents the minimum degree of complexity necessary to capture
these key dynamics.
Decomposition and Nutrient Cycling
Arid ecosystems have soils that are, for the most part, poorly developed and low in organic
matter and nutrients. Litter and/or nutrient inputs are sporadic (Crawford and Gosz 1982), and

Structure and Function of Chihuahuan Desert Ecosystem The Jornada Basin Long-Term Ecological Research Site
Edited by: Kris Havstad, Laura F. Huenneke, William H. Schlesinger Chapter 16 Reynolds, J.F., Kemp, P.R., Ogle, K., Fernandez, R.J., Gao, Q., Wu, J.
2006
25
both litter and nutrients are usually spatially heterogeneous, reflecting heterogeneity in the
vegetation (Schlesinger et al. 1996). Although our understanding of nutrient cycling in aridlands
is rudimentary, studies at the Jornada Basin have provided insight into the unique aspects of litter
decay and soil nutrient dynamics under arid conditions (see chapter 6).
Our patch-level modeling has addressed a number of these unique attributes by focusing
on two aspects of nutrient cycling: (1) microbial-mediated decay of litter as a function of its
chemical composition; and (2) prediction of litter decay and carbon and nitrogen mineralization
over time, including the effects of extended drought. Model development with respect to the first
focus area emphasized decomposition and mineralization processes associated with different
chemical pools within the litter as well as the pool of microbial decomposers acting on these
pools, all of which were incorporated into the mechanistic decomposition module GENDEC
(Moorhead and Reynolds 1989b). Using GENDEC to simulate decay of leaf and root litter of
creosotebush revealed that much of the observed dynamics of C and N in both litter and soil
could be accounted for by microbial processes and that differences between surface and
belowground litter losses were largely accounted for by physical weathering of surface litter
(Moorhead and Reynolds 1989a). These results also suggested that decomposition of litter was
strongly limited by N availability to microbes during the early phases of decay, providing an
explanation for N immobilization in litter pools reported by Skujins (1981). However, when we
attempted to use GENDEC for long-term simulations, we encountered surprising inaccuracy:
The predicted mass loss and N dynamics of litter were too rapid and overly sensitive to soil
environmental conditions. These results motivated us to compare GENDEC to two well-known

Structure and Function of Chihuahuan Desert Ecosystem The Jornada Basin Long-Term Ecological Research Site
Edited by: Kris Havstad, Laura F. Huenneke, William H. Schlesinger Chapter 16 Reynolds, J.F., Kemp, P.R., Ogle, K., Fernandez, R.J., Gao, Q., Wu, J.
2006
26
models of decomposition and nutrient cycling: the Andrén and Paustian scheme (A&P, Andrén
and Paustian 1987) and CENTURY (Parton et al. 1987).
Characteristics of the three models are given in table 16-6. Each model has unique
assumptions for describing N dynamics and each represents a different degree of complexity.
Each model simulates decay from pools of litter and soil organic matter, governed by
decomposition rates modified by soil temperature and moisture, and by the chemical
composition of the C and N pools. In general, GENDEC focuses on microbial metabolism and
litter chemistry with a high degree of mechanism, A&P is the simplest formulation with the
fewest pools, and CENTURY includes potentially important pools of recalcitrant soil organic
matter and is intermediate in its complexity. We compared simulated mass loss, N content, and N
mineralization of leaf and root litter using data obtained during a three-year field study at the
LTER site, which examined the decomposition and N release from leaf and root litter of
creosotebush and honey mesquite (Prosopis glandulosa) (Kemp et al. 2003).
For brevity, we show results only for creosotebush leaf litter, which demonstrate how the
models tended to differ with respect to one another. Under both ambient and drought conditions,
the A&P model underestimated rates of surface mass loss for litter (figure 16-8a and 16-8b) and
gave the poorest estimates of N content of leaf litter (figure 16-8c and 16-8d), suggesting that a
simple model that was originally developed for temperate, mesic agroecosystems is not sufficient
to describe nutrient cycling in aridlands. GENDEC was the only model to predict N
immobilization in leaf litter, although amounts were excessive (figure 16-8c and 16-8d); in

Structure and Function of Chihuahuan Desert Ecosystem The Jornada Basin Long-Term Ecological Research Site
Edited by: Kris Havstad, Laura F. Huenneke, William H. Schlesinger Chapter 16 Reynolds, J.F., Kemp, P.R., Ogle, K., Fernandez, R.J., Gao, Q., Wu, J.
2006
27
addition, rates of mass loss in the first 10 months were too high (figure 16-8a and 16-8b). Last,
although CENTURY underestimated leaf mass loss rates and did not predict N immobilization in
litter, it provided the best overall description of decay and N mineralization across the spectrum
of litter (root and leaf), species (creosotebush and mesquite), and treatments (ambient and
drought).
This model comparison was instrumental in developing a decomposition and nutrient
cycling module for PALS-FT. Given that CENTURY had the least error overall and that this
model has been successfully used for describing long-term nutrient cycling in many semiarid
Fig. 16-8 Observed and predicted mass loss for creosotebush (Larrea tridentata) leaf litter. Comparisons of four decomposition models (GENDEC, CENTURY, A&P, and PALS-CENTURY) are shown. Observed data cover period from December 1991-June 1995, where plots received either ambient precipitation or had summer rainfall withheld (summer period indicated by thick horizontal bars). Points are means of 6-8 litterbags (±1 se) sampled at each date.

Structure and Function of Chihuahuan Desert Ecosystem The Jornada Basin Long-Term Ecological Research Site
Edited by: Kris Havstad, Laura F. Huenneke, William H. Schlesinger Chapter 16 Reynolds, J.F., Kemp, P.R., Ogle, K., Fernandez, R.J., Gao, Q., Wu, J.
2006
28
grasslands (see Hall et al. 2000), we opted to use it in PALS-FT. To improve on its shortcomings
for aridlands, we made several significant modifications: (1) We changed the time step from
monthly to daily to account for short-term variability in soil moisture and droughts of varying
duration; (2) we added a term to account for the effect of soil moisture on the rate of root litter
decay; and (3) we changed the method of partitioning litter into metabolic and structural
fractions. In table 16-6, this submodel of PALS-FT (called PALS-CENTURY) is compared to
the three original decomposition models (for further details, see Kemp et al. 2003).
What did we learn from these modeling exercises? We found that soil water availability
plays less of a role during the initial phases of decomposition of surface litter than during latter
stages, because surface litter is partly degraded by physical processes. Our studies with PALS-
CENTURY suggest that nutrient cycling in the Jornada Basin may be poised between C
limitation and N limitation, because small changes in the model led to relatively large qualitative
changes in predictions of N behavior (figure 16-8c and 16-8d). Whether N from decaying litter is
immobilized by microbial decomposers or released as mineralized N depends on whether
microbial decomposers are primarily C- or N-limited (MacKay et al. 1987a; Montaña et al.
1988). Our modeling analysis suggests that decomposers are balanced between these two
limiting nutrients and that any natural or anthropogenic factors (such as climate change and
elevated CO2) that affect litter amount or quality could change this balance.
Patch Scale: Unraveling NPP–Precipitation Relationships
A central objective of our modeling efforts in the Jornada Basin has been to elucidate cause–
effect relationships underlying the tremendous variability of net primary production (NPP) over
time and space. Although we intuitively expect that NPP in aridlands should be directly related

Structure and Function of Chihuahuan Desert Ecosystem The Jornada Basin Long-Term Ecological Research Site
Edited by: Kris Havstad, Laura F. Huenneke, William H. Schlesinger Chapter 16 Reynolds, J.F., Kemp, P.R., Ogle, K., Fernandez, R.J., Gao, Q., Wu, J.
2006
29
to rainfall, we find that interannual variation in NPP for a given aridland site is, in fact, only
weakly correlated with precipitation (Paruelo et al. 1999; Oesterheld et al. 2001; Wiegand et al.
2004). Le Houerou et al. (1988), for example, found that the variability in annual NPP measured
at 77 rangeland sites was 50% greater than the corresponding variability in annual rainfall (figure
16-9a), indicating a complex relationship that defies simple conceptual models (e.g., figure 16-
2a). Identifying cause–effect relationships between rainfall and NPP is crucial because the arid
and semiarid vegetation zones of these regions appear to be particularly vulnerable to changes in
precipitation (MacMahon and Schimpf 1981; McClaran and Van Devender 1995; Weltzin and
McPherson 2003). A shift in seasonal precipitation and/or changes in the frequency and
magnitude of extreme rain events could potentially lead to significant ecological and
biogeochemical impacts (Higgins et al. 1998; Reynolds et al. 1999a, 2004; Sheppard et al. 2002)
One of our main challenges has been to address what constitutes “biologically
significant” rainfall. Scores of factors could be responsible for poor correlations between
precipitation and plant productivity (see chapter 11). For the Jornada Basin region, these include
the timing of precipitation (Prince et al. 1988; Reynolds et al. 2000), composition of plant
species and their moisture requirements (Kemp et al. 1997), preconditioning effects of drought
(e.g., Rockström and Falkenmark 2000), compensatory responses following drought (Reynolds
et al. 1999b), and hydrological factors, including variation in the infiltration capacity of soils
(chapters 5 and 7), spatial variability in run-in and runoff (Gao and Reynolds 1993), and

Structure and Function of Chihuahuan Desert Ecosystem The Jornada Basin Long-Term Ecological Research Site
Edited by: Kris Havstad, Laura F. Huenneke, William H. Schlesinger Chapter 16 Reynolds, J.F., Kemp, P.R., Ogle, K., Fernandez, R.J., Gao, Q., Wu, J.
2006
30
antecedent soil moisture levels (Reynolds et al. 2004). To ascertain the biological significance of
precipitation, numerous factors must be considered, including the length of time between rain
F ig. 16-9. (A) Coefficient of variation (CV) in NPP shown as a function of the CV in precipitation. Based on data in Le Houérou et al. (1988) obtained from 77 rangeland sites (< 600 mm annual precipitation) scatteredhroughout the world, and (B) CV in NPP of various plant FTs obtained from simulations of PALS-FT as a function of CV in precipitation for decadal periods using rainfall from the Jornada Basin (1915-1995). Numbers correspond to specific CV values for each FT from each decade. Modified from Reynolds et al. (1999a).

Structure and Function of Chihuahuan Desert Ecosystem The Jornada Basin Long-Term Ecological Research Site
Edited by: Kris Havstad, Laura F. Huenneke, William H. Schlesinger Chapter 16 Reynolds, J.F., Kemp, P.R., Ogle, K., Fernandez, R.J., Gao, Q., Wu, J.
2006
31
events, the size of an event and its intensity, the current status of soil water content, and the
physiological activities of the plants. For example, the response of well-hydrated plants to a
given moisture input will be different than drought-stressed plants (e.g., BassiriRad et al. 1999),
and some aridland species require a minimal precipitation event to trigger a transition from a
state of lower to higher physiological activity (Schwinning and Sala 2004).
In sum, elucidating cause–effect relationships between plant production and precipitation
necessitates an integrated, multifactor approach. Using PALS-FT, we have explored a multitude
of potential ways in which certain abiotic and biotic factors may directly or indirectly affect the
dynamics between precipitation and plant productivity. In the following sections, we describe a
series of simulations in which we scrutinized the role of individual precipitation events or
precipitation pulses (Schwinning and Sala 2004), antecedent soil moisture, and long-term
(decadal) period drought cycles on NPP dynamics.
Storms, Antecedent Moisture, and NPP
In the Jornada Basin, the majority (~ 60%) of precipitation events are less than 5 mm (see
chapter 3; Reynolds et al. 2004, fig. 3). Such relatively small rainfall events generally recharge
only the uppermost portion of the soil profile, whereas large rain events are necessary to recharge
deeper layers (see chapter 5). Given the ecological significance of how seasonal pulses of
moisture could be vertically separated into shallow and deep soil water pools—which can be
differentially utilized by shallow-rooted grasses and deep-rooted woody plants (i.e., the two-
layer hypothesis)—our interest was piqued to assess the biological effectiveness of small versus
large rainfall events.

Structure and Function of Chihuahuan Desert Ecosystem The Jornada Basin Long-Term Ecological Research Site
Edited by: Kris Havstad, Laura F. Huenneke, William H. Schlesinger Chapter 16 Reynolds, J.F., Kemp, P.R., Ogle, K., Fernandez, R.J., Gao, Q., Wu, J.
2006
32
First, returning to our conceptual model (figure 16-2b), the significance of any individual
rain event must be appraised in terms of its impact on soil moisture recharge. Because the
majority of all individual precipitation events in the Jornada Basin are < 5 mm, we hypothesized
that small events may be “amplified” to some extent if they were to occur on sequential days,
which we refer to as storms. In analyses of the long-term weather records for the Jornada Basin
(see Reynolds et al. 2004; see also chapter 3), on average, about half of all rain events each year
occur as individual rain events (with no rainfall on either the previous or following day), and the
other half occur as storm events. Furthermore, the majority of storms produced < 5 mm of total
precipitation. Second, analyses of length of the intervening period between storms in the Jornada
Basin have revealed that a majority of rains and storms (56%) were separated by five days or
less. This clustering occurs more frequently in summer, with about 70% of the summer storms
occurring within five days of each other.
We used PALS-FT to explore the extent to which precipitation events and storms elicited
plant responses, especially production. We analyzed differences among plant functional types
regarding their growth responses to an 85-year Jornada Basin rainfall record as a function of (1)
the physiological status of the plant (a function of prior abiotic conditions, as indicated by
antecedent plant water potential); and (2) specific rainfall inputs, for example, storm size. In
general, our simulations revealed many nonlinear responses. Large events and storms generally
elicited much greater growth responses than small ones, especially in the evergreen shrub Larrea
when plants were severely drought-stressed. Small storms elicited large growth responses in
annual plants and grasses when plants were moderately drought-stressed. The aboveground
biomass of severely drought-stressed grasses tended to decline following any size rain event,

Structure and Function of Chihuahuan Desert Ecosystem The Jornada Basin Long-Term Ecological Research Site
Edited by: Kris Havstad, Laura F. Huenneke, William H. Schlesinger Chapter 16 Reynolds, J.F., Kemp, P.R., Ogle, K., Fernandez, R.J., Gao, Q., Wu, J.
2006
33
reflecting the reallocation of biomass from crowns and shoots to new root growth (see Reynolds
et al. 2004, for a complete discussion of simulation results).
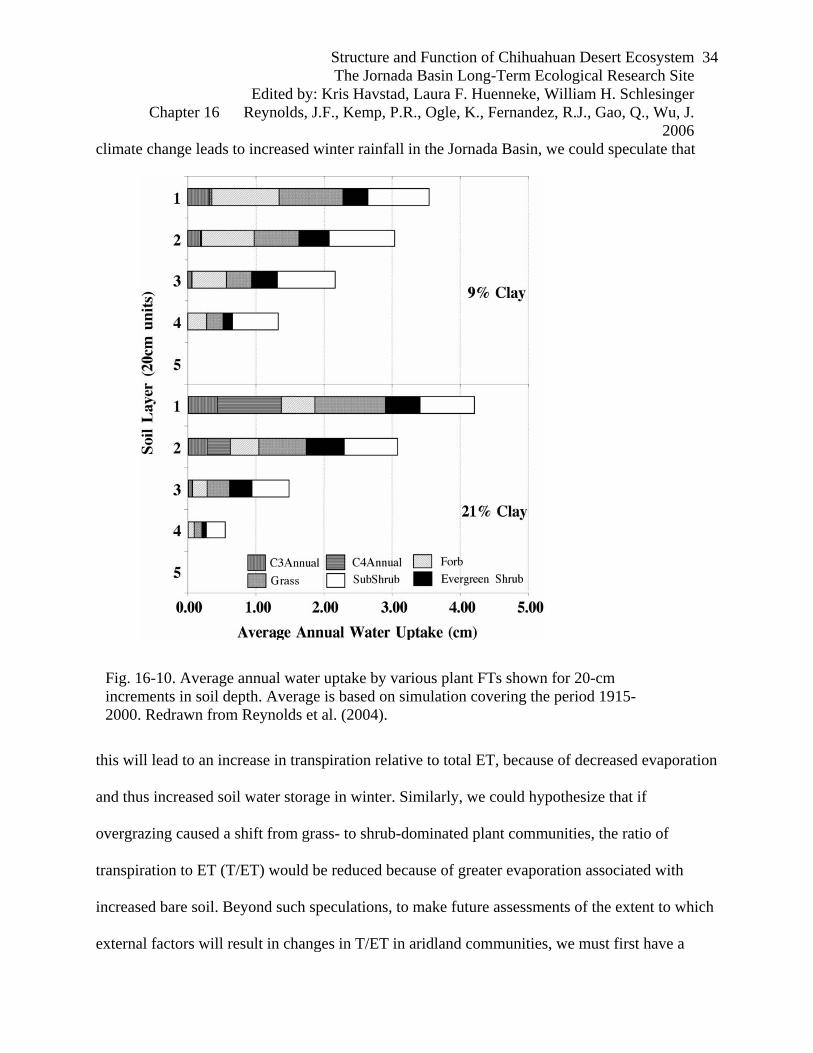
In relation to the two-layer hypothesis of water partitioning, we explored the extent to
which water use by different plant functional types was preferentially derived from upper versus
lower soil layers. Based on long-term simulations using the Jornada Basin rainfall record, we
found that there was a difference in depth of soil water recharge depending on soil texture. For
medium to fine-textured soils (> ~ 18% clay) there was no consistent recharge below 60 cm,
whereas there was consistent (2/3 of years) recharge below 60 cm for coarse-textured soils (< ~
12% clay). Next, we calculated the amount of water transpired from each soil layer by the
various plant functional types for two types of ecosystem patches: one with a coarse (9% clay)
soil and another with a fine-textured (21% clay) soil. These results indicated that there was little
vertical water partitioning among the plant functional types (figure 16-10). For both soil types,
the largest water use was from the top 20 cm, which provided 35% of the water transpired for the
coarse soil and 46% of the water transpired for the fine soil.
Plant Functional Types Are “Drinking from Same Cup”
Indices of water use efficiency of individual plant species or entire communities have been a
useful way to understand the connection between rainfall and production in aridlands (Fischer
and Turner 1978). In principle, plants that use or transpire more of the available soil water
relative to the amount lost as evaporation will have greater production. Hence, external factors—
natural or anthropogenic—that influence the relative partitioning of soil moisture between
transpiration and evaporation can potentially alter community productivity. For example, if
Structure and Function of Chihuahuan Desert Ecosystem The Jornada Basin Long-Term Ecological Research Site
Edited by: Kris Havstad, Laura F. Huenneke, William H. Schlesinger Chapter 16 Reynolds, J.F., Kemp, P.R., Ogle, K., Fernandez, R.J., Gao, Q., Wu, J.
2006
34
climate change leads to increased winter rainfall in the Jornada Basin, we could speculate that
this will lead to an increase in transpiration relative to total ET, because of decreased evaporation
and thus increased soil water storage in winter. Similarly, we could hypothesize that if
overgrazing caused a shift from grass- to shrub-dominated plant communities, the ratio of
transpiration to ET (T/ET) would be reduced because of greater evaporation associated with
increased bare soil. Beyond such speculations, to make future assessments of the extent to which
external factors will result in changes in T/ET in aridland communities, we must first have a
Fig. 16-10. Average annual water uptake by various plant FTs shown for 20-cm increments in soil depth. Average is based on simulation covering the period 1915-2000. Redrawn from Reynolds et al. (2004).

Structure and Function of Chihuahuan Desert Ecosystem The Jornada Basin Long-Term Ecological Research Site
Edited by: Kris Havstad, Laura F. Huenneke, William H. Schlesinger Chapter 16 Reynolds, J.F., Kemp, P.R., Ogle, K., Fernandez, R.J., Gao, Q., Wu, J.
2006
35
good understanding of the natural variability in T/ET, as well as the expected divergence in T/ET
between different community types (e.g., grass- versus shrub-dominated).
To address these latter two questions, we used PALS-FT to examine long-term variability
in plant water use by communities dominated by different plant functional types. We examined
differences in the timing of transpiration and depth of soil water distribution and water uptake
within two ecosystem patch types characteristic of the Jornada Basin: a shrub-dominated patch
(shrub piedmont zone) and a grass-dominated patch (mixed piedmont zone) (see figure 16-3).
Contrary to our expectation of large differences in community water use, the simulation showed
that over a 100-year period, the average T/ET was 34% for both the grass- and shrub-dominated
communities (using Las Cruces, NM, weather data; see Reynolds et al. 2000). On the other hand,
there were large annual differences in total and seasonal transpiration for a particular patch type
and for a given year. This is illustrated in figure 16-11, where for two successive years, 1965 and
1966—with nearly identical total rainfall (177 mm and 167 mm, respectively)—the T/ET values
predicted by PALS-FT for the grass-dominated patch ecosystem were 22% and 32%,
respectively, compared to 33% and 43% for the shrub-dominated patch. These differences are a
function of plant functional type responses to the different distributions of the total rainfall
throughout the two years. Note that, for example, total T/ET increased in the shrub community in
1966 as compared to 1965 (by 10%) whereas total rainfall actually decreased 10 mm!
The availability of soil water to plants depends largely on the inter- and intraseasonal
distributions of the annual precipitation, interacting with the phenological behavior of the plants.
Hence, the species composition of a community can result in relatively different patterns of soil

Structure and Function of Chihuahuan Desert Ecosystem The Jornada Basin Long-Term Ecological Research Site
Edited by: Kris Havstad, Laura F. Huenneke, William H. Schlesinger Chapter 16 Reynolds, J.F., Kemp, P.R., Ogle, K., Fernandez, R.J., Gao, Q., Wu, J.
2006
36
moisture use. For example, a year with a large amount of precipitation in midsummer would
favor growth (transpiration) of C4 grasses and summer annuals, whereas a year with a large
amount of precipitation in winter and early spring would favor evergreen shrubs and winter
annuals. However, over a number of years total water use is apt to be relatively similar in
different communities because differences that favor one or the other tend to balance out. An
important corollary is that we found little evidence of vertical separation of soil water use
between the grass- versus shrub-dominated communities, supporting Hunter’s (1991) analogy for
warm desert systems that most of the plants are “drinking from same cup with different straws,”
but as our simulations show, not always at the same time.
Fig. 16-11. Simulation of plant FT transpiration using PALS-FT for a grass- and shrub-dominated patch (Stations 35 and 65, respectively; see Fig. 16-3). These simulations used daily rainfall for 1965 (177 mm) and 1966 (167 mm), which are years with nearly identical total precipitation. For clarity, only three plant FTs occurring in both patches are shown. Modified from Reynolds et al. (2000).

Structure and Function of Chihuahuan Desert Ecosystem The Jornada Basin Long-Term Ecological Research Site
Edited by: Kris Havstad, Laura F. Huenneke, William H. Schlesinger Chapter 16 Reynolds, J.F., Kemp, P.R., Ogle, K., Fernandez, R.J., Gao, Q., Wu, J.
2006
37
Drought Cycles and Water Use by Plant Functional Types
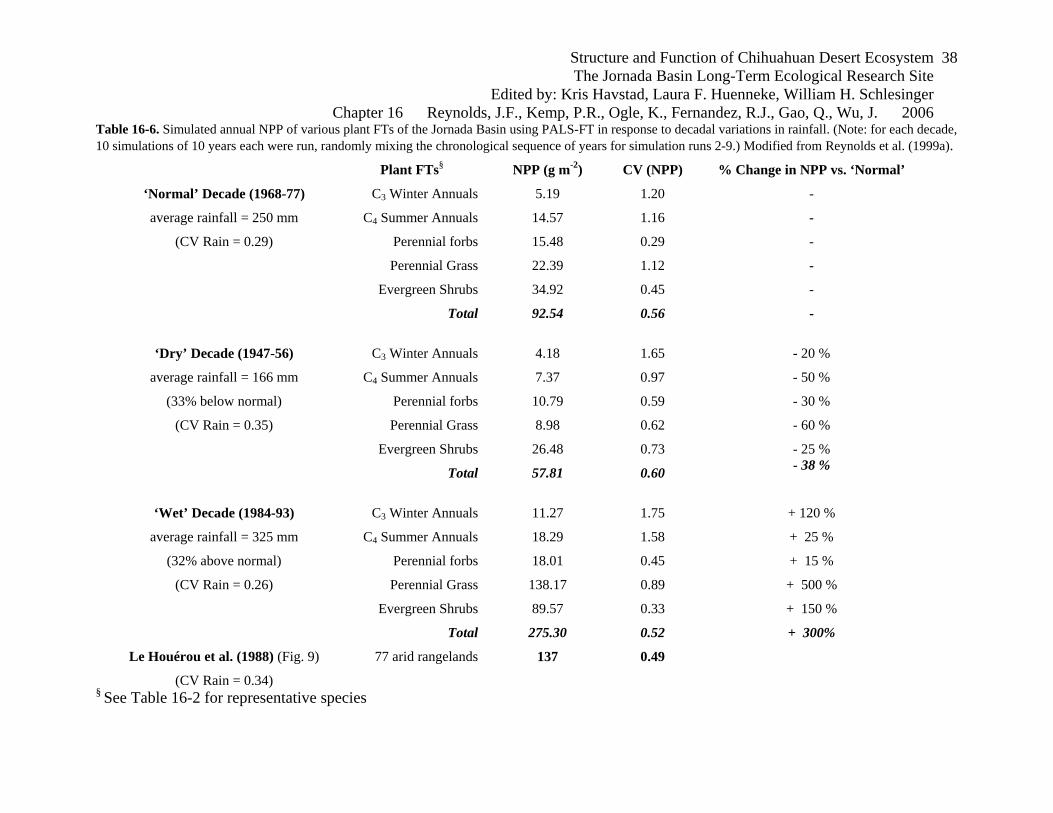
Because the Jornada Basin and other desert regions may be characterized by roughly decadal-
length periods of drought or above average rainfall (Conley et al. 1992; Reynolds et al. 1999a),
we used PALS-FT to further examine the variability in NPP as a function of such natural climate
cycles. From the long-term rainfall records in the Jornada Basin (average annual rainfall = 245
mm), we selected three periods to examine: (1) a normal decade (1968–77, 250 mm average
rainfall), (2) a dry decade (1947–56, 33% below normal or 166 mm), and (3) a wet decade
(1984–93, 32% above average rainfall or 325 mm). In table 16-7 the details of the simulation
schemes employed for each decade are given, as well as a summary of the results (for complete
details, see Reynolds et al. 1999a). The results are also presented in terms of the coefficient of
variation in rainfall and NPP, which facilitates a direct comparison to the study of Le Houerou et
al. (1988).
The dry decade is characterized by somewhat greater reduction in summer rainfall
compared to winter, and simulated NPP of C4 perennial grasses was found to decline by ~ 60%,
whereas NPP of the shrubs declined by only 25% (table 16-7). These results are consistent with
the findings of Gibbens and Beck (1988), who reported that aboveground cover of the principal
range grasses of the Jornada Basin were severely impacted by this dry decade. The wet decade
was a period of slightly increased summer moisture (10%) and greatly increased winter and
spring rainfall (50% and 85% above normal, respectively). The PALS-FT simulations predict
that the C4 perennial grasses would again be most impacted, having a 500% increase in
productivity over this decade (table 16-7). We attribute this to the increased spring rainfall,
which would benefit the simulated production of C4 perennial grasses by providing carryover
Structure and Function of Chihuahuan Desert Ecosystem The Jornada Basin Long-Term Ecological Research Site
Edited by: Kris Havstad, Laura F. Huenneke, William H. Schlesinger Chapter 16 Reynolds, J.F., Kemp, P.R., Ogle, K., Fernandez, R.J., Gao, Q., Wu, J. 2006
38
Table 16-6. Simulated annual NPP of various plant FTs of the Jornada Basin using PALS-FT in response to decadal variations in rainfall. (Note: for each decade, 10 simulations of 10 years each were run, randomly mixing the chronological sequence of years for simulation runs 2-9.) Modified from Reynolds et al. (1999a).
Plant FTs§ NPP (g m-2) CV (NPP) % Change in NPP vs. ‘Normal’
‘Normal’ Decade (1968-77) C3 Winter Annuals 5.19 1.20 -
average rainfall = 250 mm C4 Summer Annuals 14.57 1.16 -
(CV Rain = 0.29) Perennial forbs 15.48 0.29 -
Perennial Grass 22.39 1.12 -
Evergreen Shrubs 34.92 0.45 -
Total 92.54 0.56 -
‘Dry’ Decade (1947-56) C3 Winter Annuals 4.18 1.65 - 20 %
average rainfall = 166 mm C4 Summer Annuals 7.37 0.97 - 50 %
(33% below normal) Perennial forbs 10.79 0.59 - 30 %
(CV Rain = 0.35) Perennial Grass 8.98 0.62 - 60 %
Evergreen Shrubs 26.48 0.73 - 25 %
Total 57.81 0.60 - 38 %
‘Wet’ Decade (1984-93) C3 Winter Annuals 11.27 1.75 + 120 %
average rainfall = 325 mm C4 Summer Annuals 18.29 1.58 + 25 %
(32% above normal) Perennial forbs 18.01 0.45 + 15 %
(CV Rain = 0.26) Perennial Grass 138.17 0.89 + 500 %
Evergreen Shrubs 89.57 0.33 + 150 %
Total 275.30 0.52 + 300%
Le Houérou et al. (1988) (Fig. 9) 77 arid rangelands 137 0.49
(CV Rain = 0.34) § See Table 16-2 for representative species

Structure and Function of Chihuahuan Desert Ecosystem The Jornada Basin Long-Term Ecological Research Site
Edited by: Kris Havstad, Laura F. Huenneke, William H. Schlesinger Chapter 16 Reynolds, J.F., Kemp, P.R., Ogle, K., Fernandez, R.J., Gao, Q., Wu, J.
2006
39
moisture from early spring (when they break dormancy) until midsummer when the normal
monsoon rains usually begin.
Although these results demonstrate significant shifts in plant functional type productivity
and standing biomass, they reveal that the variability in total annual NPP is considerably greater
than the variability in rainfall both within and between decades (table 16-7). The 33% decline in
rainfall during the dry decade resulted in a nearly 40% decline in NPP, whereas the 32% increase
in rainfall during the wet decade caused a 300% increase in NPP. These findings are consistent
with observed productivity measurements reported by Le Houerou et al. (1988) , which suggest
that annual productivity is not linearly related to rainfall (see figure 16-9a). Unlike Le Houerou
et al., by using a simulation model we are able to identify the responses of individual plant
functional types from the total variation; hence, we are able to ascertain the cause of the
variation in total production: namely, some plant functional types have extreme variation in NPP
(e.g., annuals species and grasses), whereas others (e.g., shrubs) are less variable (see discussion
in Reynolds et al. 1999a; figure 16-9b).
What Did We Learn from These Simulations?
First, it is apparent from our simulation studies that a great diversity of plant productivity
responses can be produced by year-to-year variations in precipitation. However, it is
inappropriate to make sweeping statements regarding specific growth responses to rainfall per se
because of pronounced interactive effects between precipitation, soil water, and plant functional
type responses (figure 16-2). Our studies further suggest that for most soil types and in most
seasons, there is little separation of soil water with depth. Thus the coexistence of plant

Structure and Function of Chihuahuan Desert Ecosystem The Jornada Basin Long-Term Ecological Research Site
Edited by: Kris Havstad, Laura F. Huenneke, William H. Schlesinger Chapter 16 Reynolds, J.F., Kemp, P.R., Ogle, K., Fernandez, R.J., Gao, Q., Wu, J.
2006
40
functional types is most directly a function of the divergent abilities of plant functional types to
capitalize on temporal differences in soil moisture availability.
Second, in spite of greatly differing productivity responses of plant functional types to
variable annual rainfall amounts and distribution, our simulations of evapotranspiration over
long-term periods indicated that there was a relatively consistent pattern of total soil water use by
different community types (grass- versus shrub-dominated). This is somewhat unexpected given
our conclusion of differences in specific patterns of productivity (and associated water use) by
the different plant functional types. However, although there are certainly differences in the
specific daily, weekly, or even seasonal patterns of water use associated with different plant
functional type compositions, we conclude that the bulk of the seasonal rainfall will be lost as
evaporation and transpiration via whichever plant functional types are active at the time soil
moisture is available.
Last, our simulations of decadal shifts in total amount of precipitation were, of course,
expected to have relatively strong effects on plant productivity. Indeed, our simulations
demonstrate the expected: that the decade of summer drought impacted summer-active C4
perennial grasses much more than C3 shrubs, or other winter/spring-active plant functional types.
But these simulations also produced a somewhat counterintuitive result: that C4 grasses would
also be most responsive to shifts in late winter or spring rainfall. These findings contrast with a
study at a nearby site in the Chihuahuan Desert, in which Brown et al. (1997) reported that C3
shrubs had the greatest response to increased winter/spring rainfall over nearly the same period
(1979–92) as for our simulation. The shifts in precipitation over this period were apparently
different across the northern Chihuahuan Desert (Brown et al. 1997), suggesting that relatively

Structure and Function of Chihuahuan Desert Ecosystem The Jornada Basin Long-Term Ecological Research Site
Edited by: Kris Havstad, Laura F. Huenneke, William H. Schlesinger Chapter 16 Reynolds, J.F., Kemp, P.R., Ogle, K., Fernandez, R.J., Gao, Q., Wu, J.
2006
41
subtle shifts in seasonal precipitation patterns could elicit relatively large differences in
ecosystem responses across these aridland systems—thus lending support to the hypothesis that a
relatively delicate balance exists between grass- versus shrub-dominated ecosystems, which can
be tipped in part by seasonal shifts in precipitation (Reynolds et al. 1997).
Flowpath Scale
The PALS-FT model has been tested under a range of arid and semiarid environmental
conditions, although it is restricted to small-scale, homogenous patches. To overcome this
limitation, we developed the mosaic arid land simulator (MALS, table 16-1), which is a spatially
explicit adaptation of PALS. We implemented MALS along the LTER transect (figure 16-3) by
dividing the transect into 270 contiguous grid cells, each 10 m long × 30 m wide, where each cell
receives run-in from adjacent uphill cells and loses runoff to adjacent downslope cells. Complete
details of MALS, including a description of our spatially explicit hydrological model, are
provided in Gao and Reynolds (2003).
We used MALS to examine two climate change scenarios considered plausible for the
arid and semiarid regions of the United States (Sheppard et al. 2002): (1) a shift in rainfall
seasonality, to wetter winters and drier summers; and (2) an increase in the number of large
precipitation events. Both of these scenarios have been touted as potentially facilitating shrub
invasion into grasslands; for example, an increase in the number of large precipitation events
increases soil water recharge at deeper layers, which favors deep-rooted shrubs. Details of how
we implemented these scenarios are given in Gao and Reynolds (2003). Here, we focus only on
the importance of runoff and run-in on the impacts of these scenarios on plant production by

Structure and Function of Chihuahuan Desert Ecosystem The Jornada Basin Long-Term Ecological Research Site
Edited by: Kris Havstad, Laura F. Huenneke, William H. Schlesinger Chapter 16 Reynolds, J.F., Kemp, P.R., Ogle, K., Fernandez, R.J., Gao, Q., Wu, J.
2006
42
implementing two versions of MALS: one with and the other without runoff/run-in
redistribution.
We found the effects of runoff/run-in redistribution on plant responses and soil water
dynamics to be generally important and, in several instances, dramatic. In the shifting rainfall
seasonality scenarios (figure 16-12a–c), the presence of runoff/run-in flows partially ameliorated
the decrease in grass and herb biomass with shifts to greater winter precipitation, although the
relative amount of this effect diminishes with a greater shift in rainfall. In the adjusted rainfall
event sizes scenarios (figure 16-12d–f), the presence of runoff/run-in redistribution is generally
much less important. The patterns are similar to shifts in rainfall seasonality but tend to disappear
as larger rainfall events are shifted.
What did we learn from this modeling exercise? Our simulations generally support the
hypothesis that an increase in the number of large precipitation events may favor shrub
establishment and growth although these results are equivocal, depending on what constitutes a
large event and the timing of such events. We found complex interactions among the
amount/seasonality of rainfall and its redistribution in the landscape via run-in and runoff, and
subsequent water availability for growth and reproduction of shrubs versus herbaceous plants at
various landscape positions. These results suggest that a mechanistic understanding of the
linkages between biotic and abiotic factors over the landscape is crucial to predict large-scale
changes in aridlands.

Structure and Function of Chihuahuan Desert Ecosystem The Jornada Basin Long-Term Ecological Research Site
Edited by: Kris Havstad, Laura F. Huenneke, William H. Schlesinger Chapter 16 Reynolds, J.F., Kemp, P.R., Ogle, K., Fernandez, R.J., Gao, Q., Wu, J.
2006
43
Conclusions
Throughout this chapter we have used models to explore the manifestation of discontinuous and
unpredictable rainfall as available soil water, and its effects—at various hierarchical levels—on
Fig. 16-12. Aboveground biomass for grass and herbs (A, D), evergreen shrubs (B, E), and volumetric soil water (C, F). For panels A-C the amount of daily rainfall from October 1 to May 31 each year was increased by 0 percent (observed), 20 percent, 40 percent, and 60 percent, while rainfall from June 1 to September 30 was adjusted, accordingly, to preserve the total observed annual rainfall. For panels D-F, four scenarios that progressively redistribute rainfall into larger-size events while maintaining the total observed rainfall each year (and the ratio of summer to winter/spring precipitation). Results are shown for two versions of the model: with runoff/run-on redistribution (black bars) and without runoff/run-on redistribution (white bars). In the without runoff/run-on redistribution, runoff produced at an individual grid cell (i.e., when precipitation > infiltration) was removed from the system. Redrawn from Gao and Reynolds (2003).

Structure and Function of Chihuahuan Desert Ecosystem The Jornada Basin Long-Term Ecological Research Site
Edited by: Kris Havstad, Laura F. Huenneke, William H. Schlesinger Chapter 16 Reynolds, J.F., Kemp, P.R., Ogle, K., Fernandez, R.J., Gao, Q., Wu, J.
2006
44
the short- and long-term functioning of ecosystems of the Jornada Basin. We now turn to a
consideration of some important caveats.
Natural and human disturbances will continue to affect the Jornada Basin and other
aridecosystems of the globe in unknown and complex ways. In spite of much progress,
significant gaps remain in our knowledge, and as a result, simulation modeling will continue to
play a major role in global change research in aridlands. Although we must rely heavily on
models, they are based on an uneven mixture of facts, assumptions, and conceptualizations.
There is an omnipresent danger that in the absence of full (or even partial) understanding,
untested hypotheses will become incorporated into models and over time be forgotten (or
ignored) with unknown, yet potentially severe consequences.
Such concerns are especially germane for arid ecosystems, which consist of copious slow
processes that may abruptly switch their rates of change in response to changing environmental
drivers. Responding to these and other concerns, we have previously noted that this leads to a
somewhat troubling paradox: in the absence of data and understanding, there tends to be a heavy
reliance on models, the quality of which are in turn highly dependent on the quality and
availability of data and understanding (Reynolds et al. 1996b, 2001).
In spite of these limitations and concerns, we must continue to develop models at local,
regional and global scales to address the questions being posed by resource managers and policy
makers. It is important to recognize that although we should not necessarily trust models to
accurately predict aridland responses to climatic change or other human perturbations, model
simulations can help us understand ecosystem functioning and indicate how sensitive aridlands
may be to projected human impacts. As our knowledge improves, our models will improve.

Structure and Function of Chihuahuan Desert Ecosystem The Jornada Basin Long-Term Ecological Research Site
Edited by: Kris Havstad, Laura F. Huenneke, William H. Schlesinger Chapter 16 Reynolds, J.F., Kemp, P.R., Ogle, K., Fernandez, R.J., Gao, Q., Wu, J.
2006
45
Nevertheless, attempts to predict the future behavior of arid ecosystems are operating at the
frontier of our science and its methods.