structure and dynamics of shock-induced nanobubble ... · structure and dynamics of shock-induced...
TRANSCRIPT

Structure and Dynamics of Shock-Induced Nanobubble Collapse in Water
M. Vedadi, A. Choubey, K. Nomura, R.K. Kalia,* A. Nakano, and P. Vashishta
Collaboratory for Advanced Computing and Simulations, University of Southern California,Los Angeles, California 90089-0242, USA
A.C. T. van Duin
Department of Mechanical and Nuclear Engineering, Pennsylvania State University, University Park, Pennsylvania 16802, USA(Received 8 October 2009; revised manuscript received 1 April 2010; published 1 July 2010)
Shock-induced collapse of nanobubbles in water is investigated with molecular dynamics simulations
based on a reactive force field. We observe a focused jet at the onset of bubble shrinkage and a secondary
shock wave upon bubble collapse. The jet length scales linearly with the nanobubble radius, as observed in
experiments on micron-to-millimeter size bubbles. Shock induces dramatic structural changes, including
an ice-VII-like structural motif at a particle velocity of 1 km=s. The incipient ice VII formation and the
calculated Hugoniot curve are in good agreement with experimental results.
DOI: 10.1103/PhysRevLett.105.014503 PACS numbers: 47.55.dd, 47.11.�j, 47.40.�x
When a bubble interacts with a shock wave, it collapsesbecause the surface tension cannot provide enough restor-ing force. Experimental studies on micron-size bubblesreveal that the impact of a pulsed shock on the proximalside of the bubble shrinks and accelerates it in the directionof the shock propagation. Furthermore, the liquid aroundthe collapsing bubble forms a jet which creates a protrusionand secondary water hammer shock wave when it hits thedistal side of the bubble and breaks up [1]. The behavior ofa collapsing bubble depends on its location relative toobjects embedded in the fluid as well as the shock wavecharacteristics (amplitude and pulse width) and the initialsize of the bubble. Shock-induced bubble collapse phe-nomena have been studied in the context of a single bubble[2–4] as well as multiple bubbles [5] near a rigid boundaryand in confined environments (e.g., microfluidic or lab-on-a-chip systems) [6,7].
Jetting and secondary water hammer shocks can causesignificant damage in materials. This problem is encoun-tered in the disintegration of blades of ship propellers,pipelines, and pump blades [8]. In medicine, however,collapsing bubbles have found useful applications such asextracorporeal shock wave lithotripsy [9] and targeted drugdelivery [10]. In the so-called sonoporation approach, thecollapse of microbubbles generates liquid jets and radialspreading flows [11] that can make the cell membranetransiently permeable to molecular entry. This has poten-tial applications in gene therapy and anticancer drug deliv-ery [12,13].
In this Letter, we report molecular dynamics (MD)simulations of shock-induced collapse of nanobubbles inwater. The MD approach is well suited to study this prob-lem because it can provide direct information about thestructure and dynamics of nanobubble collapse over micro-scopic spatiotemporal scales. Contained in this micro-scopic information are some of the subtle but salient
features of bubble collapse that experiments or continuumsimulations may not be able to capture.The MD simulations reported here are based on
quantum-mechanically informed reactive force fields(ReaxFF), which can accurately describe bond breakingor formation and chemical reactions in the system [14,15].Using a scalable fast reactive force field algorithm(F-ReaxFF) [16,17], we have performed MD simulationsof water subjected to planar shock with and without ananobubble. The initial volume of the MD box is 38:5�18:6� 16:6 nm3 and the system contains N ¼ 106 atoms.We equilibrate the system in the ðN;V; TÞ ensemble withperiodic boundary condition in all directions. The initialmass density and temperature are 0:98 g=cc and T ¼300 K, respectively. After equilibration, we insert nano-bubbles of diameters D ¼ 6, 8, and 10 nm at the center ofthe MD cell by removing 90% of water molecules from thenanobubble spheres; see Fig. S1 (in the supplementarymaterial [18]) [19].These equilibrated systems are then subjected to planar
shocks with particle velocities up ¼ 1:0, 2.5, 3.0, or
3:5 km=s using a momentum mirror (see the inset inFig. 1). In shock simulations we insert a 2-nm-thick vac-uum layer at the end of the MD cell in the x direction(shock direction), turn off the thermostat coupling, andapply periodic boundary conditions in lateral directionsto minimize surface effects normal to the shock direction.The distance between a nanobubble and its nearest mirrorimage ( � 6:6 nm) is much larger than the cutoff length(1 nm) of ReaxFF, which rules out any interaction betweenthe bubble and its images. The integration time step inthese MD simulations is 0.1 fsec.We first performed shock simulations without the nano-
bubble to validate the ReaxFF for water. Figure 1 shows theMD (red circles) and experimental (blue crosses) [20]results for the shock velocity us versus up, i.e., the
PRL 105, 014503 (2010) P HY S I CA L R EV I EW LE T T E R Sweek ending2 JULY 2010
0031-9007=10=105(1)=014503(4) 014503-1 � 2010 The American Physical Society

Hugoniot curve. Shock velocity is obtained from the dif-ference in the shock-front boundaries at two time frames.In each frame, the abrupt change in the density identifiesthe location of the shock front. The simulation results are ingood agreement with the experimental data [20].
Shock produces significant structural changes in water,as shown in Fig. S2 in the supplementary material [18] forthe oxygen-oxygen radial distribution function. The mostinteresting structural changes occur at up ¼ 1 km=s. In the
primary shock region, we find molecular clusters in whicha water molecule has eight nearest neighbors in a body-centered-cubic lattice configuration, indicating the nuclea-tion of ice VII; see Fig. 2. In this ice VII structure, thecentral oxygen atom is connected to four of its nearest-neighbor oxygen atoms through hydrogen bonds [21,22].We do not find an icelike structure at other particle veloc-ities (up ¼ 2:5, 3.0, and 3:5 km=s), which is in agreement
with experimental observations of ice VII only for particlevelocities between 0.75 and 2 km=s [20].
Figure 3(a) shows shock-induced changes in the bubblevolume (normalized by the initial bubble volume) andshape of the bubble for D ¼ 10 nm. The insets show oxy-gen atoms of water molecules at the periphery of thenanobubble before the shock wave strikes the nanobubbleand just before the nanobubble collapses. The volumeversus time data correspond to bubble diameters D ¼ 6,8, and 10 nm and particle velocity up ¼ 3 km=s. The
bubble collapse time � is estimated to be 1.1, 1.4, and1.7 ps for D ¼ 6, 8, and 10 nm, respectively. According to
the Rayleigh formula (� ¼ 0:45Dffiffiffiffiffi
��P
q
, where � is the mass
density and�P is the pressure difference across the bubblesurface), � for the three bubble sizes is 0.8, 1.1, and 1.4 ps.The differences between the MD results and Rayleighformula arise for the following reasons: (1) in Rayleighcollapse it is assumed that the bubble is within a uniform
fluid, whereas the pressure and density around the nano-bubble become nonuniform when the shock front reachesthe nanobubble, and (2) unlike MD simulations, theRayleigh equation does not include viscosity and surfacetension effects arising from interatomic interactions. Itshould be pointed out that we are dealing with cavitationnanobubbles which collapse under large compression (seeFig. S3 in the supplementary material [18]), whereas sur-face gas nanobubbles under small tension or compression(6 MPa) are experimentally found to be stable [23].Figures 3(b) and 3(c) show velocity profiles of water
molecules around a shrinking nanobubble (D ¼ 10 nm) atup ¼ 3 km=s. At t ¼ 3:3 ps the nanobubble has shrunk
significantly but not collapsed completely under shockcompression. The snapshot in Fig. 3(c) is taken immedi-ately after the nanobubble collapses (t ¼ 3:9 ps). Here,contours of the magnitude of velocity are color-codedand each arrow represents the direction and the arrow colorthe magnitude of the average molecular velocity (averagedover all molecules in a voxel of length 0.5 nm) at thatposition. Regions inside the white dashed lines are en-larged in the insets, and the white arrows indicate thedirection of shock propagation. We observe that watermolecules around the top and bottom of the nanobubblechange directions and their average molecular velocitiespoint towards the center of the bubble soon after the shockwave reaches the proximal side of the bubble. This focus-ing feature of high-speed molecules from the onset ofshrinkage to complete collapse of a nanobubble is akin tothe jetting phenomenon observed experimentally in micro-
FIG. 2 (color). Snapshot of a water molecule cluster that formsan ice-VII-like structure in the compressed region at up ¼1 km=s. Red spheres and white spheres represent oxygen andhydrogen atoms, respectively. Dotted lines indicate the direc-tions of nearest-neighbor oxygen atoms (within 3 A from thecentral oxygen atom).
FIG. 1 (color). Experimental (blue crosses) and MD (redcircles) Hugoniot compression curves for up between 0.4 and
3 km=s. The inset shows the simulation cell and the momentummirror (gray plate).
PRL 105, 014503 (2010) P HY S I CA L R EV I EW LE T T E R Sweek ending2 JULY 2010
014503-2
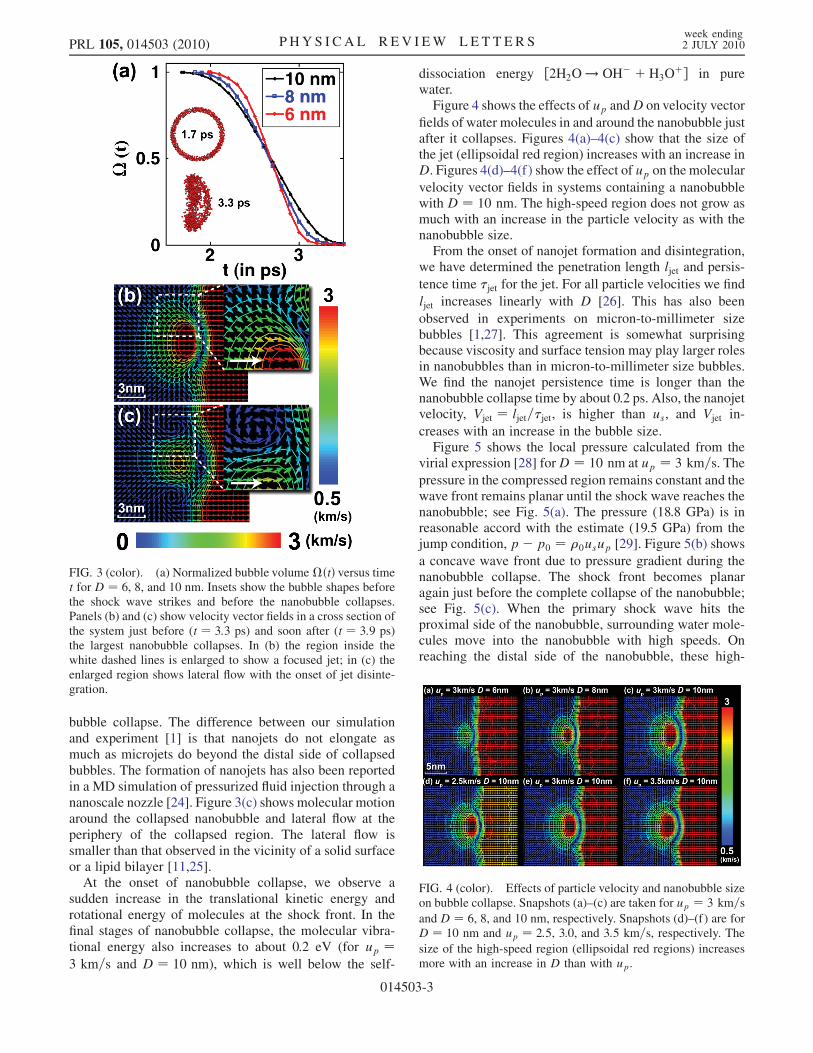
bubble collapse. The difference between our simulationand experiment [1] is that nanojets do not elongate asmuch as microjets do beyond the distal side of collapsedbubbles. The formation of nanojets has also been reportedin a MD simulation of pressurized fluid injection through ananoscale nozzle [24]. Figure 3(c) shows molecular motionaround the collapsed nanobubble and lateral flow at theperiphery of the collapsed region. The lateral flow issmaller than that observed in the vicinity of a solid surfaceor a lipid bilayer [11,25].
At the onset of nanobubble collapse, we observe asudden increase in the translational kinetic energy androtational energy of molecules at the shock front. In thefinal stages of nanobubble collapse, the molecular vibra-tional energy also increases to about 0.2 eV (for up ¼3 km=s and D ¼ 10 nm), which is well below the self-
dissociation energy ½2H2O ! OH� þ H3Oþ� in pure
water.Figure 4 shows the effects of up andD on velocity vector
fields of water molecules in and around the nanobubble justafter it collapses. Figures 4(a)–4(c) show that the size ofthe jet (ellipsoidal red region) increases with an increase inD. Figures 4(d)–4(f) show the effect of up on the molecular
velocity vector fields in systems containing a nanobubblewith D ¼ 10 nm. The high-speed region does not grow asmuch with an increase in the particle velocity as with thenanobubble size.From the onset of nanojet formation and disintegration,
we have determined the penetration length ljet and persis-
tence time �jet for the jet. For all particle velocities we find
ljet increases linearly with D [26]. This has also been
observed in experiments on micron-to-millimeter sizebubbles [1,27]. This agreement is somewhat surprisingbecause viscosity and surface tension may play larger rolesin nanobubbles than in micron-to-millimeter size bubbles.We find the nanojet persistence time is longer than thenanobubble collapse time by about 0.2 ps. Also, the nanojetvelocity, Vjet ¼ ljet=�jet, is higher than us, and Vjet in-
creases with an increase in the bubble size.Figure 5 shows the local pressure calculated from the
virial expression [28] forD ¼ 10 nm at up ¼ 3 km=s. The
pressure in the compressed region remains constant and thewave front remains planar until the shock wave reaches thenanobubble; see Fig. 5(a). The pressure (18.8 GPa) is inreasonable accord with the estimate (19.5 GPa) from thejump condition, p� p0 ¼ �0usup [29]. Figure 5(b) shows
a concave wave front due to pressure gradient during thenanobubble collapse. The shock front becomes planaragain just before the complete collapse of the nanobubble;see Fig. 5(c). When the primary shock wave hits theproximal side of the nanobubble, surrounding water mole-cules move into the nanobubble with high speeds. Onreaching the distal side of the nanobubble, these high-
FIG. 3 (color). (a) Normalized bubble volume�ðtÞ versus timet for D ¼ 6, 8, and 10 nm. Insets show the bubble shapes beforethe shock wave strikes and before the nanobubble collapses.Panels (b) and (c) show velocity vector fields in a cross section ofthe system just before (t ¼ 3:3 ps) and soon after (t ¼ 3:9 ps)the largest nanobubble collapses. In (b) the region inside thewhite dashed lines is enlarged to show a focused jet; in (c) theenlarged region shows lateral flow with the onset of jet disinte-gration.
FIG. 4 (color). Effects of particle velocity and nanobubble sizeon bubble collapse. Snapshots (a)–(c) are taken for up ¼ 3 km=s
and D ¼ 6, 8, and 10 nm, respectively. Snapshots (d)–(f) are forD ¼ 10 nm and up ¼ 2:5, 3.0, and 3:5 km=s, respectively. The
size of the high-speed region (ellipsoidal red regions) increasesmore with an increase in D than with up.
PRL 105, 014503 (2010) P HY S I CA L R EV I EW LE T T E R Sweek ending2 JULY 2010
014503-3

speed molecules give rise to a secondary water ham-mer shock wave with a maximum pressure of 29 GPa[Fig. 5(d)]. The water hammer shock propagates back-ward (opposite to the primary shock), spreading spheri-cally with a velocity of 8 km=s as the pressure decreases;see Figs. 5(e) and 5(f) [30]. Significant pressure amplifi-cation due to secondary water hammer shock wave and itsrapid dissipation have also been observed in experiments[2] and continuum simulations [31].
In conclusion, the F-ReaxFF MD simulations of shockpropagation in water are in good agreement with experi-mental results for the Hugoniot compression curve. Wefind molecular clusters with ice-VII-like structure at parti-cle velocity of 1 km=s. This is well supported by experi-mental observations of ice VII for particle velocitiesbetween 0.75 and 2 km=s. We have examined the effectsof shock amplitude and the initial nanobubble size on thedynamics of nanobubble shrinkage and collapse. Duringshrinkage, we observe a focused nanojet whose lengthscales linearly with the nanobubble radius. This scalingrelation has also been found experimentally in shock-induced collapse of micron-to-millimeter size bubbles.Currently, we are performing multimillion-atomMD simu-lations to examine the effect of nanojets from nanobubblecollapse on lipid bilayers. Our preliminary results indicatethat the nanojet impact creates a transient localized defor-mation of nonuniform width and poration in the lipidbilayer (see the movie and Fig. S4 in the supplementarymaterial [18]). In addition, we observe shear flow of wateron the lipid bilayer (see Fig. S5 in the supplementarymaterial [18]) which has also been reported in experimentson the interaction of cavitation bubbles with cells [11].Transient cell poration has potential applications in genetherapy and drug delivery.
This work was supported by DOE-BES, DOE-SciDAC,NSF-ITR, and NSF-PetaApps grants. Simulations wereperformed at USC’s High Performance ComputingFacility and on our cluster in the Collaboratory forAdvanced Computing and Simulations.
*To whom correspondence should be [email protected]
[1] C. D. Ohl and R. Ikink, Phys. Rev. Lett. 90, 214502(2003).
[2] E. A. Brujan et al., Phys. Fluids 14, 85 (2002).[3] Y. Tomita and T. Kodama, J. Appl. Phys. 94, 2809 (2003).[4] G. N. Sankin and P. Zhong, Phys. Rev. E 74, 046304
(2006).[5] A. Tufaile and J. C. Sartorelli, Phys. Rev. E 66, 056204
(2002).[6] E. Zwaan et al., Phys. Rev. Lett. 98, 254501 (2007).[7] V. S. Ajaev and G.M. Homsy, Annu. Rev. Fluid Mech. 38,
277 (2006).[8] C. E. Brennen, Cavitation and Bubble Dynamics (Oxford
University Press, New York, 1995), p. 282.[9] T. Kodama and K. Takayama, Ultrasound Med. Biol. 24,
723 (1998).[10] T. Kodama, M.R. Hamblin, and A.G. Doukas, Biophys. J.
79, 1821 (2000).[11] C. D. Ohl et al., Appl. Phys. Lett. 89, 074102 (2006).[12] M. Delius and G. Adams, Cancer Res. 59, 5227 (1999).[13] T. Kodama et al., J. Biomech. Sci. Eng. 4, 124 (2009).[14] A. C. T. van Duin et al., J. Phys. Chem. A 105, 9396
(2001).[15] In ReaxFF MD simulations, we find no chemical reactions
during the nanobubble collapse. Consequently, MD simu-lations with simpler force fields (e.g., simple point charge)for water may also capture the nanojet phenomenon.
[16] A. Nakano et al., Comput. Mater. Sci. 38, 642 (2007).[17] K. Nomura et al., Comput. Phys. Commun. 178, 73
(2008).[18] See supplementary material at http://link.aps.org/
supplemental/10.1103/PhysRevLett.105.014503 for thedescription of the reactive force field, the simulation setup,and structural and dynamic correlations of nanobubblecollapse.
[19] The nanobubbles are subjected to shock compression sorapidly (�1 ps) that they do not have time to shrink ontheir own.
[20] A. P. Rybakov and I. A. Rybakov, Eur. J. Mech. B, Fluids14, 323 (1995).
[21] J. D. Jorgensen and T.G. Worlton, J. Chem. Phys. 83, 329(1985).
[22] S. Klotz et al., Nature Mater. 8, 405 (2009).[23] B.M. Borkent et al., Phys. Rev. Lett. 98, 204502 (2007).[24] M. Moseler and U. Landman, Science 289, 1165 (2000).[25] C. D. Ohl et al., Biophys. J. 91, 4285 (2006).[26] For example, we find that ljet increases from 7.8 to 14.7 nm
as R increases from 3 to 5 nm.[27] T. Kodama and Y. Tomita, Appl. Phys. B 70, 139 (2000).[28] Z. H. Sun et al., Model. Simul. Mater. Sci. Eng. 14, 423
(2006).[29] Z. U. A. Warsi, Fluid Dynamics: Theoretical and
Computational Approaches (CRC Press, Boca Raton,FL, 1998), p. 752.
[30] Snapshots in Fig. 5 show that the water hammer shock isnot close to the lateral boundaries and so the interactionbetween mirror-image waves is negligible.
[31] E. Johnsen and T. Colonius, J. Acoust. Soc. Am. 124, 2011(2008).
FIG. 5 (color). Panel (a)–(c) show the primary shock wave att ¼ 1:6, 2.9, and 3.3 ps, respectively. Here, up ¼ 3 km=s and
D ¼ 10 nm. Panels (d)–(f) show the secondary water hammershock at t ¼ 3:5, 3.7, and 3.9 ps, respectively. The color codecorresponds to pressure.
PRL 105, 014503 (2010) P HY S I CA L R EV I EW LE T T E R Sweek ending2 JULY 2010
014503-4