structural studies of saccharomyces cerevisiae v … · · 2012-11-03structural studies of...
TRANSCRIPT

Structural studies of Saccharomyces cerevisiae V1-ATPase in the stationary phase of yeast cell culture
Jana Tuhman-Mushkin
A thesis submitted in conformity with the requirements for the degree of Master of Science
Biochemistry Department University of Toronto
© Copyright by Jana Tuhman-Mushkin 2012

ii
Structural studies of Saccharomyces cerevisia
V1-ATPase in the stationary phase of yeast cell culture
Jana Tuhman-Mushkin
Master of Science
Biochemistry Department University of Toronto
2012
Abstract
Vacuolar-type ATPases (V-ATPases) are ubiquitous membrane-bound protein complexes
present in the endo-membrane system of all eukaryotic cells. In eukaryotic cells, the reversible
dissociation of the V1 and Vo regions is an essential mechanism for regulating V-ATPase activity.
Therefore, knowledge of the structure of the dissociated V1-ATPase is necessary for understanding
the regulation of V-ATPase activity. In this thesis, I showed that by introducing a 3xFLAG tag at the
C terminus of different V1-ATPase subunits, highly purified V1-ATPase complex could be isolated.
Electron cryomicroscopy (cryo-EM) was used for initial analysis of the intact V1-ATPase. In
addition to the intact complex, partial V1-ATPase subcomplexes with different subunit compositions
were isolated from yeast cells in late log phase. All of the isolated subcomplexes were found to
contain the major V1-ATPase subunits A and B, but differed in the peripheral stalk subunit
composition.

iii
Acknowledgment
I would like to thank my lab members (Michael Latham, Samir Benlekbir, Lindsay Baker, Wilson
Lau, Jianhua Zhao, Shawn Keating, and Stephanie Bueler) for their support and encouragement.
Stephanie, our noble lab administrator, was particularly helpful by consistently demonstrating
patience, availability, extensive biochemistry knowledge and electron microscopy techniques.
I also want to thank Dr. Trevor Moraes, Dr. James Rini, and Dr. Simon Sharpe—my committee
members. Dr. Sharpe gave me excellent instructions for managing my project, helping me
overcome problems and pointing me in the right direction. Dr. Moraes provided me with regular
constructive support and feedback, in addition to enthusiastically guiding me through the labyrinth
of graduate work.
Dr. John Rubinstein, my supervisor, guided my project through its inevitable difficulties. Not only
was he available at all hours to answer my frequent questions, but he was understanding and patient
throughout this process. He taught me a great deal about electron microscopy; in addition, he
demonstrated compassion when I had to deal with various personal issues.
Finally, I want to thank my family. My parents taught me from an early age how to study, to be
passionate about knowledge, curious about discovery, and to go after my dreams. Shanie, my young
daughter, gave me her light and love about life, giving me hugs and laughter after each day. Kosta,
my husband, gave me a lot of love, support, encouragement, and belief that I can accomplish my
goals. Without him, this project would have been impossible.

iv
Table of Contents
Abstract ................................................................................................................................ ii
Acknowledgment .................................................................................................................iii
Table of Contents ................................................................................................................ iv
List of Abbreviations ......................................................................................................... viii
CHAPTER 1. Introduction................................................................................................. 1
1.1 THE ROLE OF V-ATPases IN CELLULAR PROCESSES .................................................. 1
1.1.1 Functions of V-ATPases in Normal Cell Processes ................................................... 2
1.1.2 Functions of V-ATPases in Disease Processes........................................................... 5
1.2 OVERALL STRUCTURE AND MECHANISM OF THE ROTARY MOTOR OF V-
ATPase ................................................................................................................................. 5
1.2.1 Mechanisms of Regulation of the V-ATPase Activity ............................................... 9
1.3 ELECTRON MICROSCOPY AND IMAGE ANALYSIS .................................................. 11
1.3.1 Techniques in structural biology.............................................................................. 11
1.3.2 Electron microscopy ............................................................................................... 11
1.3.3 Negative Stain Electron Microscopy ....................................................................... 13
1.3.4 Electron Cryomicroscopy ........................................................................................ 14
1.3.5 Image analysis ........................................................................................................ 15
1.4 RATIONALE AND OBJECTIVES .................................................................................... 16
CHAPTER 2. Materials and methods............................................................................... 17
2.1 MATERIALS ..................................................................................................................... 17
2.1.1 Chemicals ............................................................................................................... 17
2.1.2 Reagents and kits used for molecular biology .......................................................... 17
2.1.3 Bacterial and Yeast growth media ........................................................................... 17

v
2.1.4 Vectors, bacterial strains and yeast strains ............................................................... 18
2.2 STANDARD BIOCHEMICAL TECHNIQUES ................................................................. 20
2.2.1 Denaturing polyacrylamide gel electrophoresis (PAGE) .......................................... 20
2.2.2 SDS-PAGE Coomassie staining .............................................................................. 20
2.2.3 SDS-PAGE silver staining ...................................................................................... 20
2.2.4 Native polyacrylamide gel electrophoresis (PAGE) ................................................. 21
2.2.5 DNA agarose gel electrophoresis ............................................................................ 21
2.2.6 Chromatography ..................................................................................................... 22
2.3 PLASMID AND VECTOR CONSTRUCTION .................................................................. 22
2.3.1 DNA restriction enzyme digestion........................................................................... 22
2.3.2 Oligonucleotides annealing ..................................................................................... 23
2.3.3 DNA ligation .......................................................................................................... 24
2.3.4 Bacterial transformation and plasmid amplification ................................................. 24
2.4 YEAST STRAIN CONSTRUCTION AND CONFIRMATION ......................................... 25
2.4.1 PCR of linear DNA for yeast transformation ........................................................... 25
2.4.2 Yeast Transformation .............................................................................................. 27
2.4.3 Yeast Chromosomal DNA Isolation ........................................................................ 28
2.4.4 Confirmation of transformed fragments ................................................................... 29
2.4.5 Yeast growth assay ................................................................................................. 30
2.4.6 Purification of 3xFLAG Tagged Yeast V1-ATPase.................................................. 30
2.5 SPECIMEN PREPARATION FOR ELECTRON MICROSCOPY ..................................... 31
2.5.1 Preparation of continuous carbon film coated EM grids .......................................... 31
2.5.2 Preparation of holey carbon film coated EM grids ................................................... 31

vi
2.5.3 Negative staining of protein particles ...................................................................... 32
2.5.4 Preparation of protein particles in amorphous ice .................................................... 32
2.6 ELECTRON MICROSCOPY ............................................................................................. 33
2.7 IMAGE ANALYSIS .......................................................................................................... 33
CHAPTER 3. Results ...................................................................................................... 34
3.1 3xFLAG VECTOR CONSTRUCTION .............................................................................. 34
3.2 Vma1 - 3xFLAG STRAIN CONSTRUCTION .................................................................. 35
3.3 PURIFICATION AND ISOLATION OF INTACT V1-ATPase VIA Vma1 - 3xFLAG ...... 37
3.4 V1-ATPase REGION PURIFICATION USING DIFFERENT CELL CULTURE
DENSITIES ....................................................................................................................... 40
3.5 IMAGING OF INTACT V1-ATPASE BY NEGATIVE STAIN ELECTRON
MICROSCOPY .................................................................................................................. 41
3.5.1 Negative stain image 2D analysis ............................................................................ 41
3.6 IMAGING OF INTACT V1-ATPASE IN AMORPHOUS ICE ........................................... 44
3.6.1 Cryo-EM 2-D image analysis ................................................................................ 45
3.7 Stabilization of intact V1-ATPase for cryo-EM ................................................................... 46
3.7.1 Detergent DDM ...................................................................................................... 46
3.7.2 Cold denaturation .................................................................................................... 46
3.7.3 Chemical cross-linking ............................................................................................ 46
3.8 ISOLATION AND CHARACTERIZATION OF PARTIAL V1-ATPASE COMPLEXES
IN THE LATE LOG PHASE OF YEAST GROWTH......................................................... 49
3.8.1 Vma4, 5, 7 and 13 – 3xFLAG yeast strain construction and purification of the
corresponding partial complexes ............................................................................. 49
3.8.2 Characterization of partial V1-ATPase complexes by gel – filtration
chromatography ...................................................................................................... 52
3.8.3 Characterization of partial V1-ATPase complexes by SDS-PAGE ........................... 53

vii
CHAPTER 4. Discussion and Conclusion ........................................................................ 58
4.1 ISOLATION OF THE INTACT V1-ATPase....................................................................... 58
4.2 STRUCTURAL STUDIES ON THE INTACT ................................................................... 59
V1-ATPase ................................................................................................................................ 59
4.3 ISOLATION OF PARTIAL V1-ATPase SUBCOMPLEXES.............................................. 62
4.4 FUTURE DIRECTIONS .................................................................................................... 65
CHAPTER 5. References ................................................................................................ 67

viii
List of Abbreviations
2D two - dimensional
3D three – dimensional
xg times the force of gravity
ATP adenosine 5‘-triphosphate
ADP adenosine 5‘-diphosphate
Asc1 restriction enzyme
BSA bovine serum albumin
C. albicans Candida albicans
C-terminus carboxyl-terminus
Cu copper
cryo-EM electron cryomicroscopy
DNA deoxyribonucleic acid
DMSO dimethyl sulfoxide

ix
DDM n-dodecyl beta-D-maltoside
EDTA ethylene diamine tetraacetic acid
E. coli Escherichia coli
EB expansion buffer
EM electron microscopy
F1 soluble region of F-type ATP synthase
Fo membrane-bound region of F-type ATP synthase
FEG field emission gun
FLAG polypeptide protein tag
FRET Förster Resonance Energy Transfer/ Fluorescence Resonance Energy Transfer
in vivo within the living
LiOAc lithium acetate
LB liquid media Luria-Bertani
NMR nuclear magnetic resonance spectroscopy
NEB New England Biolaboratories

x
Native-PAGE native, non-denaturing polyacrylamide gel electrophoresisPCR
polymerase chain reaction
Pa pascal pressure unit, 10-5
bar
PAGE polyacrylamide gel electrophoresis
P. shermani Propionic shermani
Pac1 restriction enzyme
PEG polyethylene glycol
RT room temperature
RAVE regulator of the ATPase of vacuolar and endosomal membranes
Rh rhodium
rpm revolutions per minute
SDS-PAGE sodium dodecyl sulfate polyacrylamide gel electrophoresis
SD-URA synthetic defined dropout, uracyl marker selection
SDS sodium dodecyl sulphate
SOC super optimal broth medium with glucose
S. cerevisiae Saccharomyces cerevisiae
xi
TEM transmission electron microscope
Tris tris (hydroxymethyl) aminomethane
TBE tris, borate, EDTA
TE tris, EDTA
TE/LiOAc tris, EDTA, lithium acetate
UV ultraviolet light
URA3 gene that encodes orotidine 5-phosphate decarboxylase
v/v volume/volume
V-ATPase vacuolar ATPase
V1-ATPase soluble region of vacuolar ATPase
Vo-ATPase membrane-bound region of vacuolar ATPase
w/v weight/volume
YPD yeast extract peptone dextrose
YEPD yeast extract, peptone 2 %, dextrose medium

1
CHAPTER 1. Introduction
1.1 THE ROLE OF V-ATPases IN CELLULAR PROCESSES
The regulation of intracellular pH plays a crucial role in cellular homeostasis and
survival. Many biological processes, such as protein trafficking, protein degradation and
transport of small molecules are sensitive to pH changes (Schwartz 1990; Fuller et al 1989).
Different cellular compartments have specific pHs necessary for their function. Protein
trafficking and processing are disrupted when the luminal pH of one or more compartments is
changed (Carnell and Moore 1994; Missiaen et al 2004). The secretory proteins that are
transferred to different compartments undergo several maturation steps due to decreasing
compartmental pH (Kim et al 1998; Demaurex et al 1998). The disruption of the pH gradient
from cis - Golgi to the trans - Golgi membranes impedes processing of secreted proteins and
posttranslational modification (Carnell 2004). In addition, the modification of the pH of
secretory compartments has also been found in tumors and papillomas (Weisz 2003;
Kellokumpu et al 2002). The mechanisms that regulate the specific pH of different
compartments remain unclear. However, it is well established that vacuolar-ATPases (V-
ATPases) play an important role in these pH regulatory processes (Nelson and Harvey 1999).
V-ATPases are ubiquitous membrane-bound protein complexes that comprise a family
of ATP-driven proton pumps (Boekema et al 1999, Wilknes et al 1999; Wilknes et all ). V-
ATPases were first identified in vacuolar membranes of fungi and plants (Bowman and
Bowman 1982; Ward and Lai 1992), leading to the somewhat misleading name of vacuolar
ATPases. V-ATPases generate an electrochemical gradient across membranes by coupling ion

2
transport with adenosine triphosphate (ATP) hydrolysis. Isolation of eukaryotic V-ATPase
from the yeast Saccharomyces cerevisiae (Ohsumi and Anraku 1985) provided detailed
insight into its structural and biochemical properties (Al-Awqati 1986; Nelson 1990).
Currently, it is well established that V-ATPases are present in the endo-membrane system of
all eukaryotic cells (for example, vacuoles, lysosomes and endosomes) and play an essential
role in the acidification of intracellular space (Nelson and Harvey 1999; Jefferies et al 2008;
Chumacher and Krebs 2010). V-ATPases are also present in the plasma membrane of some
specialized cells (Forgac 1999; Rojas et al 2006) and have been implicated in a large number
of health related issues, including osteoporosis, and tumour invasion and metastasis (Yuan et
al 2010; Toei et al 2010).
1.1.1 Functions of V-ATPases in Normal Cell Processes
V-ATPase activity is essential for acidification of vacuoles, lysosomes, endosomes
and the Golgi apparatus (Nishi and Forgac 2002). This acidification affects diverse processes
including protein sorting and degradation, overall ion homeostasis, and protection of cells
from oxidative stress (Kakinuma et al 1981; Moriyam et al 1992). In Figure 1.1 various roles
of V-ATPases have beenshown. For example, in the sorting endosome, V-ATPases acidify the
endosome, which allows the release of internalized ligands, such as transferin or low density
lipoprotein, from their receptors (Johnson et al 1993). The released ligand is delivered by
endosomal carrier vesicles from sorting endosomes to later endosomal compartments, a
process that requires the low pH established by V-ATPase (Gu and Gruenberg 2000). Also,
the acidification of the lysosome by V-ATPases is responsible for the degradation of proteins
(Nishi and Forgac 2002). Finally, the acidification of secretory vesicles by V-ATPases is

3
required for the transport of neurotransmitters into the vesicles and is therfore necessary for
endocrine function.
The localization of V-ATPases to the plasma membrane is important in cell-specific
functions such as renal acidification, sperm maturation, and dissolution and resorption of bone
minerals (Chatterjee et al, 1992). Figure 1.1 B shows a summary of the normal processes in
which V-ATPases at the plasma membrane are involved. For instance, in the proximal tubule
cells of the kidney, V-ATPases are involved in the regulation of acid-base balance of the
organism by controlling the proton secretion and absorption of bicarbonate (Brown and
Breton 2000). V-ATPases, in the apical membrane ofα-intercalated cells, secrete acid into the
urine (Wagner et al 2004). Plasma membrane V-ATPases in osteoclasts play an essential role
in bone resorption by creating the low pH necessary to dissolve the inorganic bone material
and to degrade the organic bone matrix (Toyomura et al 2003). In the apical membrane of
clear cells in the epididymus, V-ATPases preserve the acidic pH of seminal fluid, a property
crucial for the maturation and storage of sperm.

4
Figure 1.1. A summary of cell processes in which V-ATPases are involved. (A) In
endomembrane systems, acidification of the endosome by the V-ATPase allows for the
release of ligands and the recycling of receptors. Budding of endosomal carrier vesicles and
multivesicular bodies is also dependent on the acidic environment. Lysosomal proteins are
synthesized in the trans - Golgi network and are trafficked to the lysosome. V-ATPases are
necessary for the secretion of neurotransmitters and other molecules by secretory vesicles.
Acidification of the late endosome allows for the release of the lysosomal proteins. (B) In the
apical membrane of the renal alpha-intercalated cells, V-ATPases secrete protons into the
lumen of collecting ducts. In the plasma membrane of osteoclasts, V-ATPases are involved in
bone resorption. In epididymal clear cells, plasma membrane V-ATPases decrease the pH of
the lumen, a process that is required for sperm maturation (figure adapted from Jefferies et al
2008).
A
5
1.1.2 Functions of V-ATPases in Disease Processes
V-ATPases have been implicated in various disease processes. Defective V-ATPase
activity in the plasma membrane of osteoclasts leads to osteopetrosis, which is characterized
by developmental defects resulting from the inability to degrade and remodel bone (Kartner et
al 2010). Increasing evidence suggests that V-ATPases are targeted to the plasma membrane
at a high concentration in many types of metastatic cancer cells (Forgac 2007). Such studies
have established that plasma membrane V-ATPases cause extracellular acidification. An
acidic tumour extracellular microenvironment can contribute to degradation of the
surrounding tissue, which leads to cancer invasion and metastasis. Recently, V-ATPase was
found in high concentrations in breast cancer cells and inhibition of V-ATPase activity was
shown to decrease cancer invasion and, consequently, may point the way to improved disease
therapy (Hinton et al 2009).
1.2 OVERALL STRUCTURE AND MECHANISM OF THE ROTARY MOTOR OF V-ATPase
There is evidence that the structure of V-ATPases may differ from species to species
(Perzov et al 2001). A complete picture of the molecular structure of this enzyme is now
emerging, but important features, especially the structure of the peripheral stators, are still the
subject of ongoing investigations. Table 1 describes the nomenclature of different V-ATPase
subunits.
The vacuolar-ATPases are evolutionarily related to F-type ATPase synthases (Cross
and Müller 2004). This close relationship was shown by sequence homology between
subunits (Mandel et al 1988; Manolson et al 1988; Nelson and Nelson 1989). The structure

6
and ATP-driven proton pumping mechanism of V-ATPase is similar to that of the F-type ATP
synthase. Both enzymes are found in eukaryotic cells, but F-type ATP synthases are localized
to mitochondria and chloroplasts, whereas V-ATPases are found in most intracellular
membranes.
Table 1. Subunit nomenclature and function for V-ATPase in comparison to F-type
ATPase synthases (see Figure 1.2).
Subunit
name in V1-
ATPase
Molecular
weight
(kDa)
Yeast gene
subunit name
F-type ATPase
synthase
homologue
Subunit Function
A 70 VMA1 Β Catalytic site regulation
B 60 VMA2 Α Non –catalytic
C 45 VMA5 - Peripheral stalk
D 30 VMA8 Γ Central stalk
E 27 VMA4 Peripheral stalk
F 14 VMA7 Ε Central stalk
G 12 VMA10 Peripheral stalk
H 55 VMA13 - Peripheral stalk
Subunit
name in Vo-
ATPase
Molecular
weight
(kDa)
Yeast gene
Subunit
name
F-type ATPase
synthase
homologue
Subunit Function
A 110 VPH1(vacuole) STV1(golge)
a H+ transport,targeting
d 40 VMA6 - Central stalk
e 10 VMA9 - Unknown
c 17 VMA3 c H+ transport
c' 17 VMA11 c H+ transport
c'' 21 VMA16 c H+ transport

7
The F- and the V-type ATPases are composed of a membrane-bound Fo/Vo region,
which contains the proton translocation channel, a central connecting stalk, and a soluble
F1/V1 region that contains the catalytic sites. All these enzymes have one or more peripheral
stalks that connect the V1/F1 region to the Vo/Fo region. Despite their similarities, these two
types of ATPases differ in the number and structure of their peripheral stalks. The exact
arrangement of the peripheral stalks in V-type ATPases is still unclear (Figure 1.2) (Li and
Zhang 2004).
The eukaryotic V-ATPases are ~900 kDa protein complexes (Forgac et al 2007). The
soluble V1 region is a ~600 – 650 kDa complex and is composed of eight different subunits
(A, B, C, D, E, F, G, H) in a stoichiometry of A3B3CDE3FG3H, as determined by quantitative
amino acid analysis (Arai et al 1988; Xu et al 1999). The Vo region is a ~260 kDa membrane-
integral complex containing six different subunits (a, d, e, c, c', c'') with a stoichiometry that is
probably ac4c′c″de (Arai et al 1988; Powell et al 2000).
The core of the V1 region is composed of a hexamer of alternating A and B subunits
(Zhang et al 2003). Binding and hydrolysis of ATP occurs at three of the six interfaces
between the A and B subunits. Catalytic ATP binding sites are located primarily in the A
subunits, whereas the B subunits contain nucleotide binding sites with a modulatory role. The
Vo region includes a ring of proteolipid subunits (c, c' and c") that are adjacent to the a and e
subunits (Wilkens and Forgac 2001). The multiple peripheral stalks are composed of subunits
C, E, G, H and serve as stators preventing the rotation of the rotor A3B3 subcomplex relative
to Vo during ATP hydrolysis (Figure 1.2 A).

8
Figure 1.2. V-ATPase structure and comparison with F-type ATP synthases: (A) The
V1 region of V-ATPases consists of the A, B, C, D, E, F, G and H subunits, whereas the
Vo region consists of the a subunit, c-ring (subunits c, c', and c"), d subunit, and e subunit.
The rotor part of the proton-pumping machine is formed by the c-ring, the d subunit, and
the D and F subunits, which are coloured blue, whereas the ATP-hydrolysing A3B3
motor is shown in green and red. The E/G peripheral stalk structures are shown in yellow
and orange and the a, C and H subunits of the membrane proximal base structure are
shown in gray. (B) A schematic representation of F-type ATP synthase shown for
comparison. Subunits that are homologous to V-ATPase subunits are shown in the same
colour (figure adapted from Boesen and Nissen, 2009).

9
1.2.1 Mechanisms of Regulation of the V-ATPase Activity
Since V-ATPases are involved in a multitude of physiological processes (see above),
their activity and localization is tightly controlled and regulated by different intracellular
mechanisms. The localization of V-ATPases is regulated in specialized cells, such as
epidermal clear cells, renal collecting duct cells, and intercalated cells, through the utilization
of specific subunit isoforms (Toei et al 2010). Studies in yeast show that reversible formation
of a disulfide bond between cysteine residues in the catalytic site of the A subunit of the V1
region can prevent hydrolysis of ATP (Forgac, 1999). For example, approximately half of V-
ATPases in native clathrin-coated vesicles exists in this disulfide-bonded non-catalytic state
(Feng and Forgac 1992).
In addition to the regulatory mechanism described above, in eukaryotic cells, the
reversible dissociation of the V1 and Vo regions regulates V-ATPase complex activity (Kane
1995). Once dissociated, the V1 region loses its ATPase activity while the isolated Vo region
does not allow protons to cross the membrane (Saroussi 2009). It has recently been shown
that this process occurs during conditions such as glucose depletion, basic extracellular pH,
exposure to heavy metals and a variety of drugs (Nishi and Forgac 2002). Several proteins
and protein complexes are involved in the dissociation and re-association of the V1 and Vo
regions. For instance, in the yeast, S. cerevisiae, dissociation is driven by the interaction of the
V-ATPase with aldolase (Lu et al 2001), whereas the assembly between V1 and Vo is
promoted by the RAVE complex (Figure 1.3). The RAVE complex is composed of three
proteins Rav1p, Rav2p, and Skp1, and was shown to bind to subunits E, G and C of the V1
region (Smardon et al 2002). The dissociation has been best characterized in yeast, where it
occurs rapidly, on the order of a few minutes, reversibly and without the synthesis of new
proteins (Smardon and Kane 2007). It was also shown that the C-subunit of the V1 region,
10
which is part of the peripheral stalk, is released from V1-ATPase upon the dissociation of the
V1 region from the Vo region and represents another regulatory mechanism. However, there
are still many unanswered questions about the dissociation process, such as, does the V1-
ATPase remain intact after disassembly from the Vo region?
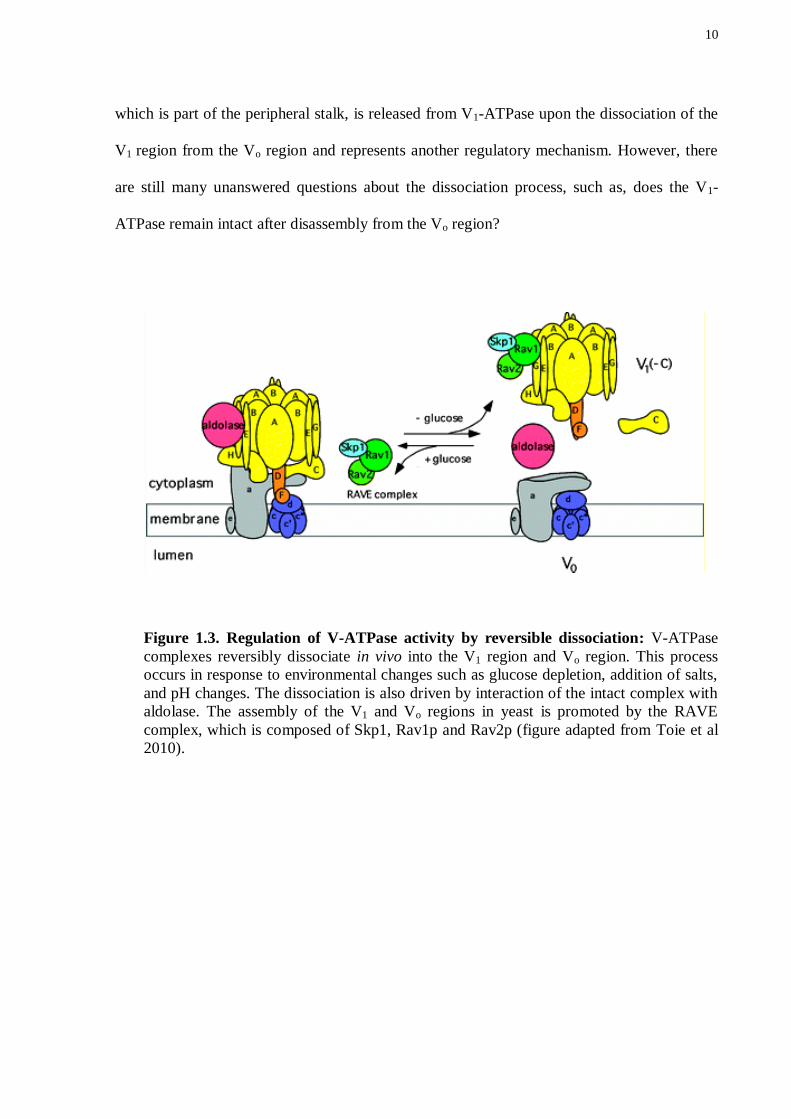
Figure 1.3. Regulation of V-ATPase activity by reversible dissociation: V-ATPase
complexes reversibly dissociate in vivo into the V1 region and Vo region. This process
occurs in response to environmental changes such as glucose depletion, addition of salts,
and pH changes. The dissociation is also driven by interaction of the intact complex with
aldolase. The assembly of the V1 and Vo regions in yeast is promoted by the RAVE
complex, which is composed of Skp1, Rav1p and Rav2p (figure adapted from Toie et al
2010).
11
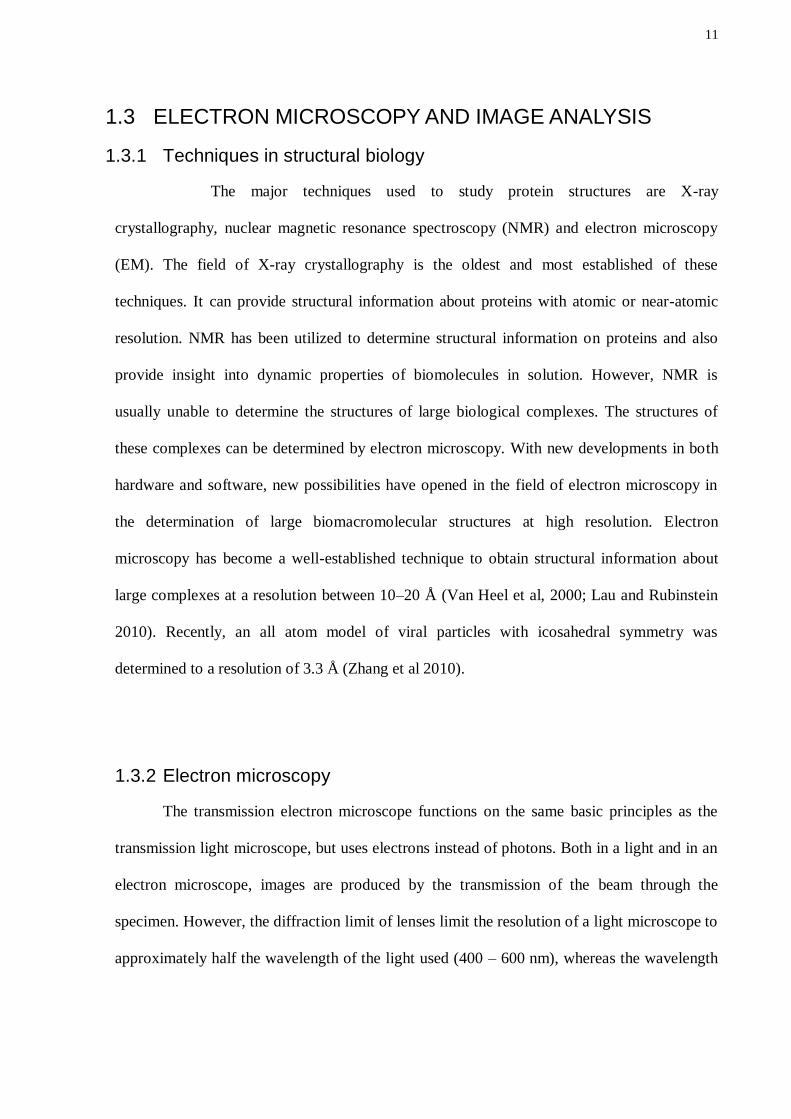
1.3 ELECTRON MICROSCOPY AND IMAGE ANALYSIS
1.3.1 Techniques in structural biology
The major techniques used to study protein structures are X-ray
crystallography, nuclear magnetic resonance spectroscopy (NMR) and electron microscopy
(EM). The field of X-ray crystallography is the oldest and most established of these
techniques. It can provide structural information about proteins with atomic or near-atomic
resolution. NMR has been utilized to determine structural information on proteins and also
provide insight into dynamic properties of biomolecules in solution. However, NMR is
usually unable to determine the structures of large biological complexes. The structures of
these complexes can be determined by electron microscopy. With new developments in both
hardware and software, new possibilities have opened in the field of electron microscopy in
the determination of large biomacromolecular structures at high resolution. Electron
microscopy has become a well-established technique to obtain structural information about
large complexes at a resolution between 10–20 Å (Van Heel et al, 2000; Lau and Rubinstein
2010). Recently, an all atom model of viral particles with icosahedral symmetry was
determined to a resolution of 3.3 Å (Zhang et al 2010).
1.3.2 Electron microscopy
The transmission electron microscope functions on the same basic principles as the
transmission light microscope, but uses electrons instead of photons. Both in a light and in an
electron microscope, images are produced by the transmission of the beam through the
specimen. However, the diffraction limit of lenses limit the resolution of a light microscope to
approximately half the wavelength of the light used (400 – 600 nm), whereas the wavelength
12
(0.0037 nm) makes it possible to obtain a higher resolution interaction with an electron
microscope than with a light microscope.
The contrast in images is proportional to the cross-section of interaction between the
electron beam and the specimen. This cross section is determined by the average atomic
number of the atoms in the specimen. Low contrast is a major disadvantage in the imaging of
biological specimens, which mainly consist of atoms with low atomic numbers (carbon,
nitrogen, oxygen, and hydrogen). However, it is possible to image biological molecules with
higher contrast by surrounding the molecules with materials of high atomic number during
specimen preparation (see below).
Biological samples are radiation sensitive, and are damaged by illumination with the
high-energy electron beam. The radiation dose experienced by the specimen during imaging
can cause structural damage, such as covalent bond breakage, mass loss and shrinkage. In
order to reduce specimen damage, minimal exposure times to the electron beam are required
(Glaeser and Taylor 1978). Therefore, a low exposure in the ranges between 10 - 100
electrons Å2 is typically used to image biological samples (Amos et al 1982). However,
imaging with such a low exposure causes a low signal-to-noise ratio in images and requires
computational processing in order to calculate average images from a number of images of
different complexes. Negative staining and electron cryomicroscopy followed by
computational single particle image analysis are used to obtain and resolve structural
information on biological molecules with high resolution (Frank 2009).
13
1.3.3 Negative Stain Electron Microscopy
The negative stain effect was first unintentionally discovered in a study in which
particles were stained with phosphotungstic acid (Hall 1955). Later, the same effect with
tobacco mosaic virus was also observed through an experiment to intentionally create this
effect and was named "negative staining" (Brenner et al. 1959).
In negative staining, biological samples adsorbed to carbon support films are
visualized with an electron microscope after surrounding the material with a thin amorphous
film of a heavy metal solution, such as methylamine tungstate, sodium/potassium
phosphotungstate or uranyl acetate (Figure 1.4). The higher density of the stain as opposed to
the low density of the biological specimen causes the negative appearance of the image,
which appears light against the darker background of the stain. However, this method does
not allow for the high-resolution determination of a structure due to a number of technical
limitations. The negative staining procedure can generate artifacts, where the stain layer is too
thick, or too thin so that the biological material is only partly covered by stain. Flattening and
stretching of specimens may also occur during grid preparation (Glaeser et al 1991).
Nevertheless, negative staining remains a widely used and rapid, qualitative method for
determining lower-resolution structures.

14
1.3.4 Electron Cryomicroscopy
Electron cryomicroscopy (cryo-EM) allows biological molecules to be imaged after
immobilization in vitreous ice in their native conformation, thus potentially mimicking the
protein‘s native environment and structure. This approach allows for obtaining structures with
better resolution compared to imaging in negative stain (Rubinstein 2007). However,
specimens embedded in ice have very low contrast and require significantly more
computational data processing in order to obtain averages from a large number of images.
Figure 1.4. Negative stain and cryo grid preparation: (A) Three macromolecules in
different orientations. (B) Negative stain specimen preparation (left) and recorded
images (right). Macromolecules are adsorbed onto the carbon substrate. The negative
stain method may flatten particles during drying. (C) Cryo-EM specimen preparation
(left) and recorded images (right). Macromolecules are rapidly frozen to generate an
amorphous ice, which preserves native or near-native structure (figure adapted from
Steven and Belnap, 2005

15
1.3.5 Image analysis
Single Particle Analysis is a computational image processing technique used to
calculate 3D structures from electron microscopy images of biological specimens. In order to
improve the low signal-to-noise ratio of the recorded images, several thousand single particle
images are required. Single particle determination begins with selection of the single particle
images from electron micrographs. Then the computer programs employing multivariate
statistical analysis are used to group similar particle images together into multiple sets
(Thuman-Commike 2001). Figure 1.5 summarizes all these steps into a computational single
particle image analysis.
Figure 1.5. Single particles image analysis process: (A) Objective. (B) Micrograph with
three unique views of the objective (side, front, and top views). (C) Selected single particle
images from the micrograph. (D) Aligned particle images to common views. (E) Classified
particle images. (F) Determined orientations (side, front, and top views) (Figure adapted from
Thuman-Commike 2001).

16
1.4 RATIONALE AND OBJECTIVES
There is evidence to suggest that the structure of V-ATPase may differ from species to
species and the number and design of the V-ATPase peripheral stators are still unclear. Recent
electron microscopy studies of the prokaryotic V-ATPases from Thermus thermophilus
showed two peripheral stalks (E2G2) (Lau and Rubinstein 2010) whereas three peripheral
stalks (E3G3) were found in the eukaryotic yeast Saccharomyces cerevisiae V-ATPase (Zhang
et al 2008; Benlekbir et al, manuscript in preparation).
The reversible dissociation of the V1 and Vo regions is an essential mechanism for
regulating V-ATPase activity. This mechanism is a rapid and effective way to reduce or
increase proton pumping. A complete picture of the molecular structure of the intact complex
is now emerging but important features, especially the structure of the dissociated V1-ATPase
are still unknown. There are still many unanswered questions about the distinct structural
details of V1-ATPase. Does the dissociated V1 region have the same structure as when it is
part of the intact V-ATPase complex? Do all of the subunits still have the same structure in
dissociated V1 region or do they change conformation to stop ATP hydrolysis? Do some of
the subunits of V1-ATPase play a role in the dissociation and inhibition processes?
The overall goal of the current study is to determine the structure of dissociated
Saccharomycese cerevisiae V1-ATPase in the late stationary phase of yeast culture by using
electron microscopy. The thesis is comprised of three major tasks:
1) To determine the structure of dissociated V1-ATPase.
2) To identify the sub-complexes of V1-ATPase in cells.
3) To investigate the behavior of peripheral stalk subunits in dissociation.

17
CHAPTER 2. Materials and methods
2.1 MATERIALS
2.1.1 Chemicals
All reagents were purchased from Bioshop, unless specified otherwise. De-ionised
water was purified with a Milli-Q Academic purification system (Millipore) and all aqueous
solutions were prepared with Milli-Q purified water.
2.1.2 Reagents and kits used for molecular biology
All enzymes, buffers and reagents for polymerase chain reaction (PCR) in this study
were purchased from Fermentas, unless otherwise noted. The QIAEX II Gel extraction Kit
(Qiagen) was used for DNA extraction from agarose gels, and the QIAquick PCR purification
Kit (Qiagen) for PCR product purification.
2.1.3 Bacterial and Yeast growth media
Bacterial growth liquid media Luria-Bertani (LB) contained 1 % (w/v) peptone, 0.5 %
(w/v) yeast extract, and 1 % (w/v) NaCl. Plates of LB were made from 1 % (w/v) peptone, 0.5
% (w/v) yeast extract, 1 % (w/v) NaCl and 2 % (w/v) bacto agar. LB selective plates were
prepared with a suitable antibiotic (Ampicillin ).
Yeast growth liquid YPD media consisted of 2 % (w/v) peptone, 1 % (w/v) yeast
extract and 2 % (w/v) D-glucose. Plates of YPD contained 2 % (w/v) peptone, 1 % (w/v)
yeast extract, 2 % (w/v) D-glucose and 2 % (w/v) bacto agar. Synthetic defined dropout Ura
marker selection, (SD-URA) plates contained 0.67 % (w/v) yeast nitrogen base, 0.2 % (w/v)
amino acid mixture minus uracyl, 2 % (w/v) glucose , and 2 % (w/v) bacto agar.

18
2.1.4 Vectors, bacterial strains and yeast strains
pMK159, a gift from M. Kampmann (Rockefeller University, New York, NY), was
used as the starting plasmid for 3xFLAG vector construction. pMK159 encodes an 8 kDa
biotinylation signal sequence from P. shermanii followed by the C. albicans URA3 marker
(See Figure 2.1 for more details). A description of the 3xFLAG vector is given in Results
Chapter 3.1.
E. coli DH5α competent cells were used for the isolation of recombinant plasmid
DNA.
The Saccharomyces cerevisiae strains MM93 (aka BJ2168) - MATa leu2 trp1 ura3-
52 prb1-1122 pep4-3 prc1-407 gal2 and MM940 -MATa ∆vma2 kan leu2 trp1 ura3-52 prb1-
1122 pep4-3 prc1-407 gal2, were kindly provided by Dr. Morris Manolson (Department of
Biochemistry, University of Toronto). The MM93 was used as the background strain for
constructing new yeast strains. The MM940 -MATa ∆vma2 kan leu2 trp1 ura3-52 prb1-1122
pep4-3 prc1-407 gal2 was used as the negative control strain for yeast growth assay.

19
Figure 2.1. Plasmid pMK159 map and the sequences of the biotinylation signal, Ura3
marker and restriction sites.

20
2.2 STANDARD BIOCHEMICAL TECHNIQUES
2.2.1 Denaturing polyacrylamide gel electrophoresis (PAGE)
SDS-PAGE (Sodium Dodecyl Sulfate Polyacrylamide Gel Electrophoresis) was
employed to separate proteins. Protein samples (100 μl) were mixed with 30 μl of 10xSDS gel
loading buffer (0.5 M tris-HCl [pH 6.8], 4.4 % [w/v] SDS, 20 % [w/v] glycerol, 2 % [w/v] 2-
mercaptoethanol, and 0.04 % [w/v] bromophenol blue). Approximately, 50 μl of each sample
was loaded on the gel, composed of 12 to 15 % (w/v) polyacrylamide (as indicated) for the
resolving gel and 4 % (w/v) polyacrylamide for the stacking gel. The gel electrophoresis
apparatus was assembled and filled with running buffer (25 mM Tris [pH 8.3], 192 mM
glycine, 0.1 % [w/v] SDS). The gel was run at 180 volts for 50 minutes, or until the dye front
reached the bottom of the gel.
2.2.2 SDS-PAGE Coomassie staining
Coomassie staining was used for qualitative analysis of gels after protein purification.
The SDS-PAGE gels were stained for up to two hours with staining solution (0.2 % [w/v]
Coomassie brilliant blue, 50 % [v/v] methanol and 7 % [v/v] acetic acid). Polyacrylamide gels
were destained in gel destain solution (20 % [v/v] methanol, and 7 % [v/v] acetic acid) until
unbound stain was removed.
2.2.3 SDS-PAGE silver staining
Silver staining was used to detect proteins at low concentrations. The SDS-PAGE gels
were fixed for 40 minutes in 50 % (v/v) methanol and 10 % (v/v) acetic acid. Then, they were
incubated in 20 % (v/v) ethanol for a further 10 minutes and washed for five minutes in water.
Gels were reduced with 0.02 % (w/v) sodium thiosulfate solution for 1 minute and washed
two times with water for 30 second. Gels were then incubated for 30 minutes in 0.2 % (w/v)

21
silver nitrate. After one wash for 20 seconds in water, proteins were detected with a
developing solution consisting of 3.0 % (w/v) sodium carbonate, 0.05 % (v/v) formaldehyde
and 0.01 % (w/v) sodium thiosulfate. Development was stopped after reaching the desired
intensity of staining by a solution containing 1 % (v/v) acetic.
2.2.4 Native polyacrylamide gel electrophoresis (PAGE)
Non denaturing (native) gels were prepared as described above, except that no SDS or
reducing agent was added to the gel, sample or buffer. Gels were run at 80 volts for 2 hours at
4 ºC, or until the dye front reached the bottom of the gel. Native gels were stained with
Coomassie blue and destained as described above.
2.2.5 DNA agarose gel electrophoresis
Agarose gel electrophoresis was used to analyze products from polymerase chain
reactions (PCR). 1 % (w/v) agarose was dissolved in TBE buffer (45 mM tris-borate [pH 7.5],
1 mM EDTA) and heated in a microwave oven. The gel was allowed to cool and 5 μl of safe
view stain was added. The gel electrophoresis tank was assembled and filled with TBE buffer.
DNA samples (30 μl) were mixed with 5 μl of 6x loading buffer (10 mM Tris-HCl [pH 7.6],
0.03 % [w/v] bromophenol blue, 0.03 % [w/v] xylene cyanol FF, 60 % [v/v] glycerol, 60 mM
EDTA). 25 μl of each sample was loaded onto the gel and run at 100 volts for 45 minutes.
DNA was visualized on the gel with 300 nm of ultraviolet light (UV) and
photographed. DNA was eluted from agarose gels while keeping the UV light at low
intensity. Single bands from agarose gel were cut out using a sharp sterile scalpel and
collected in a sterile microcentrifuge tube. A gel extraction kit (Qiagen) was used to elute the
DNA from the gel according to the manufacturer's instructions.

22
2.2.6 Chromatography
Size exclusion liquid chromatography was performed with AKTA chromatography
systems (GE Healthcare), with a Superose 6 gel filtration column. Before loading on the
chromatography system, all samples and buffers were filtered and the column pre-equilibrated
with the appropriate buffer.
2.3 PLASMID AND VECTOR CONSTRUCTION
2.3.1 DNA restriction enzyme digestion
Restriction enzymes were selected based on the sequenced maps of the pMK159
plasmid (Figure 2.1). DNA digestions were prepared in 2 ml microtubes. In the total 30 μl
volume was 3.5 μl of circular DNA (pMK159), 1 μl of each restriction enzyme (Pac1 and
Asc1), 5 μl of 10xNEBuffer (50 mM potassium acetate, 20 mM tris-acetate [pH 7.9], 10 mM
magnesium acetate 1 mM dithiothreitol), and 0.5 μl of bovine serum albumin (BSA). The
restriction reaction was incubated at 37 oC for 1 hour. DNA was analyzed by agarose gel
electrophoresis and purified by QIAquick Gel Extraction kit according to the manufacturer's
instructions.

23
2.3.2 Oligonucleotides annealing
Phosphorylated oligonucleotides encoding a 3xFLAG tag with the restriction enzyme
sites (AscI and PacI) were designed and synthesized by Invitrogen (See Table 2.1). Both of
the complementary oligonucleotides were resuspended at the same molar concentration using
an annealing buffer (10 mM tris [pH 7.5], 50 mM NaCl, 1 mM EDTA) and equal volumes of
both complementary oligos were mixed in a microfuge tube. The annealing reaction was
placed in a heatblock at 95 °C for 5 minutes and afterwards cooled at room temperature (RT)
for 60 minutes.
Table 2.1 Complementary oligonucleatotides. Oligonucleotides encoding a 3xFLAG tag
(pink) with the restriction enzyme sites PacI and AscI (green). Oligonucleotides were
synthesized by Invitrogen.
Coding strain
TAAGACTACAAAGACCATGACGGTGATTATAAAGATGATGATATCGATTACAAGGATGACGATGACAAGTGAGG
Non-coding strain
CGCGCCTCACTTGTCATCGTCATCCTTGTAATCGATATCATGATCTTTATAATCACCGTCATGGTCTTTGTAGTCTTAAT

24
2.3.3 DNA ligation
Ligations were performed with a vector-to-insert ratio of ~1:1, ~1:3 and ~1:8 with T4
DNA ligase (Invitrogen) according to the manufacturer's instructions. The reactions were
prepared with the following reagents: vector DNA, 3xFLAG tag insert, T4 DNA ligase and
ligation buffer (50 mM tris-HCl [pH7.5] 10 mM MgCl2, 1 mM ATP, 10 mM dithiothreitol).
Ligation reactions were incubated at room temperature for 1 hour and then heated at 65 oC for
10 minutes.
2.3.4 Bacterial transformation and plasmid amplification
Plasmid DNA was used to transform competent E. coli DH5α cells. The cells were
kept on ice for 30 minutes and heat shocked for 15 seconds at 42 °C. For recovery, SOC
medium (0.5 % [w/v] yeast extract, 2 % [w/v] tryptone, 10 mM NaCl, 2.5 mM KCl, 10 mM
MgCl2, 10 mM MgSO4, 20 mM glucose) was added and the cells were incubated in 37 °C for
1 hour. Afterwards, cells were spread on LB-Amp plates, containing Ampicillin and incubated
at 37 °C over night. Plasmid isolation was performed with Qiagen miniprep kits according to
the manufacturer's protocol.
25
2.4 YEAST STRAIN CONSTRUCTION AND CONFIRMATION
2.4.1 PCR of linear DNA for yeast transformation
The yeast strains used in this study were engineered to encode a 3xFLAG tag
sequence C-terminal to different V1-ATPase subunits. PCR was used to generate a DNA
fragment for homologous recombination. All fragments consisted of a 5′ region homologous
to the 3′ end of the gene of interest and 3′ region homologous to the genomic DNA
downstream of the gene of interest (for more details see Table 2.2). The central sequence of
the DNA fragment encoded the 3xFLAG tag sequence followed by the URA3 auxotrophic
marker from Candida albicans. The template DNA for the PCR was the plasmid pJT1 (see
Results Chapter 3.1 for more details), which encoded 3xFLAG sequence followed by the C.
albicans URA3 marker.
The PCR reaction was carried out as follows: 1 minute at 94 °C, 30 cycles of 94 °C for
1 minute, 52 °C for 1 minute and 68 °C for 2.5 minutes, and 7 minutes incubation at 68 °C.
26
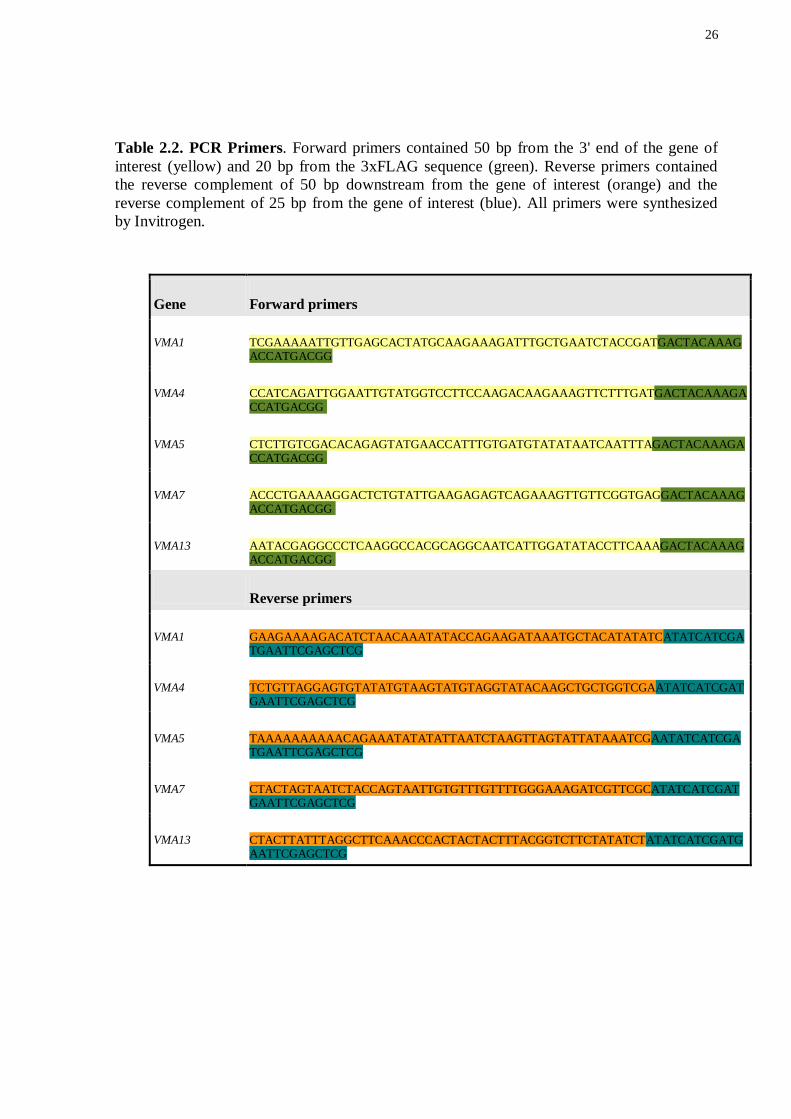
Table 2.2. PCR Primers. Forward primers contained 50 bp from the 3' end of the gene of
interest (yellow) and 20 bp from the 3xFLAG sequence (green). Reverse primers contained
the reverse complement of 50 bp downstream from the gene of interest (orange) and the
reverse complement of 25 bp from the gene of interest (blue). All primers were synthesized
by Invitrogen.
Gene Forward primers
VMA1 TCGAAAAATTGTTGAGCACTATGCAAGAAAGATTTGCTGAATCTACCGATGACTACAAAGACCATGACGG
VMA4 CCATCAGATTGGAATTGTATGGTCCTTCCAAGACAAGAAAGTTCTTTGATGACTACAAAGACCATGACGG
VMA5 CTCTTGTCGACACAGAGTATGAACCATTTGTGATGTATATAATCAATTTAGACTACAAAGACCATGACGG
VMA7 ACCCTGAAAAGGACTCTGTATTGAAGAGAGTCAGAAAGTTGTTCGGTGAGGACTACAAAGACCATGACGG
VMA13 AATACGAGGCCCTCAAGGCCACGCAGGCAATCATTGGATATACCTTCAAAGACTACAAAGACCATGACGG
Reverse primers
VMA1 GAAGAAAAGACATCTAACAAATATACCAGAAGATAAATGCTACATATATCATATCATCGATGAATTCGAGCTCG
VMA4 TCTGTTAGGAGTGTATATGTAAGTATGTAGGTATACAAGCTGCTGGTCGAATATCATCGATGAATTCGAGCTCG
VMA5 TAAAAAAAAAACAGAAATATATATTAATCTAAGTTAGTATTATAAATCGAATATCATCGATGAATTCGAGCTCG
VMA7 CTACTAGTAATCTACCAGTAATTGTGTTTGTTTTGGGAAAGATCGTTCGCATATCATCGATGAATTCGAGCTCG
VMA13 CTACTTATTTAGGCTTCAAACCCACTACTACTTTACGGTCTTCTATATCTATATCATCGATGAATTCGAGCTCG

27
2.4.2 Yeast Transformation
The Saccharomyces cerevisiae strain MM93 was streaked onto a YPD agar plate. One
yeast colony was selected and inoculated in 50 ml liquid YPD medium and incubated at 30 ˚C
over night, with shaking at 250 rpm. When the yeast culture reached an OD600 of 1.0 (+/- 0.2),
it was centrifuged at 1 000 x g for 3 minutes. The yeast pellet was resuspended in 10 ml of
sterile water and centrifuged at 1 000 x g for 3 minutes. The pellet was then washed with 1
ml of sterile water, transferred to a 1.5 ml sterile microfuge tube and centrifuged at 1 000 x g
for 3 minutes. The supernatant was removed and the pellet was resuspended in 1 ml sterile
TE/LiOAc buffer (10 mM tris-HCl, 1 mM EDTA, 100 mM LiOAc, [pH 7.5]) and centrifuged
at 1 000 x g for 3 minutes. The supernatant was removed and the pellet was resuspended in
0.25 ml TE/LiOAc buffer. 50 μl of yeast cells were mixed with 50 μl of transforming DNA
(PCR product, see above) and 5 μl of single stranded salmon sperm carrier DNA at 10 mg/ml
(Invitrogen). Single stranded DNA was boiled for 5 minutes and chilled on ice for 5 minutes
before it was used in the transformation mix. 300 μl of sterile solution (40% [w/v] PEG 4000
in TE/LiOAc buffer) were added, the contents were mixed thoroughly and incubated at 30 ˚C
for 1 hour with occasional gentle shaking (every 10 minutes). Afterwards, 40 μl of DMSO
was added to the reaction tube and mixed. Yeast cells were heat shocked at 42 ˚C for 15
minutes and then centrifuged at 1 000 x g for 10 seconds. The supernatant was removed and
the pellet was resuspended in 1 ml TE buffer. The suspension was centrifuged at 1 000 x g for
10 seconds. The supernatant was removed and the pellet was resuspended in 250 μl of TE,
plated on selective media (SD-Ura) and incubated at 30 °C for 3-4 days to recover
transformants.

28
2.4.3 Yeast Chromosomal DNA Isolation
Transformed yeast was inoculated into 5 ml of liquid YPD and grown over night at 30
˚C with shaking at 250 rpm. The cells were centrifuged at 4 000 x g for 3 minutes. The pellet
was resuspended in 1 ml water and the suspension was transferred to 2 ml screw top tubes and
centrifuged at 4 000 x g for 3 minutes. The supernatant was removed, the pellet was
resuspended in 200 μl of the lysisbuffer (2 % [w/v] Triton X-100, 1 % [w/v] SDS, 100 mM
NaCl, 10 mM tris HCl, 1 mM EDTA [pH 8]), to which 200 μl of glass beads along with 200
μl TE and 200 μl of phenol/chloroform, pH 8.0 were added. The suspension was mixed for 3
minutes by vortexing. The mixture was centrifuged at 13 000 x g for 5 minutes. The top
aqueous phase was transferred to fresh microfuge tubes, mixed with 1 ml of 100 % ethanol by
inversion, after which the suspension was centrifuged at 13 000 x g for 3 minutes. The
supernatant was removed and the pellet was washed with 1 ml 70 % (w/v) ethanol and
centrifuged at 13 000 x g for 3 minutes. The supernatant was discarded and the pellet was
dried in a speedvac. The resulting chromosomal DNA pellet was resuspended in 250 μl of EB
buffer (Qiagen). Chromosomal DNA was used for PCR with gene specific primers to confirm
construction of yeast strains (see below).

29
2.4.4 Confirmation of transformed fragments
The confirmation of strain construction was done by PCR with the primers listed in
Table 2.3. The PCR was carried out as follows; 2 minutes at 94 °C, 30 cycles of 94 °C for 30
seconds, 52 °C for 1 minute and 72 °C for 2 minutes, and 7 minutes incubation at 72 °C using
genomic DNA from the yeast.
Table 2.3. Primers for confirming strain construction. Primers were synthesized by
Invitrogen.
Gene of interest Forward primers
VMA1 ACTGCTGACGTTAAGCATG
VMA4 GTGGTCTCCAATGCATCAGAC
VMA5 GCCACCTCACTTTAACATCA
VMA7 GACTCCTTCACCAATGCG
VMA13 CAAGACTGGCGGCAAAG
Reverse primer
All of the above AGGTCGACGGATCGGTGA

30
2.4.5 Yeast growth assay
To monitor viability of yeast strains growth assays were performed. Each yeast strain
was inoculated into 5 ml of liquid YPD and grown over night at 30 ˚C with shaking at 250
rpm. Cultures were adjusted to OD600 of 1 by dilution with fresh media and serially diluted in
water by factors: 100
, 10-1
, 10-2
, 10-3
. 1 μl of each dilution was spotted on YPD plate
buffered to pH 5.5 and supplemented with 50mM CaCl2. Growth was recorded after 3 days of
incubation at 30 °C.
2.4.6 Purification of 3xFLAG Tagged Yeast V1-ATPase
Over night cultures were transferred into two liters of YPD and again grown over
night until they reached OD600 of ~ 5. Cells were harvested by centrifugation at 4 000 x g for
15 minutes. The pellet was resuspended in the lysis buffer at 1 g/ml and passed through a
homogenizer 5 times at 30 kPa. The homogenate was centrifuged at 3 000 x g for 10 minutes
to remove cell debris. Supernatant was decanted into centrifuge tubes and centrifuged at 110
000 x g (Beckmann, 70Ti rotor) for 30 minutes to clarify the cell extract. Again, the
supernatant was decanted and then loaded onto a 0.5 ml anti-3xFLAG M2-sepharose column
(Sigma) under gravity flow at 4 °C. The column was washed with 10 column volumes of tris
buffered saline (TBS; 50 mM tris HCl, 150 mM NaCl, [pH 7.4]). Finally, bound protein was
eluted by competition with three times one-column volumes of 150 μg/ml 3xFLAG peptide
(Sigma) in TBS.

31
2.5 SPECIMEN PREPARATION FOR ELECTRON MICROSCOPY
2.5.1 Preparation of continuous carbon film coated EM grids
Continuous carbon film coated EM grids were used for negative stain electron
microscopy studies. A thick layer of carbon ~100 Å was evaporated onto a freshly cleaved
mica surface. 400 mesh copper/rhodium grids were then arranged onto 3 pieces of filter paper
(Whatman No 1) on a metal support in a bath filled with water. The carbon film was floated
onto the surface of the water and the water was gently removed allowing the carbon film to
rest on the grids. The grids were air-dried and then were used for negative staining of
proteins.
2.5.2 Preparation of holey carbon film coated EM grids
Holey carbon film coated EM grids were used for electron cryomicroscopy. 20 drops
of 50 % (v/v) glycerol in water was added to a formvar solution (0.5 % [w/v] formvar in
chloroform), mixed and sonicated using a probe sonicator for 5 to 6 minutes at maximum
power (50 % duty cycle). Glass slides were wiped clean, dipped in formvar solution for
approximately 5 seconds, and left to dry. A pyrex dish was filled with water and the formvar
film was floated onto the water surface. 400 mesh grids (Maxtaform HR26 Cu/Rh) were
placed Rh side down (Cu side visible) on the floating film. Parafilm backing paper was placed
on the formvar film covered grids and immediately lifted, flipped, and set on a piece of filter
paper to dry.
The parafilm backing paper with formvar film covered grids was transferred to a glass
petri dish and wet with methanol and covered for 10 minutes. The lid was then removed and
the methanol allowed to evaporate in the fumehood. A thick layer of carbon was evaporated
onto the formvar film. The formvar was dissolved by adding chloroform to the filter paper

32
under the grids, covered for 15 minutes and then dried. Rinsing with chlorform was repeated 5
times.
2.5.3 Negative staining of protein particles
Continuous carbon film coated grids were glow discharged in air in order to make the
carbon surface hydrophilic. 5 μl of sample in the final buffer used during purification was
placed on the carbon surface and allowed to adsorb to the grids for 1 minute. The grids were
then washed 3 times in 40 μl of water. Between rinses, water was removed from the grids by
touching the edge of the grids to a piece of filter paper (Whatman No. 1). The grids were
stained by washing with 40 μl of 2 % (w/v) uranyl acetate (Electron Microscopy Sciences,
Hatfield) solution. Excess stain solution was removed with filter paper and the grids were air-
dried.
2.5.4 Preparation of protein particles in amorphous ice
Carbon coated holey grids were washed with acetone and 5 μl of the sample was
applied to grids using the automated Vitrobot system (FEI) under controlled conditions: 4 °C
with 100 % humidity. The sample was incubated for 30 seconds and excess buffer was
removed by blotting with a filter paper (Whatman No. 595) for 13 second. The grids were
immediately plunged into liquid ethane cooled by liquid nitrogen. For long-term storage, grids
were stored in a grid box in liquid nitrogen.

33
2.6 ELECTRON MICROSCOPY
Transmission electron microscopy images were recorded with an exposure of ∼12
electrons per Å2 with a Tecnai F20 electron microscope (FEI Company) operating at 200 kV
with a magnification of 50,000 x. Images were taken with an exposure time of 1 second and a
defocus between 1.0 μm and 4.5 μm. Images were recorded on Kodak SO-163 film.
Micrographs were developed with Kodak D19 developer and digitized with an Intergraph
PhotoScan densitometer (Intergraph).
2.7 IMAGE ANALYSIS
Single particle images were selected interactively with Ximdisp (Smith 1999). Prior to
further analysis, images were bandpass filtered with an Imagic-like filter and a soft circular
mask was applied to the images. Alignment of particle images and multivariate data analysis
were carried out with the SPIDER software package (Frank et al. 1996).

34
CHAPTER 3. Results
In this study, the endogenous V1-ATPase from S. cerevisiae was tagged with 3xFLAG
tag. The protein was purified by affinity chromatography and several EM studies were
performed.
3.1 3xFLAG VECTOR CONSTRUCTION
The pMK159 plasmid was used as a template for constructing the vector pJT1, which
was designed to carry the DNA sequence for the 3xFLAG tag followed by the URA3 selection
marker. pMK159 contained a biotinylation signal sequence flanked by PacІ and AscІ
restriction sites and the URA3 selectable marker (Figure 3.1). To insert the 3xFLAG tag
sequence into the plasmid vector, ‗sticky ends‘ were produced both on the vector and the
insert. Based on the plasmid sequence map (see Figure 2.1 in Chapter 2: Materials and
Methods), PacІ and AscІ were employed to cut out the biotinylation signal sequence from the
plasmid. Control reactions including vector + PacІ, vector + AscІ and vector alone . All of the
digests were analyzed by DNA agarose gel electrophoresis and gave the expected band
lengths. Vector with each one of the restriction enzymes showed a single band characteristic
of a linearized plasmid, whereas vector alone showed a slower migrating band characteristic
of a circular plasmid fragment. Digesting the vector with both PacІ and AscІ produced two
bands belonging to the digested vector and the biotinylation signal sequence.

35
The cut vector was extracted from the gel and used for subsequent ligation reactions.
The 3xFLAG tag sequence was designed to contain PacІ and AscІ restriction sites (for more
details see Materials and Methods Chapter 2: 2.3). The construct was synthesized by
Invitrogen and ligated into the cut vector using DNA ligase. The insertion was verified by
sequencing the resulting vector and henceforth it is referred to as pJT1.
3.2 Vma1 - 3xFLAG STRAIN CONSTRUCTION
Vma1 subunit (A) of the V1-ATPase was tagged with a C-terminal 3xFLAG tag in the
background S. cerevisiae strain MM93 (Table 3.1), in order to allow purification of the
complex with a high yield. The 3xFLAG tag followed by the URA3 selection marker in pJT1
(see Figure 3.1) was amplified by PCR using forward primers carrying 50 bases of sequence
upstream of the stop codon of the gene of interest and the first 20 bases of the 3xFLAG-tag
sequence. The reverse primers consisted of the reverse complement of the 50 bases
downstream of (and excluding) the stop codon of the gene of interest and 24 bases of the
reverse complement of pJT1 downstream of the URA3 sequence. The PCR product was
confirmed by agarose gel electrophoresis. Yeast cells were transformed with the PCR product
using the Li/Ac method. The linear PCR product was integrated by homologous
recombination and transformants were recovered on selective media minus uracyl (SD-URA).
Correct integration of the DNA fragment was confirmed by PCR using primers 400 bp
upstream of the integration site and inside the URA3 sequence.

36
Figure 3.1 Plasmid and yeast strain construction. The pMK159 vector containing the
biotinylation sequences and the URA3 selectable marker, was digested by PacІ and AscІ
restriction enzymes. The 3xFLAG tag sequence followed by PacІ and AscІ restriction sites
was ligated into the cut vector. The ligated vector was named pJT1 and was used to generate a
DNA fragments for homologous recombination into the yeast genome.

37
3.3 PURIFICATION AND ISOLATION OF INTACT V1-ATPase VIA Vma1 - 3xFLAG
Vma1 – 3xFLAG tagged protein was purified as described in Chapter 2: Materials and
Methods 2.4.5. V1-ATPase dissociates from the intact V-ATPase complex into V1 and Vo
regions in response to glucose depletion (Kane 2003). To isolate the V1 region, glucose was
removed from purification buffers and cells were grown until saturation. An M2-sepharose
column was used to purify the complex, which was then analyzed by SDS-PAGE. According
to Figure 3.2 all eight subunits of the V1-ATPase (A, B, C, D, E, F, G and H) were present
with their expected molecular weights (70, 60, 45, 30, 27, 14, 12 and 55 kDa, respectively).
Subunits A, B, E and G are present in multiple copies in the V1-ATPase and thus their bands
are more intense than other bands on the SDS-PAGE gel.
Figure 3.2. The purified yeast V1-ATPase sample visualized by 12% SDS-PAGE stained
with Coomassie Blue: Lane 1, Molecular mass standard proteins. Lane 2, Purified V1-
ATPase shows all eight subunits (A, B, C, D, E, F, G and H) with their expected molecular
weights.

38
The eluate from the M2-sepharose column was concentrated and analyzed by
Superose 6 gel filtration chromatography. Protein standards of known molecular weights were
used to construct a calibration curve to determine the approximate molecular weights of the
eluted complexes. The elution plot shows three distinct peaks corresponding to molecular
weights in the ranges: 700 - 650 kDA (Peak 1), 400 – 280 kDa (Peak 2) and 15 - 2 kDa (Peak
3) (Figure 3.3).
Figure 3.3. Superose 6 size-exclusion chromatography of the V1-ATPase: The
chromatogram shows three peaks corresponding to molecular weights in the ranges: 700-620
kDa (Peak 1), 400 – 280 kDa (Peak 2) and 15-2 kDa (peak 3).

39
All eluted fractions were collected and analyzed by SDS-PAGE. Peak 1 showed all
eight subunits corresponding to the intact V1 region, whereas peak 2 showed a partial V1-
ATPase complex, and peak 3 contained 3xFLAG peptide. The partial complex was a
surprising observation, because no previous reports in the literature demonstrated its existence
in the cell. Previously, other partial V1-ATPase complexes were obtained in response to
detergent and temperature-driven disassembly of V-ATPase (Graf 1996; Rizzo et al 2003;
Chaban 2003). To ensure that the complexes were stable, all of the fractions of each peak
were collected and gel filtration was applied again on the peaks independently. The peak
positions and the magnitudes did not change, indicating that V1-ATPase and its subcomplex
were stable. The stability was also tested by a freeze-thaw cycle and gel filtration
chromatography, which showed the same results. These experiments support the notion that
this V1-ATPase partial complex is not an artifact of the experimental conditions used and is a
stable complex found in the cell.
Figure 3.4. Yeast V1-ATPase visualized by 12% SDS-PAGE stained with Coomassie
Blue after gel filtration chromatography: Lane 1, Molecular mass standard proteins. Peak
1, The intact V1-ATPase complex contained all eight subunits (A, B, C, D, E, F, G, and H).
Peak 2, A partial V1-ATPase complex containing subunits A, B, E, G, and H.

40
3.4 V1-ATPase REGION PURIFICATION USING DIFFERENT CELL CULTURE DENSITIES
Because the V1 and Vo regions dissociate from each other due to glucose depletion, the
effect of cell culture density on the abundance of the partial complexes was tested. An
increase in culture density leads to nutrient depletion. Therefore, culture densities were tested
with OD600 between ~3 - 5 and Superose 6 gel filtration chromatography was used to analyze
each sample. These experiments suggested that increasing the culture density decreased the
abundance of the intact V1 region, but increased the abundance of the partial complex.
41
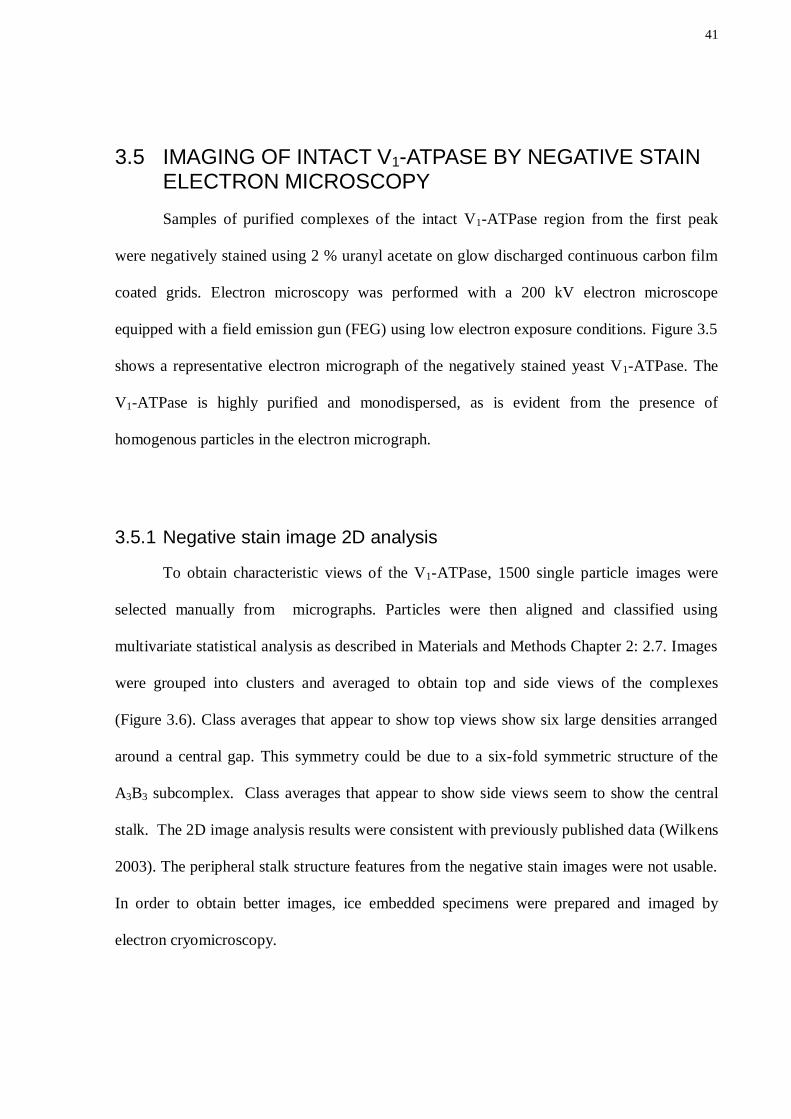
3.5 IMAGING OF INTACT V1-ATPASE BY NEGATIVE STAIN ELECTRON MICROSCOPY
Samples of purified complexes of the intact V1-ATPase region from the first peak
were negatively stained using 2 % uranyl acetate on glow discharged continuous carbon film
coated grids. Electron microscopy was performed with a 200 kV electron microscope
equipped with a field emission gun (FEG) using low electron exposure conditions. Figure 3.5
shows a representative electron micrograph of the negatively stained yeast V1-ATPase. The
V1-ATPase is highly purified and monodispersed, as is evident from the presence of
homogenous particles in the electron micrograph.
3.5.1 Negative stain image 2D analysis
To obtain characteristic views of the V1-ATPase, 1500 single particle images were
selected manually from micrographs. Particles were then aligned and classified using
multivariate statistical analysis as described in Materials and Methods Chapter 2: 2.7. Images
were grouped into clusters and averaged to obtain top and side views of the complexes
(Figure 3.6). Class averages that appear to show top views show six large densities arranged
around a central gap. This symmetry could be due to a six-fold symmetric structure of the
A3B3 subcomplex. Class averages that appear to show side views seem to show the central
stalk. The 2D image analysis results were consistent with previously published data (Wilkens
2003). The peripheral stalk structure features from the negative stain images were not usable.
In order to obtain better images, ice embedded specimens were prepared and imaged by
electron cryomicroscopy.

42
Figure 3.5. Electron micrograph of the negatively stained yeast V1-ATPase: On the left
is a section from an original electron micrograph of a negatively stained yeast V1-ATPase.
The box on the right shows a single particle image extracted from the original micrograph.

43
Figure 3.6. 2D class averages of yeast V1-ATPase stained with 2 % uranyl acetate:
Structural models of a side view (A) and top view (B) of V1-ATPase. Class averages of V1-
ATPase after the separation of 1500 particle images into possible (C) side views and (D) top
views.

44
3.6 IMAGING OF INTACT V1-ATPASE IN AMORPHOUS ICE
Electron cryomicroscopy was used to image the purified V1-ATPase embedded in
amorphous ice. Images of the V1-ATPase were recorded over holes in the carbon support
film. Figure 3.7 shows a section of a representative cryo-EM micrograph of the V1-ATPase in
sample buffer. As is visible in the micrograph, many particles appear to be oriented in the
―top‖ or ―bottom‘ orientation.
Figure 3.7. Cryo-EM micrograph of the yeast V1-ATPase: On the left is a section from an
original electron cryo-micrograph of yeast V1-ATPase in amorphous ice. The box on the right
shows single particles extracted from the original image.

45
3.6.1 Cryo-EM 2-D image analysis
To obtain characteristic views of the V1-ATPase complex in ice, 20,000 single particle
images were selected from micrographs, and aligned and classified as described in Materials
and Methods Chapter 2: 2.7.
The resulting class averages show that all the particles were oriented to produce six-
fold symmetric top or bottom views (Figure 3.8). The top view 2D averages of the V1-ATPase
from negative stain EM (Figure 3.6 D) show very similar features and possess six-fold
symmetry. The central cavity is extremely clear in the cryo-EM class averages. From these
results it seems that fully purified V1-ATPase dissociates into the six-fold symmetric A3B3
complex during cryo grid preparation. This breakdown prevents us from analyzing the intact
complex and seems to occur only during cryo-EM grid preparation. Attempts were made to
prevent the breakdown of V1-ATPase during grid preparation
Figure 3.8. 2D class averages of yeast V1-ATPase images in amorphous ice: Class
averages from 20,000 particle images show that all the particles were oriented to produce six-
fold top or bottom views of the partial A3B3 complex.

46
3.7 Stabilization of intact V1-ATPase for cryo-EM
3.7.1 Detergent DDM
One hypothesis is that interaction of the protein with the air-water interface caused the
breakdown of the V1-ATPase intact complex into the A3B3 subcomplexes. Therefore the
detergent n-dodecyl beta-D-maltoside (DDM) was used in order to reduce interactions with
the air-water interface to prevent this artifact. Different concentrations of detergent (0.1 %,
0.15 %, 0.2 %) and cryo-EM grid preparations (blotting time, glow discharge) were tested.
However, intact V1-ATPase was not successfully visualized with any of the conditions tested.
3.7.2 Cold denaturation
Cold denaturation was another tested possibility that could potentially cause a
separation between the core (A3B3) and the peripheral stalk regions during cryo-grid
preparation. In order to test the hypothesis, that cold denaturation may lead to protein
destabilization, cryo-EM grid preparation was carried out at room temperature. Thus far, it
has been difficult to obtain optimal amorphous ice conditions at room temperature for
microscope imaging.
3.7.3 Chemical cross-linking
Chemical cross-linking was used to stabilize the protein complex. Gluteraldehyde was
used to cross-link different subunits. Concentration and reaction times were varied and native
gel electrophoresis was used to analyze the cross-linked complex. According to Figure 3.9
Part A the concentration of 0.02 % and reaction time of 10 hours were the most optimal
conditions that resulted in a single band of an appropriate molecular weight of ~ 650 kDa
corresponding to the intact complex. However, after imaging by cryo-EM (Figure 3.9 B) no
intact complex was observed. A shorter cross-linking reagent, formaldehyde was also tested

47
and similar results were obtained (Figure 3.10). Neither the use of detergent nor cross-linking
reagents prevented V1-ATPase break down into the A3B3 complex.
Figure 3.9. Chemical cross-linking of V1-ATPase complex with gluteraldehyde followed
by cryo-EM. (A) Native gel electrophoresis stained with Coomassie Blue. The lanes
represent optimization of 0.02 % gluteraldehyde reaction times: 0 hours, 2 hours, 6 hours, 10
hours. (B) Cryo-EM images of the cross-linked V1-ATPase.

48
Figure 3.10. Chemical cross-linking of V1-ATPase complex with formaldehyde followed
by cryo-EM: (A) Native gel electrophoresis stained with Coomassie Blue. The lanes
represent optimization of 0.2 % formaldehyde reaction times: 0 hours, 2 hours, 6 hours, 10
hours. (B) Cryo-EM images of the cross-linked V1-ATPase.

49
3.8 ISOLATION AND CHARACTERIZATION OF PARTIAL V1-ATPASE COMPLEXES IN THE LATE LOG PHASE OF YEAST GROWTH
The intact V1-ATPase (Figure 3.1, lane 2) was observed in the purification of the
3xFLAG tagged subunit Vma1 (A) (as described above) despite previous reports that
suggested that the C and H subunits dissociate after the V1 region is released into the cytosol
(Boesen and Nissen, 2009). Additionally, a partial complex consisting of An, Bn, En, Gn and H
was detected, a novel finding not previously reported in the literature. The following
experiments were carried out to characterize the partial complexes.
3.8.1 Vma4, 5, 7 and 13 – 3xFLAG yeast strain construction and purification of the corresponding partial complexes
To investigate which V1 partial complexes are present in the late log phase of yeast
cell culture, additional S. cerevisiae strains were designed with a 3xFLAG tag fused to the C
terminus of each of five V1 subunits: E (Vma4), C (Vma5), F (Vma7p), H (Vma13) and
C(Vma5) (See Table 3.1). For details about strain construction refer to Results Chapter 3: 3.2
and Materials and Methods Chapter 2: 2.4.
V1-ATPase was purified and isolated as with Vma1 – 3x FLAG (for more details see
Results Chapter: 3.3). Briefly, the cells were allowed to grow until late log phase was reached,
which corresponded to an OD600 ~5.
50
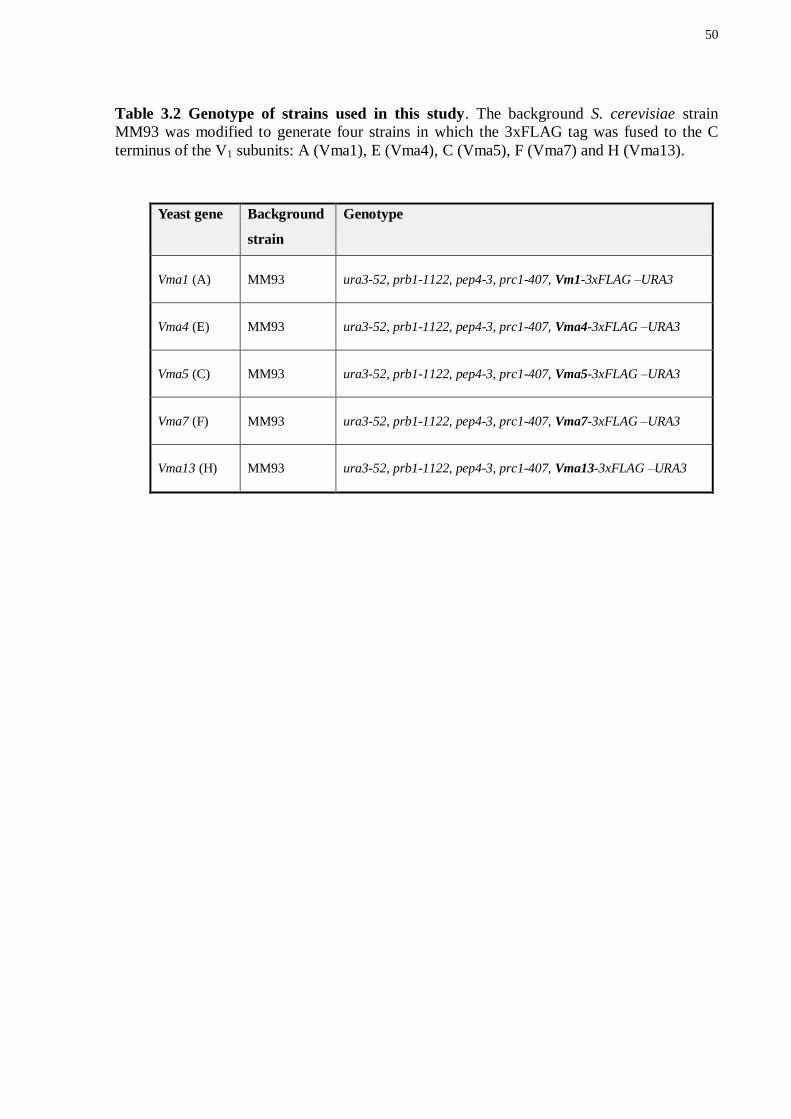
Table 3.2 Genotype of strains used in this study. The background S. cerevisiae strain
MM93 was modified to generate four strains in which the 3xFLAG tag was fused to the C
terminus of the V1 subunits: A (Vma1), E (Vma4), C (Vma5), F (Vma7) and H (Vma13).
Yeast gene Background
strain
Genotype
Vma1 (A) MM93 ura3-52, prb1-1122, pep4-3, prc1-407, Vm1-3xFLAG –URA3
Vma4 (E) MM93 ura3-52, prb1-1122, pep4-3, prc1-407, Vma4-3xFLAG –URA3
Vma5 (C) MM93 ura3-52, prb1-1122, pep4-3, prc1-407, Vma5-3xFLAG –URA3
Vma7 (F) MM93 ura3-52, prb1-1122, pep4-3, prc1-407, Vma7-3xFLAG –URA3
Vma13 (H) MM93 ura3-52, prb1-1122, pep4-3, prc1-407, Vma13-3xFLAG –URA3
51
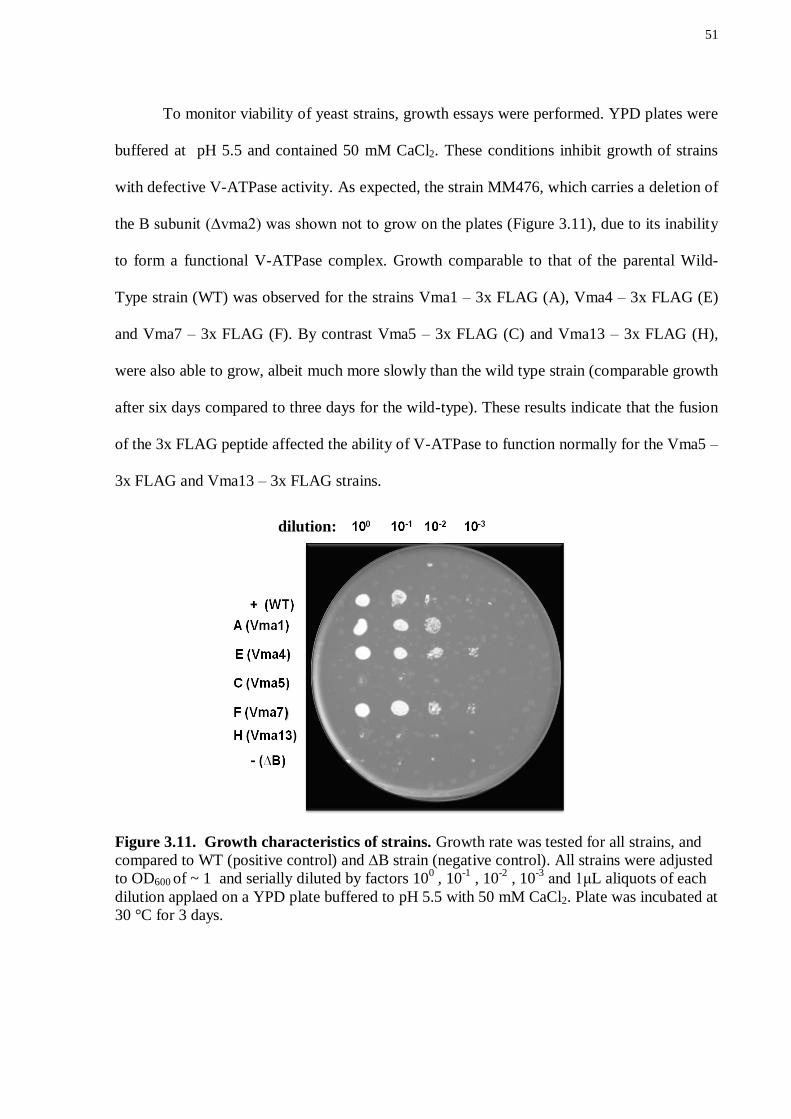
To monitor viability of yeast strains, growth essays were performed. YPD plates were
buffered at pH 5.5 and contained 50 mM CaCl2. These conditions inhibit growth of strains
with defective V-ATPase activity. As expected, the strain MM476, which carries a deletion of
the B subunit (∆vma2) was shown not to grow on the plates (Figure 3.11), due to its inability
to form a functional V-ATPase complex. Growth comparable to that of the parental Wild-
Type strain (WT) was observed for the strains Vma1 – 3x FLAG (A), Vma4 – 3x FLAG (E)
and Vma7 – 3x FLAG (F). By contrast Vma5 – 3x FLAG (C) and Vma13 – 3x FLAG (H),
were also able to grow, albeit much more slowly than the wild type strain (comparable growth
after six days compared to three days for the wild-type). These results indicate that the fusion
of the 3x FLAG peptide affected the ability of V-ATPase to function normally for the Vma5 –
3x FLAG and Vma13 – 3x FLAG strains.
Figure 3.11. Growth characteristics of strains. Growth rate was tested for all strains, and
compared to WT (positive control) and ∆B strain (negative control). All strains were adjusted
to OD600 of ~ 1 and serially diluted by factors 100 , 10
-1 , 10
-2 , 10
-3 and 1μL aliquots of each
dilution applaed on a YPD plate buffered to pH 5.5 with 50 mM CaCl2. Plate was incubated at
30 °C for 3 days.
dilution:

52
3.8.2 Characterization of partial V1-ATPase complexes by gel – filtration chromatography
To resolve the components of the partial complexes found in late log phase, Superose
6 size exclusion chromatography was performed on all purified V1-ATPases. Chromatograms
from the V1-ATPase complexes revealed three distinct peaks which overlap over the same
range of elution volumes (Figure 3.12). The first peak from the elution profile corresponds to
the molecular weight in the range between 700 – 650 kDa, which is consistent with the
molecular weight of the intact complex ~ 640 kDA. The second peak corresponds to the
range of the molecular mass of ~ 400 – 280 kDa. The third peak corresponds to low molecular
weights ~ 2 – 15 kDa and contains 3xFLAG peptide as well as free subunits; however, from
the chromatogram of Vma5-3xFLAG, shown in the Figure 3.10 in orange, the third peak
could be composed of overlapping multiple peaks.
Figure 3.12. Chromatogram from V1-ATPase subcomplexes: A Superose 6 gel filtration
column was used to analyze V1-ATPase complexes tagged with 3xFLAG tags on different
subunits: A (Vma1) blue, E (Vma4) yellow, C (Vma5) orange, F (Vma7) green, H (Vma13)
brown. Each chromatogram contains three peaks (1 - 3) which were subjected to SDS-PAGE.

53
3.8.3 Characterization of partial V1-ATPase complexes by SDS-PAGE
To determine the subunit composition of each subcomplex all gel filtration fractions
were collected and analyzed by SDS–PAGE. The migration of all the tagged subunits on
SDS-PAGE was slower than that of the non-tagged subunits, consistent with their higher
molecular weights due to the presence of the 3xFLAG tag (Figure 3.13 – 3.16).
Intact V1-ATPase, containing all V1 subunits (A, B, C, D, E, F, G, and H), was found
in the first peak in all the tagged protein purifications and, interestingly, also in the
purification of C (Vma5) and H (Vma13). The band of subunit C, corresponding to the
molecular mass ~ 45 kDa, appeared in the protein purification of Vma13 (H) (Figure 3.16). In
addition to the eight bands corresponding to all the subunits, a ninth protein band was
observed (indicated by an asterisk in Figure 3.15 and 3.16) of molecular weight ~ 40 kDa in
the Vma5 (C) and Vma13 (H) purifications. The second peak (Figure 3.12) that was observed
in each purification shows subcomplexes containing An, Bn, Gn, En, but differed in other
subunits composition. The subunits that were observed in the E (Vma4) purification were An,
Bn, Gn, En and subunit H (~ 54 kDa) (Figure 3.14), Partial complexes containing Vma5 (C)
were resolved and found to contain An, Bn, Gn, En along with a high concentration of free
subunit C, an additional protein weak band was observed (indicated by an asterisk Figure
3.15). The subunits obtained from the Vma7-3xFLAG strain consisted of An, Bn, Gn, En, D,
and free F subunit that showed increasing density in late elution fractions (Figure 3.13).
Finally, subcomplexes of subunit H (Vma13) contained An, Bn, D, Gn, En, a weak band with
an apparent molecular mass of ~ 40 kDa, that was also detected in the first peak, and subunit
H (Figure 3.16).

54
Figure 3.13. Yeast V1-ATPase with F (Vma7) – 3xFLAG visualized by 12% SDS-PAGE
stained with Coomassie Blue after the gel filtration column. Lane 1, molecular mass
standard. Intact V1-ATPase complex contained all eight subunits (A, B, D, E, F, G, and H).
Partial V1-ATPase complexes contain A, B, D, E, F,G and H

55
Figure 3.14. Yeast V1-ATPase with E (Vma4) – 3xFLAG visualized by 12% SDS-PAGE
stained with Coomassie Blue after the gel filtration colum: Lane 1, molecular mass
standard. Intact V1-ATPase complex contained all eight subunits (A, B, C, D, E, F, G, and
H). Partial V1-ATPase complexes contained A, B, C, E, G, and H.
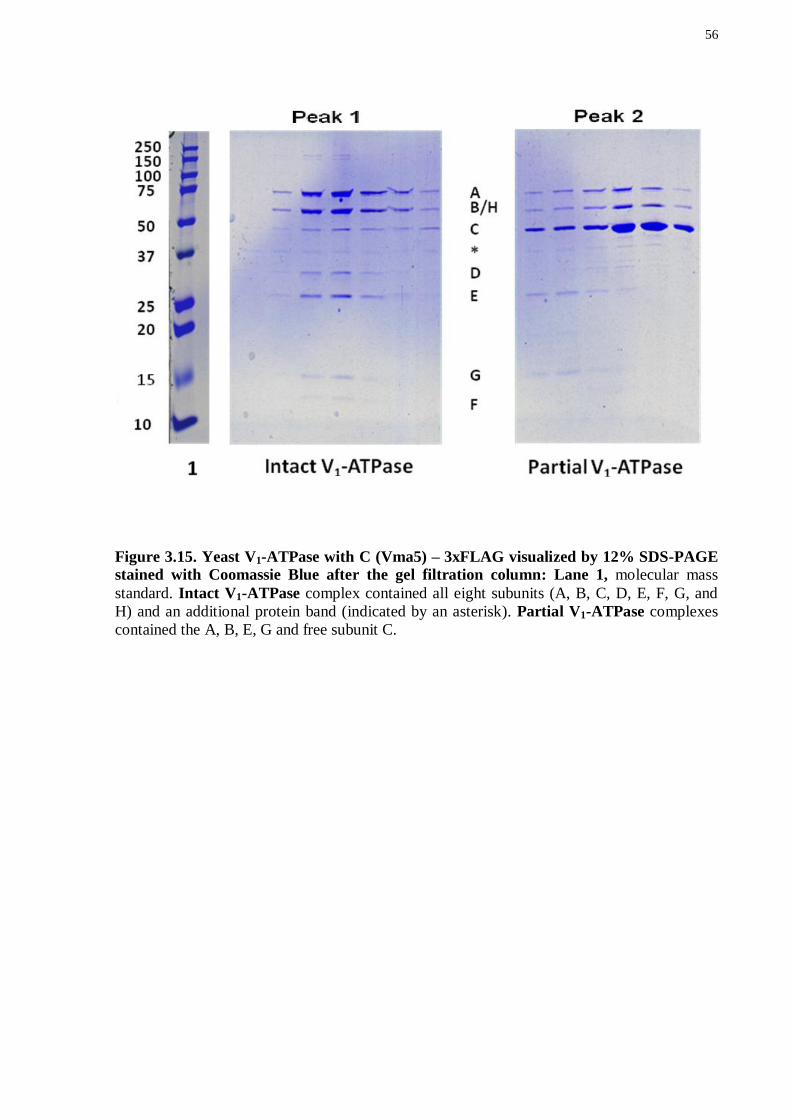
56
Figure 3.15. Yeast V1-ATPase with C (Vma5) – 3xFLAG visualized by 12% SDS-PAGE
stained with Coomassie Blue after the gel filtration column: Lane 1, molecular mass
standard. Intact V1-ATPase complex contained all eight subunits (A, B, C, D, E, F, G, and
H) and an additional protein band (indicated by an asterisk). Partial V1-ATPase complexes
contained the A, B, E, G and free subunit C.

57
Figure 3.16. Yeast V1-ATPase with H (Vma13) – 3xFLAG visualized by 12% SDS-
PAGE stained with Coomassie Blue after the gel filtration column. Lane 1, molecular
mass standard. Intact V1-ATPase complex contained all eight subunits (A, B, C, D, E, F, G,
and H) and an additional protein band (indicated by an asterisk). Partial V1-ATPase
complexes contain A, B, D, E, G, and H.
58
CHAPTER 4. Discussion and Conclusion
4.1 ISOLATION OF THE INTACT V1-ATPase
V-ATPase activity is regulated in cells by dissociation of the soluble V1 and
membrane-bound Vo regions of the complex. This process has been characterized mostly in
yeast and insect cells, where the dissociation and reassociation processes are rapid and
reversible (Jefferies et al 2008). Regulation of V-ATPase activity is an effective way to
reduce or increase proton pumping in response to cellular conditions such as glucose
depletion, pH changes, and the presence of heavy metals (Kane, 1995; Sumner et all, 1995).
As part of this regulatory mechanism, the dissociated V1 region does not hydrolyze ATP (Gräf
et al 1996) and the dissociated Vo region does not allow proton translocation through the
membrane (Beltran and Nelson, 1992). It is assumed that structural changes in the dissociated
V1-ATPase leads to inhibition of ATP hydrolysis. Therefore, knowledge of the structure of
the dissociated V1-ATPase, as well as the intact V1Vo-ATPase complex, is necessary for
understanding the regulation of V-ATPase activity.
In this thesis, I show that by introducing a 3xFLAG tag at the C terminus of different
V1-ATPase subunits, a highly purified V1-ATPase complex could be isolated. Previous
experiments with the V1-ATPase from yeast have suggested that the V1-ATPase from
glucose-deprived cells may lack subunits C (Vma5) and H (Vma13) (Gräf et al 1996; Svergun
et al 1998; Vitavska et al, 2003; Boesen and Nissen 2009). It has therefore been proposed that
the C and H subunits play a role in V-ATPase regulation.
In this thesis I demonstrate that the C and H subunits are actually present in the
dissociated V1 complex, at least substoichiometrically, even when yeast cultures are grown to

59
a high density. Indeed, high density cultures allow for the isolation of a V1-ATPase complex
containing all eight subunits (A, B, C, D, E, F, G and H), even though yeast cultures at high
density should experience the conditions thought to lead to dissociation of subunits C and H.
A V1 complex with eight subunits could be observed even using subunit C (Vma5–3xFLAG)
and H (Vma13–3xFLAG) tagged strains for purification. Attempts were made to use the
highly purified V1-ATPase in this study for structural analysis by cryo-EM.
4.2 STRUCTURAL STUDIES ON THE INTACT
V1-ATPase
In recent years, V1-ATPase structures from several organisms have been published at low
resolution. The negatively stained structure of the V1-ATPase from Manduca sexta was
reported at a resolution of 32 Å (Gruber et al 2000). The model showed the presence of six-
fold symmetric densities surrounding a seventh density, likely corresponding to the A3B3D
subcomplex. The peripheral subunits were not resolved in this structure. A later model of the
Saccharomyces cerevisiae V1-ATPase was published at a resolution of 25 Å; however, the
peripheral stalk subunits were not visible in this structure either (Zhang et al 2003). Recently,
the first cryo-EM structure of V1-ATPase was published (Hildenbrand et al 2010). This model
also did not elucidate the peripheral subunits. These studies show that the V1-ATPase
complex was disrupted during EM analysis.
For an initial analysis of the intact V1-ATPase, negative stain electron microscopy was
used. Images showed highly purified and homogenous protein particles. 2D image analysis
was performed with 1500 particle images that were aligned and classified. The class averages
showed apparent top views with six large densities arranged around a central density, whereas

60
apparent side view class averages also seemed to show the central stalk. The six-fold
symmetric densities appeared to correspond to the symmetric structure of the A3B3
subcomplex surrounded by the central stalk subunit D. 2D image analysis of the negatively
stained single particles was similar to the previously published structures of the V1-ATPase
(Gruber et al 2000; Zhang et al 2003).
Cryo-EM was used instead of negative stain in an attempt to prevent disruption of the
A3B3CDE3FG3H complex. However, the resulting class averages from cryo-EM showed
apparent top and bottom views of the complex with six-fold symmetry only, without the
density corresponding to the D subunit. The lack of peripheral and central stalk densities
indicated that intact V1-ATPase can break down into the A3B3 complex during cryo-EM grid
preparation. In order to prevent this artifact and to stabilize the V1-ATPase structure, various
experimental conditions were tested.
It has been shown that interaction with the air-water interface of a cryo-EM specimen
grid can affect the structure of proteins (Glaeser et al 1991). Detergents can coat the air-water
interface to prevent it from interacting with proteins. To avoid breakdown of the V1-ATPase
into the A3B3 subcomplex, an attempt was made to reduce protein interactions with the air-
water interface by adding detergent to the sample. However in this experiment, protein
particles were not observed in the amorphous ice, probably due to problems in obtaining
optimal conditions for freezing the grids.
Another hypothesis tested was that evaporation during cryo-EM grid preparation may
have lead to an increased salt concentration in the buffer, which can decrease protein stability
in solution. In order to overcome this possible predicament, salts were removed from the
protein buffer just prior to cryo-grid preparation by buffer exchange. However, images
61
obtained from this experiment showed V1-ATPase breakdown into subcomplexes identical to
what was observed previously. Therefore it can be argued that the salts were not the cause of
the protein instability.
Cold denaturation of the protein was another possibility tested that could potentially
cause dissociation of the V1-ATPase into its core (A3B3) and peripheral stalk regions. Cold
denaturation is a phenomenon caused by the temperature-dependent interaction of nonpolar
groups of proteins with water molecules. Decreased temperature can lead to increasing order
of water molecules, which in turn can enforce nonpolar interaction of water with protein.
Therefore, a decrease in temperature can potentially cause significant changes in protein
structure and possibly disruption of a protein complex (Privalov 1990). In this study, cryo-EM
grid preparation was performed at 4 °C, which is different from the native condition of V1-
ATPase, increasing the likelihood of cold denaturation. In order to test the hypothesis that
temperature was involved in disruption of the V1 complex, cryo-EM grid preparation was
carried out at room temperature. However, I was not able to obtain optimal amorphous ice
conditions during cryo-EM grid freezing from room temperature.
Chemical cross-linking is widely used in electron microscopy for protein stabilization
(Wong and Wong 1992; Prento 1995). Therefore, gluteraldehyde and formaldehyde were used
in an attempt to stabilize the protein complex. Even though analysis by native gel
electrophoresis revealed cross-linked V1-ATPase, the intact V1-ATPase was not successfully
visualized by cryo-EM under any cross-linking conditions tested.
Disruption of the V1-ATPase to the A3B3 subcomplexes was observed previously by
other groups and has also prevented them from obtaining the structure of the intact complex
by cryo-EM (Zhang et al 2003; Hildenbrand et al 2010). Since the protein complex

62
consistently breaks down from the intact V1-ATPase into the A3B3 complex during cryo-EM
specimen preparation, I was unable to use cryo-EM to determine the structure of the V1-
ATPase. However, by overcoming these barriers it may be possible to use cryo-EM. The
future experiments are described in Section 4.4.
4.3 ISOLATION OF PARTIAL V1-ATPase
SUBCOMPLEXES
In addition to the intact complex, partial V1-ATPase subcomplexes with different subunit
compositions were isolated. In the past, similar subcomplexes were observed after detergent
and temperature-driven V1-ATPase disassembly (Graf 1996; Rizzo et al 2003; Chaban 2003).
This study shows that these subcomplexes may be extracted from the cytoplasm of yeast cells
without chemical or thermal V1-ATPase disassembly. These partial subcomplexes were
isolated from late log phase yeast culture. All of the subcomplexes contained the major V1-
ATPase subunits A and B, but differed in the peripheral stalk subunit composition.
Furthermore, I showed that the partial V1-ATPase subcomplexes were stable by freezing and
thawing and gel filtration chromatography.
The presence of partial subcomplexes in the cell may be attributed to the
subcomplexes being involved in processes other than their known role in membrane-bound
proton-pumping by V-ATPases. Eukaryotic V-ATPase subunits have been shown to interact
with other proteins. For example, using a yeast two-hybrid screen it was shown that subunit H
interacts with yeast ectoapyrase and acts as an inhibitor of its activity (Zhang et al 2000).
Ectoapyrase is a member of an enzyme family that hydrolyzes a wide range of purine and
pyrimidine nucleosides in the presence of Ca2+
or Mg2+
cations (Plesner 1995). It was also
reported that subunit C released from the V1 region is involved in controlling the dynamics of
the actin cytoskeleton by interacting with F-actin and G-actin (Vitavska et al 2005).
63
Another possible explanation for the presence of the partial subcomplexes is that some
V-ATPase particles are not completely assembled. This hypothesis is based on the
observation that increasing the culture cell density results in increased abundance of the
partial complexes. One model of the V-ATPase assembly pathway proposes that the V1 and
Vo regions can be assembled independently (Tomashek et al 1997). According to this model,
V1 region intermediate subcomplexes are assembled in the cytosol, whereas assembly of the
Vo region occurs in the endoplasmic reticulum (ER). In this study I was able to extract
subcomplexes from cells. It can be argued that the partial complexes observed from yeast
cells represent these intermediately assembled complexes. Figure 4.1 depicts the possible
intermediates of V1-ATPase assembly.
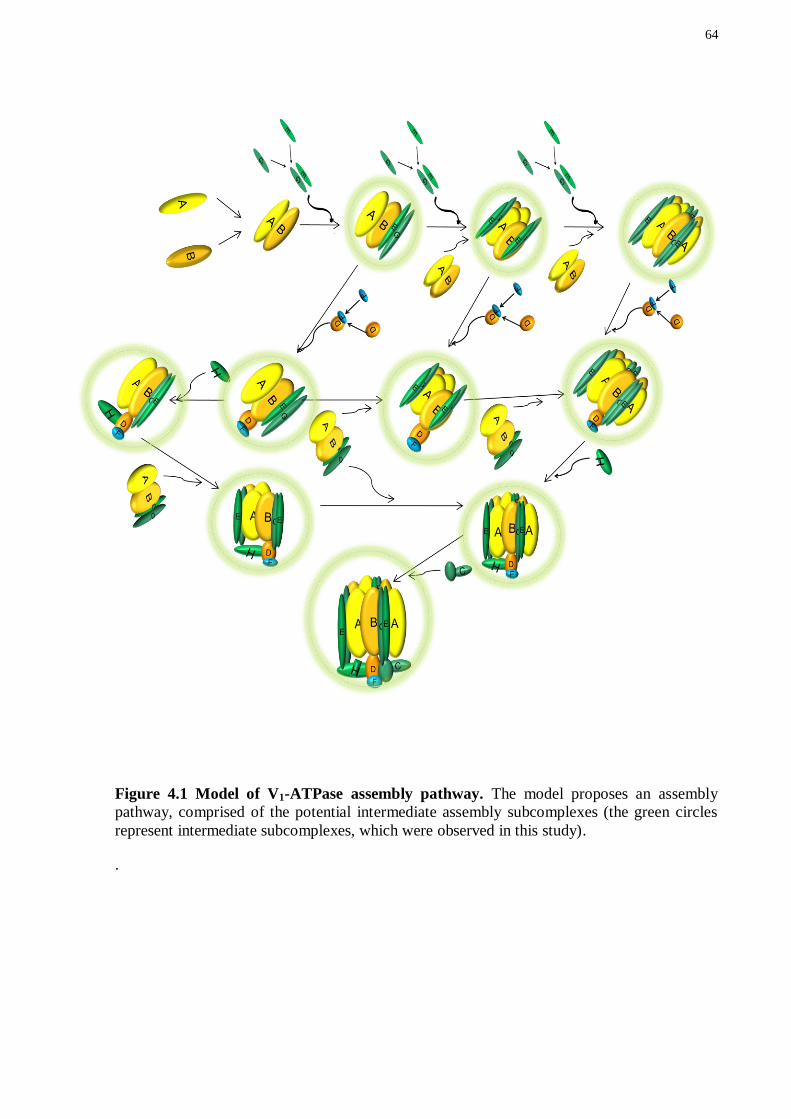
64
Figure 4.1 Model of V1-ATPase assembly pathway. The model proposes an assembly
pathway, comprised of the potential intermediate assembly subcomplexes (the green circles
represent intermediate subcomplexes, which were observed in this study).
.

65
4.4 FUTURE DIRECTIONS
Several studies have shown that specific cross-linking can link various V1-ATPase
subunits (Arata et al 2001; Inoue and Forgac 2005). In these studies, insertion of cysteine
residues, which participate in disulfide bonds were used to directly cross-link V1-ATPase
subunits to each other. In order to prevent the disruption of the V1-ATPase observed during
cryo-EM grid preparation, it could be useful to introduce cysteine residues into subunits to
allow for specific cross-link formation. For example, cross-link formation between cysteine
residues introduced into the core region subunit B (G106C, A199C, A15C and L45C) and
native cysteine residues of the peripheral subunits E and G, could prevent these regions from
separating (Arata et al 2002). Previous studies reported that the H and C subunits could be
released from the intact V1-ATPase (Parra et al 2000; Boesen and Nissen 2009) and it would
therefore be useful to stabilize the interaction between different subunits, such as E, G and H
and C, by introducing cysteine residues into C subunit (A217C and A220C) (Inoue and
Forgac 2005). This approach might make it possible to stabilize the V1-ATPase and determine
its intact structure by electron cryomicroscopy.
Before forming the final conclusion about the role of the observed partial subcomplexes in
V-ATPase assembly, additional experiments would be necessary. Tandem mass spectrometry
might allow for improved analysis of the subunit composition of the subcomplexes.
Analytical ultracentrifuge experiments could also precisely determine the molecular weights
of each subcomplex. The subunit composition of the subcomplexes could also be estimated
from the known molecular masses of the individual V1-ATPase subunits (molecular masses of
the subunits are given in Table 1. Introduction: Chapter 1: 1.2). Furthermore, in vivo studies
could provide insight into the involvement of V1 subunits and their subcomplexes in cellular

66
processes. For this approach, tagging different subunits with fluorescence probes could be
used to determine the subcellular localization of the subunits by in vivo Förster Resonance
Energy Transfer (FRET) (Seidel et al 2005) using confocal microscopy and spectral imaging.
67
CHAPTER 5. References
Arata Y, Baleja JD, Forgac M. (2002) Cysteine-directed cross-linking to subunit B suggests
that subunit E forms part of the peripheral stalk of the vacuolar H+-ATPase. Biol. Chem. 277,
3357–3363
Arata Y, Baleja JD, Forgac M. (2002) Localization of subunits D, E, and G in the yeast using
cystein-mediated- cross-linking to subunit B. Biochem. 41, 11301-11307
Amos LA, Henderson R, Unwin PNT. (1982) Three-dimensional structure determination by
electron microscopy of two-dimensional crystals. Prog. Biophys. Mol. Biol. 39, 183-231
Boekema EJ, van Breemen, JFL, Brisson A, Ubbink-Kok T, Konings WN, Lolkema, J. (1999)
Connecting stalks in V-type ATPase. Nature. 401, 37–38
Boesen T, Nissen P. (2009) V for victory – a V1-ATPase structure revealed. EMBO. 11, 1211
12
Bowman EJ, Bowman BJ. (1982) Identification and properties of an ATPase in vacuolar
membranes of Neurospora crassa. Bacteriol. 151 (3), 1326–133
Brenner S, Stresinger G, Horne RW, Champe SP, Barnett L, Benzer SW, Ress MW. (1959)
Structural components of bacteriophage. Mol. Biol. 1, 281-292.
Brown D, Breton S. (2000) V-ATPase dependent lumenal acidification in the kidney
collecting duct and the epididymis/vas deferens. Exp Biol 203, 127-145
Beltran C, Nelson N. (1992) The membrane sector of vacuolar H+-ATPase by itself is
impermeable to protons. Acta Physiol. Scand. 146, 41-47
68
Chaban, Y. L. Juliano, S., Boekema E. J., and Grüber, G. (2005) Interaction between subunit
C (Vma5p) of the yeast vacuolar ATPase and the stalk of the C-depleted V(1) ATPase from
Manduca sexta midgut. Biochim. Biophys Acta . 1708, 196-200
Chaban Y, Ubbink-Kok T, Keegstra W, Lolkema JS, Boekema EJ. (2005) Composition of
the central stalk of the Na+-pumping V-ATPase from Caloramator fervidus. EMBO 3, 982-
987
Carnell L, Moore HP, (1994) Transport via the regulated secretory pathway in semi-intact
PC12 cells: role of intra-cisternal calcium and pH in the transport and sorting of secretogranin
II. Cell Biol 127, (3):693-705
Cross RL, Müller V. (2004) The evolution of A-, F-, and V-type ATP synthases and ATPases:
reversals in function and changes in the H+/ATP coupling ratio. FEBS. 76, 1-4
Demaurex N, Furuya W, D'Souza S, Bonifacino JS, Grinstein S. (1998) Mechanism of
acidification of the trans-Golgi network (TGN). In situ measurements of pH using retrieval of
TGN38 and furin from the cell surface. Biol. Chem. 273, 2044–2051
Frank J, Penczek P. (1995) On the correction of the contrast transfer function in biological
electron microscopy. Optik. 98, 125-129
Frank J. (2009) Single-particle reconstruction of biological macromolecules in electron
microscopy – 30 years. Rev. Biophys. 42, 139-158
Frank J, Radermacher M, Penczek P, Zhu J, Li Y, Ladjadj M, Leith A. (1996). SPIDER and
WEB: Processing and visualization of images in 3D electron microscopy and related fields.
Struct. Biol. 116, 190-199
Fuller SJ, Gaitanaki C, Sugden PH. (1989) Effects of increasing extracellular pH on protein
synthesis and protein degradation in the perfused working rat heart. Biochem. 259, 173-17

69
Forgac M. (1999) Structure and properties of the vacuolar H+-ATPases. Biol. Chem. 274 (19):
12951–4
Foster DL, Fillingame RH. (1982) Stoichiometry of subunits in the H+-ATPase complex of
Escherichia coli. Biol. Chem. 257, 2009-2015
Feng Y, Forgac M. (1992a) A novel mechanism for regulation of vacuolar acidification. Biol.
Chem. 267, 19769-72
Feng Y, Forgac M. (1992b) Cysteine 254 of the 73-kD A subunit is responsible for inhibition
of the coated vesicle H+ -ATPase upon modification by sulfhydryl reagents. Biol. Chem. 267,
5817-5822
Fuller RS, Brake AJ, Thorner J. (1989) Intracellular targeting and structural conservation of a
prohormone-processing endoprotease. Science. 246, 482-486
Finbow ME, Harrison MA. (1997) The vacuolar H+-ATPase: a universal proton pump of
eukaryotes. Biochem. 324 ( Pt 3): 697–712
Forgac M. (2000) Structure, mechanism and regulation of the clathrin-coated vesicle and
yeast vacuolar H+-ATPases. Exp. Biol. 203, 71–80
Gräf R, Harvey WR, Wieczorek H. (1996) Purification and properties of a cytosolic V1-
ATPase. Biol. Chem. 271, 20908–20913
Glaeser RM, Zilker A, Radermacher M, Gaub HE, Hartmann T, Baumeister W. (1991)
Interfacial energies and surface-tension forces involved in the preparation of thin, flat crystals
of biological macromolecules for high-resolution electron microscopy. Microsc. 161, (1): 21-
45
Grüber M, Radermacher T, Ruiz J, Godovac-Zimmermann B, Canas D, Kleine-Kohlbrecher M, Huss
W, Harvey R, Wieczorek H. (2000) Three-dimensional structure and subunit topology of the V1-
ATPase from Manduca sexta midgut. Biochem. 39, 8609-8616

70
Glaeser RM, Taylor KA. (1978) Radiation damage relative to transmission electron
microscopy of biological specimens at low temperature. Microsc. 112, 127-138.
Herak-Kramberger CM, Brown D, Sabolic I. (1998) Cadmium inhibits vacuolar H+-ATPase
and endocytosis in rat kidney cortex. Kidney Int. 53,1713–1726
Hildenbrand ZL, Molugu SK, Stock D, Bernal RA. (2010) The C-H Peripheral Stalk Base: A
Novel Component in V1-ATPase Assembly. PLoS One. 3, 5 (9):e12588
Hall CE. (1955) Electron densitometry of stained virus particles. Biophys. Biochem. Cytol. 1,
(1): 1-12
Prento P. (1995) Glutaraldehyde for electron microscopy: a practical investigation of
commercial glutaraldehydes and glutaraldehyde-storage conditions. Histochem. 27, (11): 906-
13
Inoue T, Forgac M (2005) Cysteine-mediated cross-linking indicates that subunit C of the V-
ATPase is in close proximity to subunits E and G of the V1 domain and subunit a of the V0
domain. Biol. Chem. 280, 27896–27903
Kane PM. (1995) Disassembly and reassembly of the yeast vacuolar H+-ATPase in vivo. Biol.
Chem. 270, 17025–17032
Kane PM. (1999) Introduction: V-ATPases 1992-1998. Bioenerg. Biomembr. 31, (1): 3–5
Kane PM, Parra KJ. (2000) Assembly and regulation of the yeast vacuolar H+-ATPase. Exp.
Biol. 203, (1): 81 – 87
Kartner N, Yao Y, Li K, Crasto GJ, Datti A, Manolson MF (2010) Inhibition of osteoclast
bone resorption by disrupting vacuolar H+-ATPase a3-B2 subunit interaction. Biol. Chem. 26,
285 (48):37476-90
71
Kellokumpu S, Sormunen R, Kellokumpu I. (2002) Abnormal glycosylation and altered
Golgi structure in colorectal cancer: dependence on intra-Golgi pH. FEBS 516, 217–224
Lu M, Holliday LS, Zhang L, Dunn WA, Gluck SL. (2001) Interaction between aldolase and
vacuolar H+-ATPase: evidence for direct coupling of glycolysis to the ATP-hydrolyzing
proton pump. Biol. Chem. 10, 276, (32): 30407-13
Lau WCY, Rubinstein JL. (2010) Structure of intact Thermus thermophilus V-type ATPase
by cryo-EM reveals organization of the membrane-boundVo motor. Proc. Natl Acad. Sci. 107,
1367–1372
Lu X, Yu H, Liu SH, Brodsky FM, Peterlin BM. (1998). Interactions between HIV1 Nef and
vacuolar ATPase facilitate the internalization of CD4. Immunity 8, 647-656
Missiaen L, Van Acker K, Van Baelen K, Raeymaekers, L, Wuytack F, Parys JB, De Smedt
H, Vanoevelen J, Dode L, Rizzuto R, Callewaert G. (2004) Calcium release from the Golgi
apparatus and the endoplasmic reticulum in HeLa cells stably expressing targeted aequorin to
these compartments. Cell. Calcium. 36, 479–487
Michigami T, Kageyama T, Satomura K, Shima M, Yamaoka K, Nakayama M, Ozono K.
(2002) Novel mutations in the a3 subunit of vacuolar H+-adenosine triphosphatase in a
Japanese patient with infantile malignant osteopetrosis. Bone. 30, 436-439
Nelson, N, Harvey, W. R. (1999). Vacuolar and plasma membrane proton- adenosine
triphosphatases. Physiol. Rev. 79, 361-385.
Nishi T, Forgac M. (2002) The vacuolar (H+)-ATPases--nature's most versatile proton pumps.
Nat. Rev. Mol. Cell Biol. 3, (2): 94–103
Ohsumi Y, Anraku Y. (1985) Specific induction of Ca2+
transport activity in MATa cells of
Saccharomyces cerevisiae by a mating pheromone. a- factor. Boil. Chem. 260, 10482-10486
Perzov N, Padler-Karavani V, Nelson H, Nelson N. (2001) Features of V-ATPases that
distinguish them from F-ATPases. FEBS. 504, (3):223-8

72
Plesner L. (1995) Ecto-ATPases: identities and functions. Int. Rev. Cytol. 158, 141-214
Privalov PL. (1990) Cold denaturation of proteins. Crit. Rev. Biochem. Mol. Biol. 25, (4):281-
305
Rojas JD, Sennoune SR, Maiti D, Bakunts K, Reuveni M, Sanka SC, Martinez GM, Seftor
EA, Meininger CJ, Wu G, Wesson DE, Hendrix MJ, Martínez-Zaguilán R. (2006) Vacuolar-
type H+-ATPases at the plasma membrane regulate pH and cell migration in microvascular
endothelial cells. Physiol. Heart. Circ. Physiol. 291, 1147–115
Rizzo VF, Coskun Ü, Radermacher M, Ruiz T, Armbrüster A, Grüber G. (2003) Resolution
of the V1 ATPase from Manduca sexta into Subcomplexes and Visualization of an ATPase-
active A3B3EG Complex by Electron Microscopy. Biol Chem 3, 278 (1): 270-5
Roeth JF, Collins KL. (2006) Human Immunodeficiency Virus Type 1 Nef: Adapting to
Intracellular Trafficking Pathways. Mic .Mol. Biol. Rev. 70, 548–563
Schwartz AL. (1990) Cell biology of intracellular protein trafficking. An. Rev. Immunol. 8,
195–229
Schwartz MA, Both G, Lechene C. (1989) Effect of cell spreading on cytoplasmic pH in
normal and transformed fibroblasts. Nature. 86, 4525-4529
Schwarz MA, Gragoe EJ, Jr, Lechene CP (1990) pH regulation in spread and round cells. Biol
Chem. 265, 1327-1332
Stock D, Leslie AGW, Walker JE (1999) Molecular architecture of the rotary motor in ATP
synthase. Science. 286, 1700-1705
Smardon AM, Tarsio M, Kane PM (2002) The RAVE complex is essential for stable
assembly of the yeast V-ATPase. Biol Chem. 277, (16):13831-9

73
Smardon AM, Kane PM. (2007) RAVE Is Essential for the Efficient Assembly of the C
Subunit with the Vacuolar H+-ATPase. Biol. Chem. 282, (36): 26185 - 26194
Stathopoulou K, Gaitanaki C, Beis I. (2006) Extracellular pH changes activate the p38-MAPK
signalling pathway in the amphibian heart . Exp. Biol. 209, 1344-1354
Sze H, Ward JM, Lai S. (1992) Vacuolar H+-translocating ATPases from plants: structure,
function, and isoforms. Bioenerg Biomembr. 24, (4):371-81
Saroussi S, Nelson N (2009) The little we know on the structure and machinery of. V-
ATPase. Exp Biol. 212, 1604-1610
Sennoune SR, Martinez-Zaguilan R. (2007) Plasmalemmal vacuolar H+-ATPases in
angiogenesis, diabetes and cancer. Bioenerg. Biomembr. 39, 427–433
Steven A, Belnap D. (2005) Electron microscopy and image processing: an essential tool for
structural analysis of macromolecules Prot. Science. 17, (2):1-39
Svergun DI, Konrad S, Huss M, Koch MHJ, Wieczorek H, Altendorf K, Volkov VV, Gruber
G. (1998) Quaternary structure of V1 and F1 ATPase: Significance of structural homologies
and diversities. Biochem. 37, 17659–17663
Sumner JP, Dow JA, Earley FG, Klein U, Jager D, Wieczorek H. (1995) Regulation of plasma
membrane V-ATPase activity by dissociation of peripheral subunits. Biol. Chem. 270, (10):
5649-53
Smith JM. (1999) Ximdisp--A visualization tool to aid structure determination from electron
microscope images. Struct. Biol. 125, 223-8
Thuman-Commike PA. (2001) Single particle macromolecular structure determination via
electron microscopy. FEBS. 14,505 (2): 199-205

74
Ubbink-Kok T, Boekema E, van Breemen, JFL, Brisson A, Konings WN, Lolkema, J. (2000)
Stator structure and subunit composition of the V1/V0 Na+-ATPase of the thermophilic
bacterium Caloramator fervidus. Mol. Biol. 296, 311–321
Vitavska O, Wieczorek H, Merzendorfer H. (2003). A novel role for subunit C in mediating
binding of the H+-V-ATPase to actin cytoskeleton. Biol. Chem. 278, 18499-18505.
Vitavska O, Merzendorfer H, Wieczorek, H. (2005). The V-ATPase subunit C binds to
polymeric F-actin as well as monomeric G-actin and nduces cross-linking of actin filaments.
Biol. Chem. 280, 1070-1076.
van Heel M, Gowen B, Matadeen R, Orlova EV, Finn R, Pape T, Cohen D, Stark H, Schmidt
R, Schatz M, Patwardhan A. (2000). Single-particle electron cryo-microscopy: Towards
atomic resolution. Biophys. 33, 307–369
Wilkens S, Vasilyeva E, Forgac, M. (1999) Structure of the vacuolar ATPase by electron
microscopy. Biol. Chem. 274, 31804–31810
Weisz OA. (2003) Organelle acidification and disease. Traffic 4, 57–64
Wong S, Wong LJ. (1992) Chemical crosslinking and the stabilization of proteins and
enzymes, Enzm. Microb. Technol. 14, 866–874
Zhang Z, Charsky C, Kane PM, Wilkens S. (2003) Yeast V1-ATPase: affinity purification and
structural features by electron microscopy. Biol. Chem. 278, 47299–47306
Zhang J, Myers M, Forgac M. (1992) Characterization of the V0 domain of the coated vesicle
H+-ATPase, Biol. Chem. 267, 9773–9778
Zhang X, Jin L, Fang Q, Hui WH, Zhou ZH (2010) 3.3 Å cryo-EM structure of a
nonenveloped virus reveals a priming mechanism for cell entry. Cell. 141, 472-482
75
Zheng Z, Mazon Y, Milgrom H, Kitagawa E, Kish-Trier N, Heck E, Kane AJ, Wilkens S
(2008) Structure of the yeast vacuolar ATPase. Biol. Chem. 283, 35983–35995