structural performance of high rise building with rc
TRANSCRIPT

International Research Journal of Engineering and Technology (IRJET) e-ISSN: 2395-0056
Volume: 08 Issue: 07 | July 2021 www.irjet.net p-ISSN: 2395-0072
© 2021, IRJET | Impact Factor value: 7.529 | ISO 9001:2008 Certified Journal | Page 711
Structural Performance of High Rise Building with RC Structural Wall.
Er. Supriya Patil1, Dr.M.N.Bajad2
1P.G.Student, Sinhgad College of Engineering Pune, Maharashtra State, India 2Professor, Dept. of civil Engineering, Sinhgad College of Engineering, Pune, Maharashtra State, India
-----------------------------------------------------------------------------***----------------------------------------------------------------------------
Abstract-Now RC Structural wall construction in metropolitan cities is widely used. Due to the growing population in India, the new construction technique should be adopted for the faster construction process. Aluform technology in this technique beam and column are replaced by reinforced concrete wall system and whole building is design with RC structural wall i.e. shear wall. It is specially design to allow rapid design of high rise building G+ 24 storey with RC structural wall and its advantages as a structural point of view. For this thesis design software ETABS is used for design and analysis. Analysis is carried out considering the various static and dynamic seismic and wind loads are used. For validation of work we will go for part manual calculation to check correctness of analysis. Then design of system is carried out. Concluding remark will be given with respective high structural performance. Keywords – High rise building, Aluform Technique, Analysis and Design, ETABS V18.0, Wind load and Seismic load.
1. INTRODUCTION Population of India is growing fast in urban area or in metro cities. This is the basic reason for increasing land cost in cities. With increasing land cost, it is not surprising that the number of stories in building in urban area across the country is increasing rapidly. Therefore the construction of tall structures such as high rise building, sky scrapers or sky towers is an important indicator of country or city economic and technological strength with the continued development and progress of the economy, technology and material in recent years. In beam column system of buildings reinforced concrete frames are provided in both principal directions to resist vertical loads and the vertical loads are transmitted to vertical framing system i.e. columns and foundations. This type of systems is effective in resisting both vertical & horizontal loads. The lateral load resisting system provided in multi storey building is moment resisting frame, with beams being eliminated in years in majority of the building to simplify and accommodate the use of more economical framework. In recent years R.C. tube structure and R.C. structural wall have been introduced to provide the required stiffness.
1.1NEED OF RESEARCH
The variation between the supply and the demand mass housing is tremendous. Rapid Urbanization has resulted in a geometric increase in the housing demand, which cannot be fulfilled by conventional column beam method of construction. The traditional or conventional method of construction for affordable housing is comparatively a slow process and limited quality control, particularly when a large size project is involved It is therefore obligatory to work out A method or scheme where the speed and quality of construction are controlled but a systematic approach. Structures with Structural walls are more earthquake resistant .Therefore aluminum formwork system identified to be suitable for Indian conditions for mass housing. To achieve the value added construction projects without compromising the quality at any cost as the concept of value engineering represented.
Therefore, structural performance of high rise building with structural walls needs to be investigated.
1.2 AIM AND OBJECTIVE OF STUDY
Within the scope of this study, the main objectives of study is to investigate the possibility. To find parameters like storey displacements, base shear, and relative storey drifts and irregularities of structure under static and dynamic wind and seismic loads. The aim of this study is achieved through the following objectives: To analyze the structure under dynamic wind and seismic loading and to understand the behavior of structure subjected to lateral loading with the help of time period, frequency, modal mass participating ratio.
1.3. LIMITATION.
Wind and earthquake forces are the most predominant loads that demand lateral design of structures. Large Therefore, buildings should be designed with the earthquake-resistance, comfort and convenience in mind.

International Research Journal of Engineering and Technology (IRJET) e-ISSN: 2395-0056
Volume: 08 Issue: 07 | July 2021 www.irjet.net p-ISSN: 2395-0072
© 2021, IRJET | Impact Factor value: 7.529 | ISO 9001:2008 Certified Journal | Page 712
2. LITERATURE REVIEW
Rahul b. Mojidral, et.al [12] [2017]: Focused on the Seismic design of buildings, reinforced concrete structural walls, or shear walls, act as major earthquake resisting members. Concerts walls are provided for the additional Concerts walls are provided for the additional gravity force resistant. The properties of these seismic shear walls here fore, it is important to evaluate the seismic response of the walls appropriately. In these papers conventional, monolithic with external walls structural systems and monolithic with internal wall system for G+ 20, G+ 25, G+ 30 stories was studied with the help of ETABS V 15 analysis and design. Additional parameters like Lateral displacement, story drift are calculated for both the structures. We concluded that there is drastic improvement in the monolithic structure as compared to conventional structure in term of strength as well as cost.
Ashish Sadh, et.al [2018][1]this study the behavior of high rise building against the wind force in wind zone 2nd, L shape is studied and analyzed for specific heights. Also direction of wind plays very vital role in behavior of structure.
M. A. Hube et.al [8][2014] have done analysis of seismic Behavior of RC slender structural wall. Researcher had Mentioned effect of Chile Earthquake on RC structural walls and its damage analysis in year 2010.The objectives of this research is to understand observed damaged in slender walls i.e. crushing of concrete ,buckling and fracture of reinforcement . Recommendations had provided to avoid the lateral displacement and effective stiffness to slender walls.
P. P. Chandurkar [11][2013] had presented study of G + 9 building having three meters height foe each storey. The whole building design had carried out according to IS code for seismic resistant design and the building had considered fixed at base. Structural element for design had assumed as square or rectangular in section .they had done modeling of building using ETAB software in that four different models were different positioning of shear walls. M.G Rajendran[2][2013]presents the study of comparison of the difference between the wind behavior of building with and without shear wall using Staad Pro. In this paper the Staad model of 15 storey building considered to carry out study with and without shear wall using and also 20 storeys building will model same as it. Displacement of 15 storey building and 20 storey building ith shear wall is 20.18% and 14.60% less than the building without
shear wall. They concluded that building with shear wall will resist wind load effectively.
3. METHODOLOGY AND INVESTIGATION 3.1 Introduction Study of this work is based on analysis of high rise
residential building G+24 storey with RC structural wall by using Etab18.1.0.located in Pune Modeling is done in ETAB18.1.0. Run analysis, results are concluded. Manual Calculation are done to verify the software result.
3.2. Description of the Building
Table 1.1- Description of the Building
Table 1.2 Seismic, Wind, Dead, Live Loading Parameters
Sr.No. Parameter Value
1 Seismic coefficient as per IS:1893-2016
Type of Structure SMRF
Seismic Zone III
Response Reduction Factor 4
Importance Factor 1
Number of storey G+24 Storey
Floor Height 2.9m
Floor to Floor height 71 .6m
Soil bearing capacity As per soil report, SBC at a depth of 2m to 7.5m is 40 t/m2 considered
Depth of foundation 2m
Slab thickness 0.125m
Sunk slab thickness 0.1m
Wall thickness 0.2m
Concrete Grade M40
Steel Grade FE500

International Research Journal of Engineering and Technology (IRJET) e-ISSN: 2395-0056
Volume: 08 Issue: 07 | July 2021 www.irjet.net p-ISSN: 2395-0072
© 2021, IRJET | Impact Factor value: 7.529 | ISO 9001:2008 Certified Journal | Page 713
2 Wind Coefficient as per IS:875
Design wind speed 3 39.0 m/s
Terrain category 3
3 Dead Load
Floor Finish (Floors) 1.2KN/m 2
Floor Finish (Staircase) 3KN/ m 2
Sunk Slab 9KN/ m 2
4 Live Load 2KN/ m 2
Floors 2KN/m 2
Staircase 3KN/ m 2
Figure 1.3 – ETAB model with Structural Wall
3.3 Seismic Load 3.3.1. Time Period
Time period will be calculated based on following equation as per IS 1893- 2016 clause no- 7.6.2 i).Time period T is given by following equation, as per IS1893:2016 Clause No.
Where,
H = height of building and D base dimension of building in meter
ii) Time period for shear wall is calculated by
following formula,
T =
Aw
h 75.0^075.0
3.3.2 Seismic Weight
W is the seismic weight of the building.
International Research Journal of Engineering and Technology (IRJET) e-ISSN: 2395-0056
Volume: 08 Issue: 07 | July 2021 www.irjet.net p-ISSN: 2395-0072
© 2021, IRJET | Impact Factor value: 7.529 | ISO 9001:2008 Certified Journal | Page 714
For the purpose of estimating the seismic weight of the building, full dead load and part live load are to be included.
The proportion of live load to be considered is given by IS: 1893 (Part 1) as per Table 10; live load need not be considered on the roofs of buildings in the calculation of design earthquake force.
Since the live load is 2Kn/sqm only 50% of the live load is lumped at the floors.
Hence, the total seismic weight on the floors and the roof is:
Floors: W1=W2 =W3
2.3. Force Distribution with Building Height: Storey level
Wi (Kn)
hi(m)
Wi*hi*1000
Wihi2/Wihi2
Lateral Force at ith Level for EL in Direction (KN)
3.3.3 Design Base Shear (Vb)
(Vb) =Ah x W………IS1893:2016 Clause No.7.6.1 Where, Ah = Design horizontal acceleration W = Seismic Weight
3.3.4.Design horizontal acceleration (Ah) Design horizontal acceleration (Ah) or design horizontal base shear coefficient (Ah) of a building is a function of its translational natural periods in the considered direction of design lateral force. The design horizontal acceleration will be calculated based on following equation as per IS1893-2016 clause no.6.4.2
Where, Z = Seismic Zone factor I = Importance factor I R = Response reduction factor R
Sa/g = design acceleration coefficient
For different soil type
3.4. Wind Load High-rise buildings are strongly sensitive to wind loads and wind forces are applied to exposed surfaces of the building
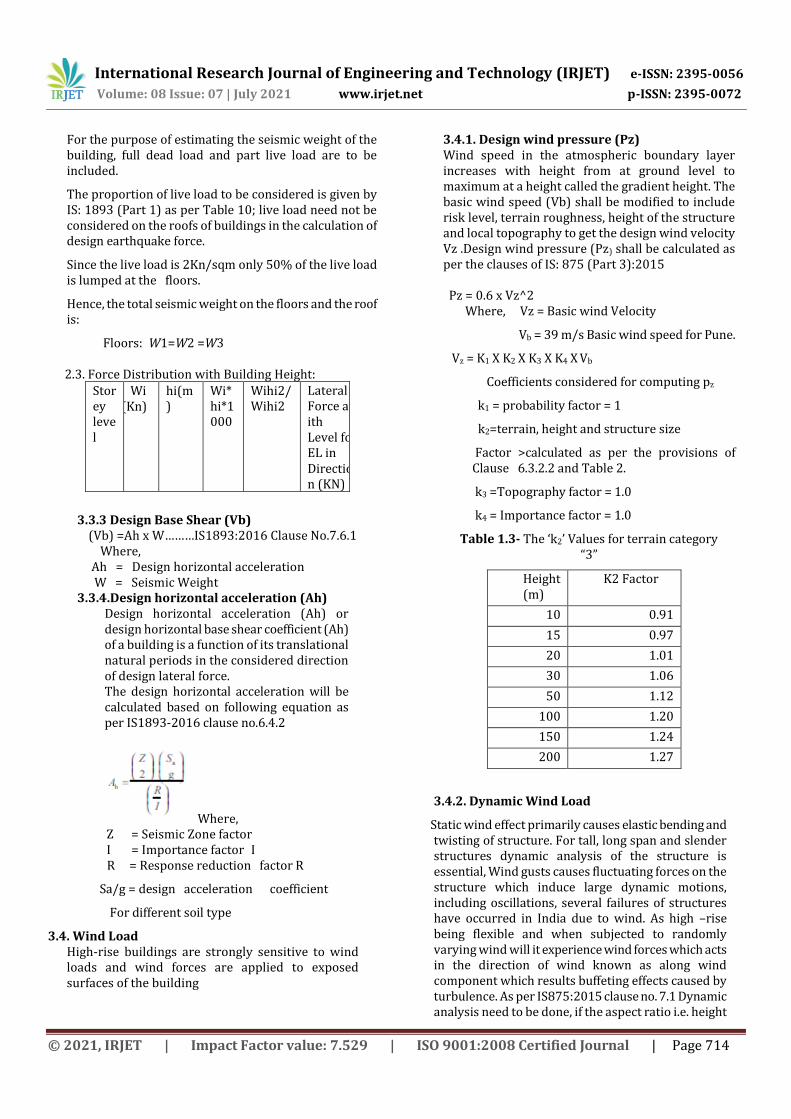
3.4.1. Design wind pressure (Pz) Wind speed in the atmospheric boundary layer increases with height from at ground level to maximum at a height called the gradient height. The basic wind speed (Vb) shall be modified to include risk level, terrain roughness, height of the structure and local topography to get the design wind velocity Vz .Design wind pressure (Pz) shall be calculated as per the clauses of IS: 875 (Part 3):2015 Pz = 0.6 x Vz^2
Where, Vz = Basic wind Velocity
Vb = 39 m/s Basic wind speed for Pune.
Vz = K1 X K2 X K3 X K4 X Vb
Coefficients considered for computing pz
k1 = probability factor = 1
k2=terrain, height and structure size
Factor >calculated as per the provisions of Clause 6.3.2.2 and Table 2.
k3 =Topography factor = 1.0
k4 = Importance factor = 1.0
Table 1.3- The ‘k2’ Values for terrain category “3”
Height (m)
K2 Factor
10 0.91
15 0.97
20 1.01
30 1.06
50 1.12
100 1.20
150 1.24
200 1.27
3.4.2. Dynamic Wind Load
Static wind effect primarily causes elastic bending and twisting of structure. For tall, long span and slender structures dynamic analysis of the structure is essential, Wind gusts causes fluctuating forces on the structure which induce large dynamic motions, including oscillations, several failures of structures have occurred in India due to wind. As high –rise being flexible and when subjected to randomly varying wind will it experience wind forces which acts in the direction of wind known as along wind component which results buffeting effects caused by turbulence. As per IS875:2015 clause no. 7.1 Dynamic analysis need to be done, if the aspect ratio i.e. height

International Research Journal of Engineering and Technology (IRJET) e-ISSN: 2395-0056
Volume: 08 Issue: 07 | July 2021 www.irjet.net p-ISSN: 2395-0072
© 2021, IRJET | Impact Factor value: 7.529 | ISO 9001:2008 Certified Journal | Page 715
to minimum lateral dimension ratio is more than 5 or the natural frequency in the first mode is less than 1.0.Hz. For Calculation of Time Period
3.4.3. Along wind load –
As per IS875:2015 clause no.8.3 and figure 8, figure 9, figure 10, figure 11 We can calculate Gust Factor and dynamic wind. Along wind load on a structure on a strip area (a) at any height (2) is given by,
Fz = Cf * Ae * Pz * G Where, Fz = along wind load on the structure at any height z corresponding to strip area Cf = force coefficient for the building Ae = effective frontal area considered for the structure at height c, Pz = Design pressure at height z due to hourly mean wind obtained as 0.6Vz 2 (N/m2) G= Gust factor given by,
3.4.4. Gust Factor
It is the ratio between the peak wind gust of a specific duration to the mean wind speed for a period of time.
Table.1. 4- Gust Wind Load Coefficient
H = Total height of main
structure of the building in
meters above Ground level
B = Breadth of a structure in the
horizontal plane normal to
wind direction
D = Maximum base dimension of
building in meters
In a direction parallel to the
applied wind force.
Tx = Time period of building
/structure in along wind
direction
(corresponding displaced
Mode)
fx = l/T
gR = Peak factor for resonant
response
√[2ln(3600Xfa)]
β = Damping Coefficient
k1 = Probability factor(risk
coefficient)
K2 = Terrain roughness and
height factor
K3 Topography factor
k4 = Importance factor for
cyclonic region
Vb = Regional wind basic speed.
Vhd = Design Hourly mean wind
speed at height z
= Vhd = Vb k1 k2 k3 k4
Pz = Wind pressure at height z
= 0.60 Vhd2
Pd = Design Wind Pressure
= Kd Ka Kc pz
Lh = Measure of effective
turbulence length scale at
height h
N = Effective reduced frequency
E = Spectrum of turbulence in
the approaching wind
stream
b0h = Average breadth of building
between 0 to h
S = Size reduction factor
Hs = Height Factor for resonance
response
gv = Peak factor for upwind velocity
fluctuation

International Research Journal of Engineering and Technology (IRJET) e-ISSN: 2395-0056
Volume: 08 Issue: 07 | July 2021 www.irjet.net p-ISSN: 2395-0072
© 2021, IRJET | Impact Factor value: 7.529 | ISO 9001:2008 Certified Journal | Page 716
Cy = Lateral correlation constant
which may be taken as 10 in the
absence of more precise load
data.
Cz = Longitudinal correlation
constant which may be taken as
12 in the absence of more
precise load data.
Ih,i = Turbulence intensity at height h
in terrain category i
r = roughness factor which is twice
the longitudinal turbulence
intensity (lh) = 2ln
Bs = Background Factor indicates the
measure of slowly s varying
component of fluctuating wind
load caused by lower frequency
wind speed variations.
ɸ = factor to account for second order
turbulence intensity
Gx = Gust Factor
Table .1.5 -Hourly mean wind speed factor
different heights
Height(m) K2
factor
Up to 10 0.5
15 0.55
20 0.59
30 0.64
50 0.7
100 0.79
150 0.84
200 0.88
250 0.91
300 0.93
350 0.95
400 0.97
450 0.98
500 0.99
Figure..1.4: Value of gfr and L(h)
Figure.1.5: Value of background factor

International Research Journal of Engineering and Technology (IRJET) e-ISSN: 2395-0056
Volume: 08 Issue: 07 | July 2021 www.irjet.net p-ISSN: 2395-0072
© 2021, IRJET | Impact Factor value: 7.529 | ISO 9001:2008 Certified Journal | Page 717
Figure.1.6: Size reduction factor
Figure. 1.7: Gust Energy Factor
Table .1.6 Gust Factor – X direction
H
Total height of main structure of the building in meters above Ground level 71.60
m
B
Breadth of a structure in the horizontal plane normal to wind direction
39. 48
m
D
Maximum base dimension of building in meters in a direction parallel to the applied wind force. 12.75
m
Tx 0.09 h/sq39.48 1.03 Sec f0x l/T 0.97 Sec
L(h) For H = 1300.
00
g f r For H = 1.30
Cy
Lateral correlation constant which may be taken as 10 in the absence of more precise load data 10.00
Cz Longitudinal correlation 12.00
constant which may be taken as 12 in the absence of more precise load data
LAMDA(X)
Cyb / (Cz H)
0.46
Czh/L(h)
0.66
BX
Background factor indicating a measure of slow varying compound of fluctuating wind load & is obtained from fig.9 0.70
Category
For H =
Vb Regional wind basic speed, for Pune 39.00
m/s
k1 Probability factor, for 50 year return period 1.00
k2
Hourly mean wind speed factor (see table 33) 0.74
k3 Topography factor, for flat terrain 1.20
V1h Hourly mean wind speed at height z
V1z = Vb k1 k2 k3 34.63 m/s
pz1
Design pressure at height z due to hourly mean wind
0.60 Vz2 719.6
3 N/m2
F0 Czf0h/V1h 24.09
SX Size reduction factor fig 10 0.12
f0L(h)/V1h
36.44
E
Measure of available energy in the wind stream at the natural frequency of the structure (fig 11) 0.01
Beta Bd
Damping coefficient – for RC structures 0.016
f (g f r B0.5)/4
0.00 for building higher than 25m in category – 3 0.00
GX guest factor
1 + g f r [B(1+f)2 + SE/b]0.5 2.14

International Research Journal of Engineering and Technology (IRJET) e-ISSN: 2395-0056
Volume: 08 Issue: 07 | July 2021 www.irjet.net p-ISSN: 2395-0072
© 2021, IRJET | Impact Factor value: 7.529 | ISO 9001:2008 Certified Journal | Page 718
Table.1.7. Gust Factor – Y direction
H
Total height of main structure of the building in meters above Ground level 71.60 m
B
Breadth of a structure in the horizontal plane normal to wind direction 12.75 m
D
Maximum base dimension of building in meters in a direction parallel to the applied wind force. 39.45 m
Ty 0.09 h/sq12.75 1.80 Sec
f0y l/T 0.55 Sec
L(h)
For H =71.6m value is obtained from fig. 8 1300.00
g f r
For H =71.6m value is obtained from fig. 8 1.30
Cy
Lateral correlation constant which may be taken as 10 in the absence of more precise load data 10.00
Cz
Longitudinal correlation constant which may be taken as 12 in the absence of more precise load data 12.00
LAMDA(X) Cyb / (Cz H) 0.15 Czh/L(h) 0.66
BX
Background factor indicating a measure of slow varying compound of fluctuating wind load & is obtained from fig.9 0.01
Category For H = 71.6m 3
Vb
Regional wind basic speed, for pune 39.00 m/s
k1
Probability factor, for 50 year return period 1.00
k2
Hourly mean wind speed factor (see table 33) 0.74
k3
Topography factor, for flat terrain 1.20
V1h
Hourly mean wind speed at height z
V1z = Vb k1 k2 k3 34.63 m/s
pz1
Design pressure at height z due to hourly mean wind
0.60 Vz2
719.63 N/m2
F0 Czf0h/V1h 13.75
SX
Size reduction factor fig 10 0.13
f0L(h)/V1h 20.80
E
Measure of available energy in the wind stream at the natural frequency of the structure (fig 11) 0.12
Beta Bd Damping 0.016

International Research Journal of Engineering and Technology (IRJET) e-ISSN: 2395-0056
Volume: 08 Issue: 07 | July 2021 www.irjet.net p-ISSN: 2395-0072
© 2021, IRJET | Impact Factor value: 7.529 | ISO 9001:2008 Certified Journal | Page 719
coefficient – for RC structures
f (g f r B0.5)/4
0.00 for building higher than 25m in category – 3 0.00
GY guest factor
1 + g f r [B(1+f)2 + SE/b]0.5 2.29
Table.1.8: Dynamic wind load calculation
Storey
Height
Cum.Ht
K2 Gx Gy Pz Fx Fy
24 2.9 71.6 0.744 2.55 2.51 505.293 67.542 207.270 23 2.9 68.7 0.739 2.53 2.51 498.228 67.542 204.352 22 2.9 65.8 0.743 2.53 2.51 491.213 66.591 201.454 21 2.9 62.9 0.728 2.53 2.51 484.288 65.647 198.578 20 2.9 60.0 0.723 2.53 2.51 477.333 64.709 195.721 19 2.9 57.1 0.718 2.53 2.51 470.467 63.779 195.721 18 2.9 54.2 0.713 2.53 2.49 463.651 62.855 192.886 17 2.9 51.3 0.708 2.53 2.49 456.885 61.937 188.679 16 2.9 48.4 0.702 2.51 2.49 450.169 61.027 185.906 15 2.9 45.5 0.695 2.51 2.49 441.062 59.398 182.145 14 2.9 42.6 0.687 2.51 2.49 430.092 57.921 177.615 13 2.9 39.7 0.678 2.51 2.09 419.260 56.462 173.141 12 2.9 36.8 0.669 2.51 2.09 408.566 55.022 141.601 11 2.9 33.9 0.660 2.5 2.09 398.011 53.600 137.942 10
2.9 31 0.652 2.5 2.09 387.593 51.847 134.332
9 2.9 28.1 0.643 2.5 2.09 377.314 50.472 130.769 8 2.9 25.2 0.631 2.48 2.09 362.786 48.529 125.734 7 2.9 22.3 0.616 2.48 2.09 346.292 46.006 120.017 6 2.9 19.4 0.602 2.46 2.09 330.181 43.865 114.434 5 2.9 16.5 0.585 2.09 2.09 312.528 41.231 108.316 4 2.9 13.6 0.562 2.09 2.09 288.879 32.262 99.898 3 2.9 10.7 0.539 2.09 2.09 264.933 29.563 91.280 2 2.9 7.8 0.553 2.09 2.09 278.879 25.253 79.072 1 2.9 4.9 0.5 2.09 2.09 288.150 21.574 66.802 G 2.0 2 0.5 2.09 2.09 288.150 8.806 27.266