structural optimization using graphic statics · structural optimization using graphic statics ......
TRANSCRIPT

Struct Multidisc OptimDOI 10.1007/s00158-013-1002-x
RESEARCH PAPER
Structural optimization using graphic statics
Lauren L. Beghini · Juan Carrion ·Alessandro Beghini · Arkadiusz Mazurek ·William F. Baker
Received: 24 March 2013 / Revised: 13 September 2013 / Accepted: 13 September 2013© Springer-Verlag Berlin Heidelberg 2013
Abstract This paper presents a method for structural opti-mization of discrete trusses using Graphic Statics. Asopposed to traditional structural optimization techniques,which are typically conducted by manipulating the geom-etry of the structure (the form diagram), the approachpresented in this paper establishes a Graphic Statics solutionto the problem, where structural optimization is conductedusing design variables in the force domain (force diagram).The proposed approach presents several attractive featurescompared to traditional approaches. Since it is based onreciprocal graphical relationships between form geome-try and forces, member stiffnesses need not be calculated.Additionally, by working on the force diagram, equilibriumof the solution is guaranteed, and no additional methodsare required to enforce this condition; for example, thereis no need to triangulate the structure or to add small areamembers. Furthermore, because only solutions that are inequilibrium are permitted, the number of design variablescan be reduced. Also, subject to certain relationships, thelocation of the loads (or reactions) do not need to be seta priori. Through examples, it is shown that the proposedmethodology can readily accommodate different tensile andcompressive stresses for volume optimization problems andthat, through the use of Graphic Statics, other restrictions orconstraints on the member forces can easily be incorporated.
J. Carrion · A. Beghini · A. Mazurek · W. F. Baker (�)Skidmore, Owings & Merrill, LLP, 224 S.Michigan Avenue, Chicago, IL 60604, USAe-mail: [email protected]
L. L. BeghiniDepartment of Civil and Environmental Engineering,University of Illinois at Urbana-Champaign,205 N. Matthews Ave., Urbana, IL 61801, USA
Keywords Structural optimization · Truss optimization ·Reciprocal diagrams · Graphic statics
1 Introduction
Structural topology optimization is a powerful and well-established technique to determine the optimal geometryto design efficient systems. Optimization has been suc-cessfully used in many fields of science, for example, see(Sigmund 2000; Krog et al. 2004; Sutradhar et al. 2010;Altair Engineering Web Page 2013). In structural engineer-ing, as part of the natural design process, we continuouslyseek efficient structures and corresponding methodologiesto find such structures. These resulting structures mustachieve the intended purpose, while typically keeping thecost (and generally the use of natural resources) to aminimum.
There are several methods that have been used for struc-tural optimization, and their utilization depends on thespecific project or application considered. These meth-ods include topology optimization, shape optimization, sizeoptimization, and form finding, amongst others. Solutionsto these methods can be determined in closed-form foronly a limited number of cases, e.g., the Michell trusses(Michell 1904). For structures with more complex loadingsand geometries, closed-form solutions are generally not pos-sible; thus, numerical methods must be employed to find theoptimal topologies.
1.1 Advantages and shortcomings in structural optimization
Several methodologies have been developed to find effi-cient structures by means of optimization algorithms. The
L. L. Beghini et al.
following is a brief overview of some of these methods andtheir advantages and shortcomings.
One of the most commonly used approaches is topologyoptimization by means of a material distribution problem,which is typically based on the Solid Isotropic Material withPenalization (SIMP) model (Rozvany et al. 1992; Zhou andRozvany 1993; Bendsoe and Sigmund 1999). Using thisapproach, resulting designs can have any size, shape andconnectivity. This solution provides valuable insight aboutthe geometry of the layout of the members of the optimalstructure. However, one of the issues associated with such asolution is its associated discretization. To physically real-ize the resulting design in projects of an architectural scale,the finite element densities must be discretized into line ele-ments representing beams, columns and braces, as part ofthe design process. This often poses some challenges to thedesigner. Since the precise locations of the nodes can besubject to interpretation, the resulting discrete structure maybe difficult to interpret.
Another popular alternative for structural topology opti-mization is the ground structures approach, which is con-ducted using discrete members. In these methods, the designproblem typically consists of assuming a base or groundstructure with a given layout of members, where the opti-mization can be conducted as a sizing problem with thecross-sectional areas as the design variables (Achtziger et al.1992; Ben-Tal and Bendsoe 1993; Oberndorfer et al. 1996;Bendsoe and Sigmund 2002; Sokol 2010; Christensen andKlarbring 2008). In these methods, the final designs arealready discretized but often with thousands of members.Limitations include the inability for the design domain,shape or connectivity of the members to change; however,members may be removed throughout the process as theyattain zero (or very small) areas. One of the major disad-vantages associated with these approaches lies in the largenumber of design variables (cross-sectional areas) requiredto solve the problem at hand. Thus, in order to create apractical structure, the structural engineer must interpret astructural layout with a limited number of members.
Other truss optimization techniques include optimizingthe structure by changing the position of the elements usingtheir nodal coordinates as design variables, where the ele-ment cross-sectional areas can also be included to add orremove material depending on the structural configuration(Hansen and Vanderplaats 1988; Mazurek et al. 2011).
In the design of large structures, a limited number ofdiscrete members is typically used. Often these membersare primarily axial force members and have limited flex-ural stiffness. Unfortunately, many of the existing toolsfor developing optimal topologies either have a very largenumber of elements (ground structures) or have memberswith substantial widths (e.g., density methods). A structurewith a large number of members is generally impractical
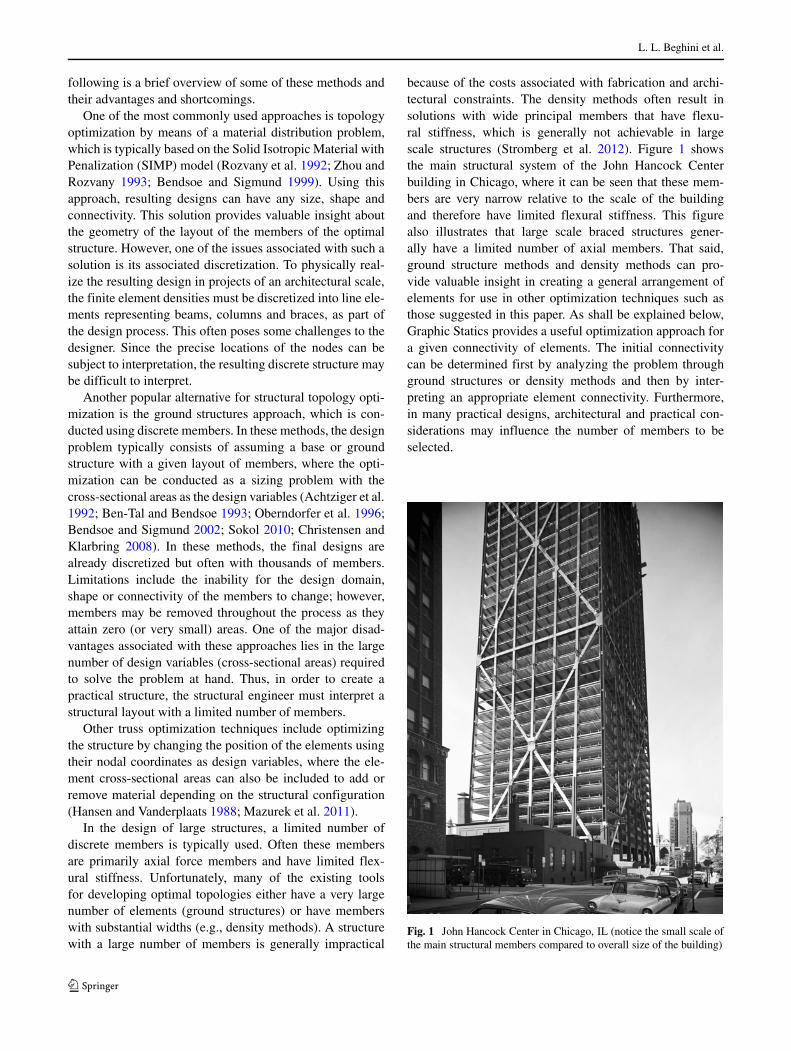
because of the costs associated with fabrication and archi-tectural constraints. The density methods often result insolutions with wide principal members that have flexu-ral stiffness, which is generally not achievable in largescale structures (Stromberg et al. 2012). Figure 1 showsthe main structural system of the John Hancock Centerbuilding in Chicago, where it can be seen that these mem-bers are very narrow relative to the scale of the buildingand therefore have limited flexural stiffness. This figurealso illustrates that large scale braced structures gener-ally have a limited number of axial members. That said,ground structure methods and density methods can pro-vide valuable insight in creating a general arrangement ofelements for use in other optimization techniques such asthose suggested in this paper. As shall be explained below,Graphic Statics provides a useful optimization approach fora given connectivity of elements. The initial connectivitycan be determined first by analyzing the problem throughground structures or density methods and then by inter-preting an appropriate element connectivity. Furthermore,in many practical designs, architectural and practical con-siderations may influence the number of members to beselected.
Fig. 1 John Hancock Center in Chicago, IL (notice the small scale ofthe main structural members compared to overall size of the building)
Structural optimization using graphic statics
1.2 Motivation for graphic statics
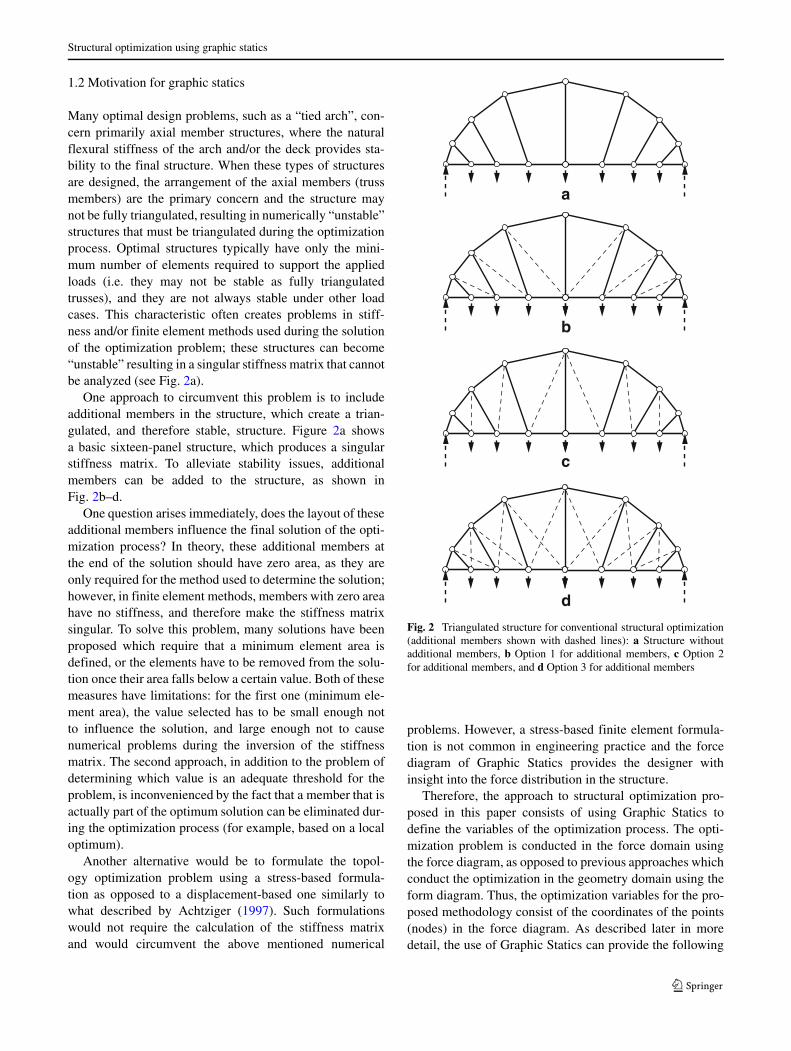
Many optimal design problems, such as a “tied arch”, con-cern primarily axial member structures, where the naturalflexural stiffness of the arch and/or the deck provides sta-bility to the final structure. When these types of structuresare designed, the arrangement of the axial members (trussmembers) are the primary concern and the structure maynot be fully triangulated, resulting in numerically “unstable”structures that must be triangulated during the optimizationprocess. Optimal structures typically have only the mini-mum number of elements required to support the appliedloads (i.e. they may not be stable as fully triangulatedtrusses), and they are not always stable under other loadcases. This characteristic often creates problems in stiff-ness and/or finite element methods used during the solutionof the optimization problem; these structures can become“unstable” resulting in a singular stiffness matrix that cannotbe analyzed (see Fig. 2a).
One approach to circumvent this problem is to includeadditional members in the structure, which create a trian-gulated, and therefore stable, structure. Figure 2a showsa basic sixteen-panel structure, which produces a singularstiffness matrix. To alleviate stability issues, additionalmembers can be added to the structure, as shown inFig. 2b–d.
One question arises immediately, does the layout of theseadditional members influence the final solution of the opti-mization process? In theory, these additional members atthe end of the solution should have zero area, as they areonly required for the method used to determine the solution;however, in finite element methods, members with zero areahave no stiffness, and therefore make the stiffness matrixsingular. To solve this problem, many solutions have beenproposed which require that a minimum element area isdefined, or the elements have to be removed from the solu-tion once their area falls below a certain value. Both of thesemeasures have limitations: for the first one (minimum ele-ment area), the value selected has to be small enough notto influence the solution, and large enough not to causenumerical problems during the inversion of the stiffnessmatrix. The second approach, in addition to the problem ofdetermining which value is an adequate threshold for theproblem, is inconvenienced by the fact that a member that isactually part of the optimum solution can be eliminated dur-ing the optimization process (for example, based on a localoptimum).
Another alternative would be to formulate the topol-ogy optimization problem using a stress-based formula-tion as opposed to a displacement-based one similarly towhat described by Achtziger (1997). Such formulationswould not require the calculation of the stiffness matrixand would circumvent the above mentioned numerical
a
b
c
d
Fig. 2 Triangulated structure for conventional structural optimization(additional members shown with dashed lines): a Structure withoutadditional members, b Option 1 for additional members, c Option 2for additional members, and d Option 3 for additional members
problems. However, a stress-based finite element formula-tion is not common in engineering practice and the forcediagram of Graphic Statics provides the designer withinsight into the force distribution in the structure.
Therefore, the approach to structural optimization pro-posed in this paper consists of using Graphic Statics todefine the variables of the optimization process. The opti-mization problem is conducted in the force domain usingthe force diagram, as opposed to previous approaches whichconduct the optimization in the geometry domain using theform diagram. Thus, the optimization variables for the pro-posed methodology consist of the coordinates of the points(nodes) in the force diagram. As described later in moredetail, the use of Graphic Statics can provide the following
L. L. Beghini et al.
advantages for certain types of problems, as compared to thetraditional approach:
– There is no need to triangulate the domain with mem-bers of very small areas, which can create numericaldifficulties.
– The results are always feasible if the members formclosed polygons in the force domain (i.e. equilibrium isguaranteed).
– Using Graphic Statics, there is no need to computeor assemble stiffness matrices; only simple graphicalrelationships are needed.
– Subject to certain relationships, the final location of theloads (or supports) do not need to be specified a prioribut can change as the optimal solution is found.
– Graphic Statics can readily accommodate different ten-sile and compressive stresses.
– The equilibrium constraints in the force diagramreduces the number of design variables required.
1.3 Paper scope and organization
The remainder of this paper is organized as follows: in thenext section, we discuss the history and current state-of-the-art techniques in Graphic Statics and structural optimizationof trusses. Then, in Section 3, we introduce the problemstatement and propose a new methodology for optimal trussdesign using Graphic Statics. Finally, we conclude withpractical numerical examples in Section 4 and comment onthe extensions of this work.
2 Background
Topology design of truss structures in the form of grid-likecontinua has been studied extensively in the past, startingwith the ground-breaking paper by Michell (1904) (Bendsoeand Sigmund 2002; Rozvany et al. 1995). In this section,we give a brief overview of existing truss optimization tech-niques and highlight the advantages and limitations of incor-porating Graphic Statics in the classical layout problem.
2.1 Structural optimization of trusses
The first fundamental properties of optimal truss-like con-tinua were established starting with Michell’s seminal paper“The Limits of Economy of Material in Frame-structures”(Michell 1904). This was later studied and expanded uponby Prager (1970), Hemp (1973), Rozvany (1976), Prager(1978), and Rozvany (1989), which has become the well-known modern layout optimization theory. Other contri-butions to the field were the early numerical methodsdeveloped by Fleron (1964) and Dorn et al. (1964).
The so-called ground structures method is commonlyused today, in which the layout of a truss can be foundby creating a set of connections between a fixed set ofnodal points as potential or vanishing structural members(Bendsoe and Sigmund 2002). Though these methods pro-vide valuable insight to the optimal design problem, theyare often limited in the sense that the fixed nodal pointsand solutions are highly dependent on the choice of the ini-tial ground structure. Furthermore, the optimization processtypically consists of a large number of members that cannotbe achieved in a practical structure. Moreover, these prob-lems are typically formulated in terms of any cross-sectionalarea, which may not always be feasible to practicing struc-tural engineers.
Continuum methods have been proposed by Bendsoeand Kikuchi (1988), Bendsoe (1989), Zhou and Rozvany(1991), Rozvany et al. (1992), and Bendsoe and Sigmund(2002), in which each finite element can be compared toa “pixel” in a black-white raster of an image. These havebecome highly popular due to the fact that the physical size,shape and connectivity does not need to be specified a pri-ori. However, one of the major disadvantages of continuumtopology optimization using numerical methods lies in theinterpretation of the final results. Often the final design con-tains thick regions of solid (“black”) material, and therefore,finding the optimal nodal locations is subjective when dis-cretizing the final design into beams and columns. Thesethick regions of material present in such results also giveunrealistic flexural stiffness that may bias the solution.
In this work, we use Graphic Statics to formulate analternative methodology to those listed above for practicingengineers, as described in the next section.
2.2 Graphic statics
Maxwell established that for certain trusses, the nodes andpolygons that represent the geometry of the truss have recip-rocal polygons and nodes in the force domain (Maxwell1864, 1870). Every node in the geometry domain maps intoa polygon in the force domain, every polygon in the geome-try domain maps into a node in the force domain and everyline representing the line of action of each truss membermaps into a reciprocal line in the force domain. The map-ping used by Maxwell resulted in the reciprocal lines beingperpendicular to each other. The use of a different map-ping (a hyperbola rather than a paraboloid of revolution) byCremona (1872) results in the reciprocal lines being paral-lel. Because these two figures (the form diagram and theforce diagram) are reciprocal, the mapping can also go fromthe force domain to the geometry (form) domain. The lengthof each of the lines in the force domain are proportionalto the axial force in the reciprocal line representing thetruss member. The creation of a force diagram from a form
Structural optimization using graphic statics
diagram (with its external applied forces) is called GraphicStatics. The process of Graphic Statics used to be a standardmethod of analyzing trusses and could be done using sim-ple drafting tools. Graphic Statics is no longer in commonusage for analysis, having been replaced by more mathe-matical tools, but it still can be used as a design tool and, asdiscussed below, as a tool in creating optimal structures.
As discussed in Baker et al. (2013), Graphic Statics pro-vides the information needed for minimizing the load path(or volume) of a truss with specified connectivity. The formdiagram provides the length of each member and the lengthof each line in the force diagram provides the force in eachmember. The reader is referred to Baker et al. (2013) for abrief introduction to Graphic Statics and to textbooks suchas Zalewski and Allen (1998). Because of the reciprocalrelationships observed by Maxwell, only simple graphicaltechniques are needed to determine the length of each mem-ber and its axial force; there is no need to compute a stiffnessmatrix or to solve a large system of equations.
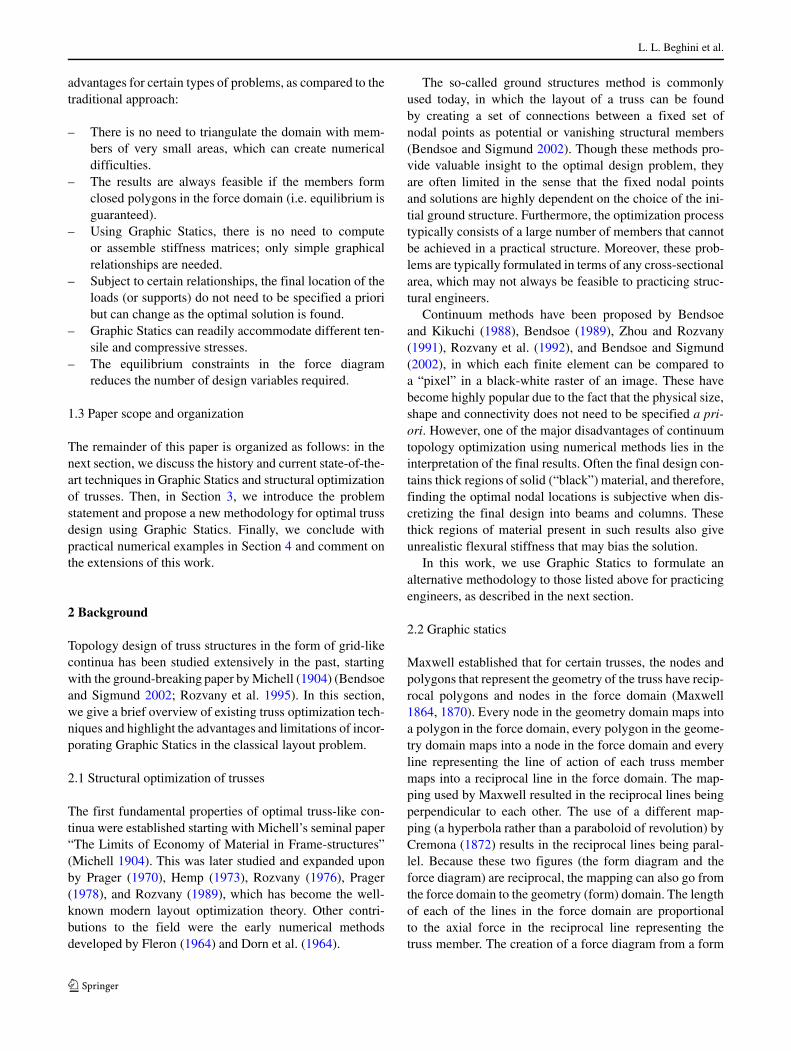
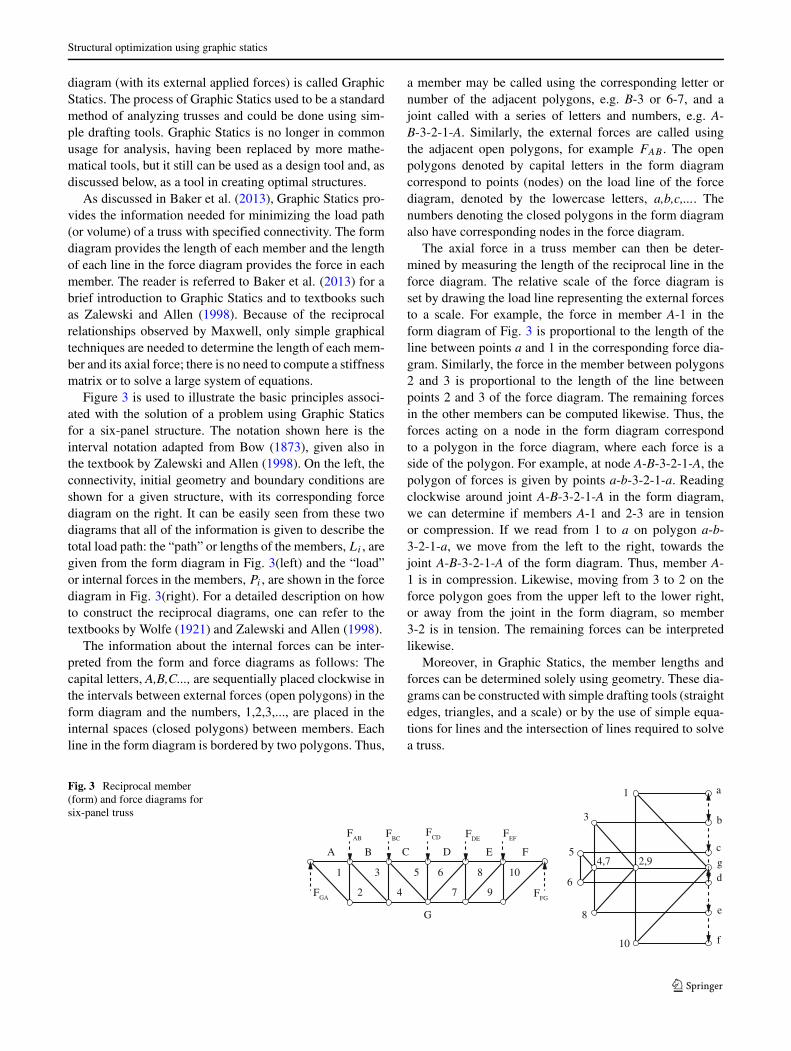
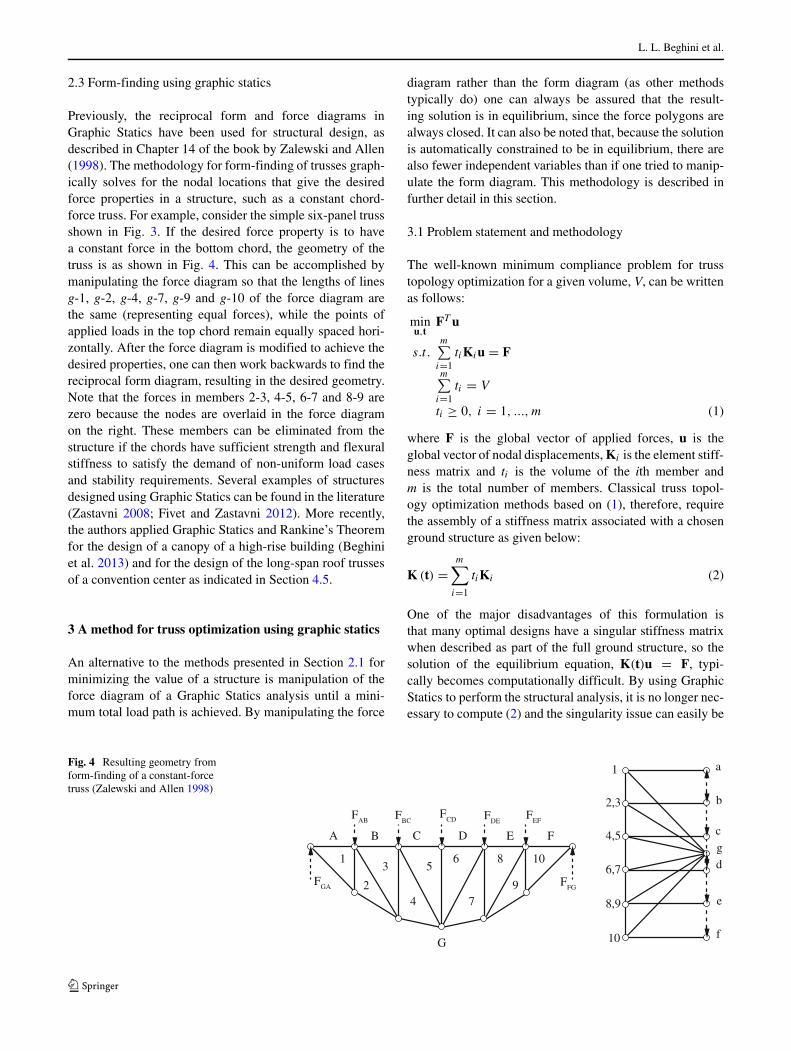
Figure 3 is used to illustrate the basic principles associ-ated with the solution of a problem using Graphic Staticsfor a six-panel structure. The notation shown here is theinterval notation adapted from Bow (1873), given also inthe textbook by Zalewski and Allen (1998). On the left, theconnectivity, initial geometry and boundary conditions areshown for a given structure, with its corresponding forcediagram on the right. It can be easily seen from these twodiagrams that all of the information is given to describe thetotal load path: the “path” or lengths of the members, Li , aregiven from the form diagram in Fig. 3(left) and the “load”or internal forces in the members, Pi , are shown in the forcediagram in Fig. 3(right). For a detailed description on howto construct the reciprocal diagrams, one can refer to thetextbooks by Wolfe (1921) and Zalewski and Allen (1998).
The information about the internal forces can be inter-preted from the form and force diagrams as follows: Thecapital letters, A,B,C..., are sequentially placed clockwise inthe intervals between external forces (open polygons) in theform diagram and the numbers, 1,2,3,..., are placed in theinternal spaces (closed polygons) between members. Eachline in the form diagram is bordered by two polygons. Thus,
a member may be called using the corresponding letter ornumber of the adjacent polygons, e.g. B-3 or 6-7, and ajoint called with a series of letters and numbers, e.g. A-B-3-2-1-A. Similarly, the external forces are called usingthe adjacent open polygons, for example FAB . The openpolygons denoted by capital letters in the form diagramcorrespond to points (nodes) on the load line of the forcediagram, denoted by the lowercase letters, a,b,c,.... Thenumbers denoting the closed polygons in the form diagramalso have corresponding nodes in the force diagram.
The axial force in a truss member can then be deter-mined by measuring the length of the reciprocal line in theforce diagram. The relative scale of the force diagram isset by drawing the load line representing the external forcesto a scale. For example, the force in member A-1 in theform diagram of Fig. 3 is proportional to the length of theline between points a and 1 in the corresponding force dia-gram. Similarly, the force in the member between polygons2 and 3 is proportional to the length of the line betweenpoints 2 and 3 of the force diagram. The remaining forcesin the other members can be computed likewise. Thus, theforces acting on a node in the form diagram correspondto a polygon in the force diagram, where each force is aside of the polygon. For example, at node A-B-3-2-1-A, thepolygon of forces is given by points a-b-3-2-1-a. Readingclockwise around joint A-B-3-2-1-A in the form diagram,we can determine if members A-1 and 2-3 are in tensionor compression. If we read from 1 to a on polygon a-b-3-2-1-a, we move from the left to the right, towards thejoint A-B-3-2-1-A of the form diagram. Thus, member A-1 is in compression. Likewise, moving from 3 to 2 on theforce polygon goes from the upper left to the lower right,or away from the joint in the form diagram, so member3-2 is in tension. The remaining forces can be interpretedlikewise.
Moreover, in Graphic Statics, the member lengths andforces can be determined solely using geometry. These dia-grams can be constructed with simple drafting tools (straightedges, triangles, and a scale) or by the use of simple equa-tions for lines and the intersection of lines required to solvea truss.
Fig. 3 Reciprocal member(form) and force diagrams forsix-panel truss
1
1
42
10
5
5
3
3
66
7
8
8
9
102,9
A
a
b
c
dg
e
f
B C D E F
G
FFG
FAB F
EFFDE
FCDF
BC
FGA
4,7
L. L. Beghini et al.
2.3 Form-finding using graphic statics
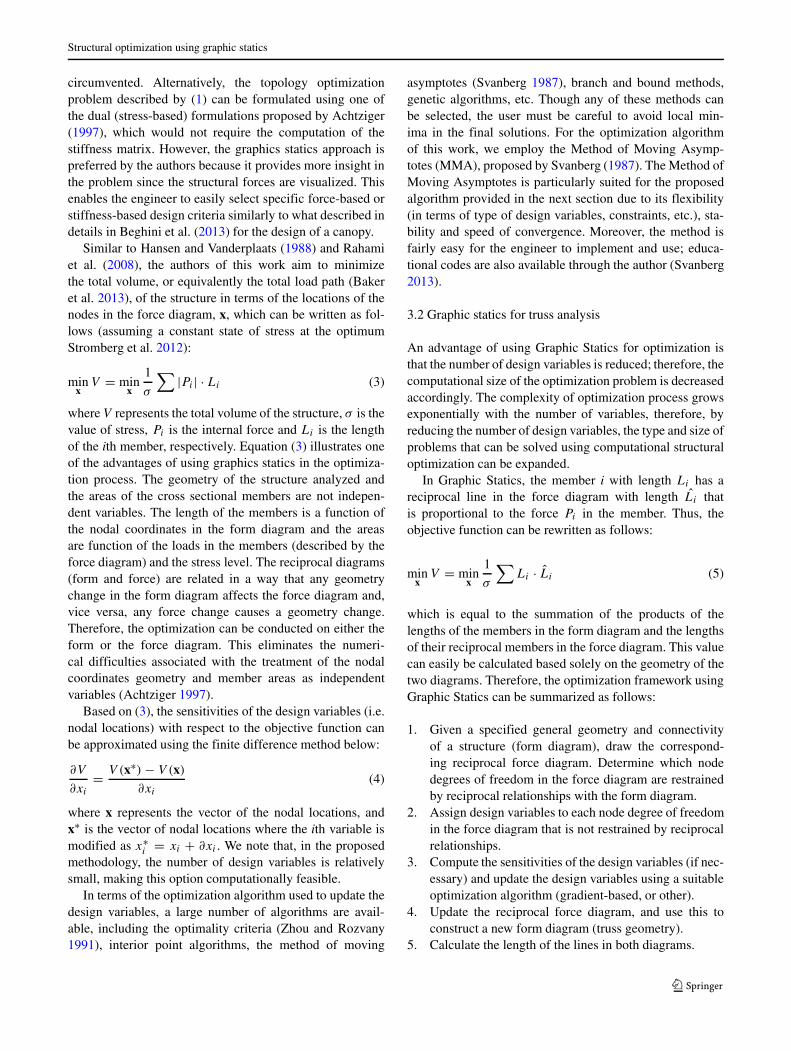
Previously, the reciprocal form and force diagrams inGraphic Statics have been used for structural design, asdescribed in Chapter 14 of the book by Zalewski and Allen(1998). The methodology for form-finding of trusses graph-ically solves for the nodal locations that give the desiredforce properties in a structure, such as a constant chord-force truss. For example, consider the simple six-panel trussshown in Fig. 3. If the desired force property is to havea constant force in the bottom chord, the geometry of thetruss is as shown in Fig. 4. This can be accomplished bymanipulating the force diagram so that the lengths of linesg-1, g-2, g-4, g-7, g-9 and g-10 of the force diagram arethe same (representing equal forces), while the points ofapplied loads in the top chord remain equally spaced hori-zontally. After the force diagram is modified to achieve thedesired properties, one can then work backwards to find thereciprocal form diagram, resulting in the desired geometry.Note that the forces in members 2-3, 4-5, 6-7 and 8-9 arezero because the nodes are overlaid in the force diagramon the right. These members can be eliminated from thestructure if the chords have sufficient strength and flexuralstiffness to satisfy the demand of non-uniform load casesand stability requirements. Several examples of structuresdesigned using Graphic Statics can be found in the literature(Zastavni 2008; Fivet and Zastavni 2012). More recently,the authors applied Graphic Statics and Rankine’s Theoremfor the design of a canopy of a high-rise building (Beghiniet al. 2013) and for the design of the long-span roof trussesof a convention center as indicated in Section 4.5.
3 A method for truss optimization using graphic statics
An alternative to the methods presented in Section 2.1 forminimizing the value of a structure is manipulation of theforce diagram of a Graphic Statics analysis until a mini-mum total load path is achieved. By manipulating the force
diagram rather than the form diagram (as other methodstypically do) one can always be assured that the result-ing solution is in equilibrium, since the force polygons arealways closed. It can also be noted that, because the solutionis automatically constrained to be in equilibrium, there arealso fewer independent variables than if one tried to manip-ulate the form diagram. This methodology is described infurther detail in this section.
3.1 Problem statement and methodology
The well-known minimum compliance problem for trusstopology optimization for a given volume, V, can be writtenas follows:
minu,t
FT u
s.t.m∑
i=1tiKiu = F
m∑i=1
ti = V
ti ≥ 0, i = 1, ..., m (1)
where F is the global vector of applied forces, u is theglobal vector of nodal displacements, Ki is the element stiff-ness matrix and ti is the volume of the ith member andm is the total number of members. Classical truss topol-ogy optimization methods based on (1), therefore, requirethe assembly of a stiffness matrix associated with a chosenground structure as given below:
K (t) =m∑
i=1
tiKi (2)
One of the major disadvantages of this formulation isthat many optimal designs have a singular stiffness matrixwhen described as part of the full ground structure, so thesolution of the equilibrium equation, K(t)u = F, typi-cally becomes computationally difficult. By using GraphicStatics to perform the structural analysis, it is no longer nec-essary to compute (2) and the singularity issue can easily be
Fig. 4 Resulting geometry fromform-finding of a constant-forcetruss (Zalewski and Allen 1998)
a
b
c
dg
e
f
1
42
536
7
8
9
10
A B C D E F
G
FAB F
EFFDE
FCDF
BC
FGA
1
10
4,5
2,3
6,7
8,9
FFG
Structural optimization using graphic statics
circumvented. Alternatively, the topology optimizationproblem described by (1) can be formulated using one ofthe dual (stress-based) formulations proposed by Achtziger(1997), which would not require the computation of thestiffness matrix. However, the graphics statics approach ispreferred by the authors because it provides more insight inthe problem since the structural forces are visualized. Thisenables the engineer to easily select specific force-based orstiffness-based design criteria similarly to what described indetails in Beghini et al. (2013) for the design of a canopy.
Similar to Hansen and Vanderplaats (1988) and Rahamiet al. (2008), the authors of this work aim to minimizethe total volume, or equivalently the total load path (Bakeret al. 2013), of the structure in terms of the locations of thenodes in the force diagram, x, which can be written as fol-lows (assuming a constant state of stress at the optimumStromberg et al. 2012):
minx
V = minx
1
σ
∑|Pi | · Li (3)
where V represents the total volume of the structure, σ is thevalue of stress, Pi is the internal force and Li is the lengthof the ith member, respectively. Equation (3) illustrates oneof the advantages of using graphics statics in the optimiza-tion process. The geometry of the structure analyzed andthe areas of the cross sectional members are not indepen-dent variables. The length of the members is a function ofthe nodal coordinates in the form diagram and the areasare function of the loads in the members (described by theforce diagram) and the stress level. The reciprocal diagrams(form and force) are related in a way that any geometrychange in the form diagram affects the force diagram and,vice versa, any force change causes a geometry change.Therefore, the optimization can be conducted on either theform or the force diagram. This eliminates the numeri-cal difficulties associated with the treatment of the nodalcoordinates geometry and member areas as independentvariables (Achtziger 1997).
Based on (3), the sensitivities of the design variables (i.e.nodal locations) with respect to the objective function canbe approximated using the finite difference method below:
∂V
∂xi
= V (x∗) − V (x)
∂xi
(4)
where x represents the vector of the nodal locations, andx∗ is the vector of nodal locations where the ith variable ismodified as x∗
i = xi + ∂xi . We note that, in the proposedmethodology, the number of design variables is relativelysmall, making this option computationally feasible.
In terms of the optimization algorithm used to update thedesign variables, a large number of algorithms are avail-able, including the optimality criteria (Zhou and Rozvany1991), interior point algorithms, the method of moving
asymptotes (Svanberg 1987), branch and bound methods,genetic algorithms, etc. Though any of these methods canbe selected, the user must be careful to avoid local min-ima in the final solutions. For the optimization algorithmof this work, we employ the Method of Moving Asymp-totes (MMA), proposed by Svanberg (1987). The Method ofMoving Asymptotes is particularly suited for the proposedalgorithm provided in the next section due to its flexibility(in terms of type of design variables, constraints, etc.), sta-bility and speed of convergence. Moreover, the method isfairly easy for the engineer to implement and use; educa-tional codes are also available through the author (Svanberg2013).
3.2 Graphic statics for truss analysis
An advantage of using Graphic Statics for optimization isthat the number of design variables is reduced; therefore, thecomputational size of the optimization problem is decreasedaccordingly. The complexity of optimization process growsexponentially with the number of variables, therefore, byreducing the number of design variables, the type and size ofproblems that can be solved using computational structuraloptimization can be expanded.
In Graphic Statics, the member i with length Li has areciprocal line in the force diagram with length Li thatis proportional to the force Pi in the member. Thus, theobjective function can be rewritten as follows:
minx
V = minx
1
σ
∑Li · Li (5)
which is equal to the summation of the products of thelengths of the members in the form diagram and the lengthsof their reciprocal members in the force diagram. This valuecan easily be calculated based solely on the geometry of thetwo diagrams. Therefore, the optimization framework usingGraphic Statics can be summarized as follows:
1. Given a specified general geometry and connectivityof a structure (form diagram), draw the correspond-ing reciprocal force diagram. Determine which nodedegrees of freedom in the force diagram are restrainedby reciprocal relationships with the form diagram.
2. Assign design variables to each node degree of freedomin the force diagram that is not restrained by reciprocalrelationships.
3. Compute the sensitivities of the design variables (if nec-essary) and update the design variables using a suitableoptimization algorithm (gradient-based, or other).
4. Update the reciprocal force diagram, and use this toconstruct a new form diagram (truss geometry).
5. Calculate the length of the lines in both diagrams.
L. L. Beghini et al.
6. Calculate the objective function based on the linelengths and repeat until convergence is achieved.
Some of the advantages of conducting the optimizationon the force diagram include the following: (i) Becausethe force diagram represents an equilibrium configuration,the structure resulting from the optimization process willalways satisfy equilibrium. (ii) No additional members areneeded to stabilize the structure or satisfy equilibrium.Recall that in traditional structural optimization approaches,it is necessary to add additional members to triangulate thestructure to make the numerical solution viable. These zeroor low force members at the end of the optimization pro-cess have a very small area, however, unless some arbitrarymeans are taken to remove them from the solution, theywill end up present in the final solution, with very smallarea. The value chosen for the minimum area, can actuallychange the solution of the numerical optimization process.Furthermore, by replacing the analysis using the stiffnessmethod with Graphic Statics as the analysis tool, there is noneed to compute and assemble the stiffness matrices; onlygeometric relationships are required. Depending on the orig-inal design problem objective, the location of the appliedloads (or supports) can change subject to the restrictionsof the reciprocal relationships between the form and forcediagrams.
One of the disadvantages of using Graphic Statics inengineering practice is that the structure can be optimizedfor only one load case. Therefore, the engineer shouldidentify the dominant load case for the problem at hand,optimize for such load and later check the other load cases.A detailed description of a design completed using GraphicStatics and Rankine’s Theorem is described in Beghini et al.(2013).
4 Numerical examples
In this section, numerical examples are given to verifythe proposed methodology and illustrate the overall designprocess.
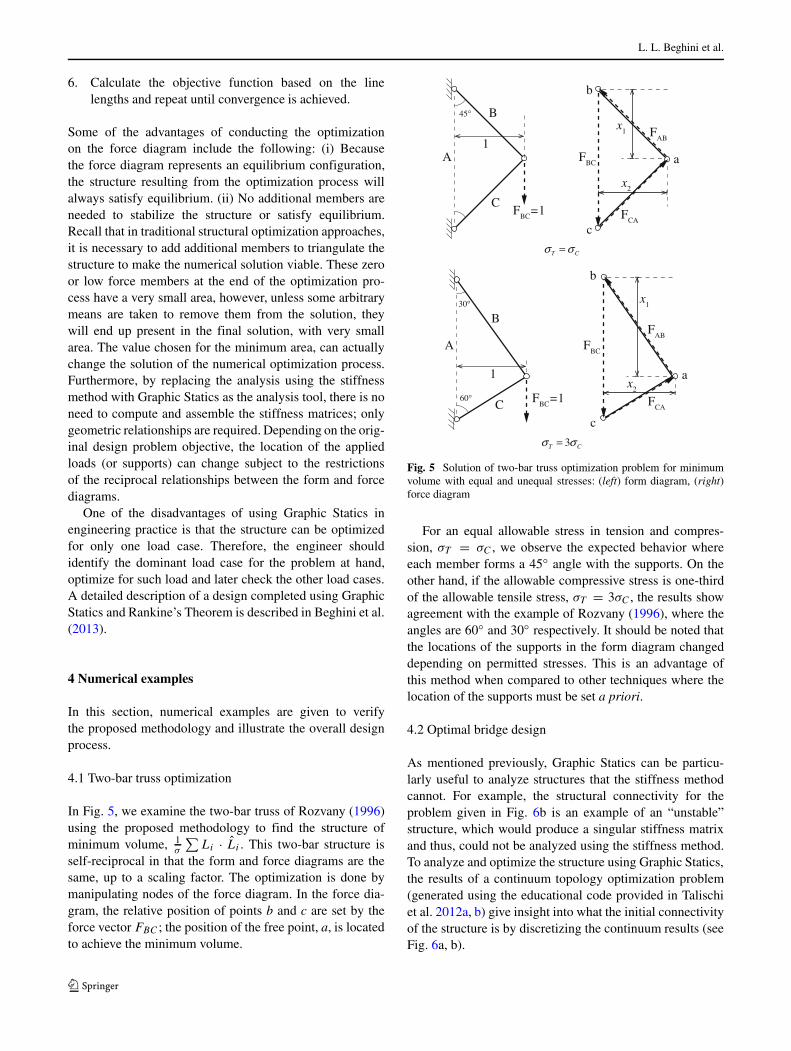
4.1 Two-bar truss optimization
In Fig. 5, we examine the two-bar truss of Rozvany (1996)using the proposed methodology to find the structure ofminimum volume, 1
σ
∑Li · Li . This two-bar structure is
self-reciprocal in that the form and force diagrams are thesame, up to a scaling factor. The optimization is done bymanipulating nodes of the force diagram. In the force dia-gram, the relative position of points b and c are set by theforce vector FBC ; the position of the free point, a, is locatedto achieve the minimum volume.
1
x1
x1
x2
x2
FBC
=1
FBC
=1
FBC
FBC
FCA
FCA
FAB
FAB
b
aA
A
B
B
C
C
c
CT σσ =
°60
°45
°30
1
CT σσ 3=
b
a
c
Fig. 5 Solution of two-bar truss optimization problem for minimumvolume with equal and unequal stresses: (left) form diagram, (right)force diagram
For an equal allowable stress in tension and compres-sion, σT = σC , we observe the expected behavior whereeach member forms a 45◦ angle with the supports. On theother hand, if the allowable compressive stress is one-thirdof the allowable tensile stress, σT = 3σC , the results showagreement with the example of Rozvany (1996), where theangles are 60◦ and 30◦ respectively. It should be noted thatthe locations of the supports in the form diagram changeddepending on permitted stresses. This is an advantage ofthis method when compared to other techniques where thelocation of the supports must be set a priori.
4.2 Optimal bridge design
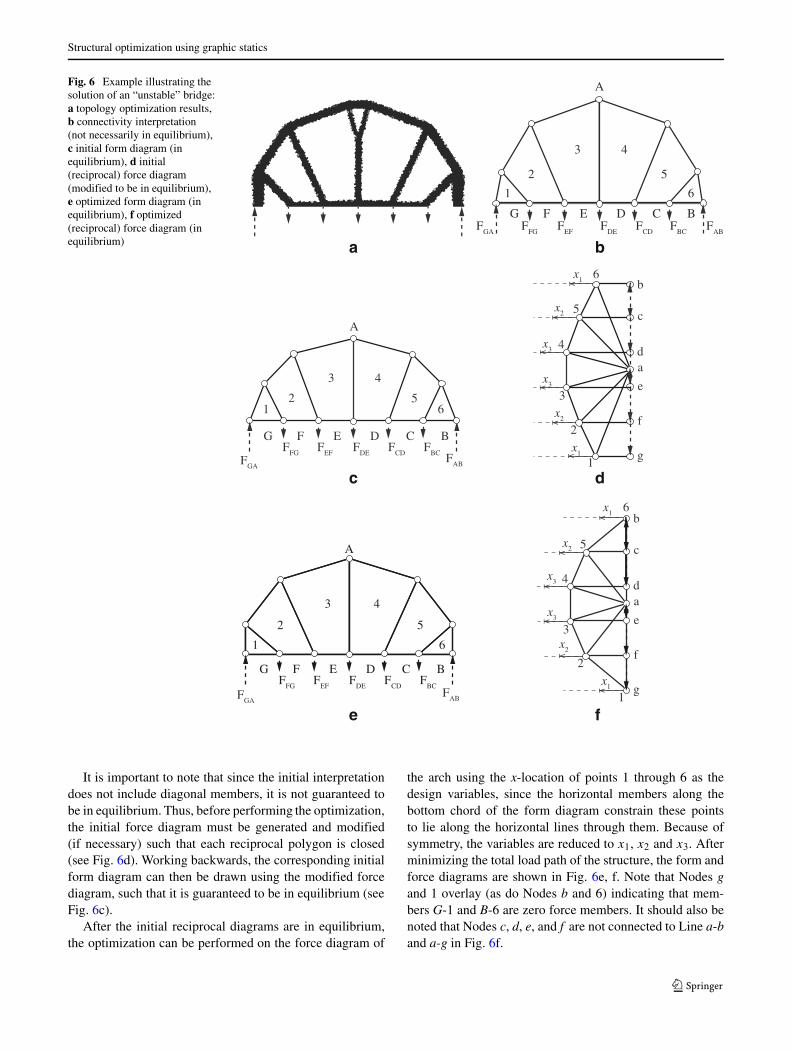
As mentioned previously, Graphic Statics can be particu-larly useful to analyze structures that the stiffness methodcannot. For example, the structural connectivity for theproblem given in Fig. 6b is an example of an “unstable”structure, which would produce a singular stiffness matrixand thus, could not be analyzed using the stiffness method.To analyze and optimize the structure using Graphic Statics,the results of a continuum topology optimization problem(generated using the educational code provided in Talischiet al. 2012a, b) give insight into what the initial connectivityof the structure is by discretizing the continuum results (seeFig. 6a, b).
Structural optimization using graphic statics
Fig. 6 Example illustrating thesolution of an “unstable” bridge:a topology optimization results,b connectivity interpretation(not necessarily in equilibrium),c initial form diagram (inequilibrium), d initial(reciprocal) force diagram(modified to be in equilibrium),e optimized form diagram (inequilibrium), f optimized(reciprocal) force diagram (inequilibrium) a b
c d
e f
A
BCDEFGF
FGF
GAF
CDF
BCF
EFF
DEF
AB
1
52
3 4
6
A
BCDEFGF
FGF
GA
FCD
FBC
FEF
FDE F
AB
12 5
3 4
6
1
2
3
4
5
6
a
b
c
d
g
e
f
x2
x2
x3
x3
x1
x1
A
1
52
3 4
6
BCDEFGF
FGF
CDF
BCF
EFF
DE
FGA
FAB 1
2
3
4
5
6
a
b
c
d
g
e
f
x2
x2
x3
x3
x1
x1
It is important to note that since the initial interpretationdoes not include diagonal members, it is not guaranteed tobe in equilibrium. Thus, before performing the optimization,the initial force diagram must be generated and modified(if necessary) such that each reciprocal polygon is closed(see Fig. 6d). Working backwards, the corresponding initialform diagram can then be drawn using the modified forcediagram, such that it is guaranteed to be in equilibrium (seeFig. 6c).
After the initial reciprocal diagrams are in equilibrium,the optimization can be performed on the force diagram of
the arch using the x-location of points 1 through 6 as thedesign variables, since the horizontal members along thebottom chord of the form diagram constrain these pointsto lie along the horizontal lines through them. Because ofsymmetry, the variables are reduced to x1, x2 and x3. Afterminimizing the total load path of the structure, the form andforce diagrams are shown in Fig. 6e, f. Note that Nodes gand 1 overlay (as do Nodes b and 6) indicating that mem-bers G-1 and B-6 are zero force members. It should also benoted that Nodes c, d, e, and f are not connected to Line a-band a-g in Fig. 6f.
L. L. Beghini et al.
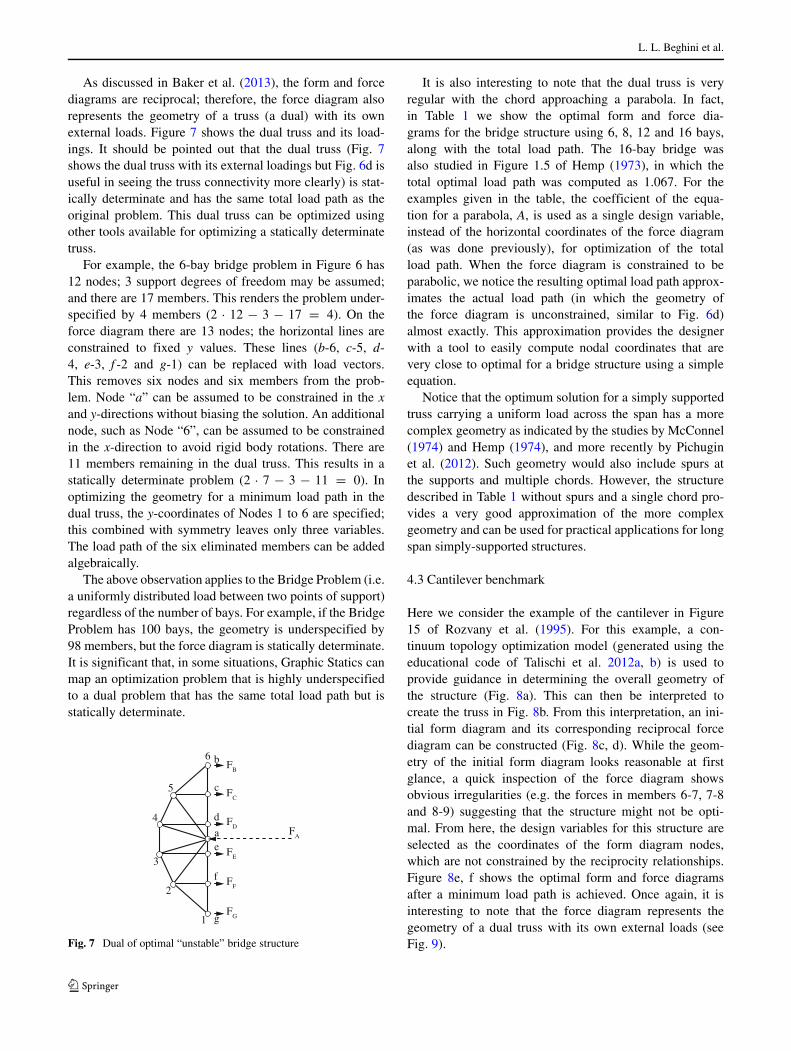
As discussed in Baker et al. (2013), the form and forcediagrams are reciprocal; therefore, the force diagram alsorepresents the geometry of a truss (a dual) with its ownexternal loads. Figure 7 shows the dual truss and its load-ings. It should be pointed out that the dual truss (Fig. 7shows the dual truss with its external loadings but Fig. 6d isuseful in seeing the truss connectivity more clearly) is stat-ically determinate and has the same total load path as theoriginal problem. This dual truss can be optimized usingother tools available for optimizing a statically determinatetruss.
For example, the 6-bay bridge problem in Figure 6 has12 nodes; 3 support degrees of freedom may be assumed;and there are 17 members. This renders the problem under-specified by 4 members (2 · 12 − 3 − 17 = 4). On theforce diagram there are 13 nodes; the horizontal lines areconstrained to fixed y values. These lines (b-6, c-5, d-4, e-3, f -2 and g-1) can be replaced with load vectors.This removes six nodes and six members from the prob-lem. Node “a” can be assumed to be constrained in the xand y-directions without biasing the solution. An additionalnode, such as Node “6”, can be assumed to be constrainedin the x-direction to avoid rigid body rotations. There are11 members remaining in the dual truss. This results in astatically determinate problem (2 · 7 − 3 − 11 = 0). Inoptimizing the geometry for a minimum load path in thedual truss, the y-coordinates of Nodes 1 to 6 are specified;this combined with symmetry leaves only three variables.The load path of the six eliminated members can be addedalgebraically.
The above observation applies to the Bridge Problem (i.e.a uniformly distributed load between two points of support)regardless of the number of bays. For example, if the BridgeProblem has 100 bays, the geometry is underspecified by98 members, but the force diagram is statically determinate.It is significant that, in some situations, Graphic Statics canmap an optimization problem that is highly underspecifiedto a dual problem that has the same total load path but isstatically determinate.
1
2
3
4
5
6
a
b
c
d
g
e
f
FA
FB
FC
FD
FE
FF
FG
Fig. 7 Dual of optimal “unstable” bridge structure
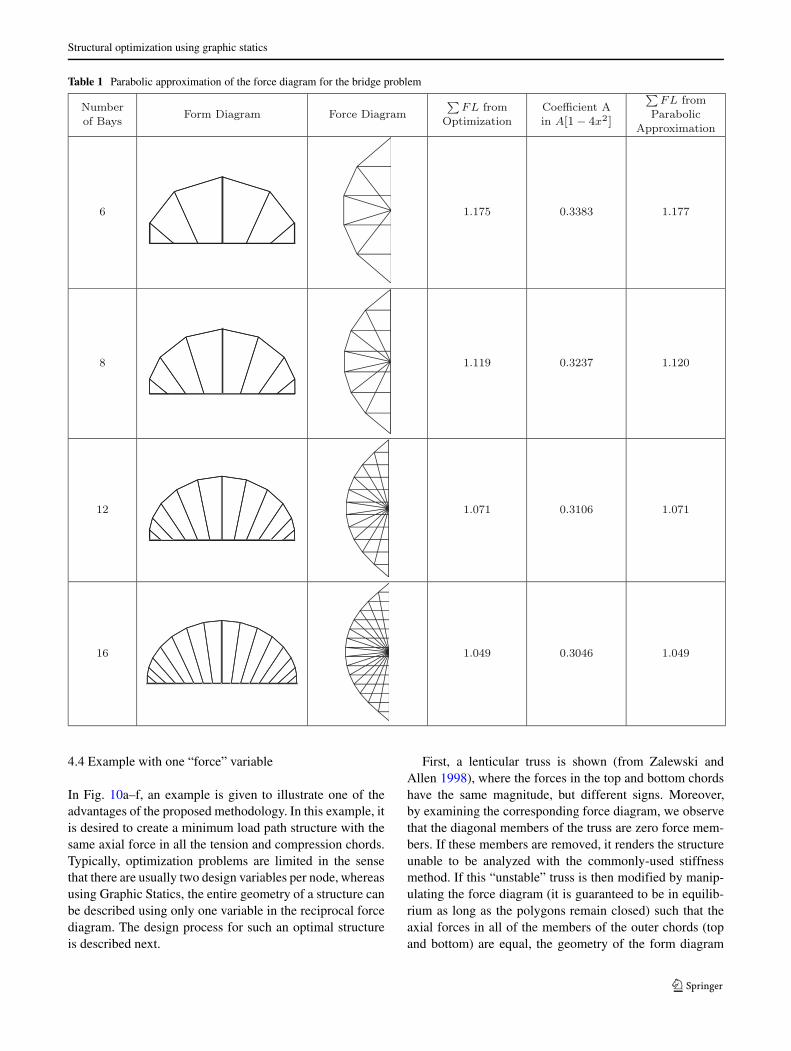
It is also interesting to note that the dual truss is veryregular with the chord approaching a parabola. In fact,in Table 1 we show the optimal form and force dia-grams for the bridge structure using 6, 8, 12 and 16 bays,along with the total load path. The 16-bay bridge wasalso studied in Figure 1.5 of Hemp (1973), in which thetotal optimal load path was computed as 1.067. For theexamples given in the table, the coefficient of the equa-tion for a parabola, A, is used as a single design variable,instead of the horizontal coordinates of the force diagram(as was done previously), for optimization of the totalload path. When the force diagram is constrained to beparabolic, we notice the resulting optimal load path approx-imates the actual load path (in which the geometry ofthe force diagram is unconstrained, similar to Fig. 6d)almost exactly. This approximation provides the designerwith a tool to easily compute nodal coordinates that arevery close to optimal for a bridge structure using a simpleequation.
Notice that the optimum solution for a simply supportedtruss carrying a uniform load across the span has a morecomplex geometry as indicated by the studies by McConnel(1974) and Hemp (1974), and more recently by Pichuginet al. (2012). Such geometry would also include spurs atthe supports and multiple chords. However, the structuredescribed in Table 1 without spurs and a single chord pro-vides a very good approximation of the more complexgeometry and can be used for practical applications for longspan simply-supported structures.
4.3 Cantilever benchmark
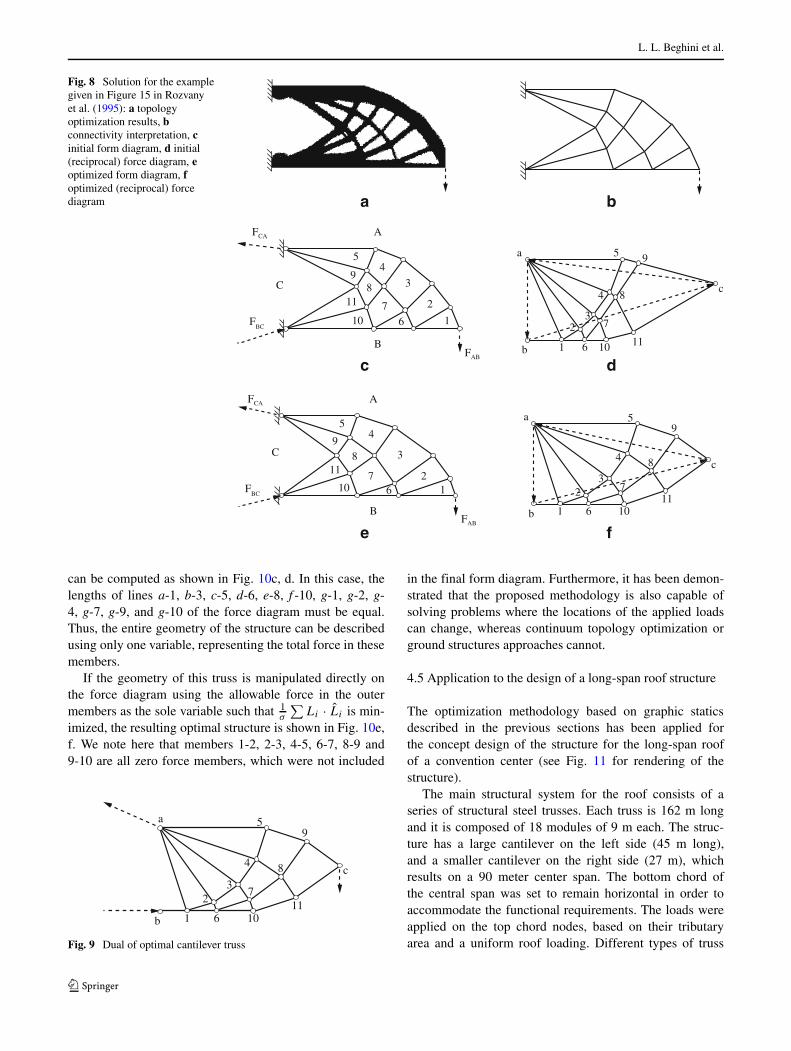
Here we consider the example of the cantilever in Figure15 of Rozvany et al. (1995). For this example, a con-tinuum topology optimization model (generated using theeducational code of Talischi et al. 2012a, b) is used toprovide guidance in determining the overall geometry ofthe structure (Fig. 8a). This can then be interpreted tocreate the truss in Fig. 8b. From this interpretation, an ini-tial form diagram and its corresponding reciprocal forcediagram can be constructed (Fig. 8c, d). While the geom-etry of the initial form diagram looks reasonable at firstglance, a quick inspection of the force diagram showsobvious irregularities (e.g. the forces in members 6-7, 7-8and 8-9) suggesting that the structure might not be opti-mal. From here, the design variables for this structure areselected as the coordinates of the form diagram nodes,which are not constrained by the reciprocity relationships.Figure 8e, f shows the optimal form and force diagramsafter a minimum load path is achieved. Once again, it isinteresting to note that the force diagram represents thegeometry of a dual truss with its own external loads (seeFig. 9).
Structural optimization using graphic statics
Table 1 Parabolic approximation of the force diagram for the bridge problem
4.4 Example with one “force” variable
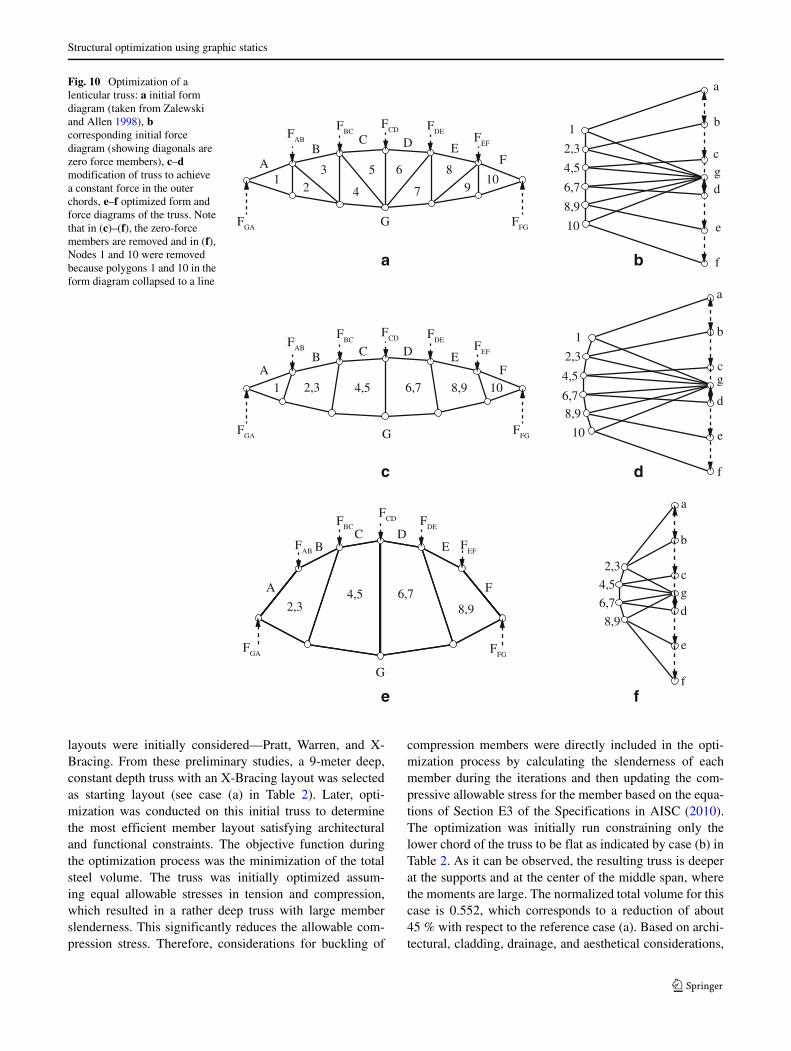
In Fig. 10a–f, an example is given to illustrate one of theadvantages of the proposed methodology. In this example, itis desired to create a minimum load path structure with thesame axial force in all the tension and compression chords.Typically, optimization problems are limited in the sensethat there are usually two design variables per node, whereasusing Graphic Statics, the entire geometry of a structure canbe described using only one variable in the reciprocal forcediagram. The design process for such an optimal structureis described next.
First, a lenticular truss is shown (from Zalewski andAllen 1998), where the forces in the top and bottom chordshave the same magnitude, but different signs. Moreover,by examining the corresponding force diagram, we observethat the diagonal members of the truss are zero force mem-bers. If these members are removed, it renders the structureunable to be analyzed with the commonly-used stiffnessmethod. If this “unstable” truss is then modified by manip-ulating the force diagram (it is guaranteed to be in equilib-rium as long as the polygons remain closed) such that theaxial forces in all of the members of the outer chords (topand bottom) are equal, the geometry of the form diagram
L. L. Beghini et al.
Fig. 8 Solution for the examplegiven in Figure 15 in Rozvanyet al. (1995): a topologyoptimization results, bconnectivity interpretation, cinitial form diagram, d initial(reciprocal) force diagram, eoptimized form diagram, foptimized (reciprocal) forcediagram
1
3
FBC
FCA
2
A
B
C
45
67
89
10
11
FAB1
23
4
5
6
7
8
9
10 11
a
b
c
1
3
FBC
FAB
FCA
2
A
B
C
45
67
89
10
11
1
23
4
5
6
7
8
9
1011
a
b
c
a b
c d
e f
can be computed as shown in Fig. 10c, d. In this case, thelengths of lines a-1, b-3, c-5, d-6, e-8, f -10, g-1, g-2, g-4, g-7, g-9, and g-10 of the force diagram must be equal.Thus, the entire geometry of the structure can be describedusing only one variable, representing the total force in thesemembers.
If the geometry of this truss is manipulated directly onthe force diagram using the allowable force in the outermembers as the sole variable such that 1
σ
∑Li · Li is min-
imized, the resulting optimal structure is shown in Fig. 10e,f. We note here that members 1-2, 2-3, 4-5, 6-7, 8-9 and9-10 are all zero force members, which were not included
1
23
4
5
6
7
8
9
1011
a
b
c
Fig. 9 Dual of optimal cantilever truss
in the final form diagram. Furthermore, it has been demon-strated that the proposed methodology is also capable ofsolving problems where the locations of the applied loadscan change, whereas continuum topology optimization orground structures approaches cannot.
4.5 Application to the design of a long-span roof structure
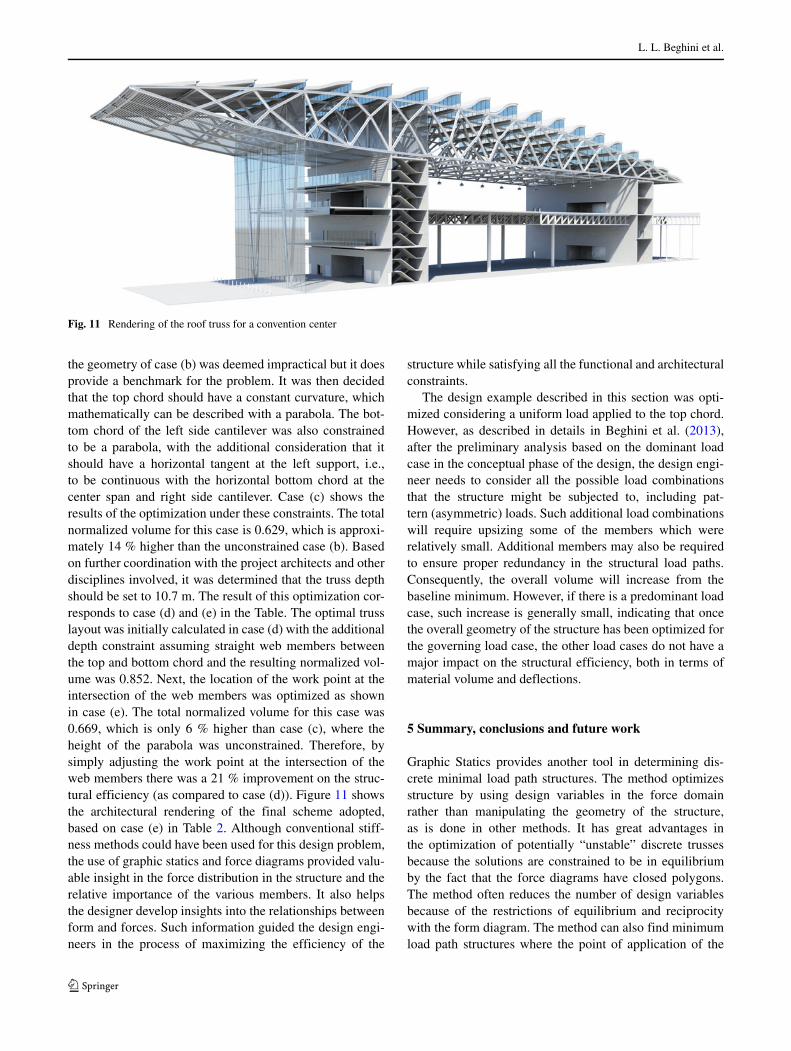
The optimization methodology based on graphic staticsdescribed in the previous sections has been applied forthe concept design of the structure for the long-span roofof a convention center (see Fig. 11 for rendering of thestructure).
The main structural system for the roof consists of aseries of structural steel trusses. Each truss is 162 m longand it is composed of 18 modules of 9 m each. The struc-ture has a large cantilever on the left side (45 m long),and a smaller cantilever on the right side (27 m), whichresults on a 90 meter center span. The bottom chord ofthe central span was set to remain horizontal in order toaccommodate the functional requirements. The loads wereapplied on the top chord nodes, based on their tributaryarea and a uniform roof loading. Different types of truss
Structural optimization using graphic statics
Fig. 10 Optimization of alenticular truss: a initial formdiagram (taken from Zalewskiand Allen 1998), bcorresponding initial forcediagram (showing diagonals arezero force members), c–dmodification of truss to achievea constant force in the outerchords, e–f optimized form andforce diagrams of the truss. Notethat in (c)–(f), the zero-forcemembers are removed and in (f),Nodes 1 and 10 were removedbecause polygons 1 and 10 in theform diagram collapsed to a line
FFG
FGA
12
5 63
4 7
89
10A
B C D E
F
G
FAB
FBC
FCD F
DEF
EF
1
6,7
2,3
8,9
4,5
10
a
b
c
dg
e
f
FFG
FGA
1 2,3 8,94,5 6,7 10A
B C D EF
G
FAB
FBC
FCD F
DEF
EF
1
6,7
2,3
8,9
4,5
10
a
b
c
d
g
e
f
A
B C D
E
F
G
FFG
FGA
FAB
FBC
FCD F
DE
FEF
2,3 8,94,5 6,7
a
f
b
c
d
g
e
6,7
2,3
8,9
4,5
ba
dc
fe
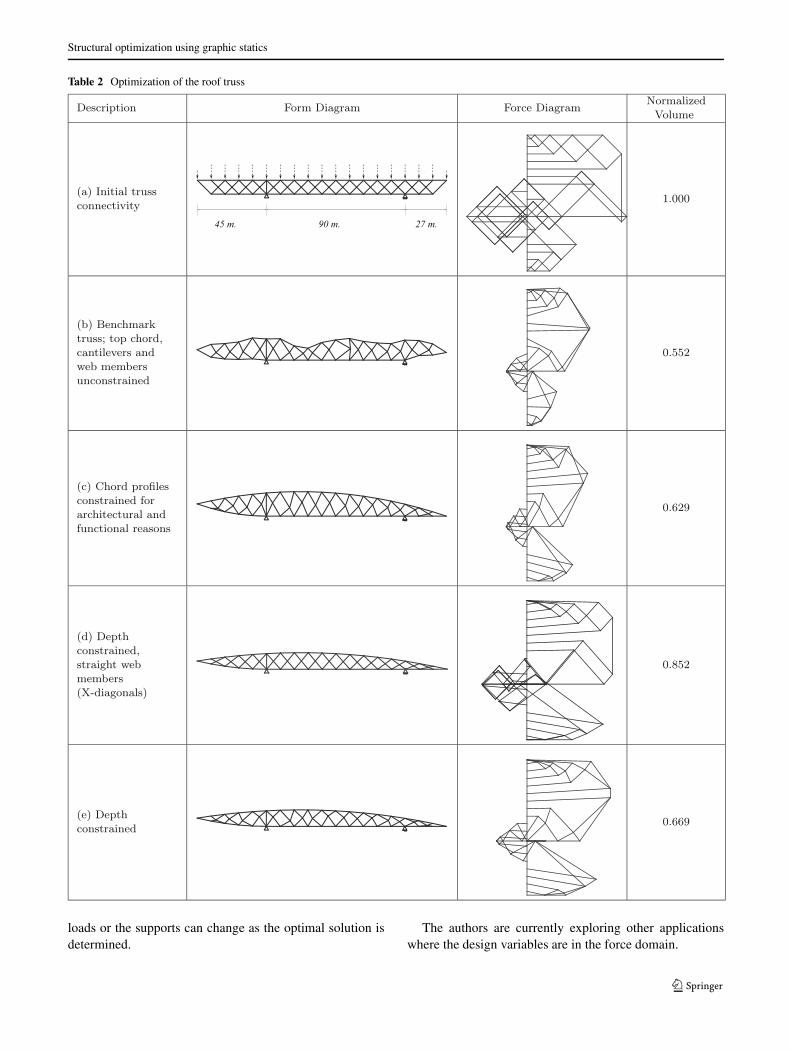
layouts were initially considered—Pratt, Warren, and X-Bracing. From these preliminary studies, a 9-meter deep,constant depth truss with an X-Bracing layout was selectedas starting layout (see case (a) in Table 2). Later, opti-mization was conducted on this initial truss to determinethe most efficient member layout satisfying architecturaland functional constraints. The objective function duringthe optimization process was the minimization of the totalsteel volume. The truss was initially optimized assum-ing equal allowable stresses in tension and compression,which resulted in a rather deep truss with large memberslenderness. This significantly reduces the allowable com-pression stress. Therefore, considerations for buckling of
compression members were directly included in the opti-mization process by calculating the slenderness of eachmember during the iterations and then updating the com-pressive allowable stress for the member based on the equa-tions of Section E3 of the Specifications in AISC (2010).The optimization was initially run constraining only thelower chord of the truss to be flat as indicated by case (b) inTable 2. As it can be observed, the resulting truss is deeperat the supports and at the center of the middle span, wherethe moments are large. The normalized total volume for thiscase is 0.552, which corresponds to a reduction of about45 % with respect to the reference case (a). Based on archi-tectural, cladding, drainage, and aesthetical considerations,
L. L. Beghini et al.
Fig. 11 Rendering of the roof truss for a convention center
the geometry of case (b) was deemed impractical but it doesprovide a benchmark for the problem. It was then decidedthat the top chord should have a constant curvature, whichmathematically can be described with a parabola. The bot-tom chord of the left side cantilever was also constrainedto be a parabola, with the additional consideration that itshould have a horizontal tangent at the left support, i.e.,to be continuous with the horizontal bottom chord at thecenter span and right side cantilever. Case (c) shows theresults of the optimization under these constraints. The totalnormalized volume for this case is 0.629, which is approxi-mately 14 % higher than the unconstrained case (b). Basedon further coordination with the project architects and otherdisciplines involved, it was determined that the truss depthshould be set to 10.7 m. The result of this optimization cor-responds to case (d) and (e) in the Table. The optimal trusslayout was initially calculated in case (d) with the additionaldepth constraint assuming straight web members betweenthe top and bottom chord and the resulting normalized vol-ume was 0.852. Next, the location of the work point at theintersection of the web members was optimized as shownin case (e). The total normalized volume for this case was0.669, which is only 6 % higher than case (c), where theheight of the parabola was unconstrained. Therefore, bysimply adjusting the work point at the intersection of theweb members there was a 21 % improvement on the struc-tural efficiency (as compared to case (d)). Figure 11 showsthe architectural rendering of the final scheme adopted,based on case (e) in Table 2. Although conventional stiff-ness methods could have been used for this design problem,the use of graphic statics and force diagrams provided valu-able insight in the force distribution in the structure and therelative importance of the various members. It also helpsthe designer develop insights into the relationships betweenform and forces. Such information guided the design engi-neers in the process of maximizing the efficiency of the
structure while satisfying all the functional and architecturalconstraints.
The design example described in this section was opti-mized considering a uniform load applied to the top chord.However, as described in details in Beghini et al. (2013),after the preliminary analysis based on the dominant loadcase in the conceptual phase of the design, the design engi-neer needs to consider all the possible load combinationsthat the structure might be subjected to, including pat-tern (asymmetric) loads. Such additional load combinationswill require upsizing some of the members which wererelatively small. Additional members may also be requiredto ensure proper redundancy in the structural load paths.Consequently, the overall volume will increase from thebaseline minimum. However, if there is a predominant loadcase, such increase is generally small, indicating that oncethe overall geometry of the structure has been optimized forthe governing load case, the other load cases do not have amajor impact on the structural efficiency, both in terms ofmaterial volume and deflections.
5 Summary, conclusions and future work
Graphic Statics provides another tool in determining dis-crete minimal load path structures. The method optimizesstructure by using design variables in the force domainrather than manipulating the geometry of the structure,as is done in other methods. It has great advantages inthe optimization of potentially “unstable” discrete trussesbecause the solutions are constrained to be in equilibriumby the fact that the force diagrams have closed polygons.The method often reduces the number of design variablesbecause of the restrictions of equilibrium and reciprocitywith the form diagram. The method can also find minimumload path structures where the point of application of the
Structural optimization using graphic statics
Table 2 Optimization of the roof truss
loads or the supports can change as the optimal solution isdetermined.
The authors are currently exploring other applicationswhere the design variables are in the force domain.
L. L. Beghini et al.
References
Altair Engineering Web Page (2013) www.altair.comAchtziger W (1997) Topology optimization of discrete structures: an
introduction in view of computational and nonsmooth aspects.In: Topology optimization in structural mechanics, pp 57–100
Achtziger W, Bendsoe MP, Ben-Tal A, Zowe J (1992) Equiv-alent displacement based formulations for maximum strengthtruss topology design. IMPACT Comput Sci Eng 4(4):315–345
AISC (2010) ANSI/AISC 360-10 specification for structural steelbuildings, pp 16.1-33
Baker WF, Beghini LL, Mazurek A, Carrion J, Beghini A (2013)Maxwell’s reciprocal diagrams and discrete Michell frames. StructMultidisc Optim. doi:10.1007/s00158-013-0910-0
Beghini A, Beghini L, Carrion J, Mazurek A, Baker WF (2013) Rank-ine’s theorem for the design of cable structures. Struct MultidiscOptim. doi:10.1007/s00158-013-0945-2
Ben-Tal A, Bendsoe MP (1993) A new method for optimal trusstopology design. SIAM J Optim 3(2):322–358
Bendsoe MP (1989) Optimal shape design as a material distributionproblem. Struct Optim 1(4):193–202
Bendsoe MP, Kikuchi N (1988) Generating optimal topologies instructural design using a homogenization method. Comput Meth-ods Appl Mech Eng 71(2):197–224
Bendsoe MP, Sigmund O (1999) Material interpolation schemes intopology optimization. Arch Appl Mech 69(9–10):635–654
Bendsoe MP, Sigmund O (2002) Topology optimization: theory, meth-ods and applications. Springer, Berlin
Bow R (1873) Economics of construction in relation to framed struc-tures. ICE Publishing, London
Christensen P, Klarbring A (2008) An introduction to structural opti-mization. Springer, New York. ISBN 978-1402086656
Cremona L (1872) Le figure reciproche nella grafica statica.Tipografia Giuseppe Bernardoni, Milano
Dorn W, Gomory R, Greenberg M (1964) Automatic design of optimalstructures. J Mech 3:25–52
Fivet C, Zastavni D (2012) Robert Maillart’s key methods from theSalginatobel bridge design process (1928). J IASS 53(1):39–47
Fleron P (1964) The minimum weight of trusses. BygningsstatiskeMeddelelser 35:81–96
Hansen S, Vanderplaats G (1988) An approximation method forconfiguration optimization of trusses. AIAA J 28(1):161–168
Hemp WS (1973) Optimum structures. Clarendon Press, OxfordHemp W (1974) Michell framework for uniform load between fixed
supports. Eng Optim 1(1):61–69Krog L, Tucker A, Kemp M, Boyd R (2004) Topology optimization
of aircraft wing box ribs. In: 10th AIAA/ISSMO multidisciplinaryanalysis and optimization conference, pp 2004–4481
Maxwell JC (1864) On reciprocal figures and diagrams of forces. PhilMag 26:250–261
Maxwell JC (1870) On reciprocal figures, frames, and diagrams offorces. Edinb Roy Soc Proc 7:160–208
Mazurek A, Baker WF, Tort C (2011) Geometrical aspects of optimumtruss like structures. Struct Multidisc Optim 43(2):231–242
McConnel RE (1974) Least weight frameworks for loads across a span.J Eng Mech Div 100(5):885–891
Michell AGM (1904) The limits of economy of material in frame-structures. Phil Mag 8(47):589–597
Oberndorfer JM, Achtziger W, Hornlein H (1996) Two approaches fortruss topology optimization: a comparison for practical use. StructMultidisc Optim 11(3):137–144
Pichugin AV, Tyas A, Gilbert M (2012) On the optimality of Hempsarch with vertical hangers. Struct Multidiscipl Optim 46(1):17–25.doi:10.1007/s00158-012-0769-5
Prager W (1970) Optimization of structural design. J Optim TheoryAppl 6(I):1–21
Prager W (1978) Optimal layout of trusses with finite numbers ofjoints. J Mech Phys Solids 26:241–250
Rahami H, Kaveh A, Gholipour Y (2008) Sizing, geometry andtopology optimization of trusses via force method and geneticalgorithm. Eng Struct 30(9):2360–2369
Rozvany GIN (1976) Optimal design of flexural systems. PergamonPress, Oxford
Rozvany GIN (1989) Structural design via optimality criteria. KluwerAcademic Publishers Group, Dordrecht
Rozvany GIN (1996) Some shortcomings in Michell’s truss theory.Struct Multidisc Optim 12(4):244–250
Rozvany GIN, Zhou M, Birker T (1992) Generalized shape optimiza-tion without homogenization. Struct Multidisc Optim 4(3):250–252
Rozvany GIN, Bendsoe MP, Kirsch U (1995) Layout optimization ofstructures. Appl Mech Rev 48(2):41–119
Sigmund O (2000) Topology optimization: a tool for the tailoring ofstructures and materials. Philos T Roy Soc A 358(1765):211–227
Sokol T (2010) A 99 line code for discretized Michell truss optimiza-tion written in Mathematica. Struct Multidisc Optim 43(2):181–190
Stromberg LL, Beghini A, Baker WF, Paulino GH (2012) Topol-ogy optimization for braced frames: combining continuum andbeam/column elements. Eng Struct 37:106–124
Sutradhar A, Paulino GH, Miller MJ, Nguyen TH (2010) Topo-logical optimization for designing patient-specific large cranio-facial segmental bone replacements. Proc Natl Acad Sci USA107(30):13,222–13,227
Svanberg K (1987) The method of moving asymptotes—a new methodfor structural optimization. Int J Numer Methods Eng 24:359–373
Svanberg K (2013) Personal webpage of Krister Svanberg, Professor.http://www.math.kth.se/krille/
Talischi C, Paulino GH, Pereira A, Menezes IFM (2012a) PolyMesher:a general-purpose mesh generator for polygonal elements writtenin Matlab. Struct Multidisc Optim 45(3):309–328
Talischi C, Paulino GH, Pereira A, Menezes IFM (2012b) PolyTop: aMatlab implementation of a general topology optimization frame-work using unstructured polygonal finite element meshes. StructMultidisc Optim 45(3):329–357
Wolfe W (1921) Graphical analysis. McGraw-Hill Book Co. Inc., NewYork
Zalewski W, Allen E (1998) Shaping structures: statics. Wiley, NewYork
Zastavni D (2008) The structural design of Maillart’s Chiasso Shed(1924): a graphic procedure. Struct Eng Int J Int Assoc BridgeStruct Eng 18(3):247–252
Zhou M, Rozvany GIN (1991) The COC algorithm, Part II: topo-logical, geometrical and generalized shape optimization. ComputMethods Appl Mech Eng 89(1–3):309–336
Zhou M, Rozvany GIN (1993) DCOC: an optimality criteria methodfor large systems Part II: algorithm. Struct Multidisc Optim6(4):250–262