structural health monitoring using strong … · structural health monitoring using strong and weak...
TRANSCRIPT
Tenth U.S. National Conference on Earthquake EngineeringFrontiers of Earthquake Engineering July 21-25, 2014 Anchorage, Alaska 10NCEE
STRUCTURAL HEALTH MONITORING USING STRONG AND WEAK
EARTHQUAKE MOTIONS
R. Boroschek1, A. Aguilar2 and P. León3
ABSTRACT This article presents the Structural Health Monitoring System of the Central Tower at the Faculty of Physical and Mathematical Science of the University of Chile. The building has been continuously monitored since 2009 with a network of 8 uniaxial accelerometers and 17 environmental sensors that register ambient conditions, like wind speed and direction, temperature, rainfall, ambient and soil humidity. During this period, it has been continuously monitoring ambient vibrations and more than 1700 seismic events of different intensity. The building is a nine stories, 30 meters high, shear wall reinforced concrete structure. An automatic system is presented that identifies seismic response from continuous vibration records. Ambient vibration and noise are clearly identify and separated from seismic signals. Modal parameters are obtained from seismic records using different multiple input-multiple output (MIMO) techniques. This article presents the analysis of 1700 seismic events recorded since 2009. The variation of the predominant frequency and damping is clearly identified as a function of level of shaking. Variations of these parameters are not related with damage and because of this are reversible. The magnitude of these variations are determined and compared with the variations cause by ambient effect (temperature, rain, humidity, radiation and others). The building exhibit damaged during Mw=8.8 2010 Chile earthquake. Window analysis of the response records show clearly the time of initiation of damage and its effect during the strong shaking and during aftershocks.
1 Associate Professor, M. Sc., Ph. D. University of Chile, [email protected] 2 Structural Engineer, Rubén Boroschek y Associates, [email protected] 3 Engineering Student, Civil Engineering Department, University of Chile, [email protected]
DOI: 10.4231/D3SQ8QJ2C
STRUCTURAL HEALTH MONITORING USING STRONG AND WEAK
EARTHQUAKE MOTIONS
R. Boroschek2, A. Aguilar2 and P. León3
ABSTRACT This article presents the Structural Health Monitoring System of the Central Tower at the Faculty
of Physical and Mathematical Science of the University of Chile. The building has been continuously monitored since 2009 with a network of 8 uniaxial accelerometers and 17 environmental sensors that register ambient conditions, like wind speed and direction, temperature, rainfall, ambient and soil humidity. During this period, it has been continuously monitoring ambient vibrations and more than 1700 seismic events of different intensity. The building is a nine stories, 30 meters high, shear wall reinforced concrete structure. An automatic system is presented that identifies seismic response from continuous vibration records. Ambient vibration and noise are clearly identify and separated from seismic signals. Modal parameters are obtained from seismic records using different multiple input multiple output (MIMO) techniques. This article presents the analysis of 1700 seismic events recorded since 2009. The variation of the predominant frequency and damping is clearly identified as a function of level of shaking. Variations of these parameters are not related with damage and because of this are reversible. The magnitude of these variations are determined and compared with the variations cause by ambient effect (temperature, rain, humidity, radiation and others). The building exhibit damaged during Mw=8.8 2010 Chile earthquake. Window analysis of the response records show clearly the time of initiation of damage and its effect during the strong shaking and during aftershocks.
1 Associate Professor, M. Sc., Ph. D. University of Chile, [email protected] 2 Structural Engineer, Rubén Boroschek y Associates, [email protected] 3 Engineering Student, Civil Engineering Department, University of Chile, [email protected]
Introduction
In February 27, 2010 the sixth largest magnitude earthquake recoded in the world affected the Central part of Chile. More than 1500 building higher than 10 stories, bridges and dams suffered strong shaking. Review of the damage to the buildings stock took more than one month with a high social and political pressure to give assurance on the level of damage of each building. One of the instrumented buildings had a continuous remote monitoring system and it gave, in less than ten minutes after the earthquake, an indication of the level of change in dynamic properties.
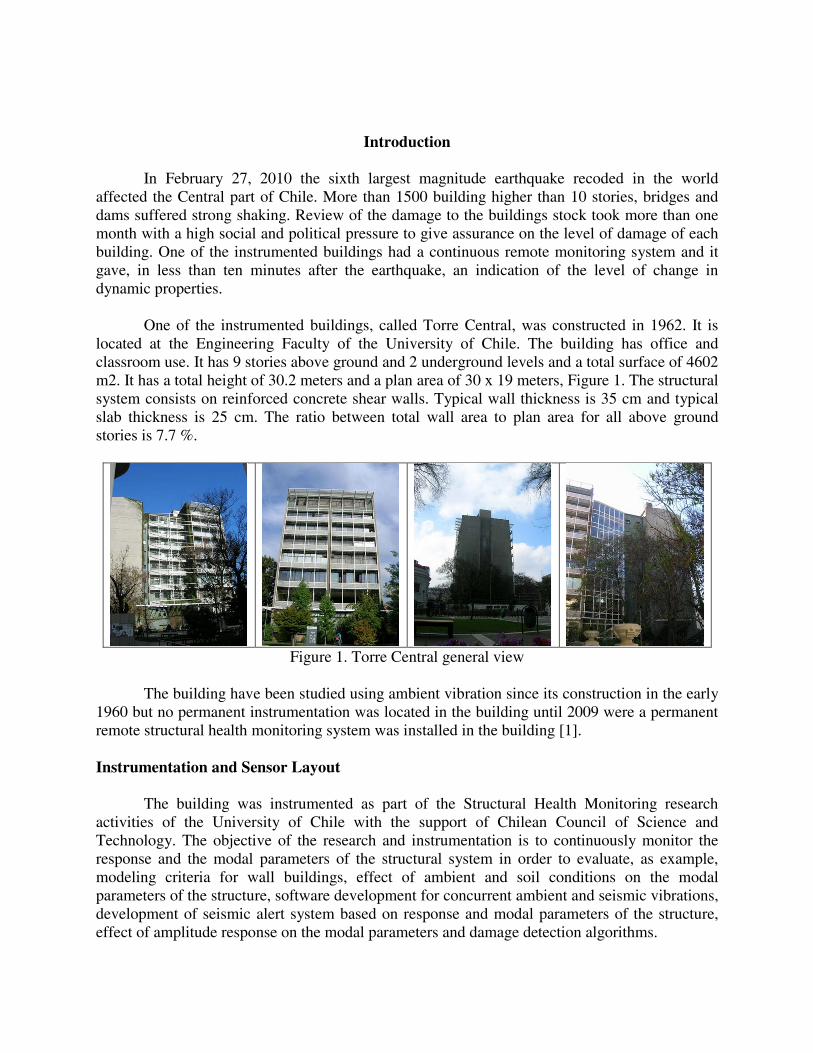
One of the instrumented buildings, called Torre Central, was constructed in 1962. It is located at the Engineering Faculty of the University of Chile. The building has office and classroom use. It has 9 stories above ground and 2 underground levels and a total surface of 4602 m2. It has a total height of 30.2 meters and a plan area of 30 x 19 meters, Figure 1. The structural system consists on reinforced concrete shear walls. Typical wall thickness is 35 cm and typical slab thickness is 25 cm. The ratio between total wall area to plan area for all above ground stories is 7.7 %.
Figure 1. Torre Central general view
The building have been studied using ambient vibration since its construction in the early
1960 but no permanent instrumentation was located in the building until 2009 were a permanent remote structural health monitoring system was installed in the building [1].
Instrumentation and Sensor Layout
The building was instrumented as part of the Structural Health Monitoring research activities of the University of Chile with the support of Chilean Council of Science and Technology. The objective of the research and instrumentation is to continuously monitor the response and the modal parameters of the structural system in order to evaluate, as example, modeling criteria for wall buildings, effect of ambient and soil conditions on the modal parameters of the structure, software development for concurrent ambient and seismic vibrations, development of seismic alert system based on response and modal parameters of the structure, effect of amplitude response on the modal parameters and damage detection algorithms.
Sensor location
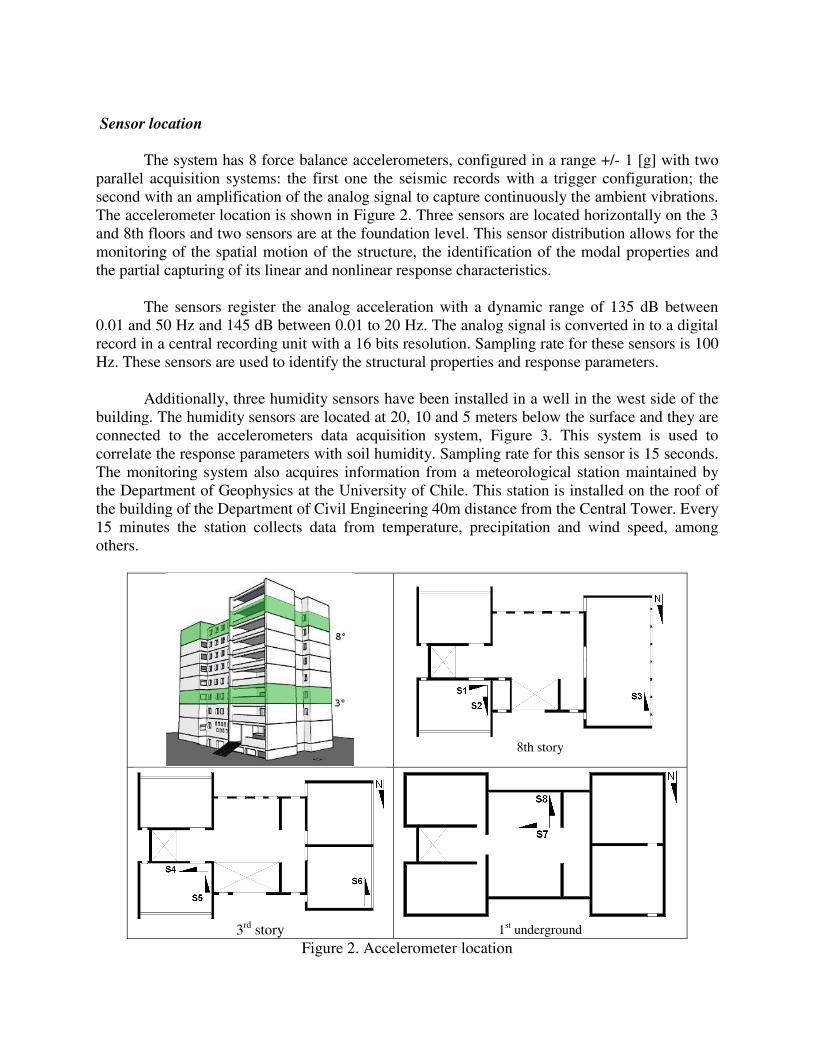
The system has 8 force balance accelerometers, configured in a range +/- 1 [g] with two parallel acquisition systems: the first one the seismic records with a trigger configuration; the second with an amplification of the analog signal to capture continuously the ambient vibrations. The accelerometer location is shown in Figure 2. Three sensors are located horizontally on the 3 and 8th floors and two sensors are at the foundation level. This sensor distribution allows for the monitoring of the spatial motion of the structure, the identification of the modal properties and the partial capturing of its linear and nonlinear response characteristics.
The sensors register the analog acceleration with a dynamic range of 135 dB between
0.01 and 50 Hz and 145 dB between 0.01 to 20 Hz. The analog signal is converted in to a digital record in a central recording unit with a 16 bits resolution. Sampling rate for these sensors is 100 Hz. These sensors are used to identify the structural properties and response parameters.
Additionally, three humidity sensors have been installed in a well in the west side of the building. The humidity sensors are located at 20, 10 and 5 meters below the surface and they are connected to the accelerometers data acquisition system, Figure 3. This system is used to correlate the response parameters with soil humidity. Sampling rate for this sensor is 15 seconds. The monitoring system also acquires information from a meteorological station maintained by the Department of Geophysics at the University of Chile. This station is installed on the roof of the building of the Department of Civil Engineering 40m distance from the Central Tower. Every 15 minutes the station collects data from temperature, precipitation and wind speed, among others.
8th story
3rd story
1st underground
Figure 2. Accelerometer location

(a)
(b)
(c)
Figure 3. Sensors: (a) schematic dwell location, (b) well for humidity sensors and (c) meteorological station.
Network workflow
The structural health monitoring system stores all data in a computer that also controls the acquisition system. The computer and acquisition system are located in the first basement of the structure. The computer stores and post process the data using two system identification techniques to determine modal parameters: Peak Picking and Stochastic Sub-Space Identification (SSI) [2][3][4] methods. The results are synchronized with the Civil Engineering Department server and published on Internet (www.ingcivil.uchile.cl/shm). Figure 4 shows the network and processing workflow used to obtain and display selected results.
Figure 4. Structural Health Monitoring network workflow.
To obtain the modal parameters from the time series, the system is configured to obtain
continuous records packaged every 15 minutes. Frequency and damping ratio are updated each 15 minutes on the web site.
System Identification Technique
The Multivariable Output Error State Space (MOESP) method MOESP developed by
Verhaegen in 1994 [5] is used to obtained the modal parameters. MOESP is a method that obtains state space matrices from input and output data using Hankel and Toeplitz matrices and time windows analysis. The model is described by Eqs. 1 and 2. This system is solved for each time window determining the modal properties of the system.

z = A z + B u (1) y = C z + D u (2) Grouping all time input and output information we get Eqs. 3 and 4 yy⋮y =
CC A⋮C A z + DC B⋮C A B0D⋮C A B
⋯⋯⋱⋯00⋮C B
00⋮Duu⋮u (3)
yy⋮yy ⋯y ⋯⋮ ⋱y ⋯
yy⋮y = Z , + uu⋮uu ⋯u ⋯⋮ ⋱u ⋯
uu⋮u (4)
Where
Z , = z z ⋯ z (5) Then Y , , = Z , + U , , (6) Grouping aging input and output parameters and performing a LQ decomposition H = U , , Y , , = L 0 L L Q Q = ⋯
⋯ = U , , = L QY , , = L Q + L Q (7)
Where: Q Q = I si i = j0 si i ≠ j (8)
Applying a Singular Value Decomposition to L : L = M M ( ) ∑ 0 ( )0 ( ) ∑ ( ) ( ) N N ( ) (9)
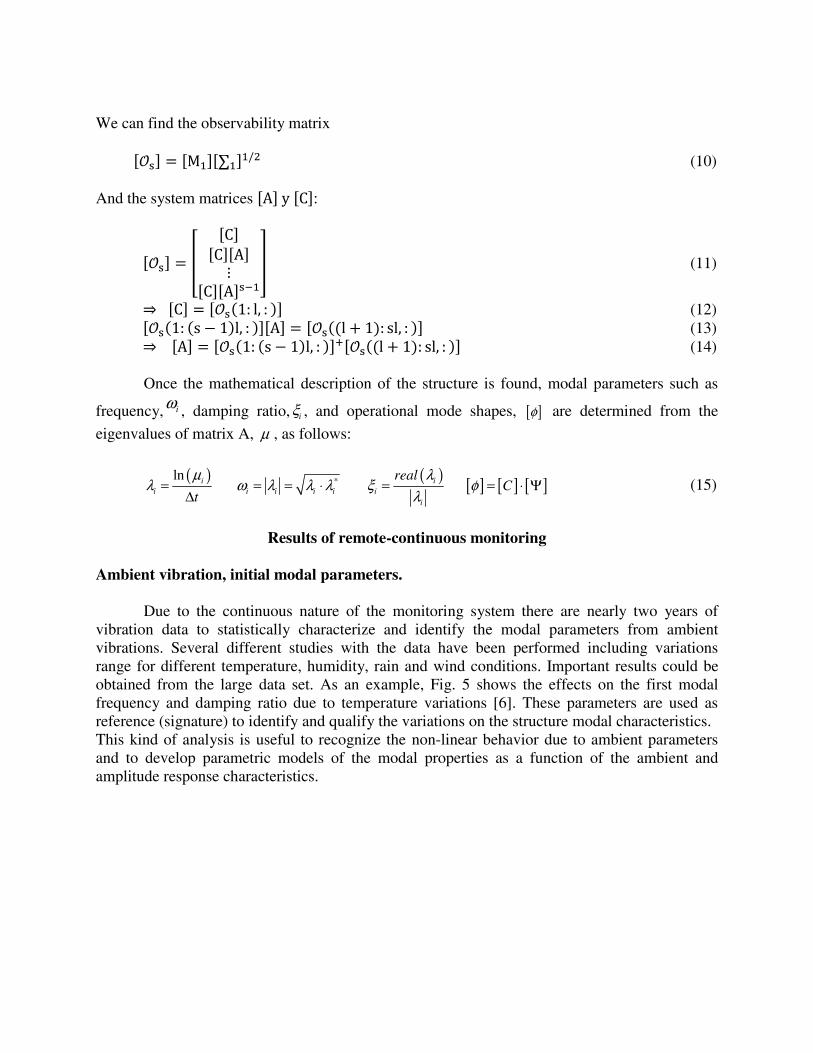
We can find the observability matrix = M ∑ / (10) And the system matrices A y C :
= CC A⋮C A (11)
⇒ C = (1: l, : ) (12) (1: (s − 1)l, : ) A = ((l + 1): sl, : ) (13) ⇒ A = (1: (s − 1)l, : ) ((l + 1): sl, : ) (14)
Once the mathematical description of the structure is found, modal parameters such as
frequency, iω , damping ratio, iξ , and operational mode shapes, [ ]φ are determined from the
eigenvalues of matrix A, μ , as follows:
( ) ( ) [ ] [ ] [ ]*ln
i ii i i i i i
i
realC
t
μ λλ ω λ λ λ ξ φ
λ= = = ⋅ = = ⋅ Ψ
Δ (15)
Results of remote-continuous monitoring
Ambient vibration, initial modal parameters.
Due to the continuous nature of the monitoring system there are nearly two years of vibration data to statistically characterize and identify the modal parameters from ambient vibrations. Several different studies with the data have been performed including variations range for different temperature, humidity, rain and wind conditions. Important results could be obtained from the large data set. As an example, Fig. 5 shows the effects on the first modal frequency and damping ratio due to temperature variations [6]. These parameters are used as reference (signature) to identify and qualify the variations on the structure modal characteristics. This kind of analysis is useful to recognize the non-linear behavior due to ambient parameters and to develop parametric models of the modal properties as a function of the ambient and amplitude response characteristics.

(a)
(b)
Figure 5. (a) Temperature effects on frequency variations, mode 1. (b) Temperature effects on damping ratio, mode 1. Samples were taken between July 3, 2009 and February 26, 2010.
SHM web page display. Correlation with soil and ambient parameters.
The web-site designed for this building store and publishes each selected results every 15 minutes on the Web and it can be access from any computer. The web-site main page shows three graphics as a function of time: the first are the modal parameters showing the frequency and damping variations. The second shows soil humidity at three different positions and the third shows ambient parameters, Figure 6. The data can be zoom easily by the user.
Figure 6. SHM web-page.
Building Response during the Seismic Events
More than 1700 seismic events have been recorded in the building in a period of two
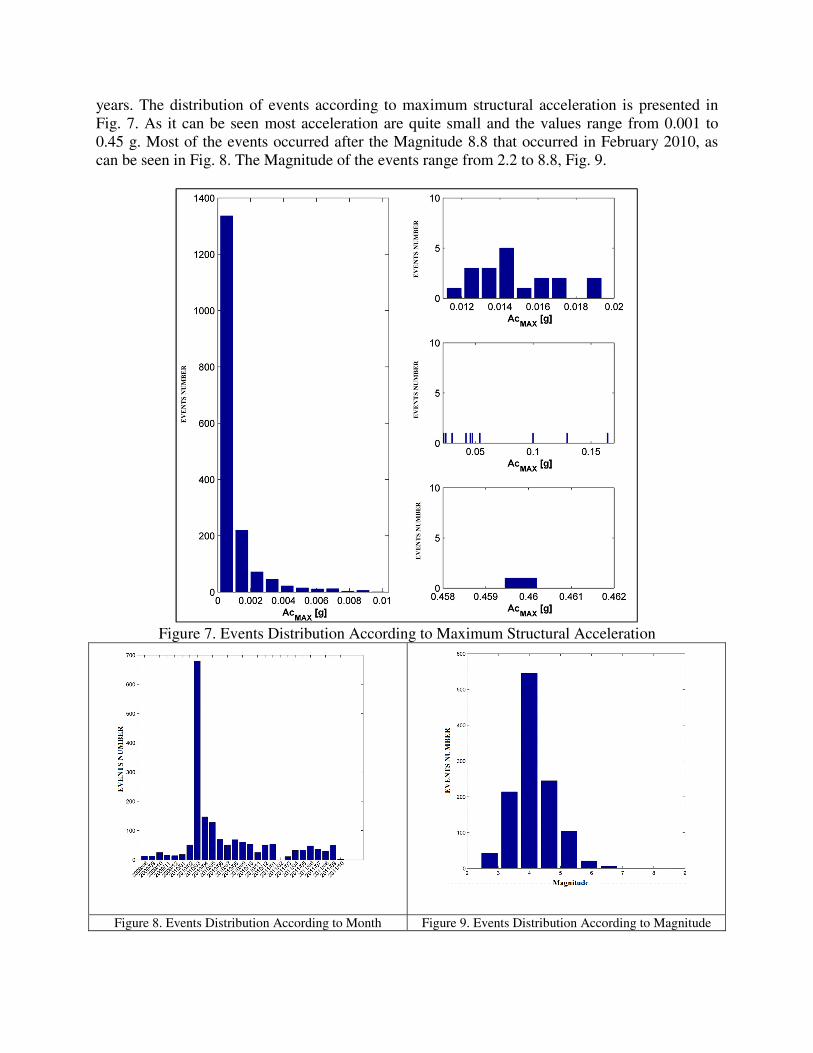
years. The distribution of events according to maximum structural acceleration is presented in Fig. 7. As it can be seen most acceleration are quite small and the values range from 0.001 to 0.45 g. Most of the events occurred after the Magnitude 8.8 that occurred in February 2010, as can be seen in Fig. 8. The Magnitude of the events range from 2.2 to 8.8, Fig. 9.
Figure 7. Events Distribution According to Maximum Structural Acceleration
Figure 8. Events Distribution According to Month Figure 9. Events Distribution According to Magnitude

The records from the Feb 2010 main event are shown in Fig. 10. The building suffered light structural damage characterized by cracking of some structural walls and light partition damage. Due to this damage modal parameters clearly change and were reported automatically on the web page of the building.
Figure 10. Strong motion records of Torre Central Building.
The analysis of the ambient vibrations derived modal parameters before and after the
main event shows a permanent change. The results indicate that there was an average increment of 14% on the first natural periods, Table 1. Table 1-Modal Parameters before and after the earthquake derived from ambient vibrations.
Before After Difference (%)
Mode Period (sec)
Damp (%)
Period (sec)
Damp (%) Period Damp
1 0.45 0.7 0.53 0.7 18.6 0.0 2 0.38 0.7 0.44 0.7 14.0 0.0 3 0.34 0.7 0.37 0.8 10.9 14.3 4 0.16 1.2 0.18 0.9 15.5 25.0 5 0.13 1.5 0.15 1.3 12.1 13.3 6 0.13 0.9 0.14 1.0 12.4 11.1
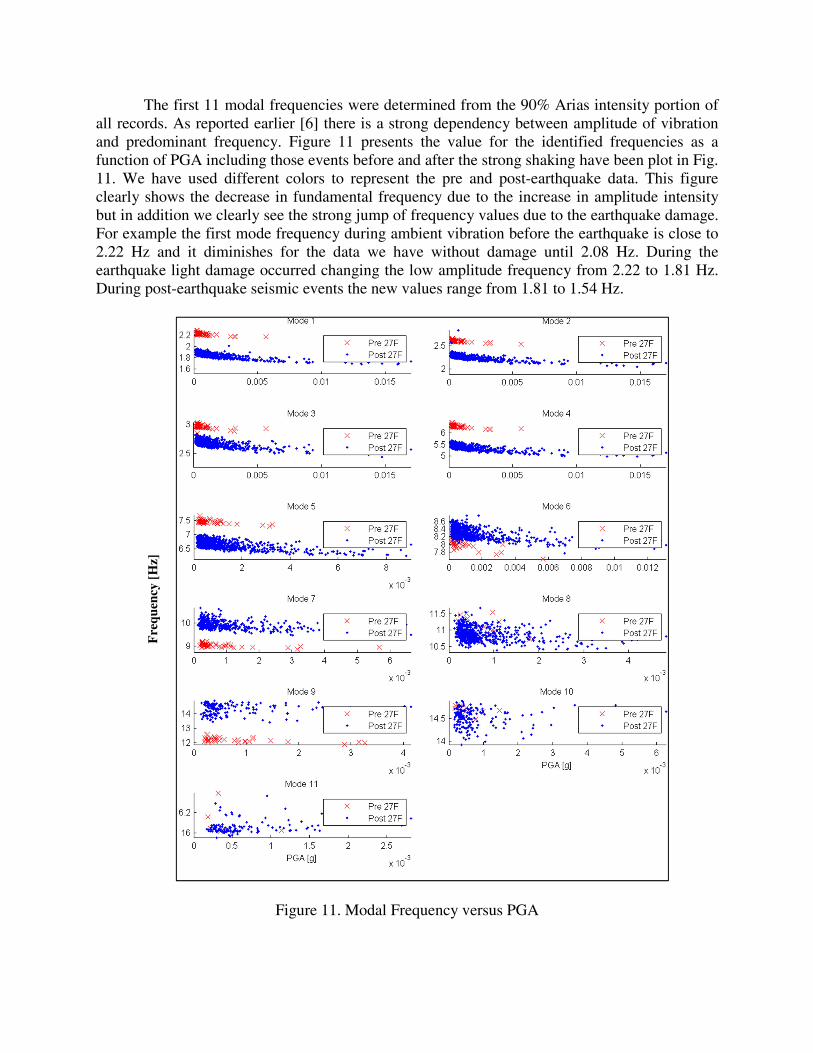
The first 11 modal frequencies were determined from the 90% Arias intensity portion of all records. As reported earlier [6] there is a strong dependency between amplitude of vibration and predominant frequency. Figure 11 presents the value for the identified frequencies as a function of PGA including those events before and after the strong shaking have been plot in Fig. 11. We have used different colors to represent the pre and post-earthquake data. This figure clearly shows the decrease in fundamental frequency due to the increase in amplitude intensity but in addition we clearly see the strong jump of frequency values due to the earthquake damage. For example the first mode frequency during ambient vibration before the earthquake is close to 2.22 Hz and it diminishes for the data we have without damage until 2.08 Hz. During the earthquake light damage occurred changing the low amplitude frequency from 2.22 to 1.81 Hz. During post-earthquake seismic events the new values range from 1.81 to 1.54 Hz.
Fre
quen
cy [
Hz]
Figure 11. Modal Frequency versus PGA

Conclusions
The continuous remote monitoring and processing of an instrumented building has shown
the possibility of tracking changes of the modal parameters under ambient a seismic events. This is very important results for structural health monitoring. Non damaging seismic events can vary the natural frequency of the building by 10% and light damage can account for nearly 18%.
Acknowledgments
The Civil Engineering Department of the University of Chile and the Chilean Council for
Research and Technology, CONICYT Fondecyt Project # 1070319 supported this research paper. The support of Engineer Pedro Soto is greatly appreciated. This research was part of the individual works for Engineer Thesis of Pablo León, both undergraduate students of the University of Chile.
References
[1] Boroschek R., Nuñez T. and Yañez T. Development of a real time internet based monitoring system in a nine story, shear wall building, 14 European Conference of Earthquake Engineering, Ohrid, Macedonia 14ECEE_1215, 2010. [2] Van Overschee P. and De Moor B. Subspace algorithms for the stochastic identification problem. Automatica, Vol. 29, no. 3, pp. 649-660. 1993. [3] Van Overschee P. and De Moor B. N4SID: Subspace Algorithms for the identification of Combined Deterministic-Stochastic Systems. Automatica, Special Issue on Statistical Signal Processing and Control. Vol 30, no. 1, pp. 75-93. 1994. [4] Van Overschee P. and De Moor B. Subspace Identification for Linear Systems: Theory-Implementation- Applications. Kluwer Academic Publishers, Dordrecht, The Netherlands. 1996. [5] Yoshimoto, R., Mita, A., Keiichi Okada,K. Damage detection of base-isolated buildings using multi-input multi-output subspace identification. Earthquake Engng Struct. Dyn. 2005; 34:307–324. [6] R. Boroschek, A. Aguilar, J. Basualto, P. León. Structural Health Monitoring of Mid Height Building in Chile. 5 International Operational Modal Analysis conference. IOMAC, Guimaraes, Mayo 13-15, Portugal, 2013