structural factors that influence the inhibition of type ii
TRANSCRIPT
Georgia State UniversityScholarWorks @ Georgia State University
Chemistry Theses Department of Chemistry
4-13-2009
Structural Factors that Influence the Inhibition ofType II Restriction Enzymes by Minor GrooveBindersHa Hoang [email protected]
Follow this and additional works at: https://scholarworks.gsu.edu/chemistry_theses
This Thesis is brought to you for free and open access by the Department of Chemistry at ScholarWorks @ Georgia State University. It has beenaccepted for inclusion in Chemistry Theses by an authorized administrator of ScholarWorks @ Georgia State University. For more information, pleasecontact [email protected].
Recommended CitationNguyen, Ha Hoang, "Structural Factors that Influence the Inhibition of Type II Restriction Enzymes by Minor Groove Binders."Thesis, Georgia State University, 2009.https://scholarworks.gsu.edu/chemistry_theses/17
STRUCTURAL FACTORS THAT INFLUENCE THE INHIBITION OF
TYPE II RESTRICTION ENZYMES BY MINOR GROOVE BINDERS
by
HA HOANG NGUYEN
Under the Direction of Dr. W. David Wilson
ABSTRACT
The objective of this thesis was to study whether heterocyclic dicationic compounds that
are minor groove binders have the ability to inhibit the digestive properties of type II restriction
enzymes which bind to the major groove of the DNA. If these compounds do possess the ability
to inhibit restriction enzymes, then what factors influence their ability to inhibit the restriction
enzymes? The methods used to study the interactions of DNA, compounds, and enzymes are gel
electrophoresis, DNA thermal melting, and circular dichroism. The results from this project
reveal that the minor grove binding compounds are able to inhibition type II restriction enzymes.
The inhibition is heavily influenced by compound structure and the DNA binding sequence of
the enzyme.

INDEX WORDS: African trypanosomiasis, Gel electrophoresis, Heterocyclic diamidines, Minor groove binders, Type II restriction enzymes
STRUCTURAL FACTORS THAT INFLUENCE THE INHIBITION OF
TYPE II RESTRICTION ENZYMES BY MINOR GROOVE BINDERS
by
HA HOANG NGUYEN
A Thesis Submitted in Partial Fulfillment of the Requirements for the Degree of
Master of Science
in the College of Arts and Sciences
Georgia State University
2009

Copyright by
Ha Hoang Nguyen
2009

STRUCTURAL FACTORS THAT INFLUENCE THE INHIBITION OF
TYPE II RESTRICTION ENZYMES BY MINOR GROOVE BINDERS
by
HA HOANG NGUYEN
Committee Chair: Dr. W. David Wilson Committee: Dr. Kathryn B. Grant Dr. Jerry C. Smith
Electronic Version Approved:
Office of Graduate Studies College of Arts and Sciences Georgia State University May 2009
iv
ACKNOWLEDGEMENTS
I would like to thank my research advisor Dr. W. David Wilson for his guidance and for
showing me that success comes from dedication and perseverance. I would also like to thank the
members of the Wilson Research Group for their help, especially Farial Tanious and Denise
Tevis.
v
TABLE OF CONTENTS
ACKNOWLEDGEMENTS iv LIST OF TABLES vii LIST OF FIGURES viii LIST OF ABBREVIATIONS xiv CHAPTER
1. INTRODUCTION
1.1 African Sleeping Sickness and Common Therapeutic Treatments 1 1.2 Heterocyclic Diamidines (Dications) 2 1.3 Dications and DNA Interactions 3 1.4 Thesis Question and Type II Restriction Enzymes 6 1.5 DNA Topological Change and Effect on Restriction Enzyme
Inhibition 12
1.6 Inhibition of Type II Restriction Enzyme by Non-Heterocyclic
Dication Compounds 13
1.7 Introductory Synopsis and Goals 14
2 . MATERIALS & METHODS
2.1 Overview of Methods 15 2.2 Dication Compounds 16 2.3 DNA Cleaving Reaction 17 2.4 Agarose Gel Electrophoresis 19 2.5 DNA Thermal Melting (Tm) - UV Spectroscopy 20 2.6 Circular Dichroism 21
vi
3. METHOD DEVELOPMENT & TESTING WITH DB75 22
4. INHIBITION OF ECO RI BY DICATION COMPOUNDS USING RESTRICTION ENZYME INHIBITING METHOD
4.1 Modification of the Central Furan Ring 26 4.2 Modification of the Heterocyclic Amidine Ends 28 4.3 Netropsin, Pentamidine, and Modification of the Unfused
Heterocyclic System 33
5. CLEAVAGE INHIBTION OF OTHER RESTRICTION ENZYMES
5.1 Hind III Inhibition by Dication Compounds 37 5.2 Sma I Inhibition by Dication Compounds 41
5.3 Inhibition of Bam HI and Kpn I (Sma I Flanking Sequence) by
Dication Compounds 44
5.4 DNA Topological Effect on Inhibition of Restriction Enzyme by
Dications 46
5.5 Nar I Inhibition by Dication Compounds 50
6. DICATION BINDING AND DNA THERMAL MELTING (TM) BY UV
SPECTROSCOPY 51
7. MODE OF DICATION BINDING BY CIRCLAR DICHROISM 56
8. CONCLUSION 62
REFERENCES 65
vii
LIST OF TABLES Table 1.1 Type II restriction enzyme recognition sequence and cleaving pattern 11 Table 2.1 Heterocyclic diamidines (DB), pentamidine, and netropsin structures 16 Table 2.2 Cleavage and cleavage inhibition reaction recipe 18 Table 4.1 IC50 values of Eco RI by compounds and Kb of compounds to AATT DNA 35 Table 6.1 ΔTm of compounds binding onto Eco RI DNA sequence 55
viii
LIST OF FIGURES Figure 1.1 Pentamidine and Melarsoprol. 1 Figure 1.2 (A) Space-filling representation of crystal structure and (B) schematic of
DB75-DNA complex. Crystal structure shows DB75 molecule in green bound to DNA helix. Schematic shows DB75 forming hydrogen bonds (dashed lines) with water and DNA bases. Hydrogen bond units are in angstroms.
4
Figure 1.3 DNA Structure showing hydrogen bonds between DNA and water. 5 Figure 1.4 Structure of bis-(ethylamidiniumphenyl) furan, a DB75 derivative,
bound to DNA within the minor groove. With the compound bound to DNA, water molecules that form the spine of hydration between AT bases are displaced.
5
Figure 1.5 Magnesium binding site in Eco RV restriction enzyme. The magnesium
ion (green ball) assists in activating a water molecule to facilitate the nucleophilic attach of the phosphorus atom (purple ball) on the phosphate group breaking the scissile bond.
7
Figure 1.6 Restriction enzyme catalyzed hydrolysis of DNA forming a free 3’
hydroxyl group and a 5’ phosphate group. 7
Figure 1.7 Eco RV homodimer (yellow and blue ribbon model) bound to cognate
DNA (purple loop model). The restriction enzyme and DNA twofold axis are aligned.
9
Figure 1.8 Eco RV homodimer (yellow and blue ribbon model) bound to
noncognate DNA (pink loop model) in the presence of magnesium. 10
Figure 1.9 Selected DNA sequence from the MCS region of pUC19 containing
cognate site for several of the enzymes examined. 12
Figure 1.10 Circular DNA topological change from relaxed form (left) to supercoiled
form (right). 12
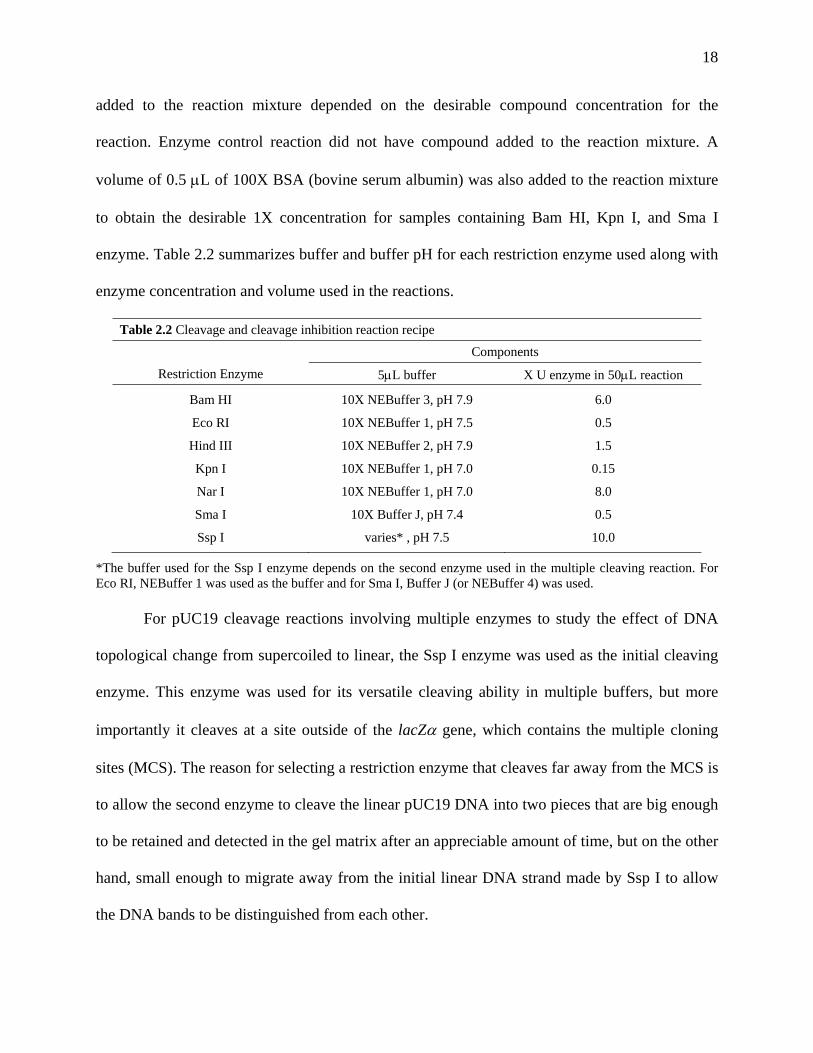
Figure 2.1 pUC19 DNA with location of enzyme restriction sites used in this
research (see Table 1.1). 19
Figure 2.2 DNA oligomer sequences containing the recognition site (highlighted in
red) for each corresponding restriction enzyme. 21
ix
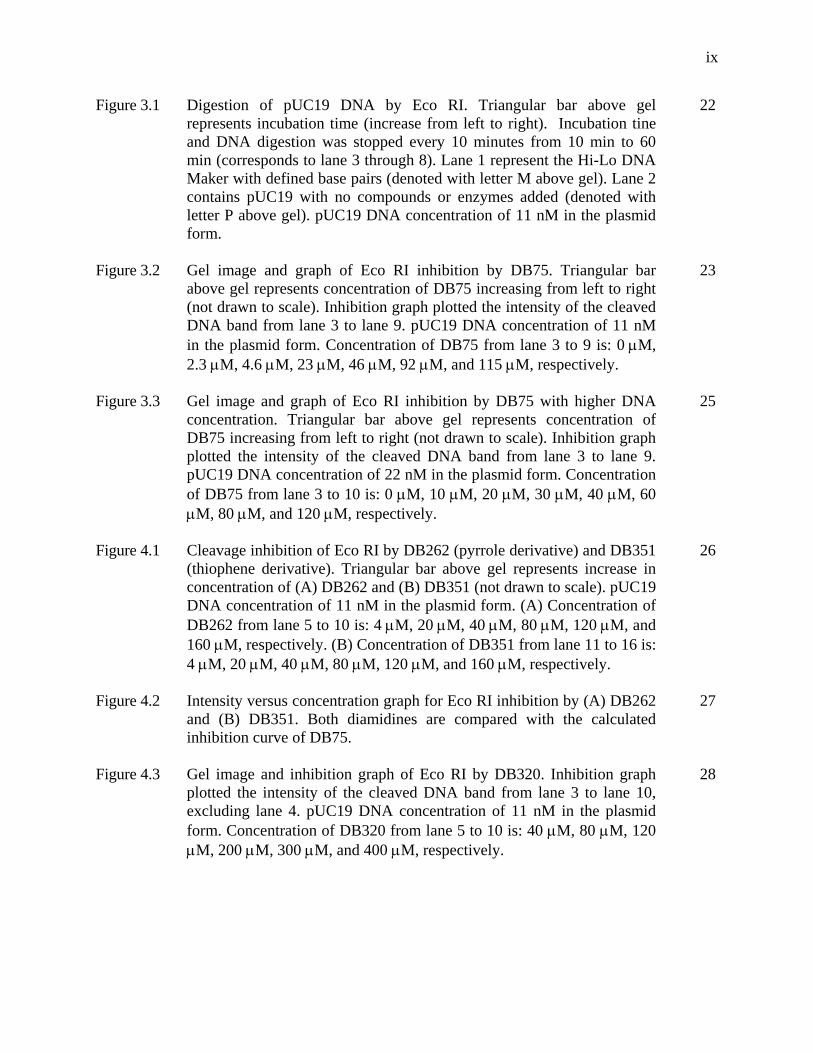
Figure 3.1 Digestion of pUC19 DNA by Eco RI. Triangular bar above gel represents incubation time (increase from left to right). Incubation tine and DNA digestion was stopped every 10 minutes from 10 min to 60 min (corresponds to lane 3 through 8). Lane 1 represent the Hi-Lo DNA Maker with defined base pairs (denoted with letter M above gel). Lane 2 contains pUC19 with no compounds or enzymes added (denoted with letter P above gel). pUC19 DNA concentration of 11 nM in the plasmid form.
22
Figure 3.2 Gel image and graph of Eco RI inhibition by DB75. Triangular bar
above gel represents concentration of DB75 increasing from left to right (not drawn to scale). Inhibition graph plotted the intensity of the cleaved DNA band from lane 3 to lane 9. pUC19 DNA concentration of 11 nM in the plasmid form. Concentration of DB75 from lane 3 to 9 is: 0 μM, 2.3 μM, 4.6 μM, 23 μM, 46 μM, 92 μM, and 115 μM, respectively.
23
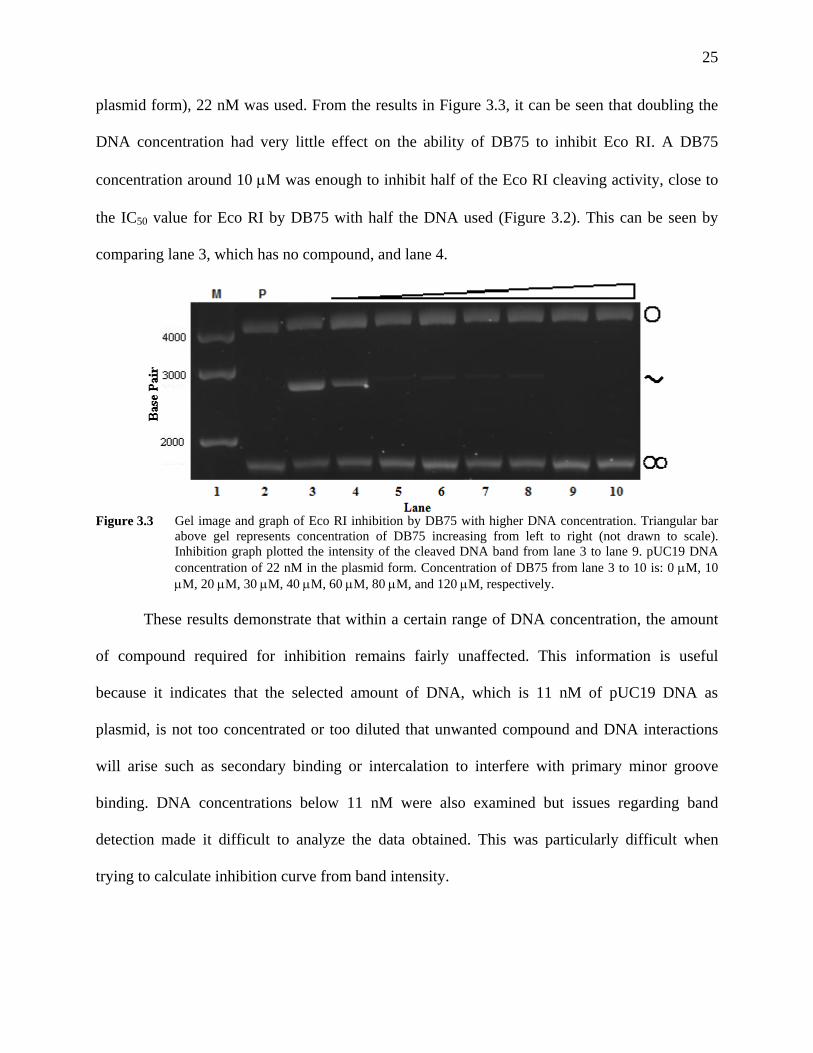
Figure 3.3
Gel image and graph of Eco RI inhibition by DB75 with higher DNA concentration. Triangular bar above gel represents concentration of DB75 increasing from left to right (not drawn to scale). Inhibition graph plotted the intensity of the cleaved DNA band from lane 3 to lane 9. pUC19 DNA concentration of 22 nM in the plasmid form. Concentration of DB75 from lane 3 to 10 is: 0 μM, 10 μM, 20 μM, 30 μM, 40 μM, 60 μM, 80 μM, and 120 μM, respectively.
25
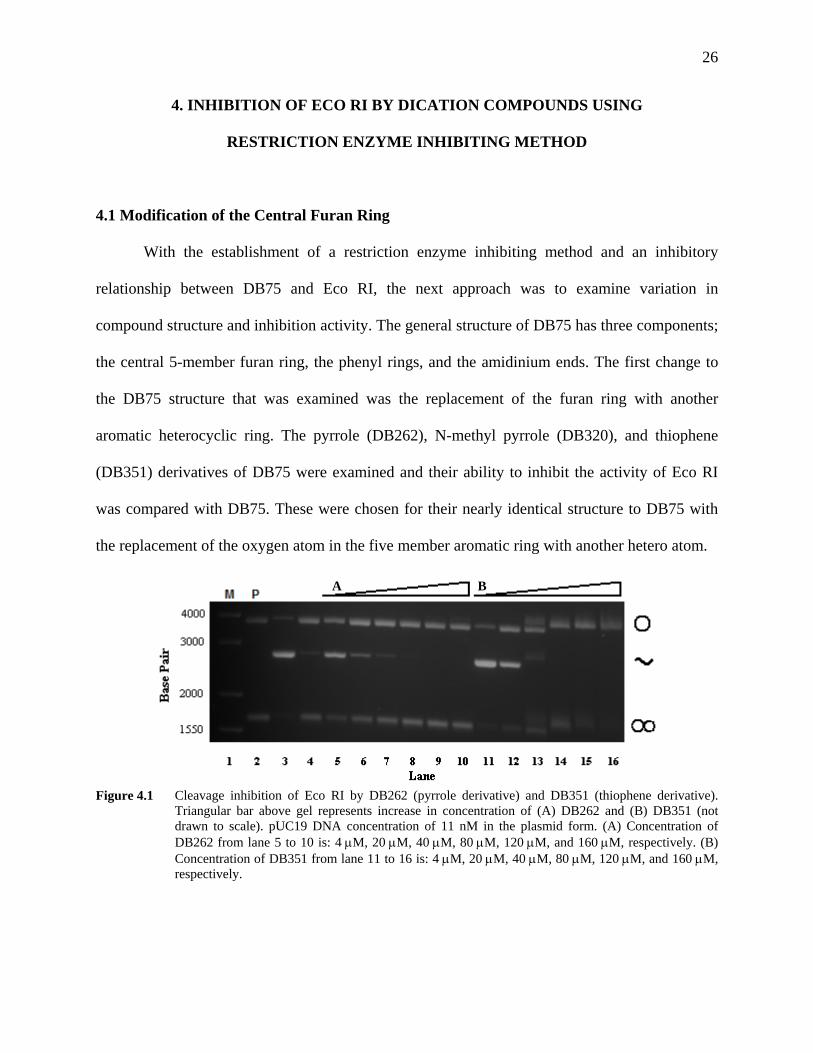
Figure 4.1 Cleavage inhibition of Eco RI by DB262 (pyrrole derivative) and DB351
(thiophene derivative). Triangular bar above gel represents increase in concentration of (A) DB262 and (B) DB351 (not drawn to scale). pUC19 DNA concentration of 11 nM in the plasmid form. (A) Concentration of DB262 from lane 5 to 10 is: 4 μM, 20 μM, 40 μM, 80 μM, 120 μM, and 160 μM, respectively. (B) Concentration of DB351 from lane 11 to 16 is: 4 μM, 20 μM, 40 μM, 80 μM, 120 μM, and 160 μM, respectively.
26
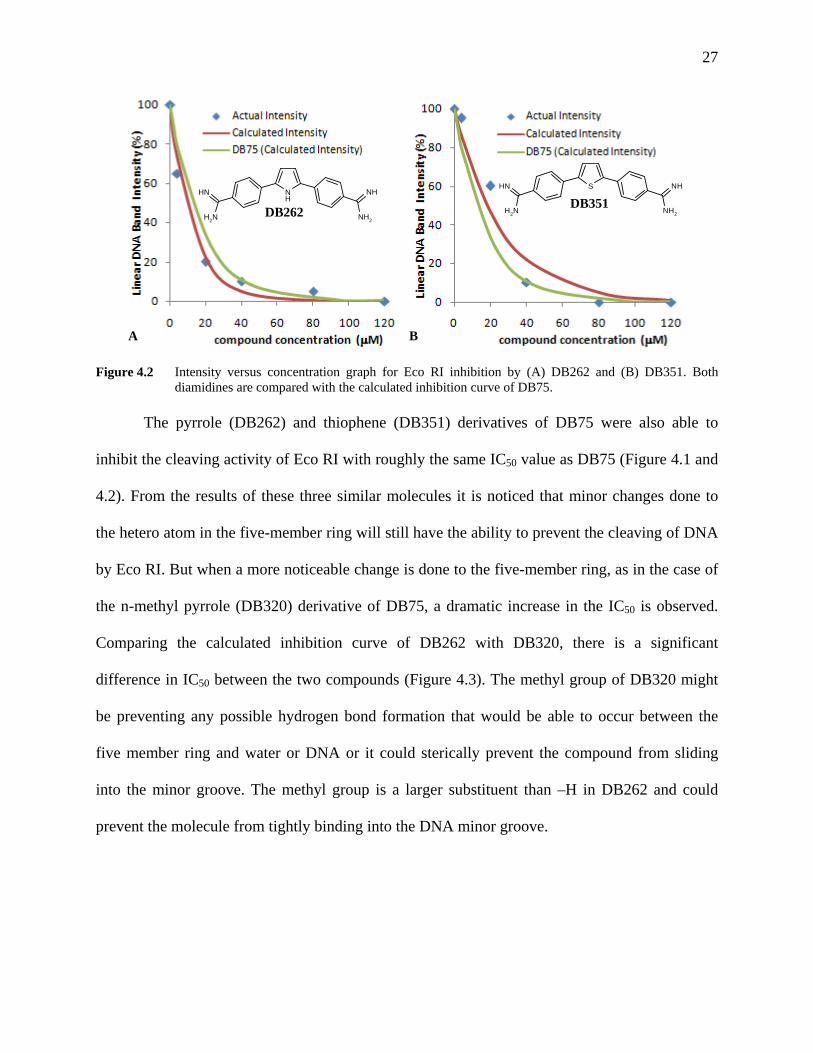
Figure 4.2 Intensity versus concentration graph for Eco RI inhibition by (A) DB262
and (B) DB351. Both diamidines are compared with the calculated inhibition curve of DB75.
27
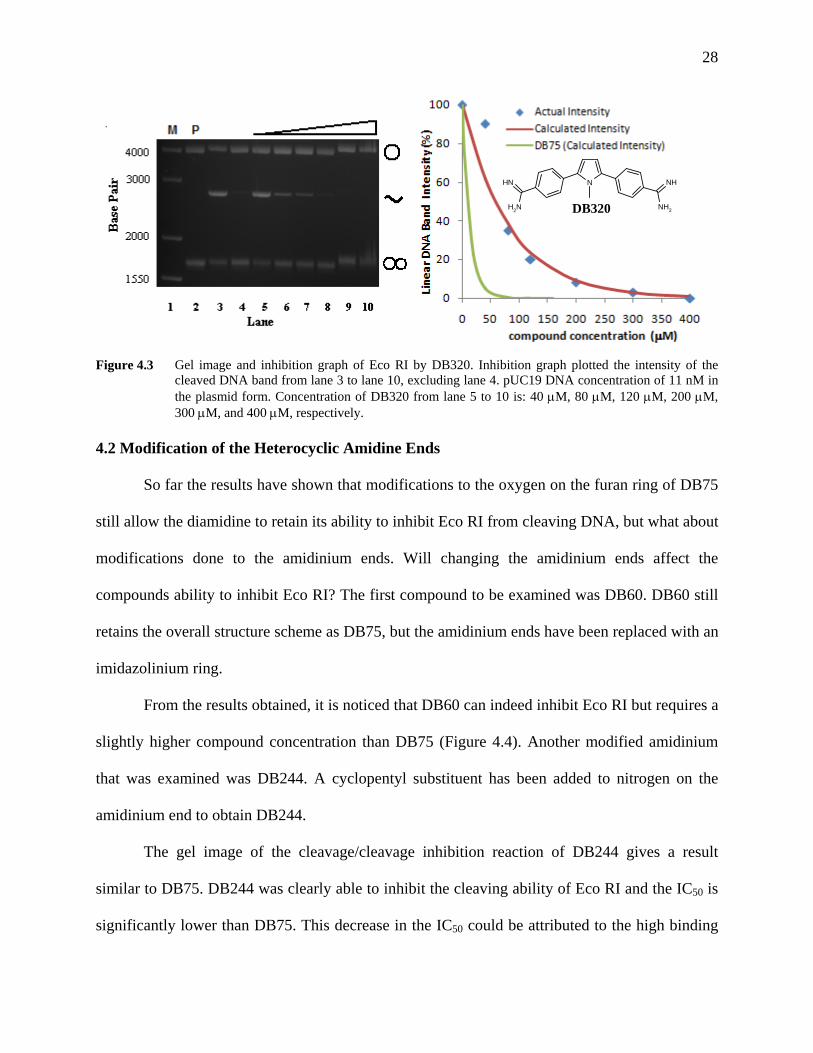
Figure 4.3 Gel image and inhibition graph of Eco RI by DB320. Inhibition graph
plotted the intensity of the cleaved DNA band from lane 3 to lane 10, excluding lane 4. pUC19 DNA concentration of 11 nM in the plasmid form. Concentration of DB320 from lane 5 to 10 is: 40 μM, 80 μM, 120 μM, 200 μM, 300 μM, and 400 μM, respectively.
28

x
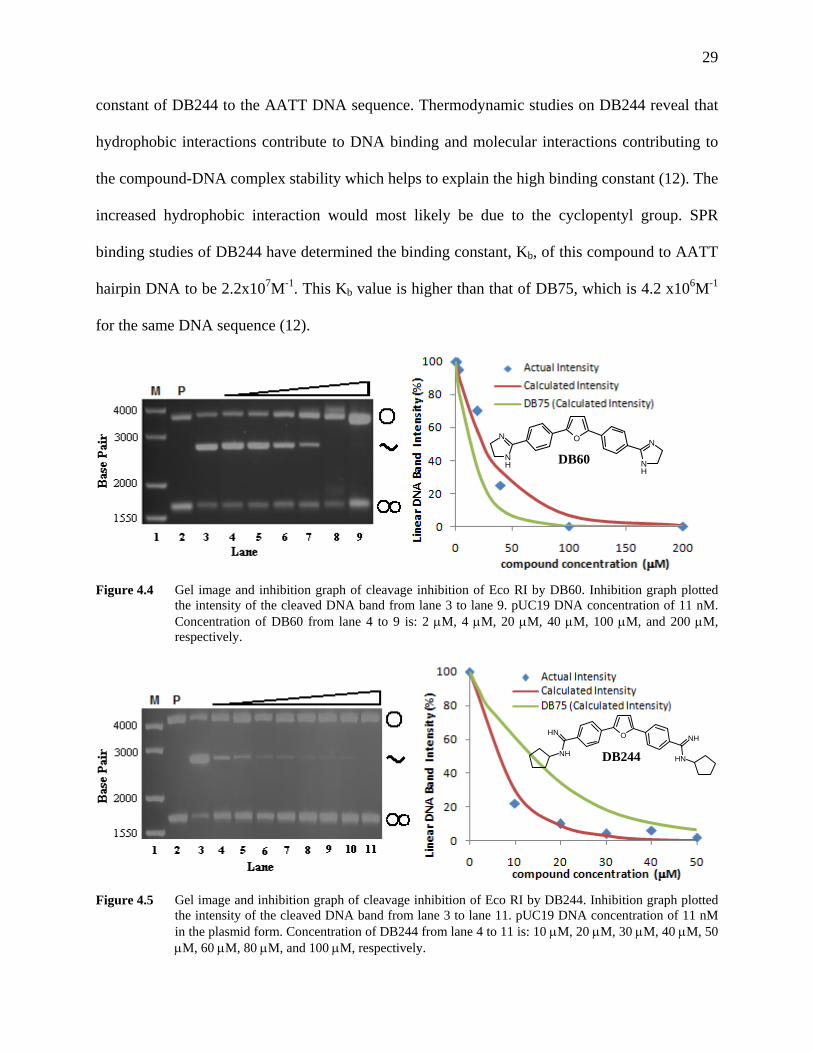
Figure 4.4 Gel image and inhibition graph of cleavage inhibition of Eco RI by DB60. Inhibition graph plotted the intensity of the cleaved DNA band from lane 3 to lane 9. pUC19 DNA concentration of 11 nM. Concentration of DB60 from lane 4 to 9 is: 2 μM, 4 μM, 20 μM, 40 μM, 100 μM, and 200 μM, respectively.
29
Figure 4.5 Gel image and inhibition graph of cleavage inhibition of Eco RI by
DB244. Inhibition graph plotted the intensity of the cleaved DNA band from lane 3 to lane 11. pUC19 DNA concentration of 11 nM in the plasmid form. Concentration of DB244 from lane 4 to 11 is: 10 μM, 20 μM, 30 μM, 40 μM, 50 μM, 60 μM, 80 μM, and 100 μM, respectively.
29
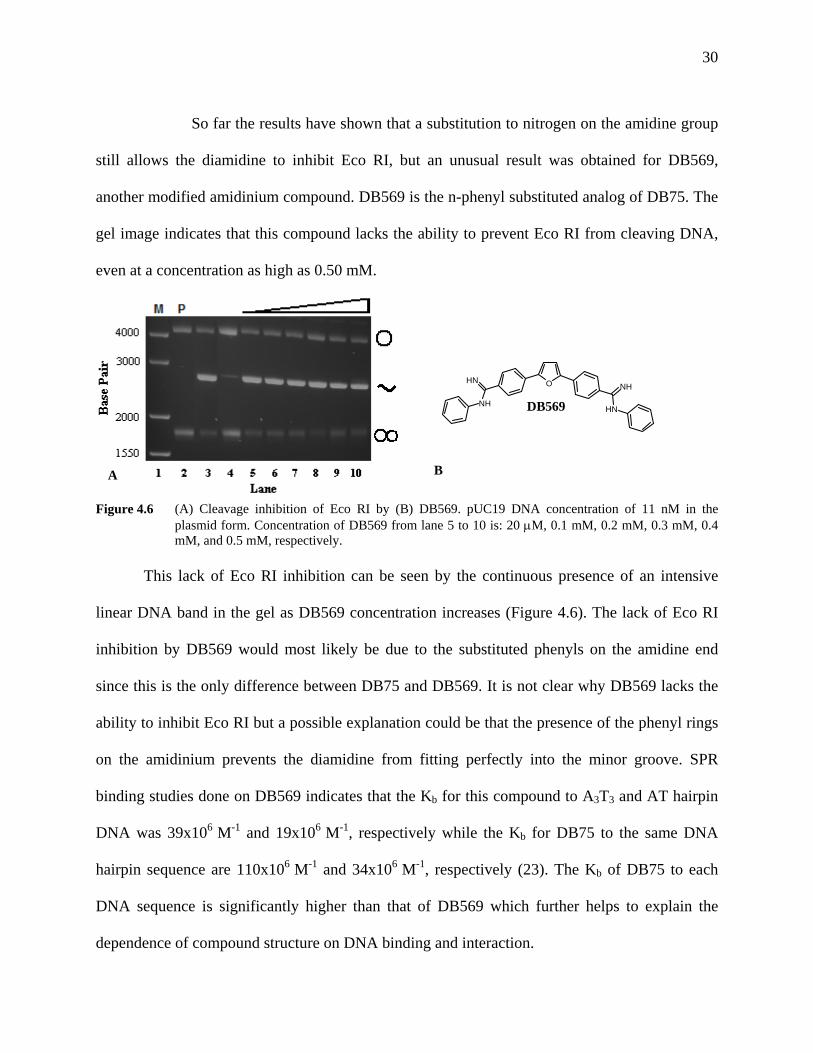
Figure 4.6 (A) Cleavage inhibition of Eco RI by (B) DB569. pUC19 DNA
concentration of 11 nM in the plasmid form. Concentration of DB569 from lane 5 to 10 is: 20 μM, 0.1 mM, 0.2 mM, 0.3 mM, 0.4 mM, and 0.5 mM, respectively.
30
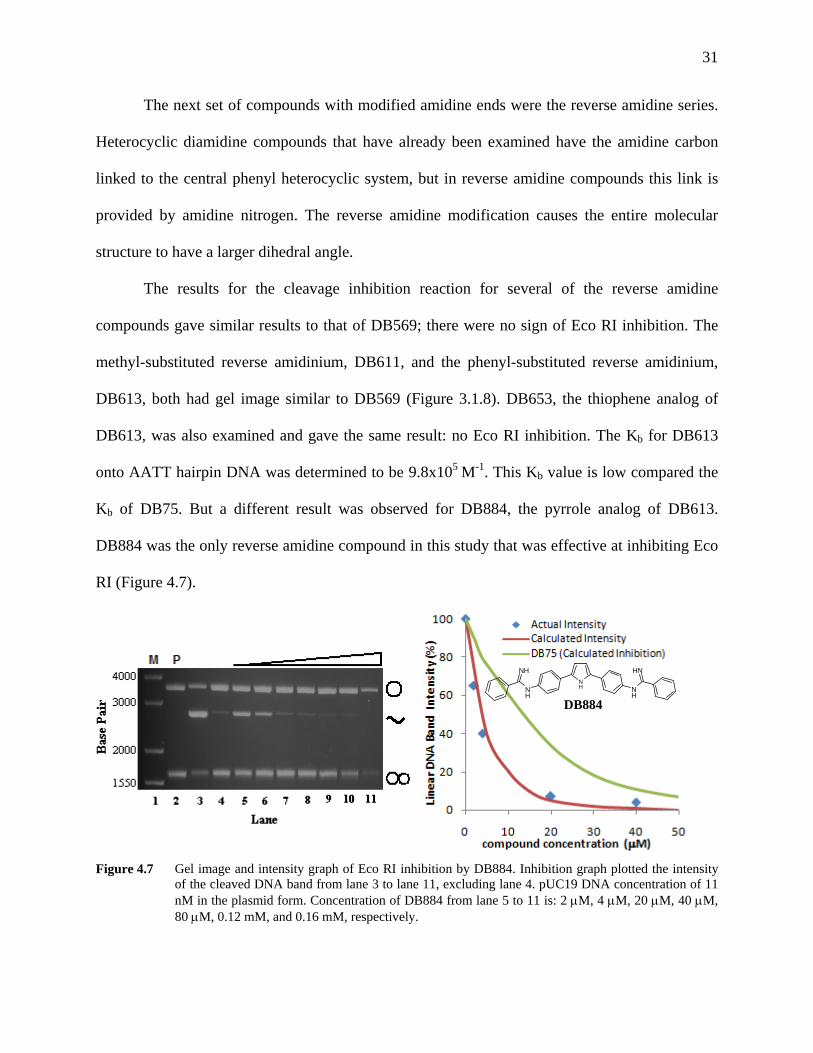
Figure 4.7 Gel image and intensity graph of Eco RI inhibition by DB884. Inhibition
graph plotted the intensity of the cleaved DNA band from lane 3 to lane 11, excluding lane 4. pUC19 DNA concentration of 11nM in the plasmid form. Concentration of DB884 from lane 5 to 11 is: 2 μM, 4 μM, 20 μM, 40 μM, 80 μM, 0.12 mM, and 0.16 mM, respectively.
31
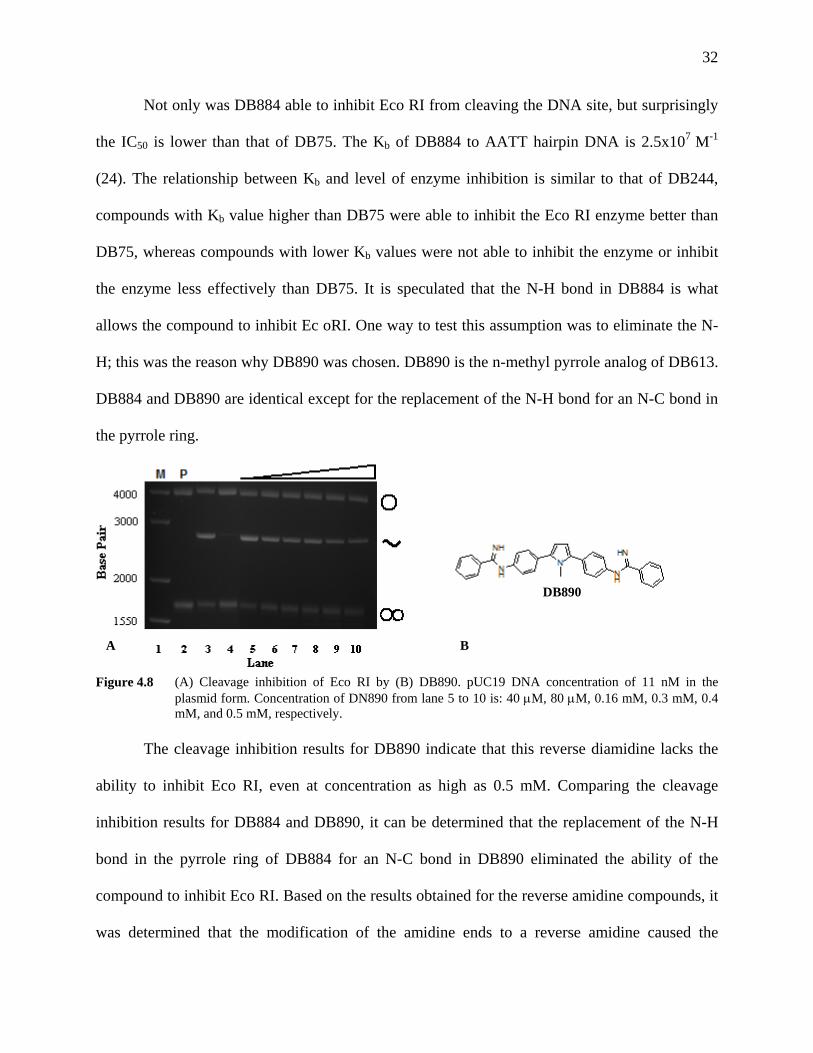
Figure 4.8 (A) Cleavage inhibition of Eco RI by (B) DB890. pUC19 DNA
concentration of 11nM in the plasmid form. Concentration of DN890 from lane 5 to 10 is: 40μM, 80μM, 0.16mM, 0.3mM, 0.4mM, and 0.5mM, respectively.
32
Figure 4.9 Gel and graph of Eco RI inhibition by DB185. Inhibition graph plotted
the intensity of the cleaved DNA band from lane 3 to lane 9. pUC19 DNA concentration of 11 nM in the plasmid form. Concentration of DB185 from lane 4 to 9 is: 0.2 μM, 0.4 μM, 0.8 μM, 2.0 μM, 3.0 μM, and 4.0 μM, respectively.
33
Figure 4.10 Gel and graph of Eco RI inhibition by DB818. Inhibition graph plotted
the intensity of the cleaved DNA band from lane 3 to lane 6. pUC19 DNA concentration of 11 nM in the plasmid form. Concentration of DB818 from lane 4 to 6 is: 4 μM, 20 μM, and 40 μM, respectively.
34
Figure 4.11 Cleavage inhibition of Eco RI by (A) netropsin and (B) pentamidine.
Netropsin concentration of 10 μM (lane 5) up to 40 μM (lane 8). Pentamidine concentration from 0.1 mM (lane 4) to 0.5 mM (lane 8). pUC19 DNA concentration of 11 nM in the plasmid form.
35

xi
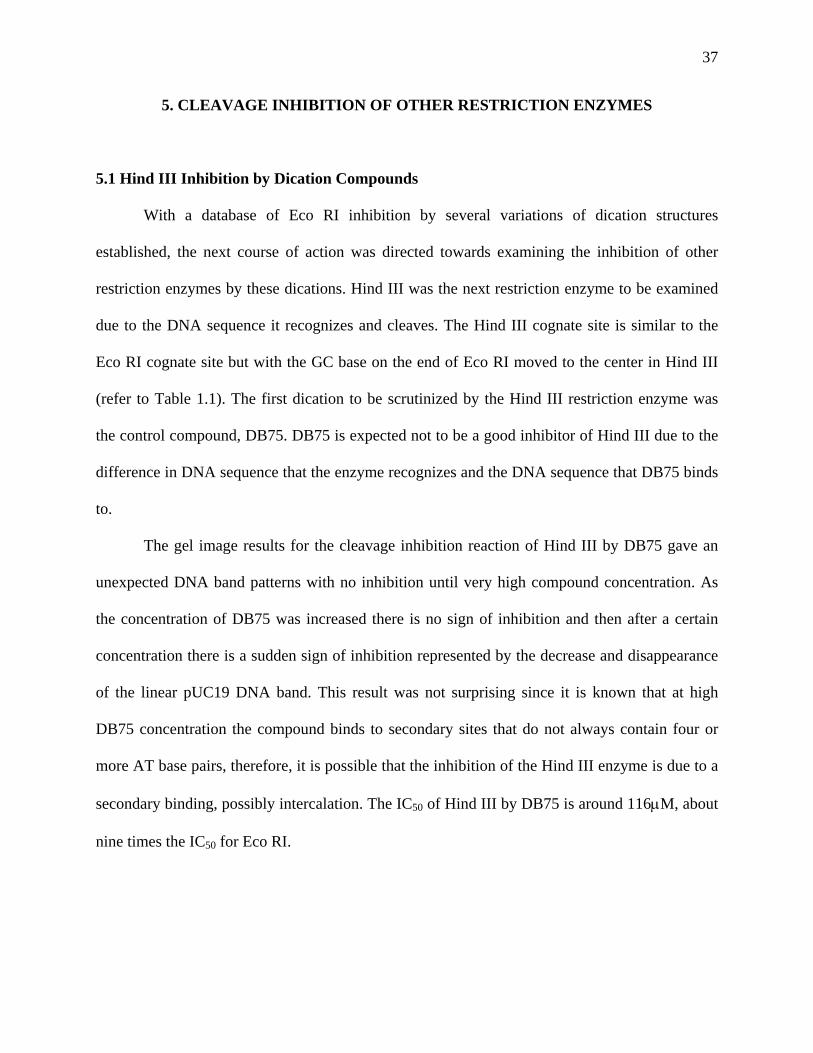
Figure 5.1 Cleavage inhibition of (A) Eco RI and (B) Hind III restriction enzyme by DB75. pUC19 DNA concentration of 11 nM (plasmid form). (A) Concentration of DB75 from lane 4 to 9 is: 10 μM, 20 μM, 40 μM, 60 μM, 80 μM, and 0.1 mM, respectively. (B) Concentration of DB75 from lane 11 to 16 is: 40 μM, 80 μM, 0.12 mM, 0.16 mM, 0.20 mM, and 0.24 mM, respectively.
38
Figure 5.2 Intensity versus concentration graph of cleavage inhibition of (A) Eco RI
and (B) Hind III by DB75. 38
Figure 5.3 Cleavage inhibition of Hind III by DB244. pUC19 DNA concentration
of 11 nM (plasmid form). Concentration of DB244 from lane 4 to 11 is: 10 μM, 20 μM, 30 μM, 40 μM, 60 μM, 80 μM, 0.1 mM, and 0.12 mM, respectively.
38
Figure 5.4 Gel and graph of Hind III inhibition by DB884. Inhibition graph plotted
the intensity of the cleaved DNA band from lane 3 to lane 11. pUC19 DNA concentration of 11 nM (plasmid form). Concentration of DB884 from lane 4 to 11 is: 10 μM, 20 μM, 30 μM, 40 μM, 50 μM, 60 μM, 80 μM, and 100 μM, respectively.
39
Figure 5.5 Inhibition of Hind III by (A) netropsin and (B) pentamidine. pUC19
DNA concentration of 11 nM (plasmid form). (A) Concentration of netropsin from lane 4 to 8 is: 20 μM, 40 μM, 80 μM, 0.12 mM, and 0.16 mM, respectively. (B) Concentration of pentamidine from lane 4 to 9 is: 0.1 mM, 0.2 mM, 0.3 mM, 0.4 mM, 0.5 mM, and 0.6 mM, respectively.
40
Figure 5.6 Gel and graph of Sma I inhibition by DB75. Inhibition graph plotted the
intensity of the cleaved DNA band from lane 3 to lane 11. pUC19 DNA concentration of 11 nM (plasmid form). Concentration of DB75 from lane 4 to 11 is: 10 μM, 20 μM, 40 μM, 60 μM, 80 μM, 0.10 mM, 0.12 mM, and 0.16 mM, respectively.
41
Figure 5.7 Gel and graph of Sma I inhibition by (A) DB244 and (B) DB262.
Inhibition graph plotted the intensity of the cleaved DNA band from lane 3 to lane 9 for DB244 and lane 10 to 16 for DB262. pUC19 DNA concentration of 11 nM (plasmid form). (A) Concentration of DB244 from lane 4 to 9 is: 80 μM, 0.12 mM, 0.16 mM, 0.20 mM, 0.24 mM, and 0.28 mM, respectively. (B) Concentration of DB262 from lane 11 to 16 is: 10 μM, 20 μM, 40 μM, 60 μM, 80 μM, 0.12 mM, respectively.
42
Figure 5.8 Cleavage inhibition of Sma I by DB884. pUC19 DNA concentration of
11 nM (plasmid form). Concentration of DB884 from lane 3 to 9 is: 10 μM, 20 μM, 30 μM, 40 μM, 50 μM, and 60 μM, respectively.
43

xii
Figure 5.9 Cleavage inhibition of Sma I by DB185, netropsin, and pentamidine. pUC19 DNA concentration of 11 nM (plasmid form). Concentration of DB185 from lane 3 to 7 is: 1 μM, 2 μM, 3 μM, 4 μM, and 5 μM, respectively. Concentration of netropsin in lane 10 and 11 is: 20 μM and 0.20 mM. Concentration of pentamidine in lane 12 and 13 is: 20 μM and 0.20 mM.
44
Figure 5.10 Sma I cognate DNA site and flanking sequence with Kpn I and Bam HI
cognate DNA site (highlighted in red). 45
Figure 5.11 Cleavage inhibition of (A) Kpn I and (B) Bam HI by DB75. pUC19
DNA concentration of 11 nM (plasmid form). (A) Concentration of DB75 from lane 4 to 9 is: 20 μM, 40 μM, 60 μM, 80 μM, 0.12 mM, and 0.16 mM, respectively. (B) Concentration of DB75 from lane 13 to 18 is: 20 μM, 40 μM, 60 μM, 80 μM, 0.12 mM, and 0.16 mM, respectively.
45
Figure 5.12 Inhibition graph of (A) Kpn I and (B) Bam HI by DB75. 46 Figure 5.13 Cleavage of pUC19 DNA by (A) Eco RI and (B) Ssp I followed by Eco
RI. pUC19 DNA concentration of 11 nM (plasmid form). Triangular bar above gel image represent progression of time. Eco RI was halted from further DNA cleavage at: 0 min., 15 min., 30 min., 45 min., and 60 min. which correspond to lane 3 to 6 and 8 to 12.
47
Figure 5.14 Cleavage inhibition of Eco RI by DB75 after pUC19 linearization by Ssp
I. Reactions were incubated for 45 minutes. pUC19 concentration of 11 nM (plasmid form). Concentration of DB75 from lane 4 to 9 is: 0 μM, 20μM, 40 μM, 60 μM, 80 μM, and 0.12 mM, respectively.
48
Figure 5.15 Cleavage of pUC19 DNA by (A) Sma I and (B) Ssp I followed by Sma I.
pUC19 DNA concentration of 11 nM (plasmid form). Triangular bar above gel image represent progression of time. Sma I was halted from further DNA cleavage at: 0 min., 15 min., 30 min., 45 min., and 60 min. which correspond to lane 2 to 6 and 7 to 11.
48
Figure 5.16 Cleavage inhibition of Sma I by DB75 after pUC19 linearization by Ssp
I. Reactions were incubated for 45 minutes. pUC19 concentration of 11 nM. Concentration of DB75 from lane 4 to 11 is: 0 μM, 10 μM, 20 μM, 30 μM, 40 μM, 50 μM, 60 μM, and 80 μM, respectively.
49
Figure 5.17 Cleavage inhibition of Nar I by DB75. pUC19 DNA concentration of 11
nM (plasmid form). Concentration of DB884 from lane 3 to 9 is: 0 μM, 10 μM, 20 μM, 30 μM, 40 μM, 50 μM, and 60 μM, respectively.
50
xiii
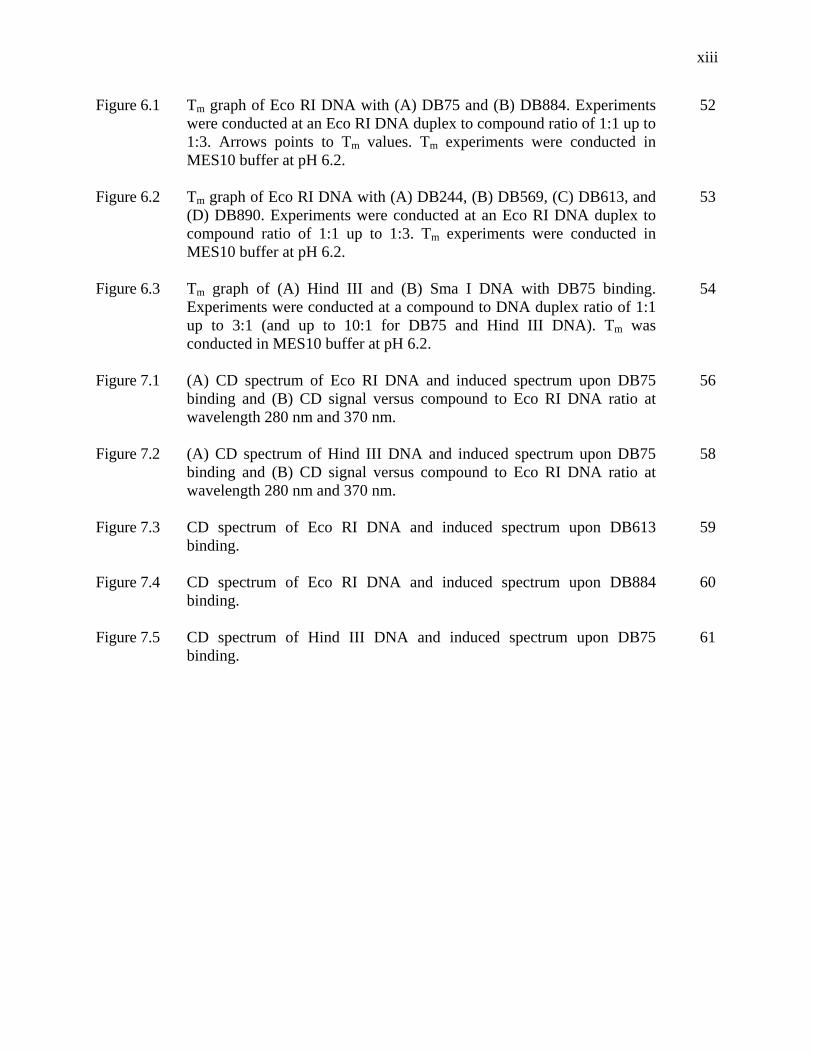
Figure 6.1 Tm graph of Eco RI DNA with (A) DB75 and (B) DB884. Experiments were conducted at an Eco RI DNA duplex to compound ratio of 1:1 up to 1:3. Arrows points to Tm values. Tm experiments were conducted in MES10 buffer at pH 6.2.
52
Figure 6.2 Tm graph of Eco RI DNA with (A) DB244, (B) DB569, (C) DB613, and
(D) DB890. Experiments were conducted at an Eco RI DNA duplex to compound ratio of 1:1 up to 1:3. Tm experiments were conducted in MES10 buffer at pH 6.2.
53
Figure 6.3 Tm graph of (A) Hind III and (B) Sma I DNA with DB75 binding.
Experiments were conducted at a compound to DNA duplex ratio of 1:1 up to 3:1 (and up to 10:1 for DB75 and Hind III DNA). Tm was conducted in MES10 buffer at pH 6.2.
54
Figure 7.1 (A) CD spectrum of Eco RI DNA and induced spectrum upon DB75
binding and (B) CD signal versus compound to Eco RI DNA ratio at wavelength 280 nm and 370 nm.
56
Figure 7.2 (A) CD spectrum of Hind III DNA and induced spectrum upon DB75
binding and (B) CD signal versus compound to Eco RI DNA ratio at wavelength 280 nm and 370 nm.
58
Figure 7.3 CD spectrum of Eco RI DNA and induced spectrum upon DB613
binding. 59
Figure 7.4 CD spectrum of Eco RI DNA and induced spectrum upon DB884
binding. 60
Figure 7.5 CD spectrum of Hind III DNA and induced spectrum upon DB75
binding. 61
xiv
LIST OF ABBREVIATIONS A Adenine
ATP Adenosine triphosphate
C Cytosine
CD Circular dichroism
DNA Deoxyribonucleic acid
G Guanine
IC50 50% Inhibitory concentration
Kb Binding constant
RNA Ribosenucleic acid
T Thymine
Tm Thermal melting
1
1. INTRODUCTION
1.1 African Sleeping Sickness and Common Therapeutic Treatments
African trypanosomiasis, also known as African sleeping sickness, is a fatal parasitic
disease if left untreated. It is caused by protozoa from the genus Trypanosoma and transmitted to
humans and animals by the tsetse fly. Symptoms of the early stage of the disease, known as the
haemolymphatic phase, include fever, headaches, and joint pains that can spread to include
diseases and disorders affecting the heart, kidneys, endocrine system, and other organs. The
second stage of the disease, known as the neurological phase, occurs when the parasite has
crossed over the blood-brain barrier causing progressive and irreversible damage to the central
nervous system with signs of confusion, sensory disturbances, and disrupted sleeping cycles
which will ultimately result in death if left untreated (1). This disease affects mostly the Sub-
Saharan African region enveloping thirty-six countries, putting sixty million people at risk (2).
Current standard medical treatments for the disease that are available are pentamidine, which is
commonly used for treating the early stage of the disease, and melarsoprol, used during the later
stage of the disease.
O O
NH
NH2 NH2
NH
NH
N
NN
NH2
NH2
AsS
S
OH
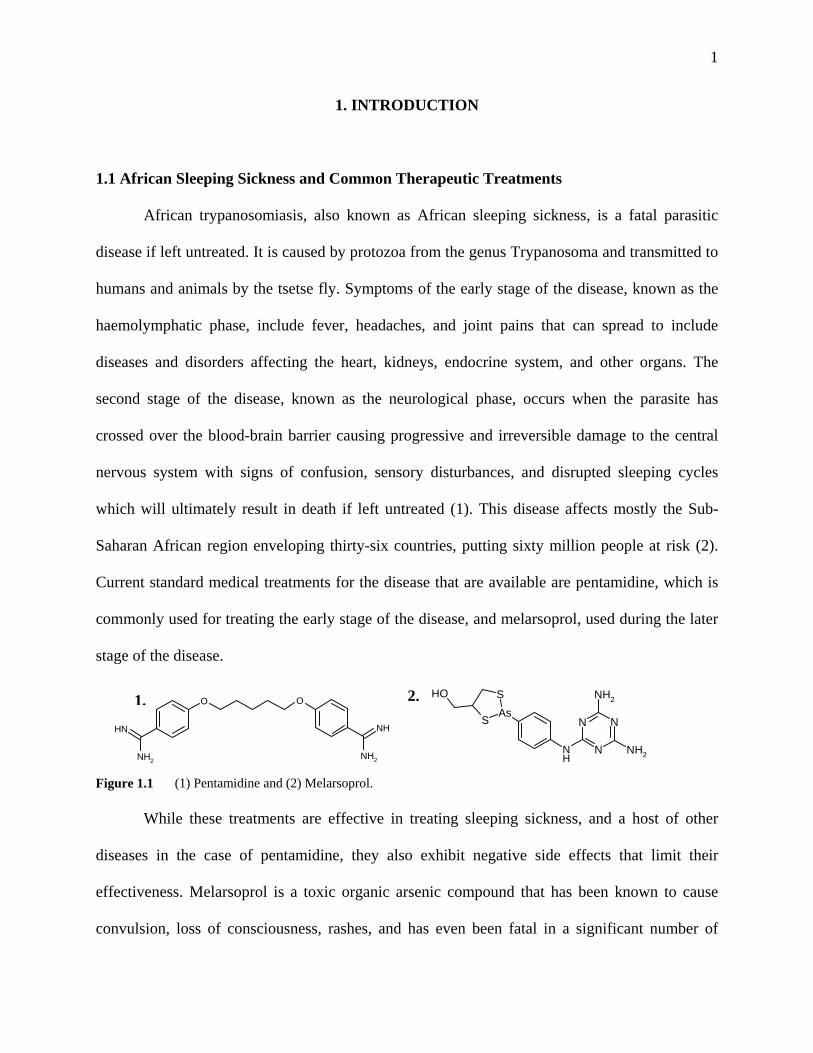
Figure 1.1 (1) Pentamidine and (2) Melarsoprol.
While these treatments are effective in treating sleeping sickness, and a host of other
diseases in the case of pentamidine, they also exhibit negative side effects that limit their
effectiveness. Melarsoprol is a toxic organic arsenic compound that has been known to cause
convulsion, loss of consciousness, rashes, and has even been fatal in a significant number of
1. 2.

2
cases. The number of failed treatments with use of melarsoprol is also high, with a 30% failure
rate in some areas of central Africa (1, 3). The negative side effects of pentamidine are broader
than that of melarsoprol, affecting many organs and blood content with varying severity (1, 4).
There are also problems associated with parasites that have developed resistance to these forms
of treatment rendering the compounds ineffective (5).
1.2 Heterocyclic Diamidines (Dications)
Due to the limitations of common drugs being used to treat sleeping sickness, new drugs
were developed with the aim to minimize or even to eliminate the negative effects of the drugs
on patients receiving treatment. A class of compounds currently under study for their
effectiveness against sleeping sickness is heterocyclic diamidines. Many heterocyclic diamidines
have the phenyl amidinium ends similar to pentamidine but the central structure that holds the
two phenyl amidinium ends together is one or more aromatic heterocyclic group that forms a
more rigid molecule. The crescent structure of these heterocyclic diamidines closely mimics the
curvature of DNA which allows for specificity for binding to DNA.
The majority of compounds studied in this research are heterocyclic diamidines
synthesized by Dr. David Boykin and coworkers at Georgia State University. These heterocyclic
diamidines have proved to be effective in recognizing DNA sequences as well as having
antimicrobial activities (6). One of these compounds is pafuramidine, DB289, which is the
prodrug of DB75, was in clinical trials until tests were halted in February 2008 due to unrelated
side effects. For the treatment of sleeping sickness, DB289 shows minimal toxicity on patients
(3, 7). DB75 and other DB compounds that adhere to a structural scheme similar to pentamidine
are effective against sleeping sickness due to their high affinity to the kinetoplast DNA (kDNA),
the mitochondrial DNA of the trypanosome protozoa (3).
3
It is not fully understood how the dications are effective against sleeping sickness, but it
is speculated that part of their activity involves the compound’s affinity for the kinetoplast DNA.
One possible mechanism could be that the compound binds to a DNA sequence that is needed for
energy production and with the compound blocking that essential DNA sequence, energy can’t
be liberated and the parasite dies. Another theory may involve changes to the kDNA
conformation. With the compound bound to the DNA, it could disrupt the conformation of the
DNA and prevent topologically sensitive proteins from recognizing the DNA (3). But with
limited understanding of this antiparasitic mechanism, further research is necessary.
1.3 Dications and DNA Interactions
Inspection of the kDNA minicircle sequence shows that they contain a high composition
of AT bases (8). Studies investigating the interaction of DB75 and similar dication compounds
with DNA show that these dications binds to the minor groove of DNA containing AT sequences
of four or more base pairs with high preference for an AATT and other similar minor groove
sequences (9). This property of dications gives these compounds their high affinity for the
kinetoplast DNA. Probing further into the relationship between DB75 and DNA shows that
DB75 causes minimal structural change to DNA upon binding. But the complex formed between
DNA and DB75 does offer more stability to the DNA duplex which can be attributed to
electrostatic, van der Waals, and hydrogen bonding. Hydrogen bonds are formed between the
two amidinium groups of DB75 and bases in DNA. Van der Waals interactions also exist
between the furan ring and the top and bottom walls of the minor groove. The cationic
amidinium ends also form hydrogen bonds with water molecules which mediate electrostatic
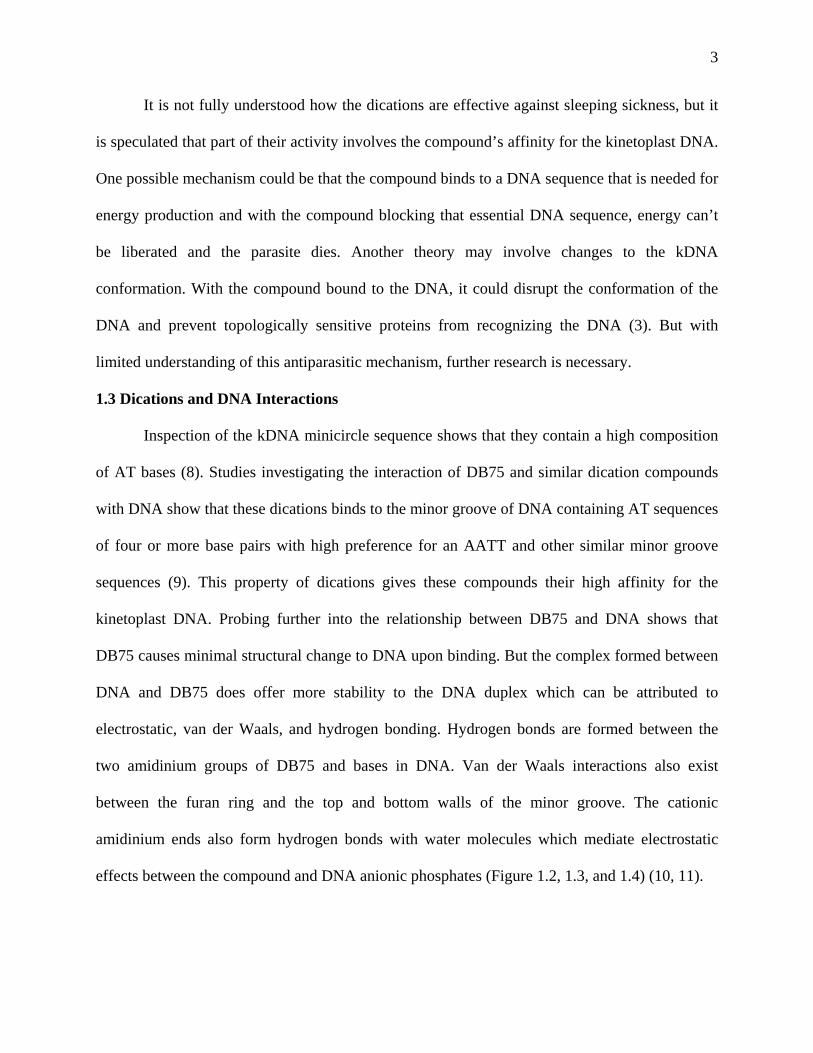
effects between the compound and DNA anionic phosphates (Figure 1.2, 1.3, and 1.4) (10, 11).
4
Figure 1.2 (A) Space-filling representation of crystal structure and (B) schematic of DB75-DNA complex.
Crystal structure shows DB75 molecule in green bound to DNA helix. Schematic shows DB75 forming hydrogen bonds (dashed lines) with water and DNA bases. Hydrogen bond units are in angstroms (12).
The crystal structure representation of the DB75-DNA complex (Figure 1.2, A) shows
that DB75 fits into the minor groove of an AATT DNA sequence of a d(CGCGAATTCGCG)2
duplex. The schematic for the complex (Figure 1.2, B) shows an extensive hydrogen bonding
network between the compound and bases and water. There are three direct hydrogen bonds
formed between the amidinium groups with DNA. One amidinium group forms a hydrogen bond
to an oxygen in thymine and another to an oxygen in a ribose ring on one DNA strand. The other
amidinium group also forms hydrogen bonds with an oxygen in thymine but on the
complementary DNA strand. The schematic also shows several indirect interactions between
A B
5
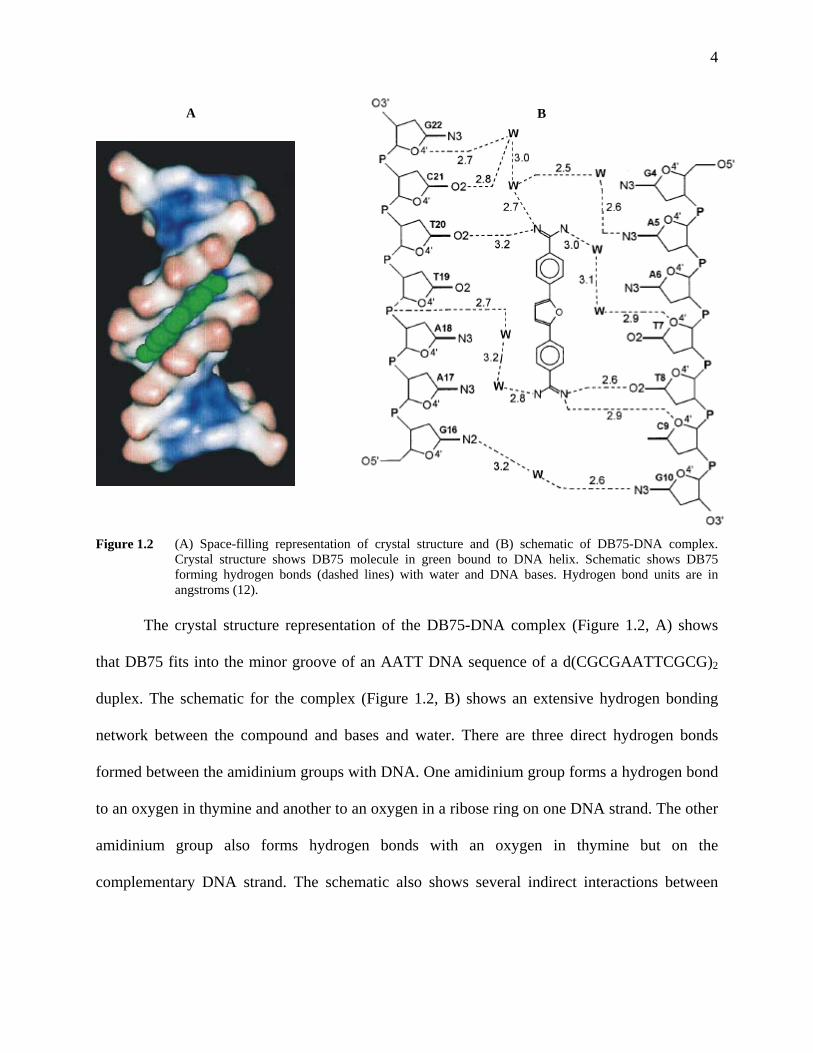
DB75 and DNA that are mediated through hydrogen bonds with water. Crystal structures of
other heterocyclic diamidines and DNA complexes reveal similar binding pattern (11, 12).
Figure 1.3 DNA Structure showing hydrogen bonds between DNA and water (11).
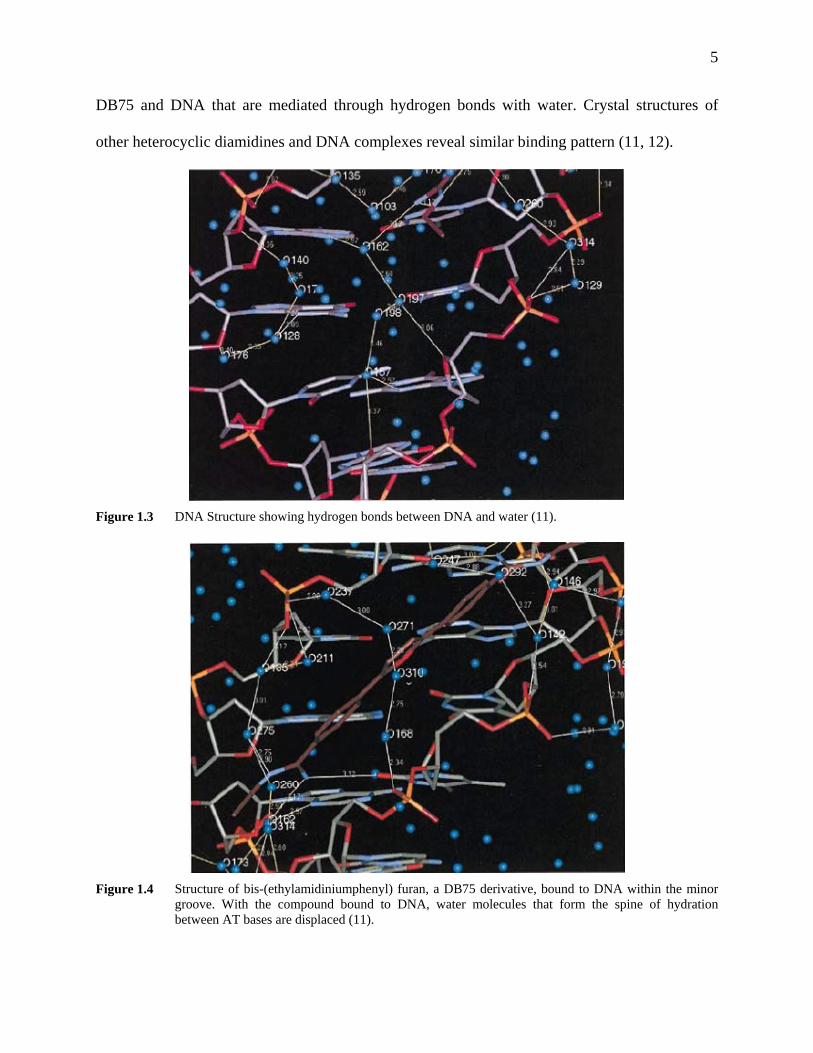
Figure 1.4 Structure of bis-(ethylamidiniumphenyl) furan, a DB75 derivative, bound to DNA within the minor
groove. With the compound bound to DNA, water molecules that form the spine of hydration between AT bases are displaced (11).
6
Although extensive knowledge exists that explains the interaction of heterocyclic
diamidines with DNA, there is still more work to be done in order to better understand how
variation in compound structure and DNA sequence can improve antitrypanosome activity along
with providing further understanding to the mechanism of this antitrypanosome activity.
1.4 Thesis Question and Type II Restriction Enzymes
The question being addressed in this thesis is that if heterocyclic diamidines binds to the
minor groove of DNA, will these compounds have the ability to prevent the activity of proteins
that bind to the major groove given that the compound and protein are specific for the same
DNA sequence? Furthermore, if these compounds can inhibit the activity of proteins, what
implication does this have for the mechanism of antiparasitic action?
The proteins that are of particular interests are type II restriction enzymes. Type II
restriction enzymes are a class of endonuclease that cleave a specific sequence of DNA, usually a
palindromic sequence of four to eight base pairs by forming specific and nonspecific interactions
with the DNA on the major groove side. While there are three different classes of restriction
enzymes, the advantages that type II restriction enzymes have over the other two classes is that
they do not require the presence of ATP to operate and are highly selective for a specific
sequence (13). These enzymes are also well characterized and commercially available. Type II
restriction enzymes can bind to the recognition site, but in order to cleave DNA magnesium
(Mg2+) is required. Crystal studies have been done on Eco RV with an oligonucleotide
containing the recognition sequence in the absences of Mg2+. The crystal shows that the enzyme
was bound to DNA, but no cleavage was observed due to the lack of the metal. Once magnesium
was added to the reaction DNA cleavage was observed (14).
7
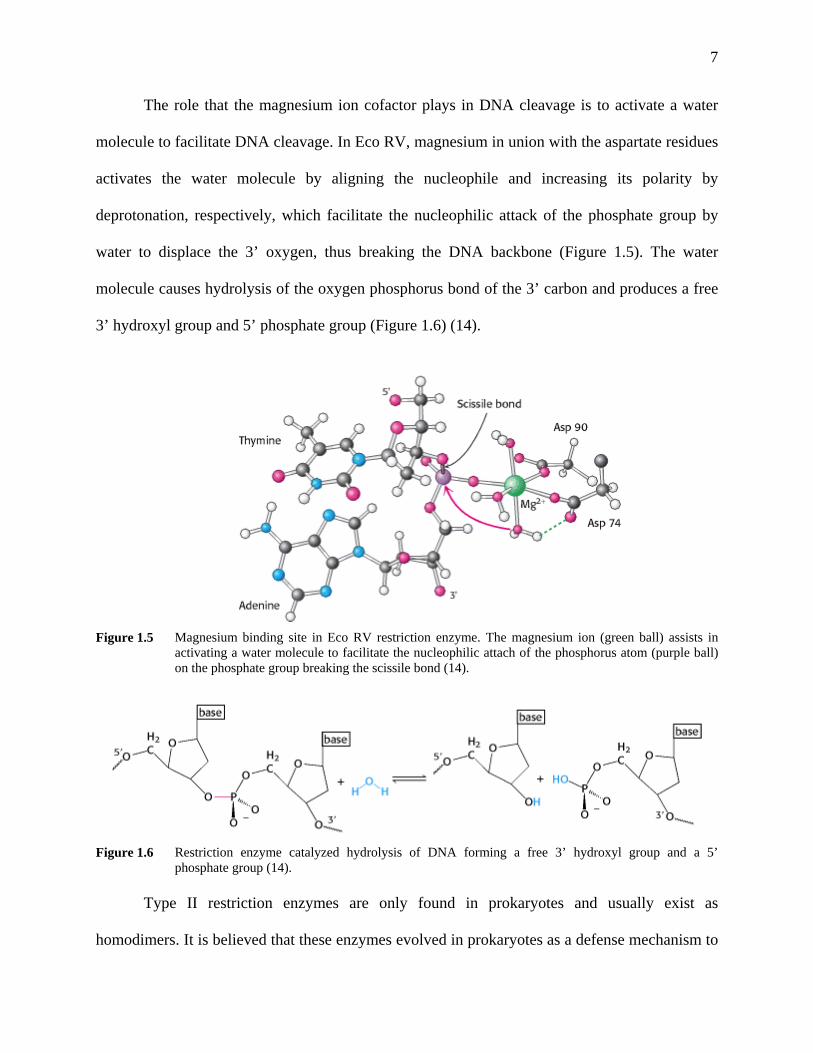
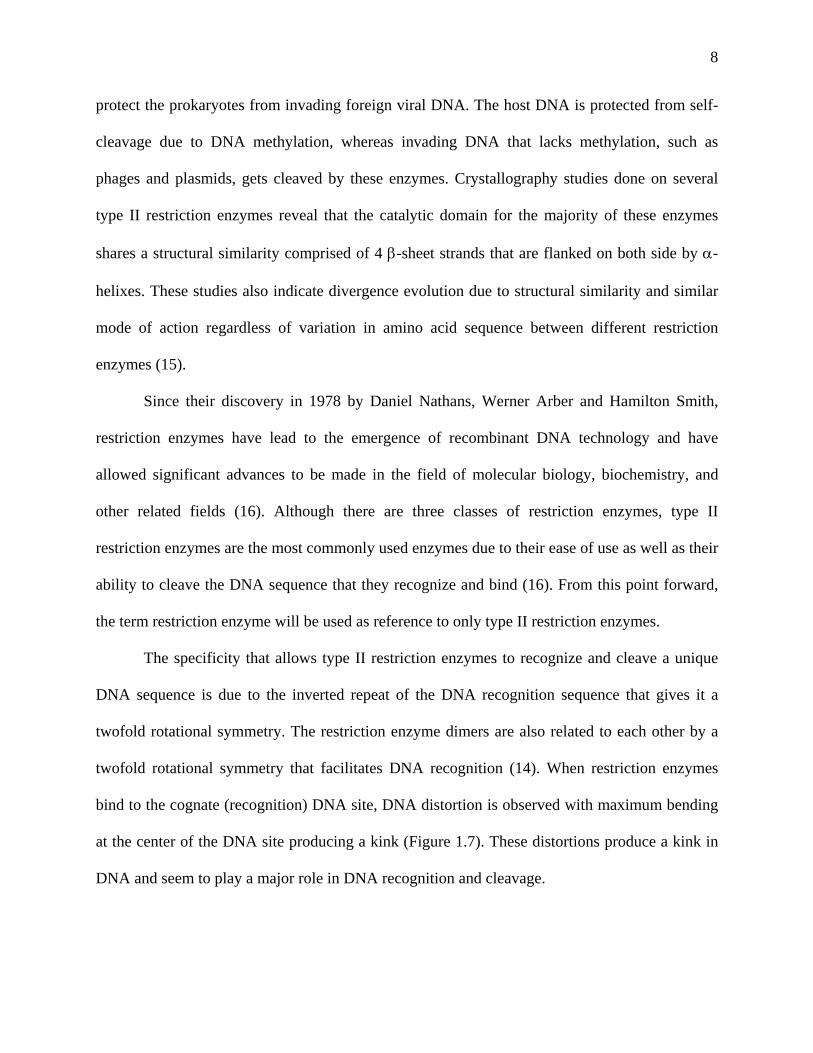
The role that the magnesium ion cofactor plays in DNA cleavage is to activate a water
molecule to facilitate DNA cleavage. In Eco RV, magnesium in union with the aspartate residues
activates the water molecule by aligning the nucleophile and increasing its polarity by
deprotonation, respectively, which facilitate the nucleophilic attack of the phosphate group by
water to displace the 3’ oxygen, thus breaking the DNA backbone (Figure 1.5). The water
molecule causes hydrolysis of the oxygen phosphorus bond of the 3’ carbon and produces a free
3’ hydroxyl group and 5’ phosphate group (Figure 1.6) (14).
Figure 1.5 Magnesium binding site in Eco RV restriction enzyme. The magnesium ion (green ball) assists in
activating a water molecule to facilitate the nucleophilic attach of the phosphorus atom (purple ball) on the phosphate group breaking the scissile bond (14).
Figure 1.6 Restriction enzyme catalyzed hydrolysis of DNA forming a free 3’ hydroxyl group and a 5’
phosphate group (14).
Type II restriction enzymes are only found in prokaryotes and usually exist as
homodimers. It is believed that these enzymes evolved in prokaryotes as a defense mechanism to
8
protect the prokaryotes from invading foreign viral DNA. The host DNA is protected from self-
cleavage due to DNA methylation, whereas invading DNA that lacks methylation, such as
phages and plasmids, gets cleaved by these enzymes. Crystallography studies done on several
type II restriction enzymes reveal that the catalytic domain for the majority of these enzymes
shares a structural similarity comprised of 4 β-sheet strands that are flanked on both side by α-
helixes. These studies also indicate divergence evolution due to structural similarity and similar
mode of action regardless of variation in amino acid sequence between different restriction
enzymes (15).
Since their discovery in 1978 by Daniel Nathans, Werner Arber and Hamilton Smith,
restriction enzymes have lead to the emergence of recombinant DNA technology and have
allowed significant advances to be made in the field of molecular biology, biochemistry, and
other related fields (16). Although there are three classes of restriction enzymes, type II
restriction enzymes are the most commonly used enzymes due to their ease of use as well as their
ability to cleave the DNA sequence that they recognize and bind (16). From this point forward,
the term restriction enzyme will be used as reference to only type II restriction enzymes.
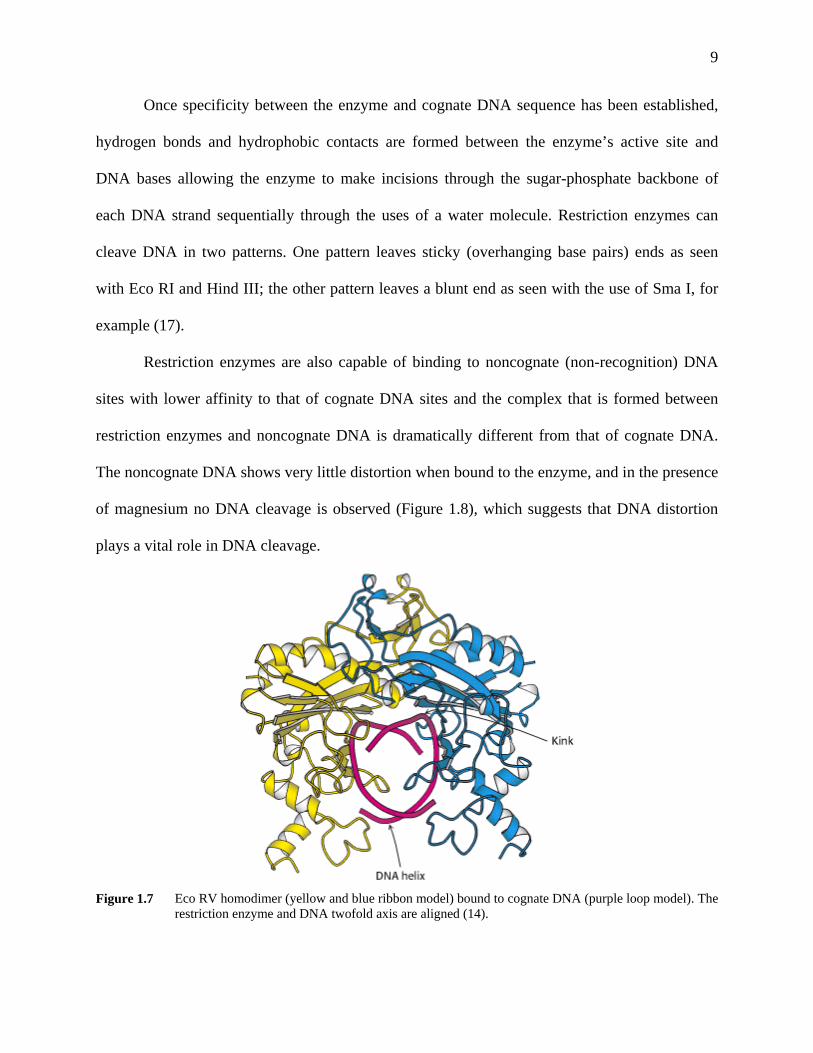
The specificity that allows type II restriction enzymes to recognize and cleave a unique
DNA sequence is due to the inverted repeat of the DNA recognition sequence that gives it a
twofold rotational symmetry. The restriction enzyme dimers are also related to each other by a
twofold rotational symmetry that facilitates DNA recognition (14). When restriction enzymes
bind to the cognate (recognition) DNA site, DNA distortion is observed with maximum bending
at the center of the DNA site producing a kink (Figure 1.7). These distortions produce a kink in
DNA and seem to play a major role in DNA recognition and cleavage.
9
Once specificity between the enzyme and cognate DNA sequence has been established,
hydrogen bonds and hydrophobic contacts are formed between the enzyme’s active site and
DNA bases allowing the enzyme to make incisions through the sugar-phosphate backbone of
each DNA strand sequentially through the uses of a water molecule. Restriction enzymes can
cleave DNA in two patterns. One pattern leaves sticky (overhanging base pairs) ends as seen
with Eco RI and Hind III; the other pattern leaves a blunt end as seen with the use of Sma I, for
example (17).
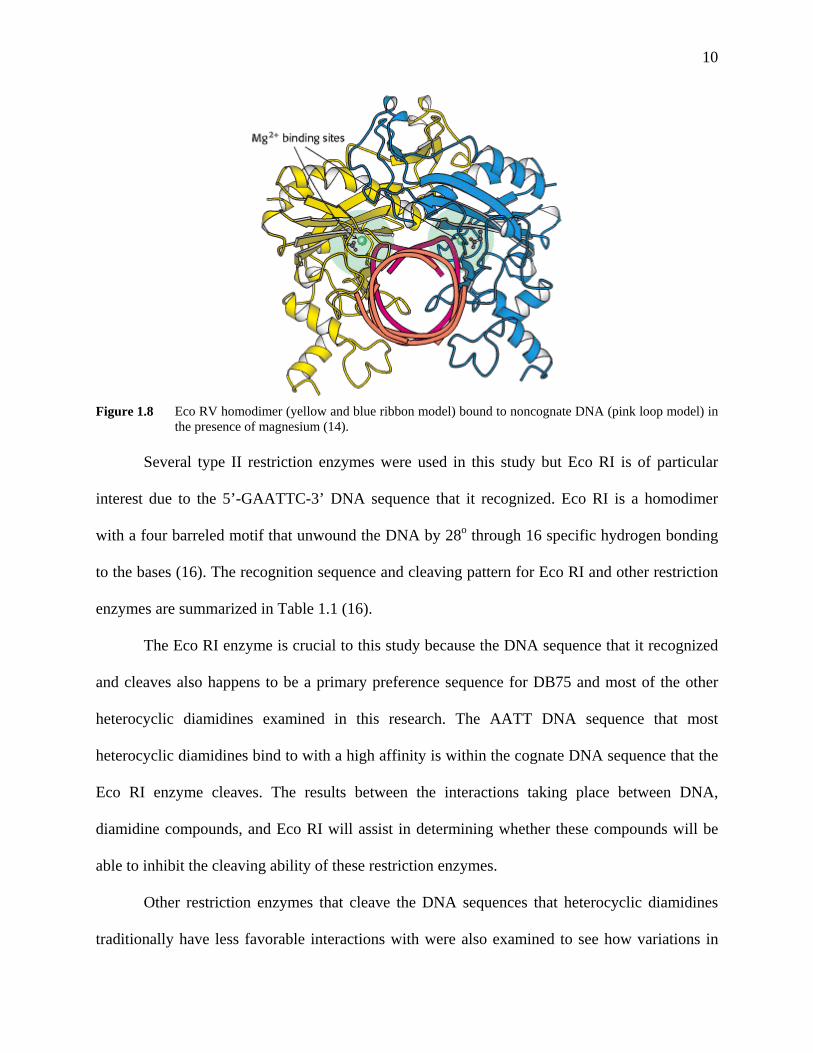
Restriction enzymes are also capable of binding to noncognate (non-recognition) DNA
sites with lower affinity to that of cognate DNA sites and the complex that is formed between
restriction enzymes and noncognate DNA is dramatically different from that of cognate DNA.
The noncognate DNA shows very little distortion when bound to the enzyme, and in the presence
of magnesium no DNA cleavage is observed (Figure 1.8), which suggests that DNA distortion
plays a vital role in DNA cleavage.
Figure 1.7 Eco RV homodimer (yellow and blue ribbon model) bound to cognate DNA (purple loop model). The
restriction enzyme and DNA twofold axis are aligned (14).
10
Figure 1.8 Eco RV homodimer (yellow and blue ribbon model) bound to noncognate DNA (pink loop model) in
the presence of magnesium (14).
Several type II restriction enzymes were used in this study but Eco RI is of particular
interest due to the 5’-GAATTC-3’ DNA sequence that it recognized. Eco RI is a homodimer
with a four barreled motif that unwound the DNA by 28o through 16 specific hydrogen bonding
to the bases (16). The recognition sequence and cleaving pattern for Eco RI and other restriction
enzymes are summarized in Table 1.1 (16).
The Eco RI enzyme is crucial to this study because the DNA sequence that it recognized
and cleaves also happens to be a primary preference sequence for DB75 and most of the other
heterocyclic diamidines examined in this research. The AATT DNA sequence that most
heterocyclic diamidines bind to with a high affinity is within the cognate DNA sequence that the
Eco RI enzyme cleaves. The results between the interactions taking place between DNA,
diamidine compounds, and Eco RI will assist in determining whether these compounds will be
able to inhibit the cleaving ability of these restriction enzymes.
Other restriction enzymes that cleave the DNA sequences that heterocyclic diamidines
traditionally have less favorable interactions with were also examined to see how variations in
11
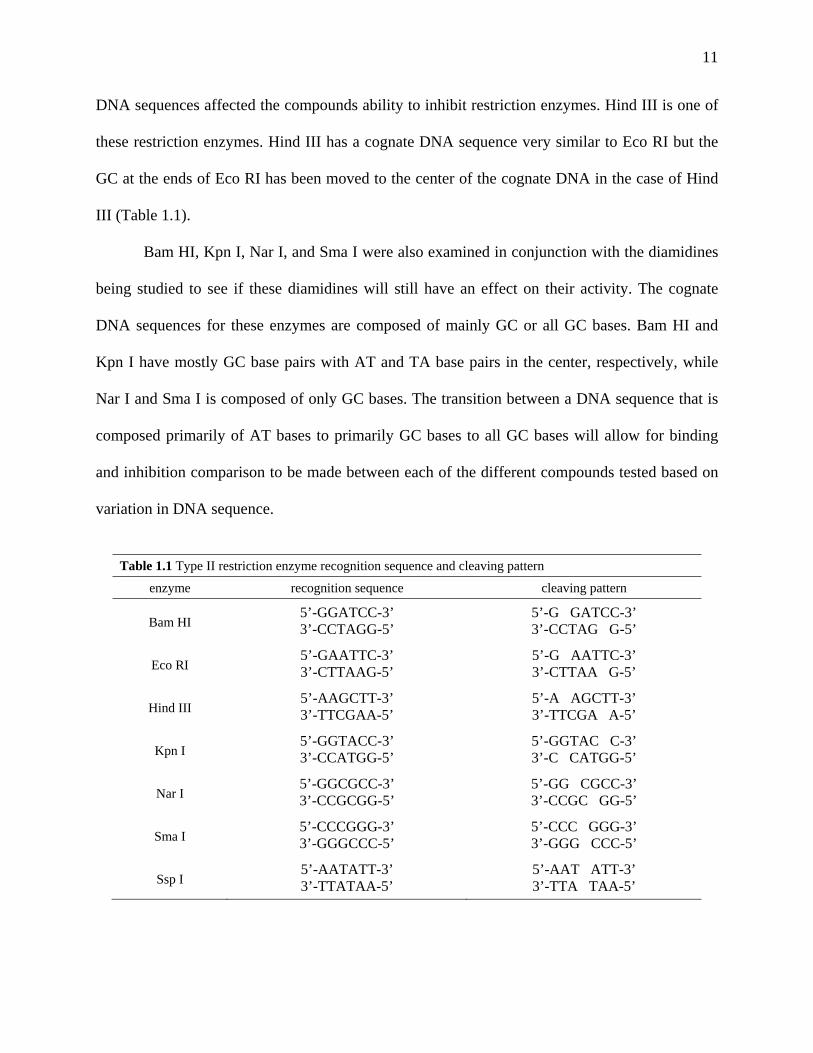
DNA sequences affected the compounds ability to inhibit restriction enzymes. Hind III is one of
these restriction enzymes. Hind III has a cognate DNA sequence very similar to Eco RI but the
GC at the ends of Eco RI has been moved to the center of the cognate DNA in the case of Hind
III (Table 1.1).
Bam HI, Kpn I, Nar I, and Sma I were also examined in conjunction with the diamidines
being studied to see if these diamidines will still have an effect on their activity. The cognate
DNA sequences for these enzymes are composed of mainly GC or all GC bases. Bam HI and
Kpn I have mostly GC base pairs with AT and TA base pairs in the center, respectively, while
Nar I and Sma I is composed of only GC bases. The transition between a DNA sequence that is
composed primarily of AT bases to primarily GC bases to all GC bases will allow for binding
and inhibition comparison to be made between each of the different compounds tested based on
variation in DNA sequence.
Table 1.1 Type II restriction enzyme recognition sequence and cleaving pattern
enzyme
recognition sequence
cleaving pattern
Bam HI
5’-GGATCC-3’ 3’-CCTAGG-5’
5’-G GATCC-3’ 3’-CCTAG G-5’
Eco RI
5’-GAATTC-3’ 3’-CTTAAG-5’
5’-G AATTC-3’ 3’-CTTAA G-5’
Hind III
5’-AAGCTT-3’ 3’-TTCGAA-5’
5’-A AGCTT-3’ 3’-TTCGA A-5’
Kpn I
5’-GGTACC-3’ 3’-CCATGG-5’
5’-GGTAC C-3’ 3’-C CATGG-5’
Nar I
5’-GGCGCC-3’ 3’-CCGCGG-5’
5’-GG CGCC-3’ 3’-CCGC GG-5’
Sma I
5’-CCCGGG-3’ 3’-GGGCCC-5’
5’-CCC GGG-3’ 3’-GGG CCC-5’
Ssp I
5’-AATATT-3’ 3’-TTATAA-5’
5’-AAT ATT-3’ 3’-TTA TAA-5’
12
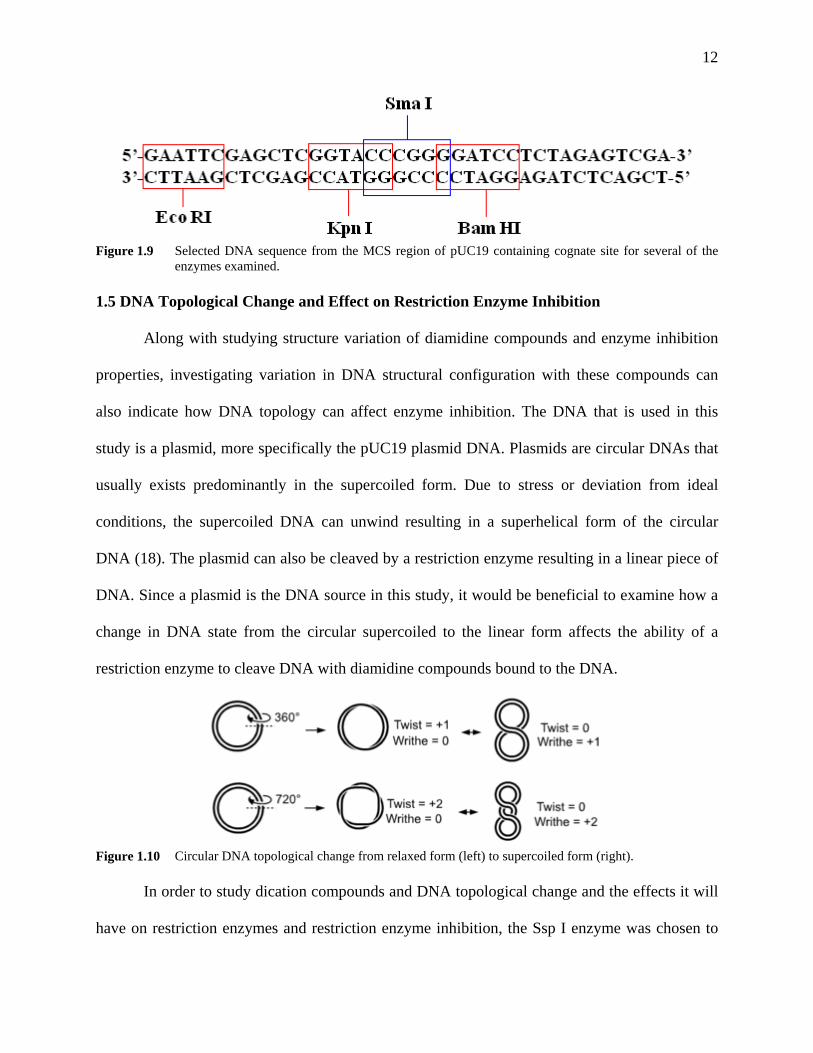
Figure 1.9 Selected DNA sequence from the MCS region of pUC19 containing cognate site for several of the
enzymes examined. 1.5 DNA Topological Change and Effect on Restriction Enzyme Inhibition
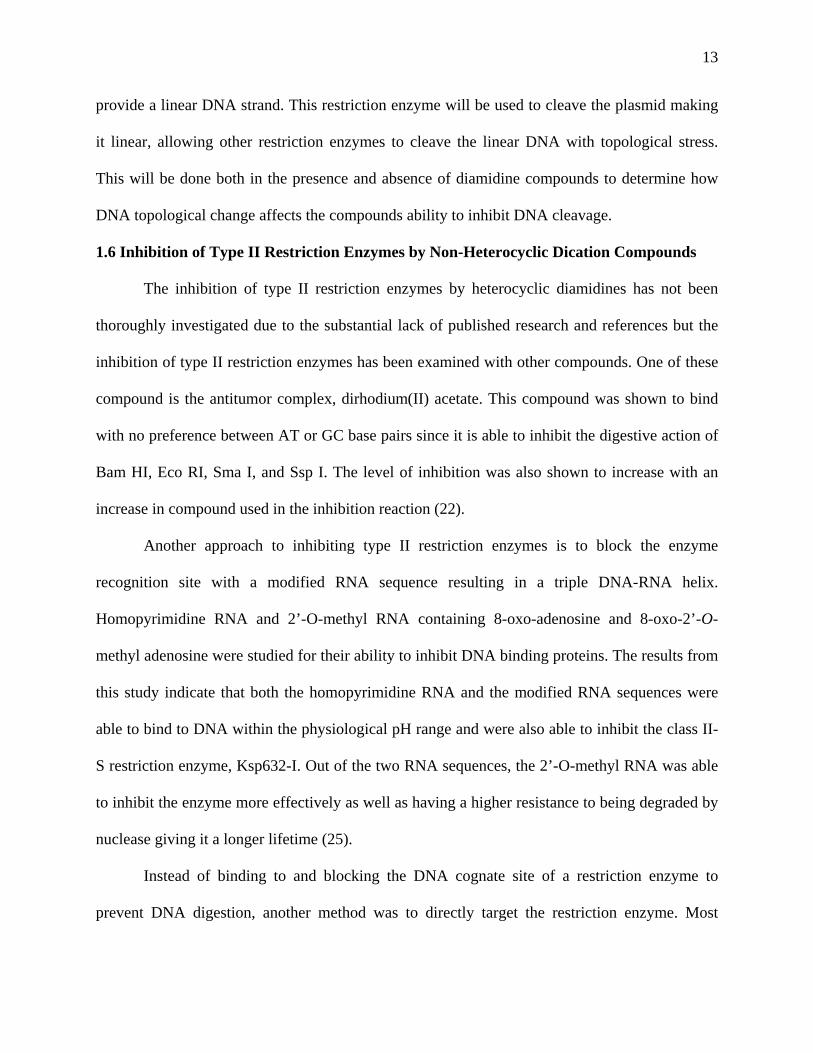
Along with studying structure variation of diamidine compounds and enzyme inhibition
properties, investigating variation in DNA structural configuration with these compounds can
also indicate how DNA topology can affect enzyme inhibition. The DNA that is used in this
study is a plasmid, more specifically the pUC19 plasmid DNA. Plasmids are circular DNAs that
usually exists predominantly in the supercoiled form. Due to stress or deviation from ideal
conditions, the supercoiled DNA can unwind resulting in a superhelical form of the circular
DNA (18). The plasmid can also be cleaved by a restriction enzyme resulting in a linear piece of
DNA. Since a plasmid is the DNA source in this study, it would be beneficial to examine how a
change in DNA state from the circular supercoiled to the linear form affects the ability of a
restriction enzyme to cleave DNA with diamidine compounds bound to the DNA.
Figure 1.10 Circular DNA topological change from relaxed form (left) to supercoiled form (right).
In order to study dication compounds and DNA topological change and the effects it will
have on restriction enzymes and restriction enzyme inhibition, the Ssp I enzyme was chosen to
13
provide a linear DNA strand. This restriction enzyme will be used to cleave the plasmid making
it linear, allowing other restriction enzymes to cleave the linear DNA with topological stress.
This will be done both in the presence and absence of diamidine compounds to determine how
DNA topological change affects the compounds ability to inhibit DNA cleavage.
1.6 Inhibition of Type II Restriction Enzymes by Non-Heterocyclic Dication Compounds
The inhibition of type II restriction enzymes by heterocyclic diamidines has not been
thoroughly investigated due to the substantial lack of published research and references but the
inhibition of type II restriction enzymes has been examined with other compounds. One of these
compound is the antitumor complex, dirhodium(II) acetate. This compound was shown to bind
with no preference between AT or GC base pairs since it is able to inhibit the digestive action of
Bam HI, Eco RI, Sma I, and Ssp I. The level of inhibition was also shown to increase with an
increase in compound used in the inhibition reaction (22).
Another approach to inhibiting type II restriction enzymes is to block the enzyme
recognition site with a modified RNA sequence resulting in a triple DNA-RNA helix.
Homopyrimidine RNA and 2’-O-methyl RNA containing 8-oxo-adenosine and 8-oxo-2’-O-
methyl adenosine were studied for their ability to inhibit DNA binding proteins. The results from
this study indicate that both the homopyrimidine RNA and the modified RNA sequences were
able to bind to DNA within the physiological pH range and were also able to inhibit the class II-
S restriction enzyme, Ksp632-I. Out of the two RNA sequences, the 2’-O-methyl RNA was able
to inhibit the enzyme more effectively as well as having a higher resistance to being degraded by
nuclease giving it a longer lifetime (25).
Instead of binding to and blocking the DNA cognate site of a restriction enzyme to
prevent DNA digestion, another method was to directly target the restriction enzyme. Most
14
restriction enzymes consist of multiple subunits and are only active in their quaternary state, like
Eco RI. By preventing the formation of the enzyme quaternary structure, the cleaving ability of
the enzyme can be inhibited. Studies using synthetic peptides as potential disruptors of
quaternary enzyme formation of Eco RI have found that helical peptide structures that are based
on the interface region of the Eco RI dimer were shown to inhibit both dimerization and cleaving
mechanisms. It is speculated that the helical peptide maximizes interaction with the dimers of
Eco RI (21).
1.7 Introductory Synopsis and Goals
The experiments conducted in this research will answer whether a heterocyclic diamidine
minor groove binder will be able to inhibit the cleaving mechanism of type II restriction enzymes
that bind in the major groove. Along with addressing this question, variation in compound
structure, enzymes, and DNA topology will also be examined. These variations will help in
determining what factors influence the compound’s ability to inhibit the cleaving action of
restriction enzymes.
The experiments carried out in this project will also provide insight into the intricate
interaction taking place between DNA and heterocyclic diamidine compounds and how this
interaction can affect the roles of proteins such as restriction enzymes and other proteins that
recognize and bind to DNA to execute their function. If this class of compound is effective in
preventing the actions of type II restriction enzymes, it will hopefully allow for a systematic
evaluation of compound design and effectiveness against proteins or enzymes that target the
DNA based on compound structure and inhibition correlation.

15
2. MATERIALS & METHODS
2.1 Overview of Methods
Experimental methods that were used to detect interactions taking place between DNA
and compounds were gel electrophoresis, Tm, and circular dichroism (CD). Gel electrophoresis
was the method of choice to examine the relationship between DNA, restriction enzymes, and
dication compounds. Gel electrophoresis is based on the concept of charge, size, and structural
configuration that is intrinsic for each molecule which allows for separation in a gel matrix due
to difference in mobility. A current is applied to a gel with the anode (+) at one end and the
cathode (-) at the opposite end. Since DNA, the molecule of interest, is negative due to the
phosphate backbone it will move towards the anode with varying mobility based on size and
configuration. A shorter and condensed DNA sequence will travel faster through the gel than a
longer and relaxed DNA sequence.
The thermal melting (Tm) temperature for DNA is the temperature at which half of the
DNA duplex is denatured. A typical Tm scan for DNA gives a sigmoidal curve in which the Tm
temperature is located at the inflection point on the curve. Tm can reveal useful information
regarding stoichiometry and change in DNA stability upon compound binding. DNA thermal
melting is built on the concept of hyperchromicity. DNA hyperchromicity is the property of
DNA to absorb more light in the single DNA strand form versus the duplex form. Using this
phenomenon, the increase in light absorption versus a constant increase in temperature will allow
for the Tm of a specific DNA sequence to be determined (17).
Circular dichroism (CD) is a spectroscopy method that is based on the difference between
absorption of left and right circular polarized light that exist in optically active molecules. Since
16
B-DNA duplex has a right handed twist configuration, making it optically active, it will absorb
circular polarized light giving it a unique CD spectrum. When compounds or proteins are bound
to DNA and cause change to the DNA structure, this changes the absorption of light and is
detected by the CD spectrophotometer producing an induced CD spectrum.
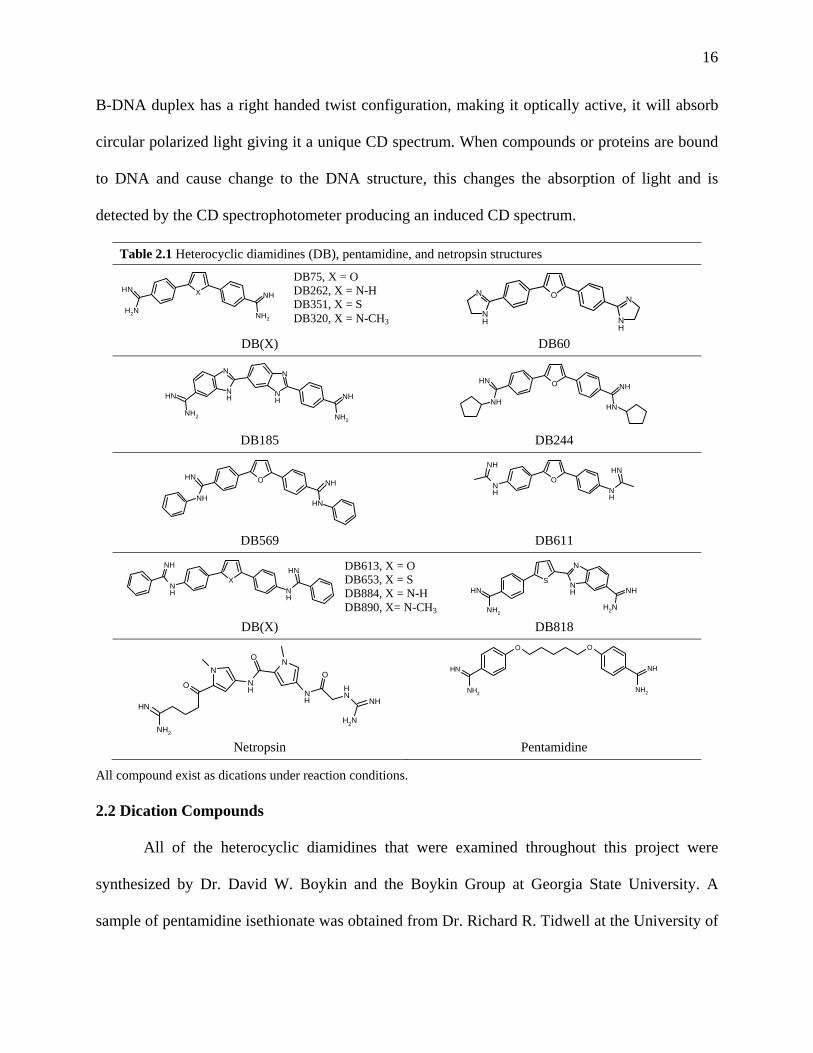
Table 2.1 Heterocyclic diamidines (DB), pentamidine, and netropsin structures
X
NH2
NHNH
NH2
O
NH
NN
NH
DB(X) DB60
NH
NN
NH
NH2
NHNH
NH2
O NHNH
NHNH
DB185 DB244
O NHNH
NHNH
ONH
NH
NHNH
DB569 DB611
XNH
NH
NHNH
SNH
NH2
NH
N
NH2
NH
DB(X) DB818
N
NH
NO
NH
O
NH
NH
NH2
O
NH
NH2
O O
NH
NH2 NH2
NH
Netropsin Pentamidine
All compound exist as dications under reaction conditions. 2.2 Dication Compounds
All of the heterocyclic diamidines that were examined throughout this project were
synthesized by Dr. David W. Boykin and the Boykin Group at Georgia State University. A
sample of pentamidine isethionate was obtained from Dr. Richard R. Tidwell at the University of
DB75, X = O DB262, X = N-H DB351, X = S DB320, X = N-CH3
DB613, X = O DB653, X = S DB884, X = N-H DB890, X= N-CH3
17
North Carolina, Chapel Hill. Lastly a sample of netropsin, a natural occurring molecule which
has antitumor and antiviral properties (22), was purchased from Sigma-Aldrich. Stock solutions
of compounds were prepared in water for a final concentration of 1mM. Structure of all of the
compounds tested can be examined in Table 2.1.
2.3 DNA Cleaving Reaction
The DNA cleaving and cleaving inhibition reactions were carried out in a 0.5mL Costar
PCR Tube (Fisher Scientific, Pittsburgh, PA). Dication compounds, DNA, and enzyme mixtures
were prepared for a final volume of 50 μL and incubated at 37 oC; except for mixtures containing
Sma I which were incubated at 25 oC. Reactions were incubated for 30 min., except for reactions
containing the Nar I enzyme which was incubated for 3 h. A volume of 5 μL of 120 mM EDTA
was added to the reaction mixture to prevent further digestion of DNA after incubation. The
reaction mixture contains 1 μL of 1 μg/μL pUC19 DNA (Bayou BioLabs, Harahan, LA), 5 μL of
10X buffer for a final buffer concentration of 1X, compound, enzyme, and water to obtain a total
volume of 50 μL. Eco RI, Hind III, Kpn I, Nar I, Sac I, and Ssp I along with bovine serum
albumin (BSA) and corresponding buffers were purchased from New England BioLabs, Ipswich,
MA. Sma I and corresponding buffer was purchased from ProMega, Madison, WI.
The DNA that was used to study the inhibition of the restriction enzyme was pUC19
(molecular weight of 1,750,000 Da), a circular plasmid DNA sequence with 2686 bp. This
plasmid was chosen because it has the recognition sequence for all of the restriction enzymes
used in this study. The concentration of pUC19 DNA used in the cleaving reaction was
calculated to be 11 nM in the form of pUC19 DNA.
Components of the reaction mixture were added in the following order: water, compound,
buffer (along with BSA if needed), DNA, and enzyme. The volume of water and compound
18
added to the reaction mixture depended on the desirable compound concentration for the
reaction. Enzyme control reaction did not have compound added to the reaction mixture. A
volume of 0.5 μL of 100X BSA (bovine serum albumin) was also added to the reaction mixture
to obtain the desirable 1X concentration for samples containing Bam HI, Kpn I, and Sma I
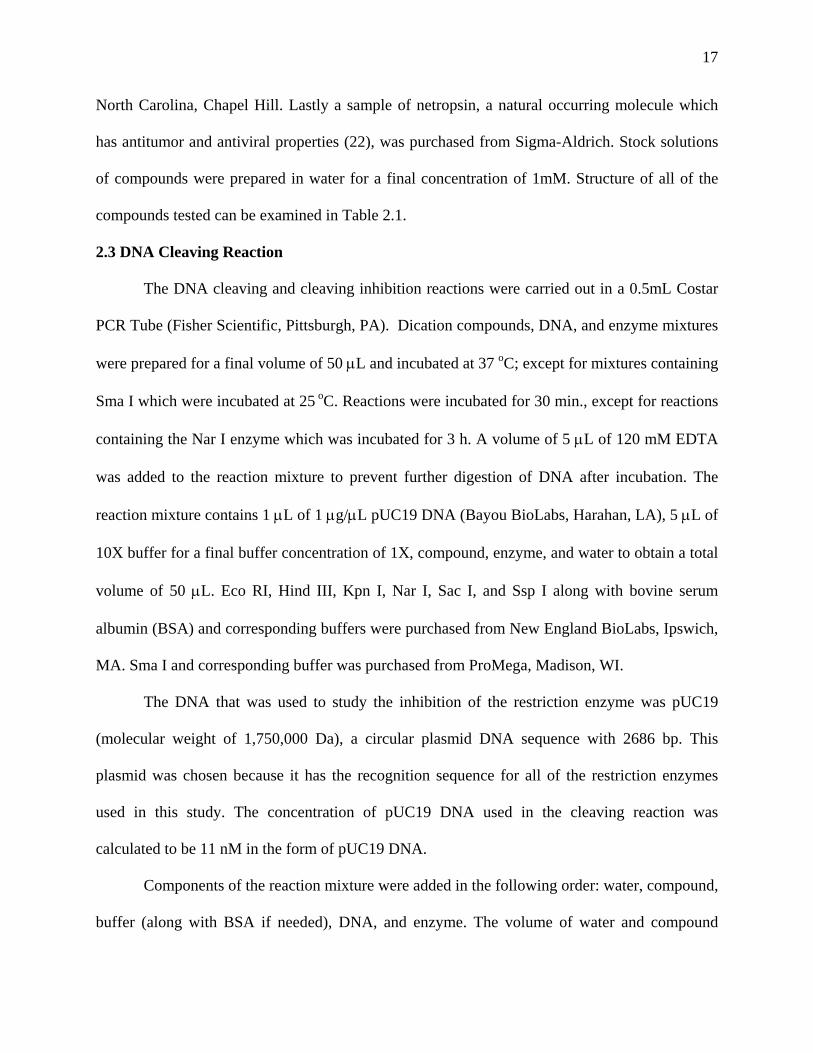
enzyme. Table 2.2 summarizes buffer and buffer pH for each restriction enzyme used along with
enzyme concentration and volume used in the reactions.
Table 2.2 Cleavage and cleavage inhibition reaction recipe
Components
Restriction Enzyme
5μL buffer
X U enzyme in 50μL reaction
Bam HI
10X NEBuffer 3, pH 7.9
6.0
Eco RI 10X NEBuffer 1, pH 7.5 0.5
Hind III 10X NEBuffer 2, pH 7.9 1.5
Kpn I 10X NEBuffer 1, pH 7.0 0.15
Nar I 10X NEBuffer 1, pH 7.0 8.0
Sma I 10X Buffer J, pH 7.4 0.5
Ssp I varies* , pH 7.5 10.0
*The buffer used for the Ssp I enzyme depends on the second enzyme used in the multiple cleaving reaction. For Eco RI, NEBuffer 1 was used as the buffer and for Sma I, Buffer J (or NEBuffer 4) was used.
For pUC19 cleavage reactions involving multiple enzymes to study the effect of DNA
topological change from supercoiled to linear, the Ssp I enzyme was used as the initial cleaving
enzyme. This enzyme was used for its versatile cleaving ability in multiple buffers, but more
importantly it cleaves at a site outside of the lacZα gene, which contains the multiple cloning
sites (MCS). The reason for selecting a restriction enzyme that cleaves far away from the MCS is
to allow the second enzyme to cleave the linear pUC19 DNA into two pieces that are big enough
to be retained and detected in the gel matrix after an appreciable amount of time, but on the other
hand, small enough to migrate away from the initial linear DNA strand made by Ssp I to allow
the DNA bands to be distinguished from each other.
19
Figure 2.1 pUC19 DNA with location of enzyme restriction sites used in this research (see Table 1.1). 2.4 Agarose Gel Electrophoresis
The method that was employed to detect the interaction taking place between the
dications, DNA, and the restriction enzyme was gel electrophoresis. A stock solution of 50X
TAE (242 g of Tris base, 57.1 mL acetic acid, and 0.05 M Na2EDTA in a final volume of 1.0 L
and pH adjusted to 8.5) buffer was used to prepare the gel and running buffer. Three g of
OmmiPur Agarose (EMD Chemicals Inc., Damstadt, Germany) were dissolved in 200 mL of 1X
TAE buffer and heated until all of the agarose was dissolved and allowed to cool to 70 oC before
10 μL of 10 mg/ml ethidium bromide were added. The mixture was then poured into the gel tray
and allowed to solidify to produce a 1.5% (m/v) agarose gel. 1600 mL of 1X TAE buffer stained
with 80 μL of 10 mg/ml ethidium bromide was used as the running buffer. A volume of 10 μL of
20
the incubated cleaving/cleaving inhibition reaction mixture was mixed with 2 μL of Blue/Orange
6X loading dye (Promega, Madison, WI) and loaded into the gel wells. A volume of 10 μL of
Hi-Lo DNA Marker (Minnesota Molecular Inc., Minneapolis, MN) was loaded into the gel well
to be used as a reference point to determine the size of DNA bands. The voltage was set at 150 V
and run for 5 h. Gels were imaged using the UVP BioImaging System EC3 instrument.
2.5 DNA Thermal Melting (Tm) - UV Spectroscopy
A 1 mL, 1-cm-path-length cell was used to contain samples. Thermal melting
experiments were conducted using a Cary 300 Bio UV-Visible Spectrophotometer. DNA and
dications were added to 1 mL of MES 10 (0.01 M morpholine-ethanesulfonic acid (MES), 0.1 M
NaCl, 0.001 M EDTA, pH 6.2) buffer or Tris 10 buffer (0.01 M Tris base, 0.1 M NaCl, 0.001 M
EDTA, pH 7.5) for thermal melting studies. DNA sequences used for this experiment were an
Eco RI oligomer (Eco RI DNA) sequence conducted at a concentration of 1.0x10⁻⁶ M in duplex
form, Hind III oligomer (Hind III DNA) sequence conducted at a concentration of 7.2x10⁻⁷ M in
hairpin form, and a Sma I oligomer (Sma I DNA) sequence conducted at a concentration of
9.0x10⁻⁷ M in hairpin form (Integrated DNA Technology, Coralville, IA.). These DNA oligomer
sequences were selected and named after the restriction enzymes that recognize these unique
sequences.
Dications were then added to the cell at varying amounts to give a desirable dication to
DNA ratio. The absorption wavelength was set at 260 nm. The heating rate was set at 0.5 oC/min
with a one min. delay between temperature change, data was recorded at every 0.5 oC interval
from 25 oC to 95 oC. The difference between the Tm of DNA and dication complex and the Tm of
only DNA was used to determine ΔTm. Thermal melting data were viewed and plotted using

21
Window’s Microsoft Excel 2007. Tm values were determined using calculation functions
provided by Cary Thermal Software.
Eco RI DNA Sequence =
Hind III DNA Sequence =
Sma I DNA sequence =
Figure 2.2 DNA oligomer sequences containing the recognition site (highlighted in red) for each corresponding restriction enzyme.
2.6 Circular Dichroism
A similar cell to that used in the DNA thermal melting study was also in this study. CD
measurements were collected using the Jasco J-810 Spectrometer. Experiments were conducted
in MES10 buffer. DNA sequences used for this experiment were the same as those used during
the DNA thermal melting study but the concentrations were increase to obtain a better signal.
Concentration of DNA used in this experiment were 2.5x10⁻⁶ M in duplex form for Eco RI DNA
sequence, 2.2x10⁻⁶ M in hairpin form, and 2.7x10⁻⁶ M in hairpin form for Sma I DNA. Dications
were then added to the cell in varying amounts to give the desirable dication to DNA ratio. The
CD was set to scan from 450 nm to 220 nm, with a data pitch of 1 nm, speed of 50 nm/min,
response set at 1, bandwidth of 1 nm, and accumulation of 4. CD spectra were viewed and
plotted using Window’s Microsoft Excel 2007.
5’-CGTGAATTCACG-3’ 3’-GCACTTAAGTGC-5’
5’-CATGCAAGCTTGGCG 3’-GTACGTTCGAACCGC
TCTC
5’-GTACCCGGGGA 3’-CATGGGCCCCT
CT
T
C
22
3. METHOD DEVELOPMENT AND TESTING WITH DB75
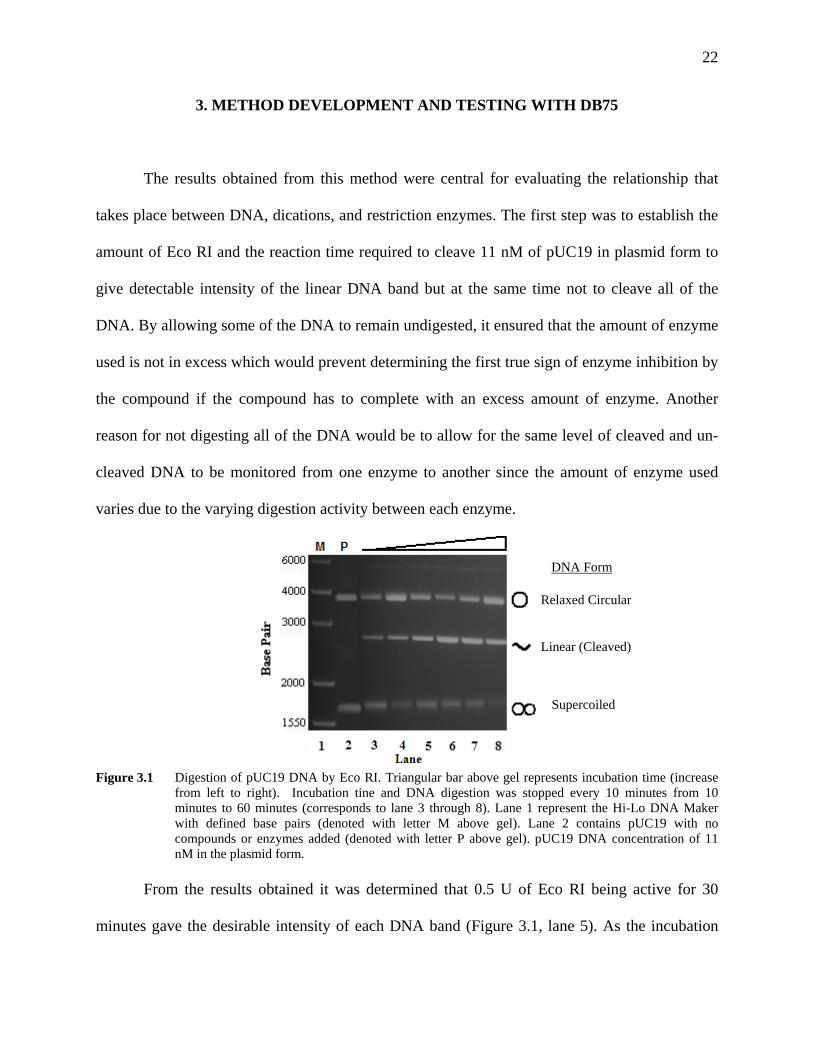
The results obtained from this method were central for evaluating the relationship that
takes place between DNA, dications, and restriction enzymes. The first step was to establish the
amount of Eco RI and the reaction time required to cleave 11 nM of pUC19 in plasmid form to
give detectable intensity of the linear DNA band but at the same time not to cleave all of the
DNA. By allowing some of the DNA to remain undigested, it ensured that the amount of enzyme
used is not in excess which would prevent determining the first true sign of enzyme inhibition by
the compound if the compound has to complete with an excess amount of enzyme. Another
reason for not digesting all of the DNA would be to allow for the same level of cleaved and un-
cleaved DNA to be monitored from one enzyme to another since the amount of enzyme used
varies due to the varying digestion activity between each enzyme.
Figure 3.1 Digestion of pUC19 DNA by Eco RI. Triangular bar above gel represents incubation time (increase from left to right). Incubation tine and DNA digestion was stopped every 10 minutes from 10 minutes to 60 minutes (corresponds to lane 3 through 8). Lane 1 represent the Hi-Lo DNA Maker with defined base pairs (denoted with letter M above gel). Lane 2 contains pUC19 with no compounds or enzymes added (denoted with letter P above gel). pUC19 DNA concentration of 11 nM in the plasmid form.
From the results obtained it was determined that 0.5 U of Eco RI being active for 30
minutes gave the desirable intensity of each DNA band (Figure 3.1, lane 5). As the incubation
Relaxed Circular
Linear (Cleaved)
Supercoiled
DNA Form
23
time increased the intensity of the linear DNA band increased which indicates that the Eco RI is
cleaving the circular pUC19 DNA as expected. The next approach was to introduce a dication
into the reaction to determine its effect on Eco RI and pUC19 DNA. The heterocyclic diamidine,
DB75 was selected and will be used as a control and standard compound to compare other
dications effectiveness at inhibiting Eco RI relative to DB75.
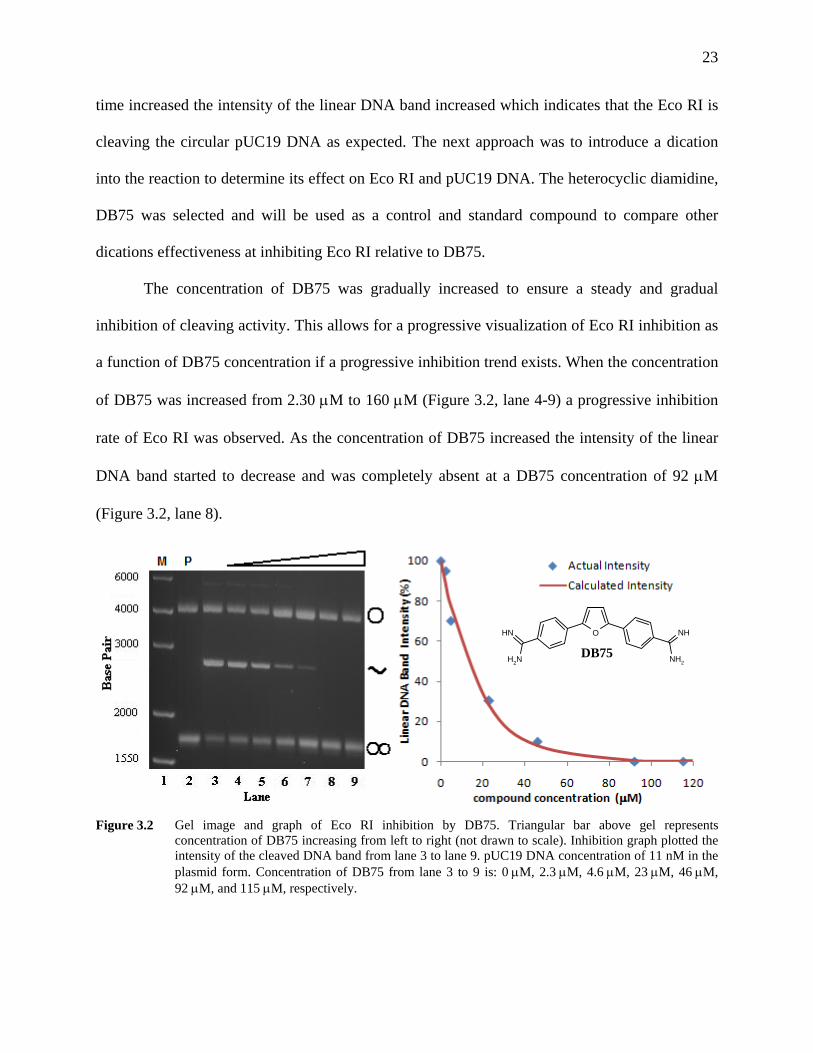
The concentration of DB75 was gradually increased to ensure a steady and gradual
inhibition of cleaving activity. This allows for a progressive visualization of Eco RI inhibition as
a function of DB75 concentration if a progressive inhibition trend exists. When the concentration
of DB75 was increased from 2.30 μM to 160 μM (Figure 3.2, lane 4-9) a progressive inhibition
rate of Eco RI was observed. As the concentration of DB75 increased the intensity of the linear
DNA band started to decrease and was completely absent at a DB75 concentration of 92 μM
(Figure 3.2, lane 8).
Figure 3.2 Gel image and graph of Eco RI inhibition by DB75. Triangular bar above gel represents concentration of DB75 increasing from left to right (not drawn to scale). Inhibition graph plotted the intensity of the cleaved DNA band from lane 3 to lane 9. pUC19 DNA concentration of 11 nM in the plasmid form. Concentration of DB75 from lane 3 to 9 is: 0 μM, 2.3 μM, 4.6 μM, 23 μM, 46 μM, 92 μM, and 115 μM, respectively.
DB75 O
NH2
NHNH
NH2
24
The graph shows the decrease in the linear DNA band intensity versus compound
concentration allowing for the determination of the IC50 (50% inhibitory concentration) value,
the concentration at which 50% of the Eco RI is inhibited by DB75. The IC50 value for DB75
was determined to be 12.6 μM. This IC50 will be used as a control to determine the effectiveness
of other compounds ability to inhibit Eco RI. Compounds with IC50 values greater than DB75 are
less effective in inhibiting Eco RI and therefore require a higher compound concentration,
whereas, compounds with IC50 values less than DB75 are more effective in inhibiting Eco RI,
thus, requiring a lower compound concentration.
The calculated intensity curve for the inhibition of Eco RI by DB75 as well as other
dications was determined using a single variable exponential decay formula given by the
equation:
y = A•exp-(x)•(c)
where A represents the amplitude, which is set at 100 by default due to lack of enzyme inhibition
at zero compound concentration, so the linear DNA band intensity with no compound present
will have a intensity value of 100%. The c component represents the concentration of compound
used and x represent a variable that differs for each compound and also determined the steepness
of the curve. These two variables will give a calculated intensity value represented by y at the
specified compound concentration, c. An ideal x value is one that gives a curve that overlaps or
comes close to overlapping the actual inhibition intensity points of Eco RI. The IC50 can be
obtained using the calculated inhibition curve. The compound concentration that corresponds to
the 50% intensity point on the calculated curve is the IC50 value for that compound.
To determine what effect DNA concentration has on the inhibition of Eco RI by DB75 a
higher pUC19 DNA concentration was used. Instead of using 11 nM of pUC19 DNA (in the
25
plasmid form), 22 nM was used. From the results in Figure 3.3, it can be seen that doubling the
DNA concentration had very little effect on the ability of DB75 to inhibit Eco RI. A DB75
concentration around 10 μM was enough to inhibit half of the Eco RI cleaving activity, close to
the IC50 value for Eco RI by DB75 with half the DNA used (Figure 3.2). This can be seen by
comparing lane 3, which has no compound, and lane 4.
Figure 3.3 Gel image and graph of Eco RI inhibition by DB75 with higher DNA concentration. Triangular bar
above gel represents concentration of DB75 increasing from left to right (not drawn to scale). Inhibition graph plotted the intensity of the cleaved DNA band from lane 3 to lane 9. pUC19 DNA concentration of 22 nM in the plasmid form. Concentration of DB75 from lane 3 to 10 is: 0 μM, 10 μM, 20 μM, 30 μM, 40 μM, 60 μM, 80 μM, and 120 μM, respectively.
These results demonstrate that within a certain range of DNA concentration, the amount
of compound required for inhibition remains fairly unaffected. This information is useful
because it indicates that the selected amount of DNA, which is 11 nM of pUC19 DNA as
plasmid, is not too concentrated or too diluted that unwanted compound and DNA interactions
will arise such as secondary binding or intercalation to interfere with primary minor groove
binding. DNA concentrations below 11 nM were also examined but issues regarding band
detection made it difficult to analyze the data obtained. This was particularly difficult when
trying to calculate inhibition curve from band intensity.
26
4. INHIBITION OF ECO RI BY DICATION COMPOUNDS USING
RESTRICTION ENZYME INHIBITING METHOD
4.1 Modification of the Central Furan Ring
With the establishment of a restriction enzyme inhibiting method and an inhibitory
relationship between DB75 and Eco RI, the next approach was to examine variation in
compound structure and inhibition activity. The general structure of DB75 has three components;
the central 5-member furan ring, the phenyl rings, and the amidinium ends. The first change to
the DB75 structure that was examined was the replacement of the furan ring with another
aromatic heterocyclic ring. The pyrrole (DB262), N-methyl pyrrole (DB320), and thiophene
(DB351) derivatives of DB75 were examined and their ability to inhibit the activity of Eco RI
was compared with DB75. These were chosen for their nearly identical structure to DB75 with
the replacement of the oxygen atom in the five member aromatic ring with another hetero atom.
Figure 4.1 Cleavage inhibition of Eco RI by DB262 (pyrrole derivative) and DB351 (thiophene derivative).
Triangular bar above gel represents increase in concentration of (A) DB262 and (B) DB351 (not drawn to scale). pUC19 DNA concentration of 11 nM in the plasmid form. (A) Concentration of DB262 from lane 5 to 10 is: 4 μM, 20 μM, 40 μM, 80 μM, 120 μM, and 160 μM, respectively. (B) Concentration of DB351 from lane 11 to 16 is: 4 μM, 20 μM, 40 μM, 80 μM, 120 μM, and 160 μM, respectively.
A B
27
Figure 4.2 Intensity versus concentration graph for Eco RI inhibition by (A) DB262 and (B) DB351. Both diamidines are compared with the calculated inhibition curve of DB75.
The pyrrole (DB262) and thiophene (DB351) derivatives of DB75 were also able to
inhibit the cleaving activity of Eco RI with roughly the same IC50 value as DB75 (Figure 4.1 and
4.2). From the results of these three similar molecules it is noticed that minor changes done to
the hetero atom in the five-member ring will still have the ability to prevent the cleaving of DNA
by Eco RI. But when a more noticeable change is done to the five-member ring, as in the case of
the n-methyl pyrrole (DB320) derivative of DB75, a dramatic increase in the IC50 is observed.
Comparing the calculated inhibition curve of DB262 with DB320, there is a significant
difference in IC50 between the two compounds (Figure 4.3). The methyl group of DB320 might
be preventing any possible hydrogen bond formation that would be able to occur between the
five member ring and water or DNA or it could sterically prevent the compound from sliding
into the minor groove. The methyl group is a larger substituent than –H in DB262 and could
prevent the molecule from tightly binding into the DNA minor groove.
NH
NH2
NHNH
NH2DB262
S
NH2
NHNH
NH2DB351
A B
28
Figure 4.3 Gel image and inhibition graph of Eco RI by DB320. Inhibition graph plotted the intensity of the cleaved DNA band from lane 3 to lane 10, excluding lane 4. pUC19 DNA concentration of 11 nM in the plasmid form. Concentration of DB320 from lane 5 to 10 is: 40 μM, 80 μM, 120 μM, 200 μM, 300 μM, and 400 μM, respectively.
4.2 Modification of the Heterocyclic Amidine Ends
So far the results have shown that modifications to the oxygen on the furan ring of DB75
still allow the diamidine to retain its ability to inhibit Eco RI from cleaving DNA, but what about
modifications done to the amidinium ends. Will changing the amidinium ends affect the
compounds ability to inhibit Eco RI? The first compound to be examined was DB60. DB60 still
retains the overall structure scheme as DB75, but the amidinium ends have been replaced with an
imidazolinium ring.
From the results obtained, it is noticed that DB60 can indeed inhibit Eco RI but requires a
slightly higher compound concentration than DB75 (Figure 4.4). Another modified amidinium
that was examined was DB244. A cyclopentyl substituent has been added to nitrogen on the
amidinium end to obtain DB244.
The gel image of the cleavage/cleavage inhibition reaction of DB244 gives a result
similar to DB75. DB244 was clearly able to inhibit the cleaving ability of Eco RI and the IC50 is
significantly lower than DB75. This decrease in the IC50 could be attributed to the high binding
N
NH2
NHNH
NH2 DB320
29
constant of DB244 to the AATT DNA sequence. Thermodynamic studies on DB244 reveal that
hydrophobic interactions contribute to DNA binding and molecular interactions contributing to
the compound-DNA complex stability which helps to explain the high binding constant (12). The
increased hydrophobic interaction would most likely be due to the cyclopentyl group. SPR
binding studies of DB244 have determined the binding constant, Kb, of this compound to AATT
hairpin DNA to be 2.2x10⁷M-1. This Kb value is higher than that of DB75, which is 4.2 x10⁶M-1
for the same DNA sequence (12).
Figure 4.4 Gel image and inhibition graph of cleavage inhibition of Eco RI by DB60. Inhibition graph plotted the intensity of the cleaved DNA band from lane 3 to lane 9. pUC19 DNA concentration of 11 nM. Concentration of DB60 from lane 4 to 9 is: 2 μM, 4 μM, 20 μM, 40 μM, 100 μM, and 200 μM, respectively.
Figure 4.5 Gel image and inhibition graph of cleavage inhibition of Eco RI by DB244. Inhibition graph plotted the intensity of the cleaved DNA band from lane 3 to lane 11. pUC19 DNA concentration of 11 nM in the plasmid form. Concentration of DB244 from lane 4 to 11 is: 10 μM, 20 μM, 30 μM, 40 μM, 50 μM, 60 μM, 80 μM, and 100 μM, respectively.
O
NH
NN
NH
DB60
O NHNH
NHNHDB244
30
So far the results have shown that a substitution to nitrogen on the amidine group
still allows the diamidine to inhibit Eco RI, but an unusual result was obtained for DB569,
another modified amidinium compound. DB569 is the n-phenyl substituted analog of DB75. The
gel image indicates that this compound lacks the ability to prevent Eco RI from cleaving DNA,
even at a concentration as high as 0.50 mM.
Figure 4.6 (A) Cleavage inhibition of Eco RI by (B) DB569. pUC19 DNA concentration of 11 nM in the plasmid form. Concentration of DB569 from lane 5 to 10 is: 20 μM, 0.1 mM, 0.2 mM, 0.3 mM, 0.4 mM, and 0.5 mM, respectively.
This lack of Eco RI inhibition can be seen by the continuous presence of an intensive
linear DNA band in the gel as DB569 concentration increases (Figure 4.6). The lack of Eco RI
inhibition by DB569 would most likely be due to the substituted phenyls on the amidine end
since this is the only difference between DB75 and DB569. It is not clear why DB569 lacks the
ability to inhibit Eco RI but a possible explanation could be that the presence of the phenyl rings
on the amidinium prevents the diamidine from fitting perfectly into the minor groove. SPR
binding studies done on DB569 indicates that the Kb for this compound to A3T3 and AT hairpin
DNA was 39x106 M-1 and 19x106 M-1, respectively while the Kb for DB75 to the same DNA
hairpin sequence are 110x106 M-1 and 34x106 M-1, respectively (23). The Kb of DB75 to each
DNA sequence is significantly higher than that of DB569 which further helps to explain the
dependence of compound structure on DNA binding and interaction.
O NHNH
NHNH
A B
DB569
31
The next set of compounds with modified amidine ends were the reverse amidine series.
Heterocyclic diamidine compounds that have already been examined have the amidine carbon
linked to the central phenyl heterocyclic system, but in reverse amidine compounds this link is
provided by amidine nitrogen. The reverse amidine modification causes the entire molecular
structure to have a larger dihedral angle.
The results for the cleavage inhibition reaction for several of the reverse amidine
compounds gave similar results to that of DB569; there were no sign of Eco RI inhibition. The
methyl-substituted reverse amidinium, DB611, and the phenyl-substituted reverse amidinium,
DB613, both had gel image similar to DB569 (Figure 3.1.8). DB653, the thiophene analog of
DB613, was also examined and gave the same result: no Eco RI inhibition. The Kb for DB613
onto AATT hairpin DNA was determined to be 9.8x10⁵ M-1. This Kb value is low compared the
Kb of DB75. But a different result was observed for DB884, the pyrrole analog of DB613.
DB884 was the only reverse amidine compound in this study that was effective at inhibiting Eco
RI (Figure 4.7).
Figure 4.7 Gel image and intensity graph of Eco RI inhibition by DB884. Inhibition graph plotted the intensity of the cleaved DNA band from lane 3 to lane 11, excluding lane 4. pUC19 DNA concentration of 11 nM in the plasmid form. Concentration of DB884 from lane 5 to 11 is: 2 μM, 4 μM, 20 μM, 40 μM, 80 μM, 0.12 mM, and 0.16 mM, respectively.
NH N
HNH
NHNH
DB884
32
Not only was DB884 able to inhibit Eco RI from cleaving the DNA site, but surprisingly
the IC50 is lower than that of DB75. The Kb of DB884 to AATT hairpin DNA is 2.5x10⁷ M-1
(24). The relationship between Kb and level of enzyme inhibition is similar to that of DB244,
compounds with Kb value higher than DB75 were able to inhibit the Eco RI enzyme better than
DB75, whereas compounds with lower Kb values were not able to inhibit the enzyme or inhibit
the enzyme less effectively than DB75. It is speculated that the N-H bond in DB884 is what
allows the compound to inhibit Ec oRI. One way to test this assumption was to eliminate the N-
H; this was the reason why DB890 was chosen. DB890 is the n-methyl pyrrole analog of DB613.
DB884 and DB890 are identical except for the replacement of the N-H bond for an N-C bond in
the pyrrole ring.
Figure 4.8 (A) Cleavage inhibition of Eco RI by (B) DB890. pUC19 DNA concentration of 11 nM in the
plasmid form. Concentration of DN890 from lane 5 to 10 is: 40 μM, 80 μM, 0.16 mM, 0.3 mM, 0.4 mM, and 0.5 mM, respectively.
The cleavage inhibition results for DB890 indicate that this reverse diamidine lacks the
ability to inhibit Eco RI, even at concentration as high as 0.5 mM. Comparing the cleavage
inhibition results for DB884 and DB890, it can be determined that the replacement of the N-H
bond in the pyrrole ring of DB884 for an N-C bond in DB890 eliminated the ability of the
compound to inhibit Eco RI. Based on the results obtained for the reverse amidine compounds, it
was determined that the modification of the amidine ends to a reverse amidine caused the
DB890
A B
33
compounds to lose their ability to inhibit Eco RI regardless of changes made to the central furan
ring, except for substitution with a pyrrole (DB884) which allows the dication to retain its ability
to inhibit Eco RI.
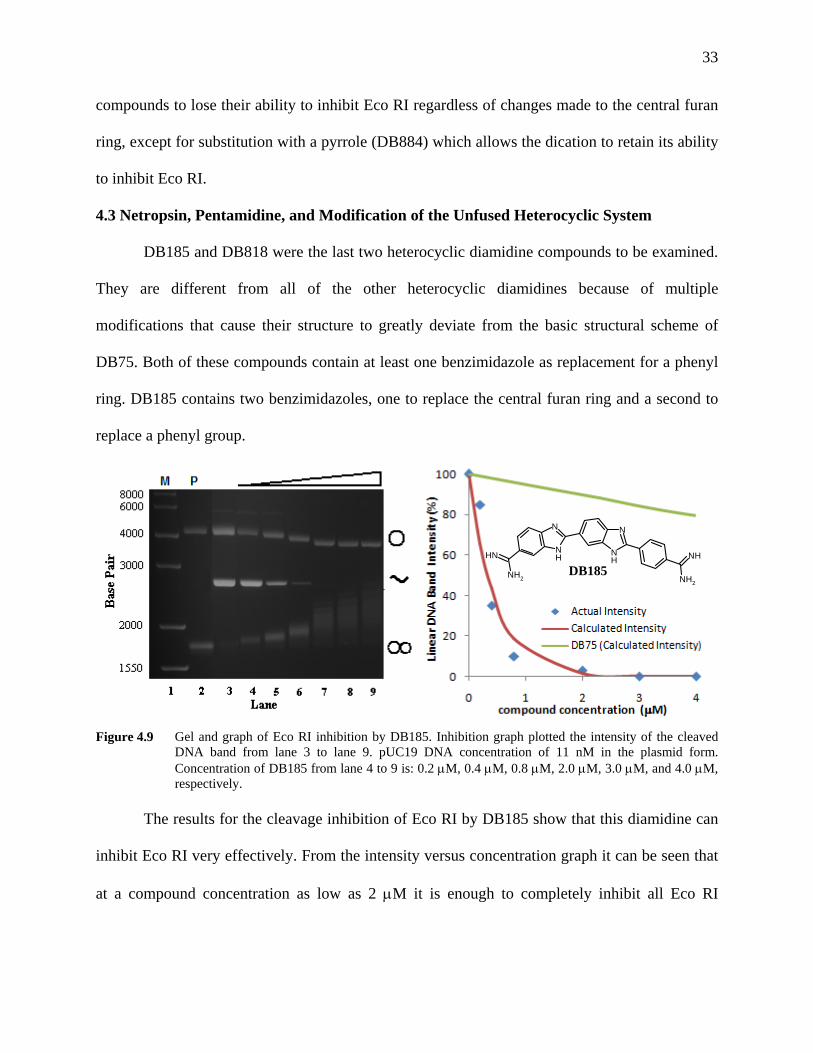
4.3 Netropsin, Pentamidine, and Modification of the Unfused Heterocyclic System
DB185 and DB818 were the last two heterocyclic diamidine compounds to be examined.
They are different from all of the other heterocyclic diamidines because of multiple
modifications that cause their structure to greatly deviate from the basic structural scheme of
DB75. Both of these compounds contain at least one benzimidazole as replacement for a phenyl
ring. DB185 contains two benzimidazoles, one to replace the central furan ring and a second to
replace a phenyl group.
Figure 4.9 Gel and graph of Eco RI inhibition by DB185. Inhibition graph plotted the intensity of the cleaved
DNA band from lane 3 to lane 9. pUC19 DNA concentration of 11 nM in the plasmid form. Concentration of DB185 from lane 4 to 9 is: 0.2 μM, 0.4 μM, 0.8 μM, 2.0 μM, 3.0 μM, and 4.0 μM, respectively.
The results for the cleavage inhibition of Eco RI by DB185 show that this diamidine can
inhibit Eco RI very effectively. From the intensity versus concentration graph it can be seen that
at a compound concentration as low as 2 μM it is enough to completely inhibit all Eco RI
NH
NN
NH
NH2
NHNH
NH2DB185
34
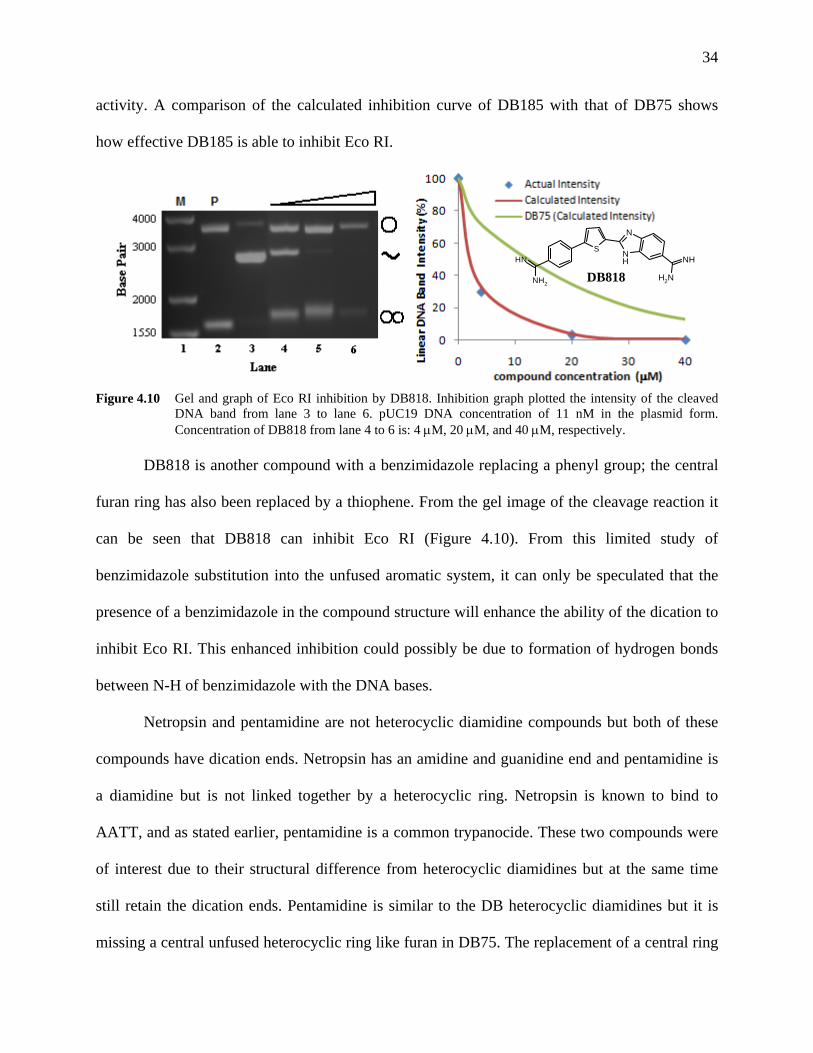
activity. A comparison of the calculated inhibition curve of DB185 with that of DB75 shows
how effective DB185 is able to inhibit Eco RI.
Figure 4.10 Gel and graph of Eco RI inhibition by DB818. Inhibition graph plotted the intensity of the cleaved
DNA band from lane 3 to lane 6. pUC19 DNA concentration of 11 nM in the plasmid form. Concentration of DB818 from lane 4 to 6 is: 4 μM, 20 μM, and 40 μM, respectively.
DB818 is another compound with a benzimidazole replacing a phenyl group; the central
furan ring has also been replaced by a thiophene. From the gel image of the cleavage reaction it
can be seen that DB818 can inhibit Eco RI (Figure 4.10). From this limited study of
benzimidazole substitution into the unfused aromatic system, it can only be speculated that the
presence of a benzimidazole in the compound structure will enhance the ability of the dication to
inhibit Eco RI. This enhanced inhibition could possibly be due to formation of hydrogen bonds
between N-H of benzimidazole with the DNA bases.
Netropsin and pentamidine are not heterocyclic diamidine compounds but both of these
compounds have dication ends. Netropsin has an amidine and guanidine end and pentamidine is
a diamidine but is not linked together by a heterocyclic ring. Netropsin is known to bind to
AATT, and as stated earlier, pentamidine is a common trypanocide. These two compounds were
of interest due to their structural difference from heterocyclic diamidines but at the same time
still retain the dication ends. Pentamidine is similar to the DB heterocyclic diamidines but it is
missing a central unfused heterocyclic ring like furan in DB75. The replacement of a central ring
SNH
NH2
NH
N
NH2
NH
DB818
35
for a five carbon straight chain alkane in pentamidine eliminates the natural curvature that is
characteristic of a classical minor groove binder.
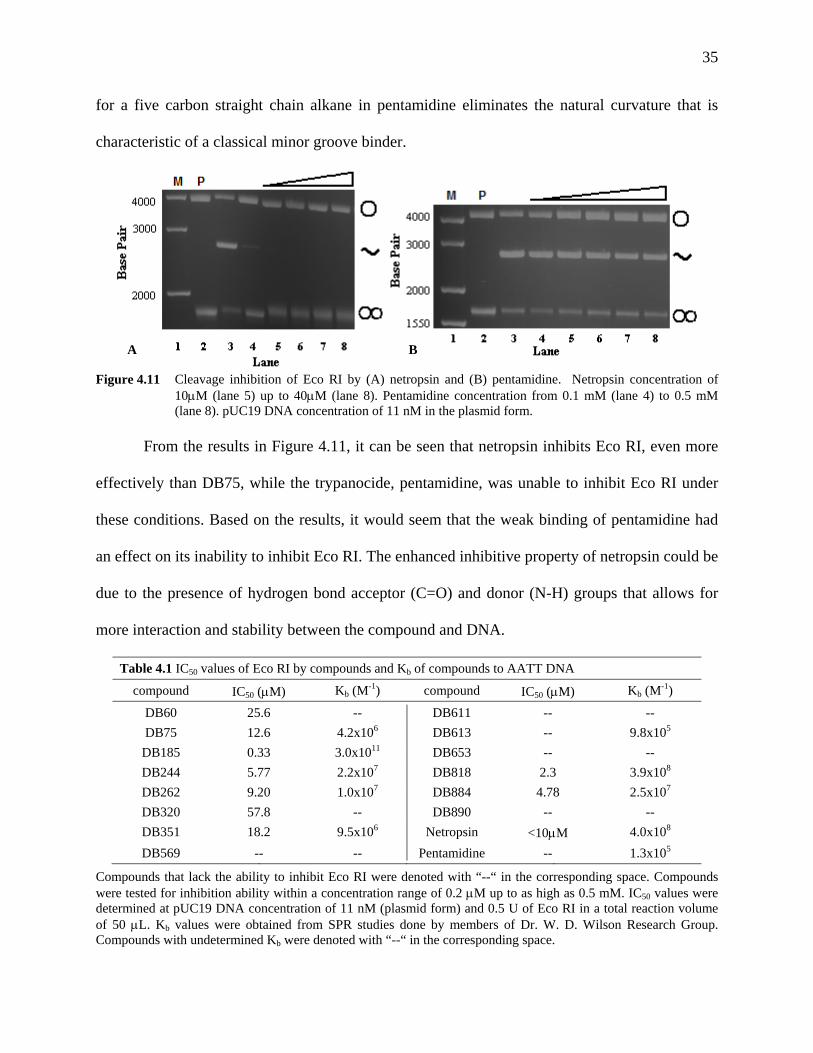
Figure 4.11 Cleavage inhibition of Eco RI by (A) netropsin and (B) pentamidine. Netropsin concentration of
10μM (lane 5) up to 40μM (lane 8). Pentamidine concentration from 0.1 mM (lane 4) to 0.5 mM (lane 8). pUC19 DNA concentration of 11 nM in the plasmid form.
From the results in Figure 4.11, it can be seen that netropsin inhibits Eco RI, even more
effectively than DB75, while the trypanocide, pentamidine, was unable to inhibit Eco RI under
these conditions. Based on the results, it would seem that the weak binding of pentamidine had
an effect on its inability to inhibit Eco RI. The enhanced inhibitive property of netropsin could be
due to the presence of hydrogen bond acceptor (C=O) and donor (N-H) groups that allows for
more interaction and stability between the compound and DNA.
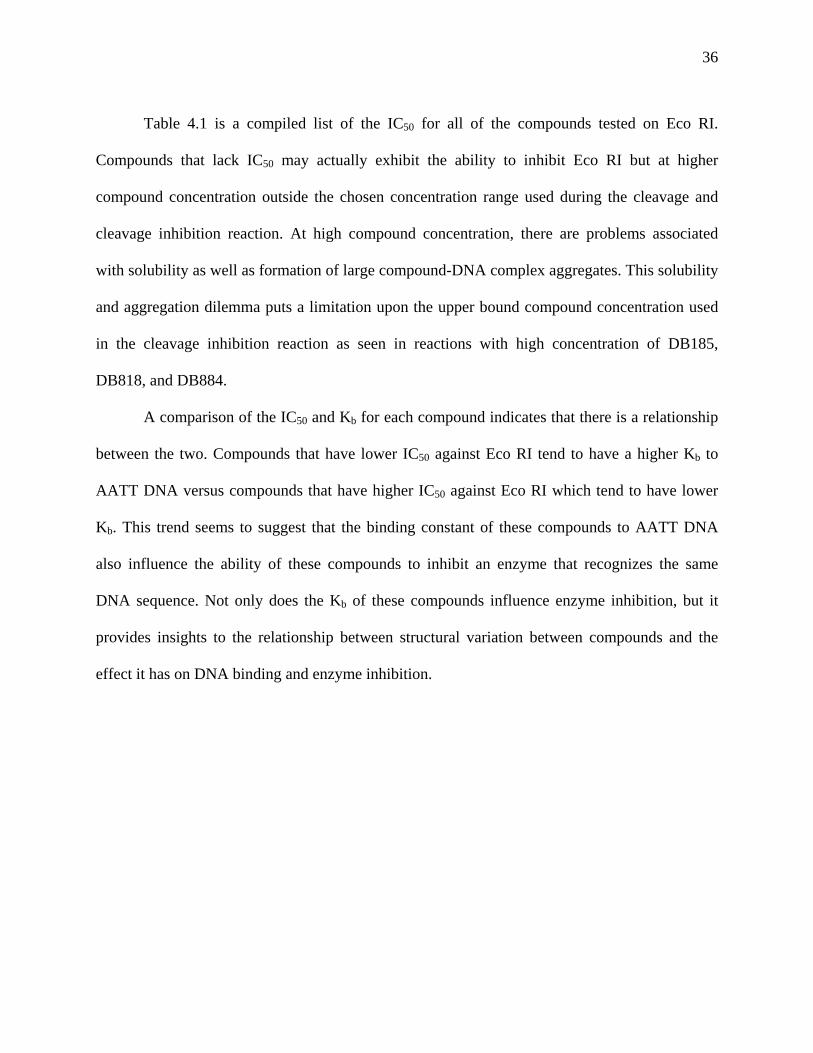
Table 4.1 IC50 values of Eco RI by compounds and Kb of compounds to AATT DNA
compound
IC50 (μM)
Kb (M-1)
compound
IC50 (μM)
Kb (M-1)
DB60 25.6 -- DB611 -- -- DB75 12.6 4.2x10⁶ DB613 -- 9.8x10⁵
DB185 0.33 3.0x10¹¹ DB653 -- -- DB244 5.77 2.2x10⁷ DB818 2.3 3.9x10⁸ DB262 9.20 1.0x10⁷ DB884 4.78 2.5x10⁷ DB320 57.8 -- DB890 -- -- DB351 18.2 9.5x10⁶ Netropsin <10μM 4.0x10⁸ DB569 -- -- Pentamidine -- 1.3x10⁵
Compounds that lack the ability to inhibit Eco RI were denoted with “--“ in the corresponding space. Compounds were tested for inhibition ability within a concentration range of 0.2 μM up to as high as 0.5 mM. IC50 values were determined at pUC19 DNA concentration of 11 nM (plasmid form) and 0.5 U of Eco RI in a total reaction volume of 50 μL. Kb values were obtained from SPR studies done by members of Dr. W. D. Wilson Research Group. Compounds with undetermined Kb were denoted with “--“ in the corresponding space.
A B
36
Table 4.1 is a compiled list of the IC50 for all of the compounds tested on Eco RI.
Compounds that lack IC50 may actually exhibit the ability to inhibit Eco RI but at higher
compound concentration outside the chosen concentration range used during the cleavage and
cleavage inhibition reaction. At high compound concentration, there are problems associated
with solubility as well as formation of large compound-DNA complex aggregates. This solubility
and aggregation dilemma puts a limitation upon the upper bound compound concentration used
in the cleavage inhibition reaction as seen in reactions with high concentration of DB185,
DB818, and DB884.
A comparison of the IC50 and Kb for each compound indicates that there is a relationship
between the two. Compounds that have lower IC50 against Eco RI tend to have a higher Kb to
AATT DNA versus compounds that have higher IC50 against Eco RI which tend to have lower
Kb. This trend seems to suggest that the binding constant of these compounds to AATT DNA
also influence the ability of these compounds to inhibit an enzyme that recognizes the same
DNA sequence. Not only does the Kb of these compounds influence enzyme inhibition, but it
provides insights to the relationship between structural variation between compounds and the
effect it has on DNA binding and enzyme inhibition.
37
5. CLEAVAGE INHIBITION OF OTHER RESTRICTION ENZYMES
5.1 Hind III Inhibition by Dication Compounds
With a database of Eco RI inhibition by several variations of dication structures
established, the next course of action was directed towards examining the inhibition of other
restriction enzymes by these dications. Hind III was the next restriction enzyme to be examined
due to the DNA sequence it recognizes and cleaves. The Hind III cognate site is similar to the
Eco RI cognate site but with the GC base on the end of Eco RI moved to the center in Hind III
(refer to Table 1.1). The first dication to be scrutinized by the Hind III restriction enzyme was
the control compound, DB75. DB75 is expected not to be a good inhibitor of Hind III due to the
difference in DNA sequence that the enzyme recognizes and the DNA sequence that DB75 binds
to.
The gel image results for the cleavage inhibition reaction of Hind III by DB75 gave an
unexpected DNA band patterns with no inhibition until very high compound concentration. As
the concentration of DB75 was increased there is no sign of inhibition and then after a certain
concentration there is a sudden sign of inhibition represented by the decrease and disappearance
of the linear pUC19 DNA band. This result was not surprising since it is known that at high
DB75 concentration the compound binds to secondary sites that do not always contain four or
more AT base pairs, therefore, it is possible that the inhibition of the Hind III enzyme is due to a
secondary binding, possibly intercalation. The IC50 of Hind III by DB75 is around 116μM, about
nine times the IC50 for Eco RI.
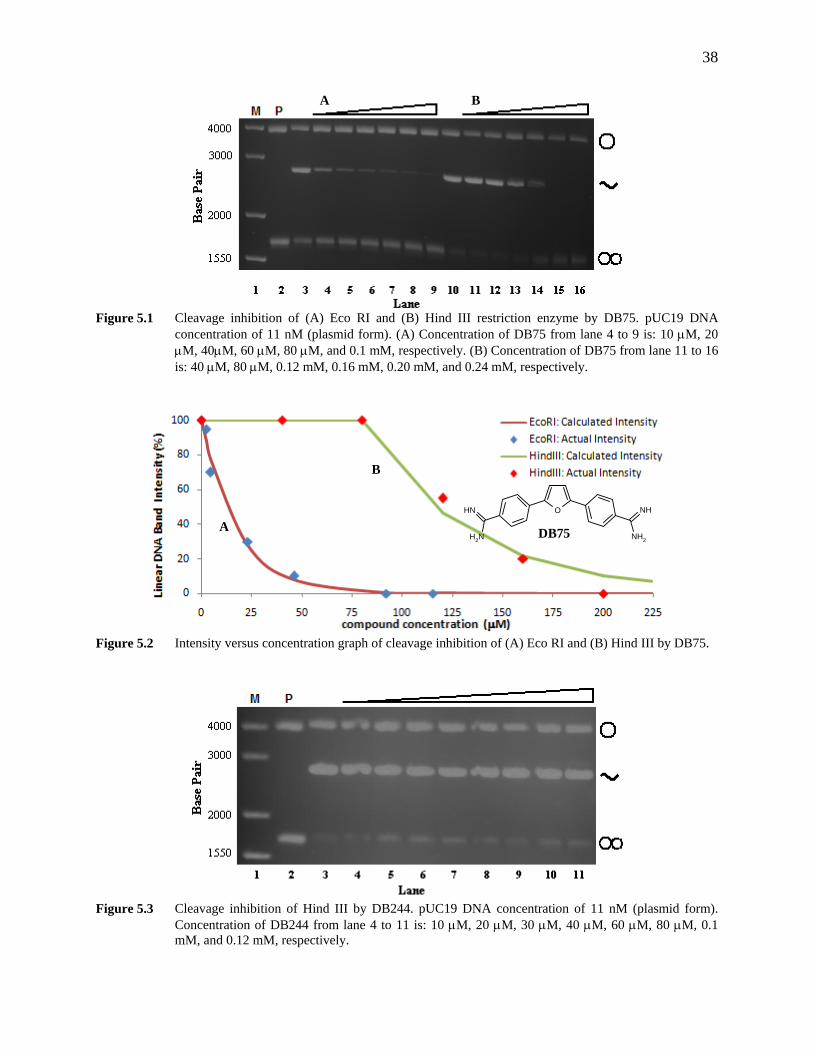
38
Figure 5.1 Cleavage inhibition of (A) Eco RI and (B) Hind III restriction enzyme by DB75. pUC19 DNA
concentration of 11 nM (plasmid form). (A) Concentration of DB75 from lane 4 to 9 is: 10 μM, 20 μM, 40μM, 60 μM, 80 μM, and 0.1 mM, respectively. (B) Concentration of DB75 from lane 11 to 16 is: 40 μM, 80 μM, 0.12 mM, 0.16 mM, 0.20 mM, and 0.24 mM, respectively.
Figure 5.2 Intensity versus concentration graph of cleavage inhibition of (A) Eco RI and (B) Hind III by DB75.
Figure 5.3 Cleavage inhibition of Hind III by DB244. pUC19 DNA concentration of 11 nM (plasmid form).
Concentration of DB244 from lane 4 to 11 is: 10 μM, 20 μM, 30 μM, 40 μM, 60 μM, 80 μM, 0.1 mM, and 0.12 mM, respectively.
O
NH2
NHNH
NH2DB75
A B
A
B
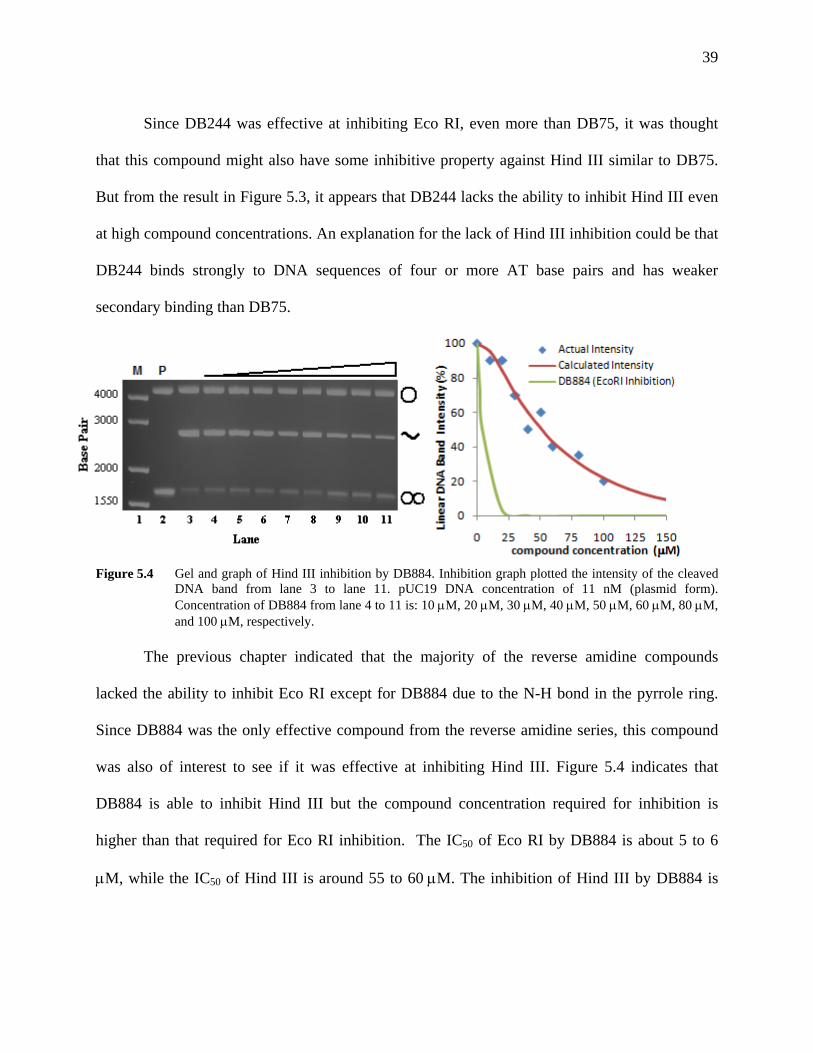
39
Since DB244 was effective at inhibiting Eco RI, even more than DB75, it was thought
that this compound might also have some inhibitive property against Hind III similar to DB75.
But from the result in Figure 5.3, it appears that DB244 lacks the ability to inhibit Hind III even
at high compound concentrations. An explanation for the lack of Hind III inhibition could be that
DB244 binds strongly to DNA sequences of four or more AT base pairs and has weaker
secondary binding than DB75.
Figure 5.4 Gel and graph of Hind III inhibition by DB884. Inhibition graph plotted the intensity of the cleaved DNA band from lane 3 to lane 11. pUC19 DNA concentration of 11 nM (plasmid form). Concentration of DB884 from lane 4 to 11 is: 10 μM, 20 μM, 30 μM, 40 μM, 50 μM, 60 μM, 80 μM, and 100 μM, respectively.
The previous chapter indicated that the majority of the reverse amidine compounds
lacked the ability to inhibit Eco RI except for DB884 due to the N-H bond in the pyrrole ring.
Since DB884 was the only effective compound from the reverse amidine series, this compound
was also of interest to see if it was effective at inhibiting Hind III. Figure 5.4 indicates that
DB884 is able to inhibit Hind III but the compound concentration required for inhibition is
higher than that required for Eco RI inhibition. The IC50 of Eco RI by DB884 is about 5 to 6
μM, while the IC50 of Hind III is around 55 to 60 μM. The inhibition of Hind III by DB884 is
40
similar to that of DB75; if the compound is able to inhibit the Hind III enzyme than a
significantly higher compound concentration is required.
Figure 5.5 Inhibition of Hind III by (A) netropsin and (B) pentamidine. pUC19 DNA concentration of 11 nM (plasmid form). (A) Concentration of netropsin from lane 4 to 8 is: 20 μM, 40 μM, 80 μM, 0.12 mM, and 0.16 mM, respectively. (B) Concentration of pentamidine from lane 4 to 9 is: 0.1 mM, 0.2 mM, 0.3 mM, 0.4 mM, 0.5 mM, and 0.6 mM, respectively.
Previous results showed that netropsin was effective at inhibiting Eco RI but Figure 5.5
reveals that netropsin and pentamidine are ineffective at inhibiting Hind III. It is not surprising
that netropsin is incapable of preventing Hind III from cleaving the Hind III recognition site
since this compound is highly selective for the AATT sequence with minimal secondary binding
and interaction property.
The results from this section clearly show that by separating an AT rich DNA sequence
by putting GC bases in between effects the dications ability to bind to DNA. For compounds that
are able to inhibit the Hind III enzyme, it is most likely done through secondary interactions such
as binding to a less favorable DNA sequence or intercalation due to the onset of inhibition at
higher levels of compound concentration. The possibility of inhibition by primary binding can be
ruled out since no inhibition or substantially low levels of inhibition were observed at lower
compound concentrations. For compounds like DB244 and netropsin, which bind very strongly
and specifically to AT rich sites and have very limited secondary binding, no inhibition of Hind
III was observed, even high compound concentration.
A B
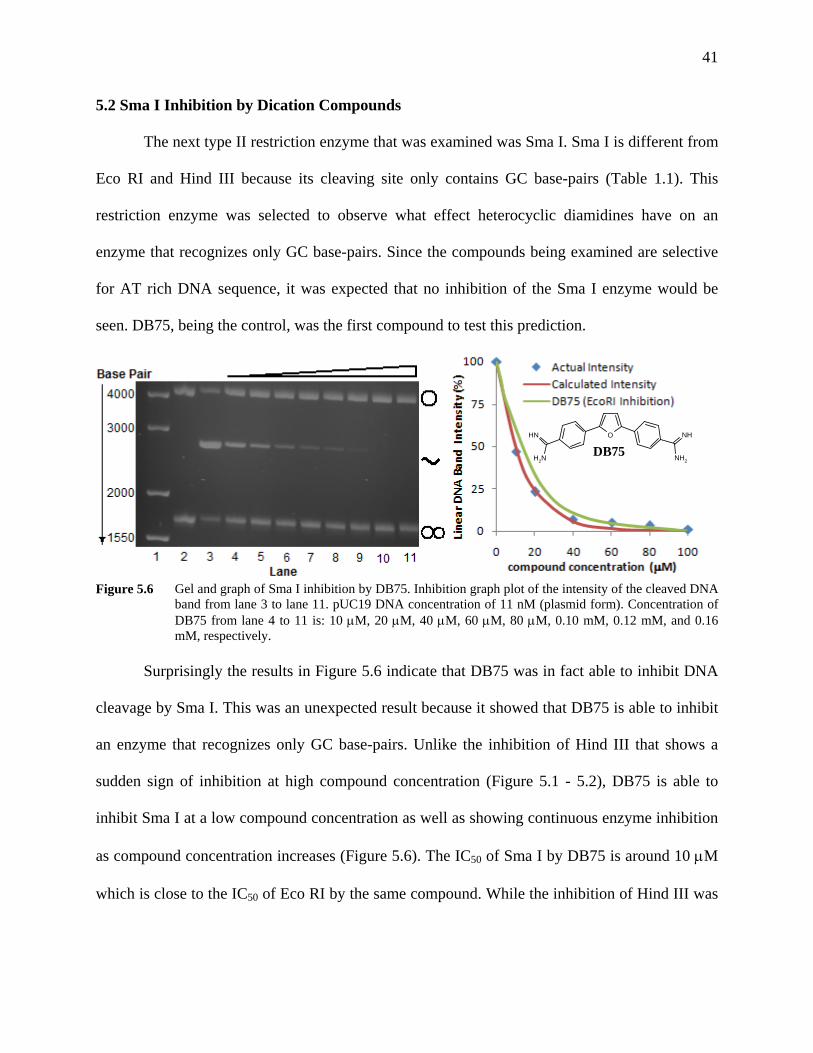
41
5.2 Sma I Inhibition by Dication Compounds
The next type II restriction enzyme that was examined was Sma I. Sma I is different from
Eco RI and Hind III because its cleaving site only contains GC base-pairs (Table 1.1). This
restriction enzyme was selected to observe what effect heterocyclic diamidines have on an
enzyme that recognizes only GC base-pairs. Since the compounds being examined are selective
for AT rich DNA sequence, it was expected that no inhibition of the Sma I enzyme would be
seen. DB75, being the control, was the first compound to test this prediction.
Figure 5.6 Gel and graph of Sma I inhibition by DB75. Inhibition graph plot of the intensity of the cleaved DNA band from lane 3 to lane 11. pUC19 DNA concentration of 11 nM (plasmid form). Concentration of DB75 from lane 4 to 11 is: 10 μM, 20 μM, 40 μM, 60 μM, 80 μM, 0.10 mM, 0.12 mM, and 0.16 mM, respectively.
Surprisingly the results in Figure 5.6 indicate that DB75 was in fact able to inhibit DNA
cleavage by Sma I. This was an unexpected result because it showed that DB75 is able to inhibit
an enzyme that recognizes only GC base-pairs. Unlike the inhibition of Hind III that shows a
sudden sign of inhibition at high compound concentration (Figure 5.1 - 5.2), DB75 is able to
inhibit Sma I at a low compound concentration as well as showing continuous enzyme inhibition
as compound concentration increases (Figure 5.6). The IC50 of Sma I by DB75 is around 10 μM
which is close to the IC50 of Eco RI by the same compound. While the inhibition of Hind III was
O
NH2
NHNH
NH2DB75
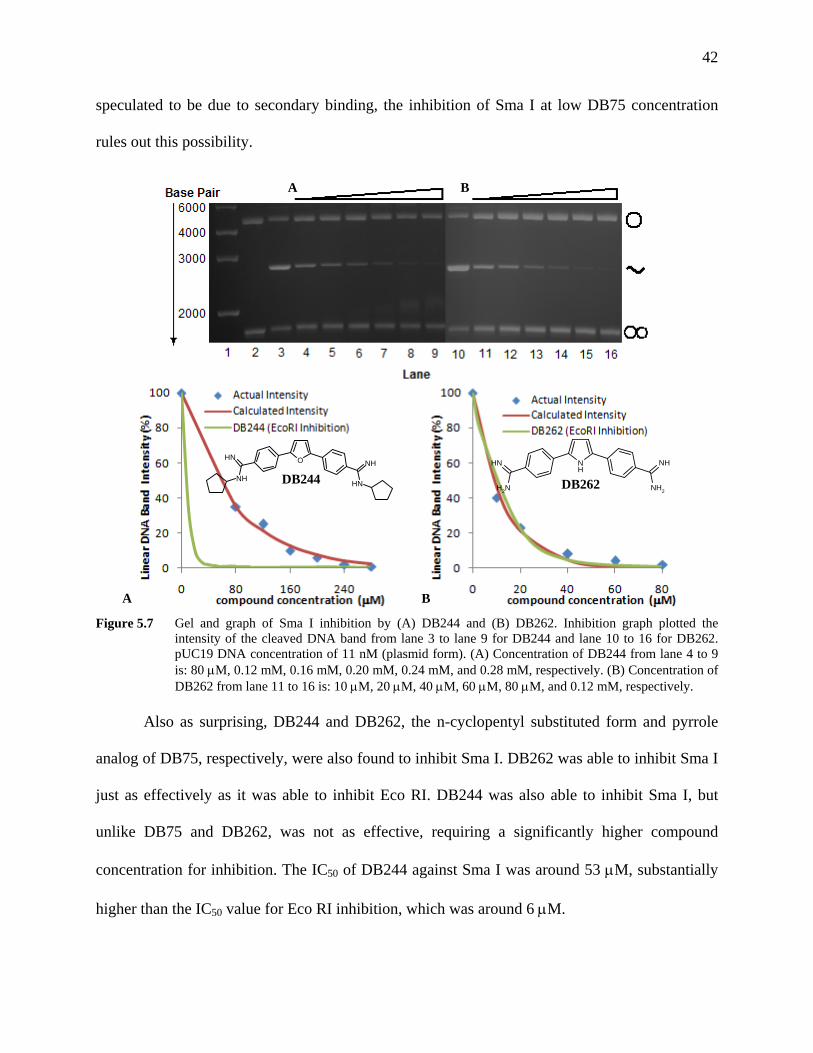
42
speculated to be due to secondary binding, the inhibition of Sma I at low DB75 concentration
rules out this possibility.
Figure 5.7 Gel and graph of Sma I inhibition by (A) DB244 and (B) DB262. Inhibition graph plotted the intensity of the cleaved DNA band from lane 3 to lane 9 for DB244 and lane 10 to 16 for DB262. pUC19 DNA concentration of 11 nM (plasmid form). (A) Concentration of DB244 from lane 4 to 9 is: 80 μM, 0.12 mM, 0.16 mM, 0.20 mM, 0.24 mM, and 0.28 mM, respectively. (B) Concentration of DB262 from lane 11 to 16 is: 10 μM, 20 μM, 40 μM, 60 μM, 80 μM, and 0.12 mM, respectively.
Also as surprising, DB244 and DB262, the n-cyclopentyl substituted form and pyrrole
analog of DB75, respectively, were also found to inhibit Sma I. DB262 was able to inhibit Sma I
just as effectively as it was able to inhibit Eco RI. DB244 was also able to inhibit Sma I, but
unlike DB75 and DB262, was not as effective, requiring a significantly higher compound
concentration for inhibition. The IC50 of DB244 against Sma I was around 53 μM, substantially
higher than the IC50 value for Eco RI inhibition, which was around 6 μM.
A B
O NHNH
NHNH
NH
NH2
NHNH
NH2
DB244 DB262
A B
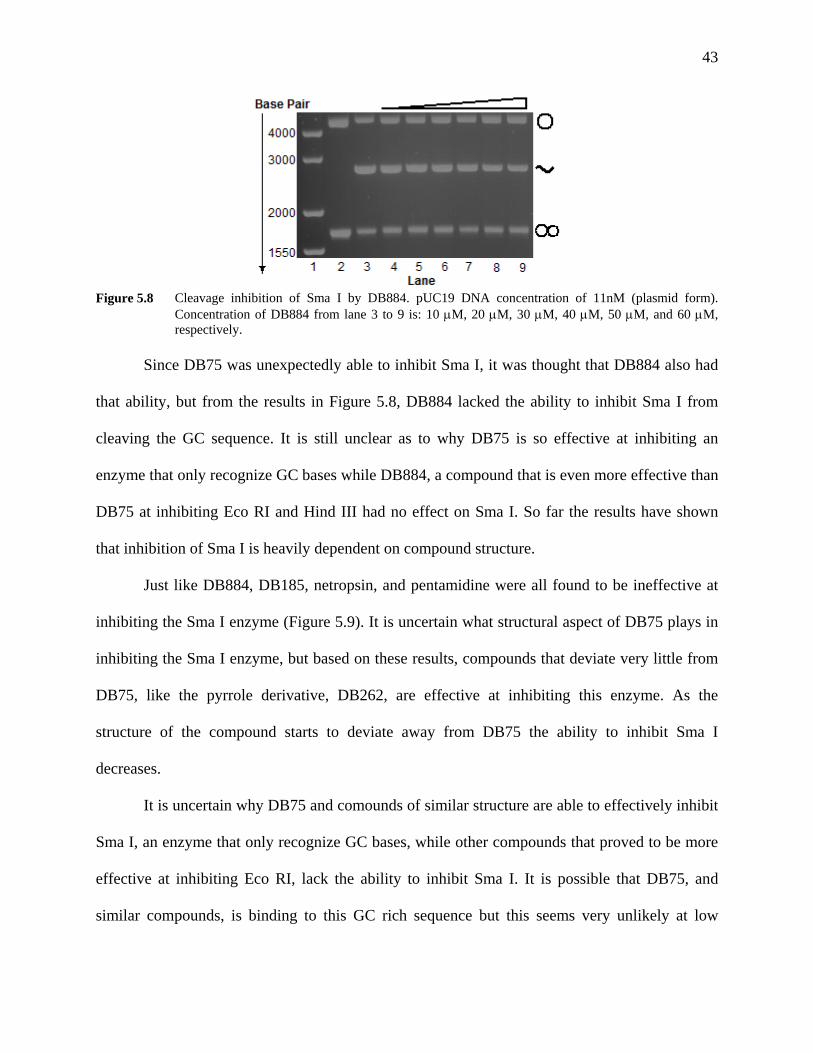
43
Figure 5.8 Cleavage inhibition of Sma I by DB884. pUC19 DNA concentration of 11nM (plasmid form). Concentration of DB884 from lane 3 to 9 is: 10 μM, 20 μM, 30 μM, 40 μM, 50 μM, and 60 μM, respectively.
Since DB75 was unexpectedly able to inhibit Sma I, it was thought that DB884 also had
that ability, but from the results in Figure 5.8, DB884 lacked the ability to inhibit Sma I from
cleaving the GC sequence. It is still unclear as to why DB75 is so effective at inhibiting an
enzyme that only recognize GC bases while DB884, a compound that is even more effective than
DB75 at inhibiting Eco RI and Hind III had no effect on Sma I. So far the results have shown
that inhibition of Sma I is heavily dependent on compound structure.
Just like DB884, DB185, netropsin, and pentamidine were all found to be ineffective at
inhibiting the Sma I enzyme (Figure 5.9). It is uncertain what structural aspect of DB75 plays in
inhibiting the Sma I enzyme, but based on these results, compounds that deviate very little from
DB75, like the pyrrole derivative, DB262, are effective at inhibiting this enzyme. As the
structure of the compound starts to deviate away from DB75 the ability to inhibit Sma I
decreases.
It is uncertain why DB75 and comounds of similar structure are able to effectively inhibit
Sma I, an enzyme that only recognize GC bases, while other compounds that proved to be more
effective at inhibiting Eco RI, lack the ability to inhibit Sma I. It is possible that DB75, and
similar compounds, is binding to this GC rich sequence but this seems very unlikely at low
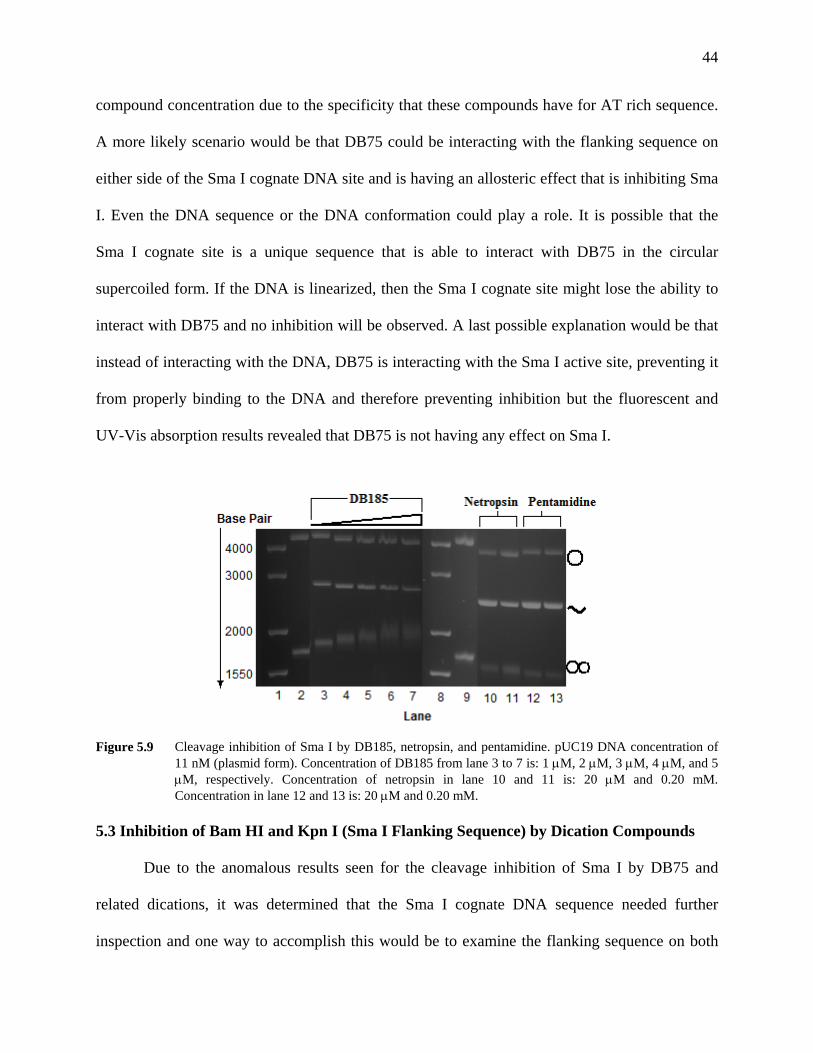
44
compound concentration due to the specificity that these compounds have for AT rich sequence.
A more likely scenario would be that DB75 could be interacting with the flanking sequence on
either side of the Sma I cognate DNA site and is having an allosteric effect that is inhibiting Sma
I. Even the DNA sequence or the DNA conformation could play a role. It is possible that the
Sma I cognate site is a unique sequence that is able to interact with DB75 in the circular
supercoiled form. If the DNA is linearized, then the Sma I cognate site might lose the ability to
interact with DB75 and no inhibition will be observed. A last possible explanation would be that
instead of interacting with the DNA, DB75 is interacting with the Sma I active site, preventing it
from properly binding to the DNA and therefore preventing inhibition but the fluorescent and
UV-Vis absorption results revealed that DB75 is not having any effect on Sma I.
Figure 5.9 Cleavage inhibition of Sma I by DB185, netropsin, and pentamidine. pUC19 DNA concentration of 11 nM (plasmid form). Concentration of DB185 from lane 3 to 7 is: 1 μM, 2 μM, 3 μM, 4 μM, and 5 μM, respectively. Concentration of netropsin in lane 10 and 11 is: 20 μM and 0.20 mM. Concentration in lane 12 and 13 is: 20 μM and 0.20 mM.
5.3 Inhibition of Bam HI and Kpn I (Sma I Flanking Sequence) by Dication Compounds
Due to the anomalous results seen for the cleavage inhibition of Sma I by DB75 and
related dications, it was determined that the Sma I cognate DNA sequence needed further
inspection and one way to accomplish this would be to examine the flanking sequence on both
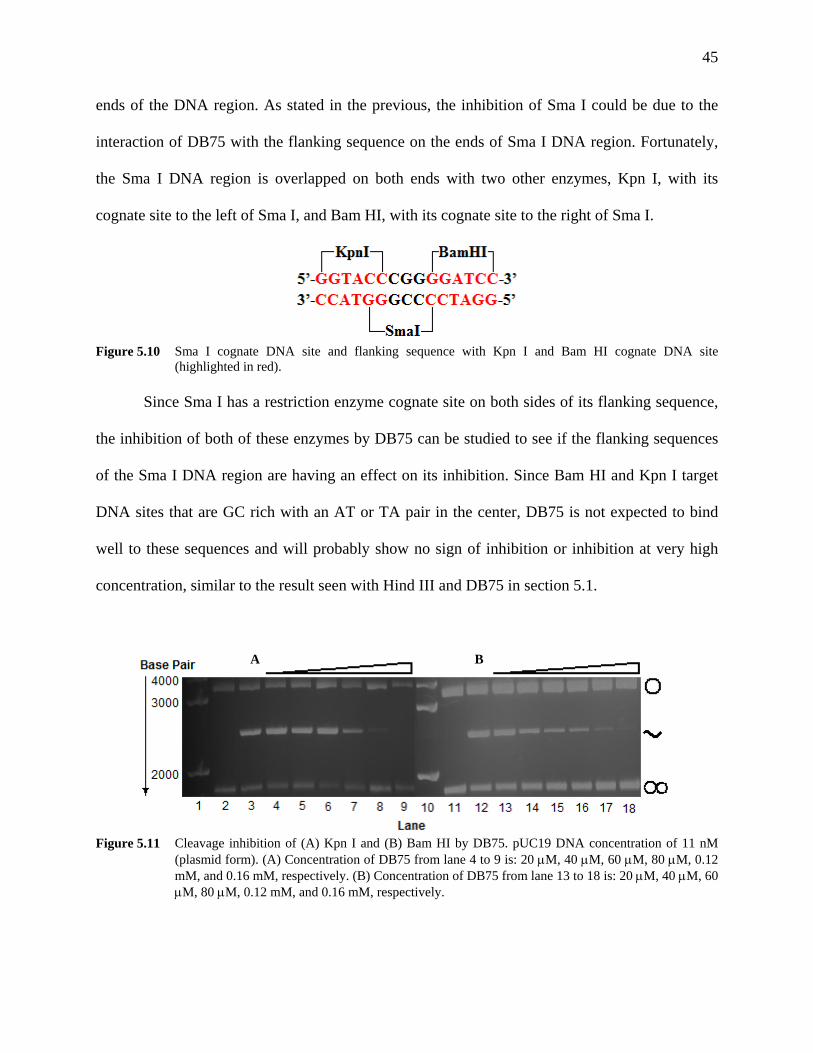
45
ends of the DNA region. As stated in the previous, the inhibition of Sma I could be due to the
interaction of DB75 with the flanking sequence on the ends of Sma I DNA region. Fortunately,
the Sma I DNA region is overlapped on both ends with two other enzymes, Kpn I, with its
cognate site to the left of Sma I, and Bam HI, with its cognate site to the right of Sma I.
Figure 5.10 Sma I cognate DNA site and flanking sequence with Kpn I and Bam HI cognate DNA site
(highlighted in red). Since Sma I has a restriction enzyme cognate site on both sides of its flanking sequence,
the inhibition of both of these enzymes by DB75 can be studied to see if the flanking sequences
of the Sma I DNA region are having an effect on its inhibition. Since Bam HI and Kpn I target
DNA sites that are GC rich with an AT or TA pair in the center, DB75 is not expected to bind
well to these sequences and will probably show no sign of inhibition or inhibition at very high
concentration, similar to the result seen with Hind III and DB75 in section 5.1.
Figure 5.11 Cleavage inhibition of (A) Kpn I and (B) Bam HI by DB75. pUC19 DNA concentration of 11 nM
(plasmid form). (A) Concentration of DB75 from lane 4 to 9 is: 20 μM, 40 μM, 60 μM, 80 μM, 0.12 mM, and 0.16 mM, respectively. (B) Concentration of DB75 from lane 13 to 18 is: 20 μM, 40 μM, 60 μM, 80 μM, 0.12 mM, and 0.16 mM, respectively.
A B
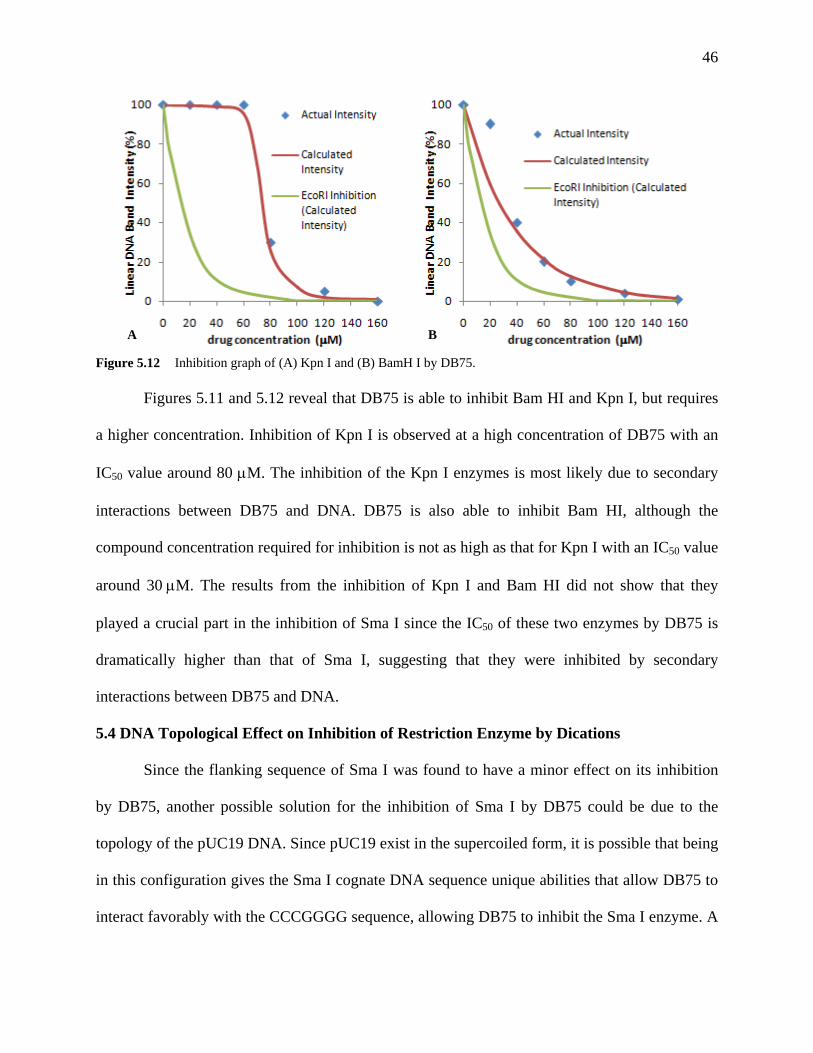
46
Figure 5.12 Inhibition graph of (A) Kpn I and (B) BamH I by DB75. Figures 5.11 and 5.12 reveal that DB75 is able to inhibit Bam HI and Kpn I, but requires
a higher concentration. Inhibition of Kpn I is observed at a high concentration of DB75 with an
IC50 value around 80 μM. The inhibition of the Kpn I enzymes is most likely due to secondary
interactions between DB75 and DNA. DB75 is also able to inhibit Bam HI, although the
compound concentration required for inhibition is not as high as that for Kpn I with an IC50 value
around 30 μM. The results from the inhibition of Kpn I and Bam HI did not show that they
played a crucial part in the inhibition of Sma I since the IC50 of these two enzymes by DB75 is
dramatically higher than that of Sma I, suggesting that they were inhibited by secondary
interactions between DB75 and DNA.
5.4 DNA Topological Effect on Inhibition of Restriction Enzyme by Dications
Since the flanking sequence of Sma I was found to have a minor effect on its inhibition
by DB75, another possible solution for the inhibition of Sma I by DB75 could be due to the
topology of the pUC19 DNA. Since pUC19 exist in the supercoiled form, it is possible that being
in this configuration gives the Sma I cognate DNA sequence unique abilities that allow DB75 to
interact favorably with the CCCGGGG sequence, allowing DB75 to inhibit the Sma I enzyme. A
A B
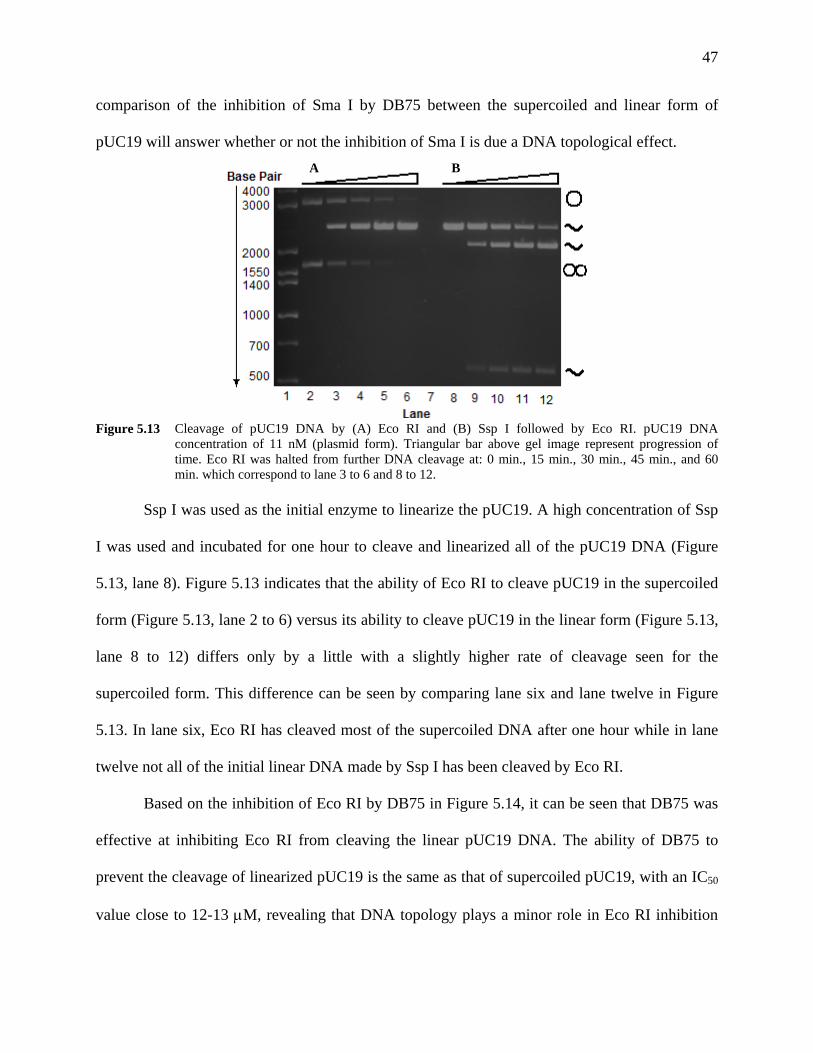
47
comparison of the inhibition of Sma I by DB75 between the supercoiled and linear form of
pUC19 will answer whether or not the inhibition of Sma I is due a DNA topological effect.
Figure 5.13 Cleavage of pUC19 DNA by (A) Eco RI and (B) Ssp I followed by Eco RI. pUC19 DNA
concentration of 11 nM (plasmid form). Triangular bar above gel image represent progression of time. Eco RI was halted from further DNA cleavage at: 0 min., 15 min., 30 min., 45 min., and 60 min. which correspond to lane 3 to 6 and 8 to 12.
Ssp I was used as the initial enzyme to linearize the pUC19. A high concentration of Ssp
I was used and incubated for one hour to cleave and linearized all of the pUC19 DNA (Figure
5.13, lane 8). Figure 5.13 indicates that the ability of Eco RI to cleave pUC19 in the supercoiled
form (Figure 5.13, lane 2 to 6) versus its ability to cleave pUC19 in the linear form (Figure 5.13,
lane 8 to 12) differs only by a little with a slightly higher rate of cleavage seen for the
supercoiled form. This difference can be seen by comparing lane six and lane twelve in Figure
5.13. In lane six, Eco RI has cleaved most of the supercoiled DNA after one hour while in lane
twelve not all of the initial linear DNA made by Ssp I has been cleaved by Eco RI.
Based on the inhibition of Eco RI by DB75 in Figure 5.14, it can be seen that DB75 was
effective at inhibiting Eco RI from cleaving the linear pUC19 DNA. The ability of DB75 to
prevent the cleavage of linearized pUC19 is the same as that of supercoiled pUC19, with an IC50
value close to 12-13 μM, revealing that DNA topology plays a minor role in Eco RI inhibition
A B
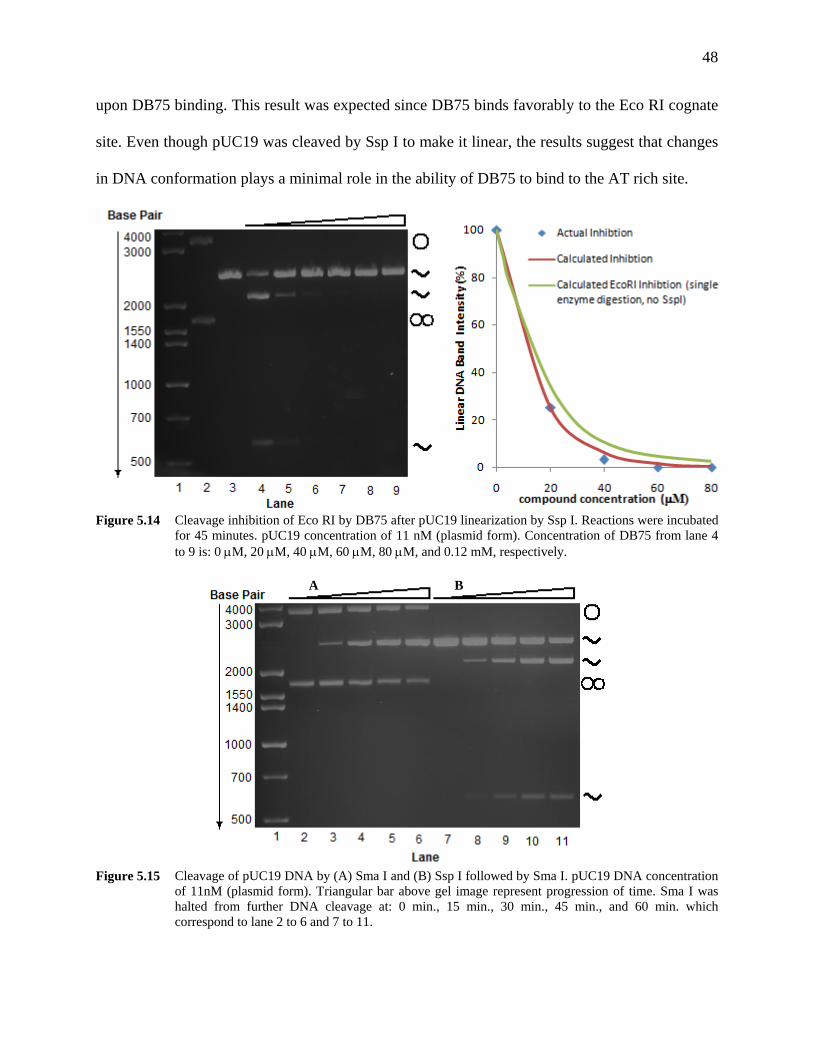
48
upon DB75 binding. This result was expected since DB75 binds favorably to the Eco RI cognate
site. Even though pUC19 was cleaved by Ssp I to make it linear, the results suggest that changes
in DNA conformation plays a minimal role in the ability of DB75 to bind to the AT rich site.
Figure 5.14 Cleavage inhibition of Eco RI by DB75 after pUC19 linearization by Ssp I. Reactions were incubated
for 45 minutes. pUC19 concentration of 11 nM (plasmid form). Concentration of DB75 from lane 4 to 9 is: 0 μM, 20 μM, 40 μM, 60 μM, 80 μM, and 0.12 mM, respectively.
Figure 5.15 Cleavage of pUC19 DNA by (A) Sma I and (B) Ssp I followed by Sma I. pUC19 DNA concentration
of 11nM (plasmid form). Triangular bar above gel image represent progression of time. Sma I was halted from further DNA cleavage at: 0 min., 15 min., 30 min., 45 min., and 60 min. which correspond to lane 2 to 6 and 7 to 11.
A B
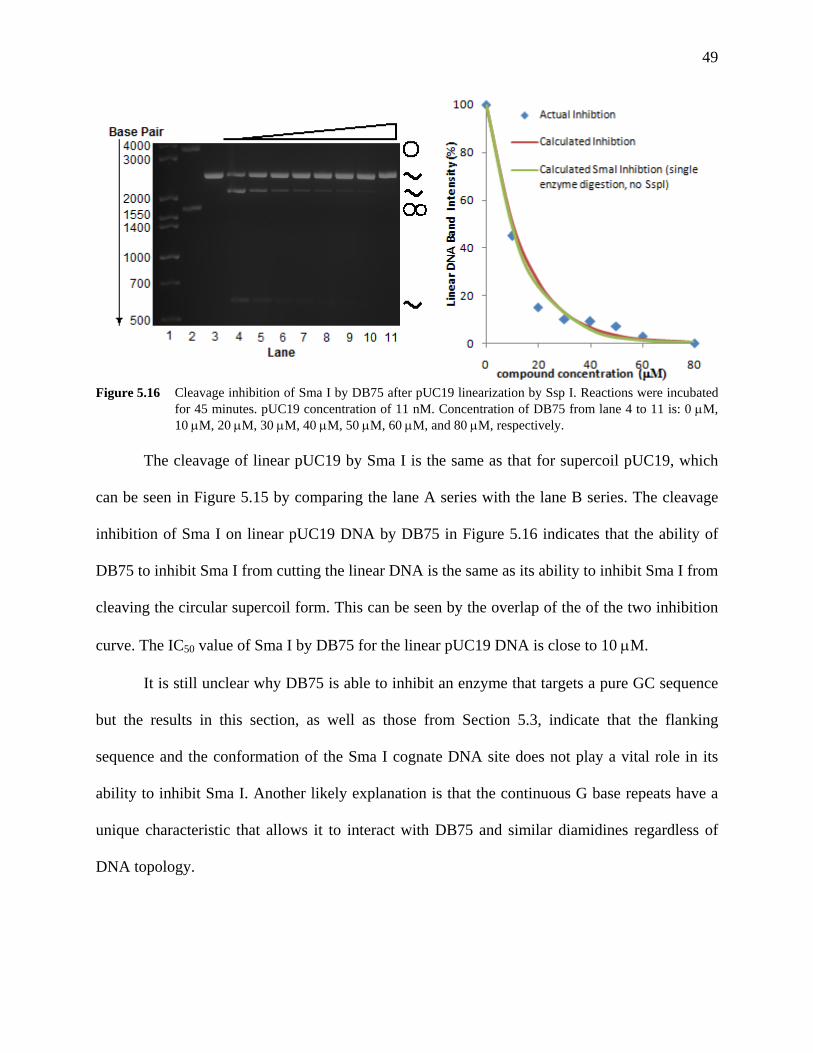
49
Figure 5.16 Cleavage inhibition of Sma I by DB75 after pUC19 linearization by Ssp I. Reactions were incubated
for 45 minutes. pUC19 concentration of 11 nM. Concentration of DB75 from lane 4 to 11 is: 0 μM, 10 μM, 20 μM, 30 μM, 40 μM, 50 μM, 60 μM, and 80 μM, respectively.
The cleavage of linear pUC19 by Sma I is the same as that for supercoil pUC19, which
can be seen in Figure 5.15 by comparing the lane A series with the lane B series. The cleavage
inhibition of Sma I on linear pUC19 DNA by DB75 in Figure 5.16 indicates that the ability of
DB75 to inhibit Sma I from cutting the linear DNA is the same as its ability to inhibit Sma I from
cleaving the circular supercoil form. This can be seen by the overlap of the of the two inhibition
curve. The IC50 value of Sma I by DB75 for the linear pUC19 DNA is close to 10 μM.
It is still unclear why DB75 is able to inhibit an enzyme that targets a pure GC sequence
but the results in this section, as well as those from Section 5.3, indicate that the flanking
sequence and the conformation of the Sma I cognate DNA site does not play a vital role in its
ability to inhibit Sma I. Another likely explanation is that the continuous G base repeats have a
unique characteristic that allows it to interact with DB75 and similar diamidines regardless of
DNA topology.
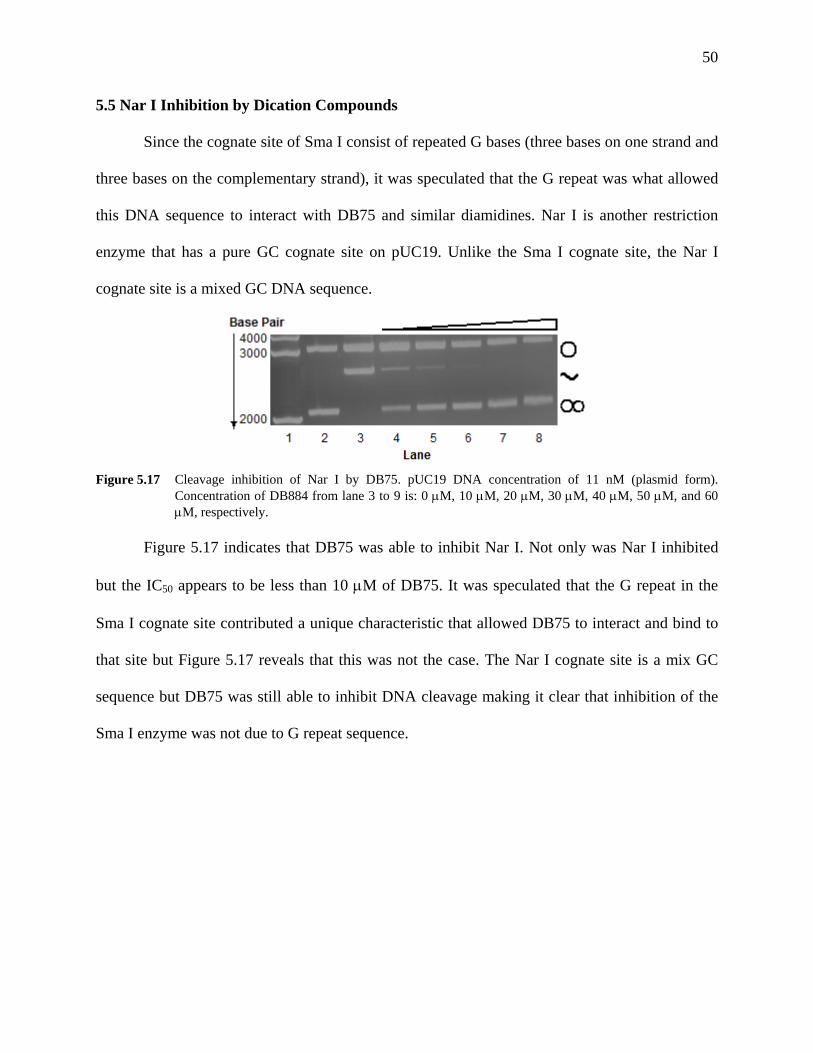
50
5.5 Nar I Inhibition by Dication Compounds
Since the cognate site of Sma I consist of repeated G bases (three bases on one strand and
three bases on the complementary strand), it was speculated that the G repeat was what allowed
this DNA sequence to interact with DB75 and similar diamidines. Nar I is another restriction
enzyme that has a pure GC cognate site on pUC19. Unlike the Sma I cognate site, the Nar I
cognate site is a mixed GC DNA sequence.
Figure 5.17 Cleavage inhibition of Nar I by DB75. pUC19 DNA concentration of 11 nM (plasmid form).
Concentration of DB884 from lane 3 to 9 is: 0 μM, 10 μM, 20 μM, 30 μM, 40 μM, 50 μM, and 60 μM, respectively.
Figure 5.17 indicates that DB75 was able to inhibit Nar I. Not only was Nar I inhibited
but the IC50 appears to be less than 10 μM of DB75. It was speculated that the G repeat in the
Sma I cognate site contributed a unique characteristic that allowed DB75 to interact and bind to
that site but Figure 5.17 reveals that this was not the case. The Nar I cognate site is a mix GC
sequence but DB75 was still able to inhibit DNA cleavage making it clear that inhibition of the
Sma I enzyme was not due to G repeat sequence.
51
6. DICATION BINDING AND DNA THERMAL MELTING (TM) BY
UV SPECTROSCOPY
The results obtained from cleavage inhibition reactions indicated that some of the
dication compounds tested against restriction enzymes were ineffective at preventing the enzyme
from cleaving DNA, especially the restriction enzyme Eco RI. One possible explanation why
these compounds were ineffective could be that they simply do not bind to DNA or that they do
bind to DNA but at a site different from the Eco RI recognition site. One approach to answering
this question would be to examine the binding of compound onto DNA by using the DNA
thermal melting technique. This method was performed in the absence of any restriction enzyme
to only examine interactions taking place between compound and DNA to obtain ΔTm values.
Questions regarding stoichiometry and compound-DNA complex stability were also addressed
using this method, along with CD.
The first compound to study DNA binding with this method is DB75, the control
compound and a compound that is known to bind to the AATT DNA site as well as being able to
inhibit Eco RI. The Eco RI DNA sequence (sequence and base-pair can be reviewed in Section
2.5 in Chapter 2) was chosen to study how Tm is affected by compound binding.
Each Tm graph in Figure 6.1 shows two different curves for the Eco RI DNA sequence
and the DNA sequence in the presences of compound. This difference between the two Tm
curves shows that there is an interaction taking place between the compound and DNA upon its
addition. The increase in Tm from the compound absent sample to the compound present sample
would suggest the compound is stabilizing the DNA duplex, therefore, increasing the
temperature needed to separate the DNA duplex. The ΔTm for DNA with DB75 is about 10 oC.
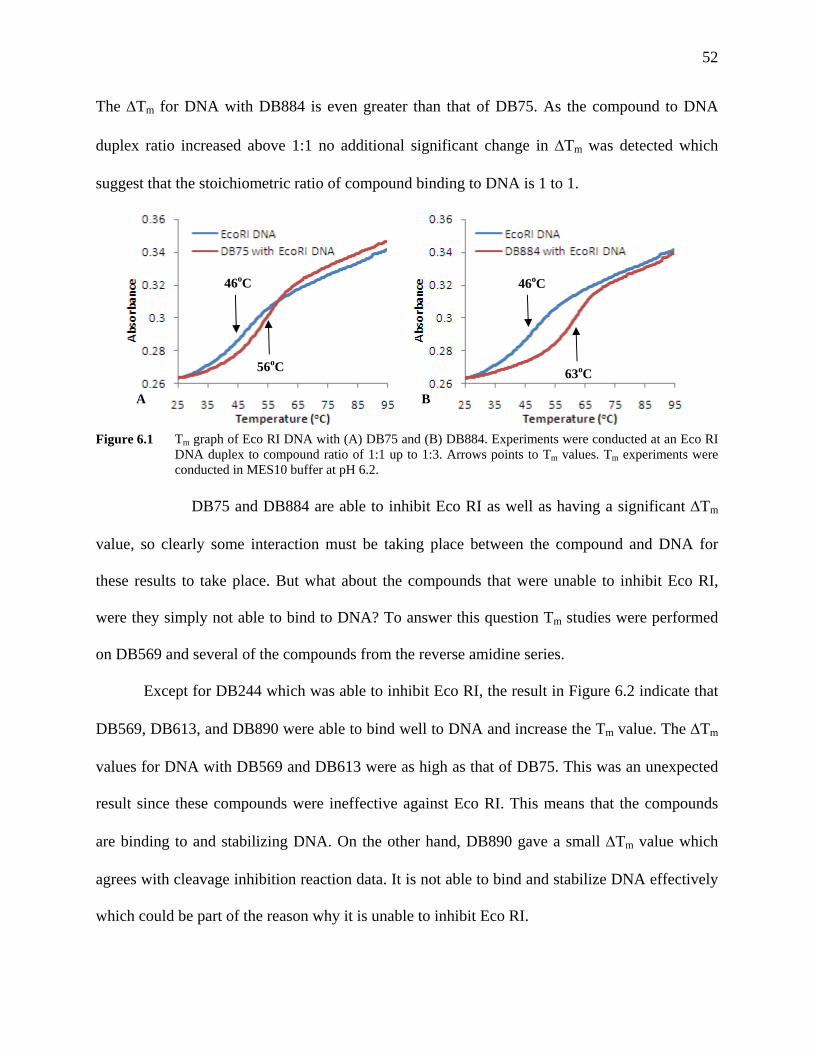
52
The ΔTm for DNA with DB884 is even greater than that of DB75. As the compound to DNA
duplex ratio increased above 1:1 no additional significant change in ΔTm was detected which
suggest that the stoichiometric ratio of compound binding to DNA is 1 to 1.
Figure 6.1 Tm graph of Eco RI DNA with (A) DB75 and (B) DB884. Experiments were conducted at an Eco RI
DNA duplex to compound ratio of 1:1 up to 1:3. Arrows points to Tm values. Tm experiments were conducted in MES10 buffer at pH 6.2.
DB75 and DB884 are able to inhibit Eco RI as well as having a significant ΔTm
value, so clearly some interaction must be taking place between the compound and DNA for
these results to take place. But what about the compounds that were unable to inhibit Eco RI,
were they simply not able to bind to DNA? To answer this question Tm studies were performed
on DB569 and several of the compounds from the reverse amidine series.
Except for DB244 which was able to inhibit Eco RI, the result in Figure 6.2 indicate that
DB569, DB613, and DB890 were able to bind well to DNA and increase the Tm value. The ΔTm
values for DNA with DB569 and DB613 were as high as that of DB75. This was an unexpected
result since these compounds were ineffective against Eco RI. This means that the compounds
are binding to and stabilizing DNA. On the other hand, DB890 gave a small ΔTm value which
agrees with cleavage inhibition reaction data. It is not able to bind and stabilize DNA effectively
which could be part of the reason why it is unable to inhibit Eco RI.
A B
46oC
56oC
46oC
63oC
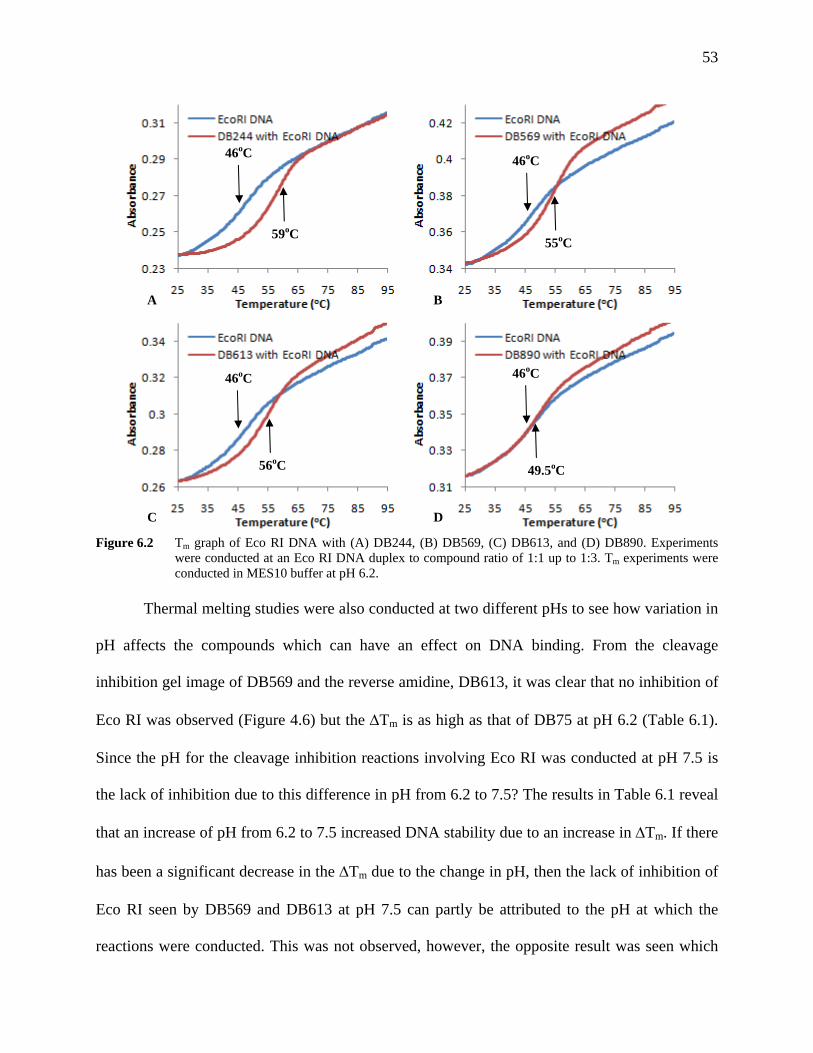
53
Figure 6.2 Tm graph of Eco RI DNA with (A) DB244, (B) DB569, (C) DB613, and (D) DB890. Experiments
were conducted at an Eco RI DNA duplex to compound ratio of 1:1 up to 1:3. Tm experiments were conducted in MES10 buffer at pH 6.2.
Thermal melting studies were also conducted at two different pHs to see how variation in
pH affects the compounds which can have an effect on DNA binding. From the cleavage
inhibition gel image of DB569 and the reverse amidine, DB613, it was clear that no inhibition of
Eco RI was observed (Figure 4.6) but the ΔTm is as high as that of DB75 at pH 6.2 (Table 6.1).
Since the pH for the cleavage inhibition reactions involving Eco RI was conducted at pH 7.5 is
the lack of inhibition due to this difference in pH from 6.2 to 7.5? The results in Table 6.1 reveal
that an increase of pH from 6.2 to 7.5 increased DNA stability due to an increase in ΔTm. If there
has been a significant decrease in the ΔTm due to the change in pH, then the lack of inhibition of
Eco RI seen by DB569 and DB613 at pH 7.5 can partly be attributed to the pH at which the
reactions were conducted. This was not observed, however, the opposite result was seen which
46oC 46oC
46oC 46oC
59oC 55oC
56oC 49.5oC
A B
C D
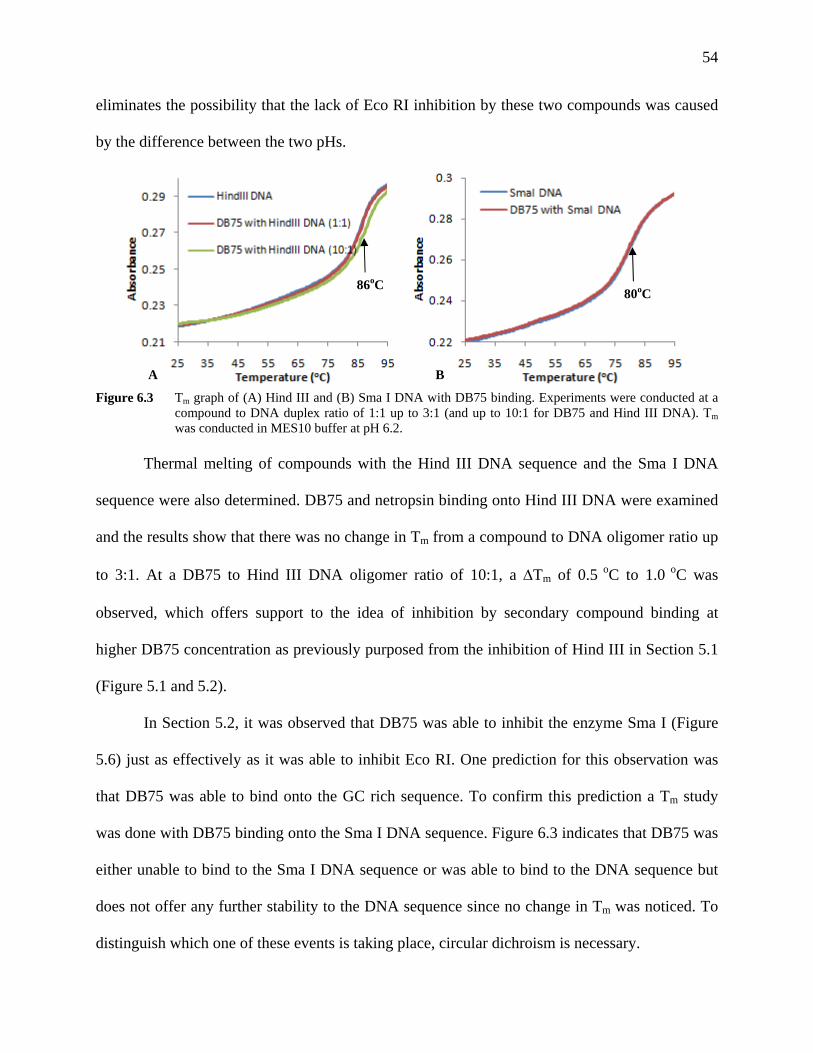
54
eliminates the possibility that the lack of Eco RI inhibition by these two compounds was caused
by the difference between the two pHs.
Figure 6.3 Tm graph of (A) Hind III and (B) Sma I DNA with DB75 binding. Experiments were conducted at a
compound to DNA duplex ratio of 1:1 up to 3:1 (and up to 10:1 for DB75 and Hind III DNA). Tm was conducted in MES10 buffer at pH 6.2.
Thermal melting of compounds with the Hind III DNA sequence and the Sma I DNA
sequence were also determined. DB75 and netropsin binding onto Hind III DNA were examined
and the results show that there was no change in Tm from a compound to DNA oligomer ratio up
to 3:1. At a DB75 to Hind III DNA oligomer ratio of 10:1, a ΔTm of 0.5 oC to 1.0 oC was
observed, which offers support to the idea of inhibition by secondary compound binding at
higher DB75 concentration as previously purposed from the inhibition of Hind III in Section 5.1
(Figure 5.1 and 5.2).
In Section 5.2, it was observed that DB75 was able to inhibit the enzyme Sma I (Figure
5.6) just as effectively as it was able to inhibit Eco RI. One prediction for this observation was
that DB75 was able to bind onto the GC rich sequence. To confirm this prediction a Tm study
was done with DB75 binding onto the Sma I DNA sequence. Figure 6.3 indicates that DB75 was
either unable to bind to the Sma I DNA sequence or was able to bind to the DNA sequence but
does not offer any further stability to the DNA sequence since no change in Tm was noticed. To
distinguish which one of these events is taking place, circular dichroism is necessary.
86oC 80oC
A B

55
Table 6.1 ΔTm of compounds binding onto Eco RI DNA sequence
Eco RI DNA Oligomer Sequence Tm = 46.0oC (MES10, pH 6.2)
Eco RI DNA Oligomer Sequence Tm = 42.0 oC (Tris10, pH 7.5)
compound
ΔTm (oC)
ΔTm (oC)
DB75
10.5
10.0 DB75 12.5 (10:1) / 15.0 (20:1) --
DB244 13.0 -- DB262 10.0 -- DB320 4.0 -- DB569 9.0 13.5 DB613 10.0 12.5 DB884 17.0 19.5 DB890 3.5 --
Netropsin 16.5 -- Pentamidine 4.0 --
Tm of compound study was conducted at compound to DNA binding site ratio up to 3:1.
The results obtained from the thermal melting study of compound binding to DNA is
compiled in the table above. Examining Table 6.1 indicates that a relationship exist between the
ΔTm and IC50 similar to the relationship between Kb values and IC50. Compounds with lower IC50
tend to have higher ΔTm values and the opposite is seen for compounds with higher IC50. The
relationship between these three factors can be explained by examining the correlation between
compound binding to DNA and the stability that binding offer to the DNA sequence. A
compound with a high Kb binds well to DNA and tends to offer more stability to DNA. It is this
enhanced stability of DNA through compound binding that sometimes plays a role in the enzyme
inhibition mechanism. Since most restriction enzymes must cause a conformational change to the
cognate DNA sequence before DNA cleavage can be achieved, a compound that binds to DNA
and keeps it in a rigid structure would make it harder for the enzyme to manipulate the DNA
conformation, therefore, preventing DNA cleavage.
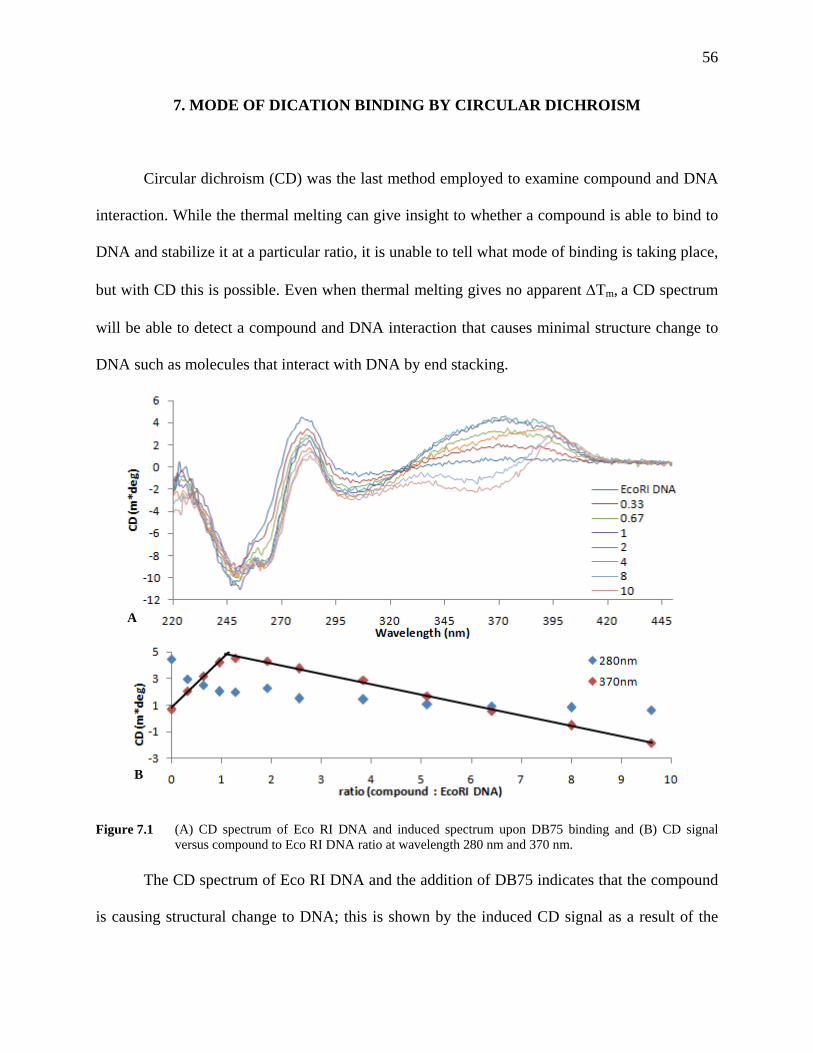
56
7. MODE OF DICATION BINDING BY CIRCULAR DICHROISM
Circular dichroism (CD) was the last method employed to examine compound and DNA
interaction. While the thermal melting can give insight to whether a compound is able to bind to
DNA and stabilize it at a particular ratio, it is unable to tell what mode of binding is taking place,
but with CD this is possible. Even when thermal melting gives no apparent ΔTm, a CD spectrum
will be able to detect a compound and DNA interaction that causes minimal structure change to
DNA such as molecules that interact with DNA by end stacking.
Figure 7.1 (A) CD spectrum of Eco RI DNA and induced spectrum upon DB75 binding and (B) CD signal versus compound to Eco RI DNA ratio at wavelength 280 nm and 370 nm.
The CD spectrum of Eco RI DNA and the addition of DB75 indicates that the compound
is causing structural change to DNA; this is shown by the induced CD signal as a result of the
A
B
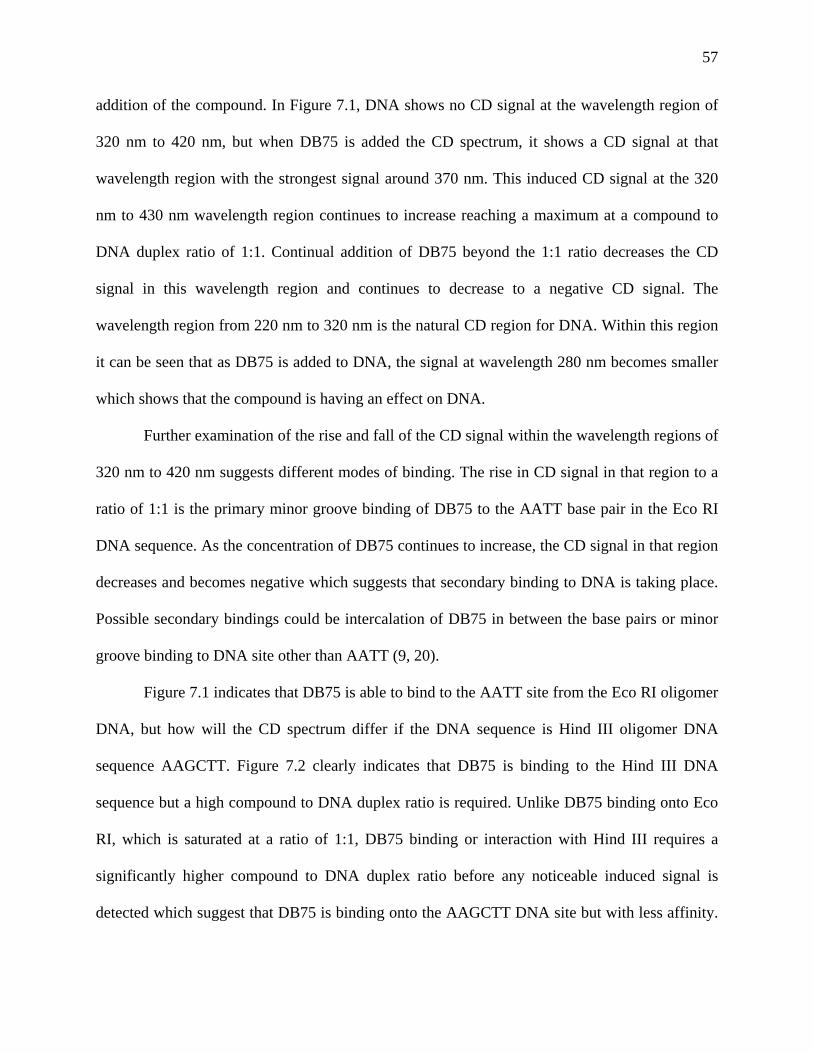
57
addition of the compound. In Figure 7.1, DNA shows no CD signal at the wavelength region of
320 nm to 420 nm, but when DB75 is added the CD spectrum, it shows a CD signal at that
wavelength region with the strongest signal around 370 nm. This induced CD signal at the 320
nm to 430 nm wavelength region continues to increase reaching a maximum at a compound to
DNA duplex ratio of 1:1. Continual addition of DB75 beyond the 1:1 ratio decreases the CD
signal in this wavelength region and continues to decrease to a negative CD signal. The
wavelength region from 220 nm to 320 nm is the natural CD region for DNA. Within this region
it can be seen that as DB75 is added to DNA, the signal at wavelength 280 nm becomes smaller
which shows that the compound is having an effect on DNA.
Further examination of the rise and fall of the CD signal within the wavelength regions of
320 nm to 420 nm suggests different modes of binding. The rise in CD signal in that region to a
ratio of 1:1 is the primary minor groove binding of DB75 to the AATT base pair in the Eco RI
DNA sequence. As the concentration of DB75 continues to increase, the CD signal in that region
decreases and becomes negative which suggests that secondary binding to DNA is taking place.
Possible secondary bindings could be intercalation of DB75 in between the base pairs or minor
groove binding to DNA site other than AATT (9, 20).
Figure 7.1 indicates that DB75 is able to bind to the AATT site from the Eco RI oligomer
DNA, but how will the CD spectrum differ if the DNA sequence is Hind III oligomer DNA
sequence AAGCTT. Figure 7.2 clearly indicates that DB75 is binding to the Hind III DNA
sequence but a high compound to DNA duplex ratio is required. Unlike DB75 binding onto Eco
RI, which is saturated at a ratio of 1:1, DB75 binding or interaction with Hind III requires a
significantly higher compound to DNA duplex ratio before any noticeable induced signal is
detected which suggest that DB75 is binding onto the AAGCTT DNA site but with less affinity.
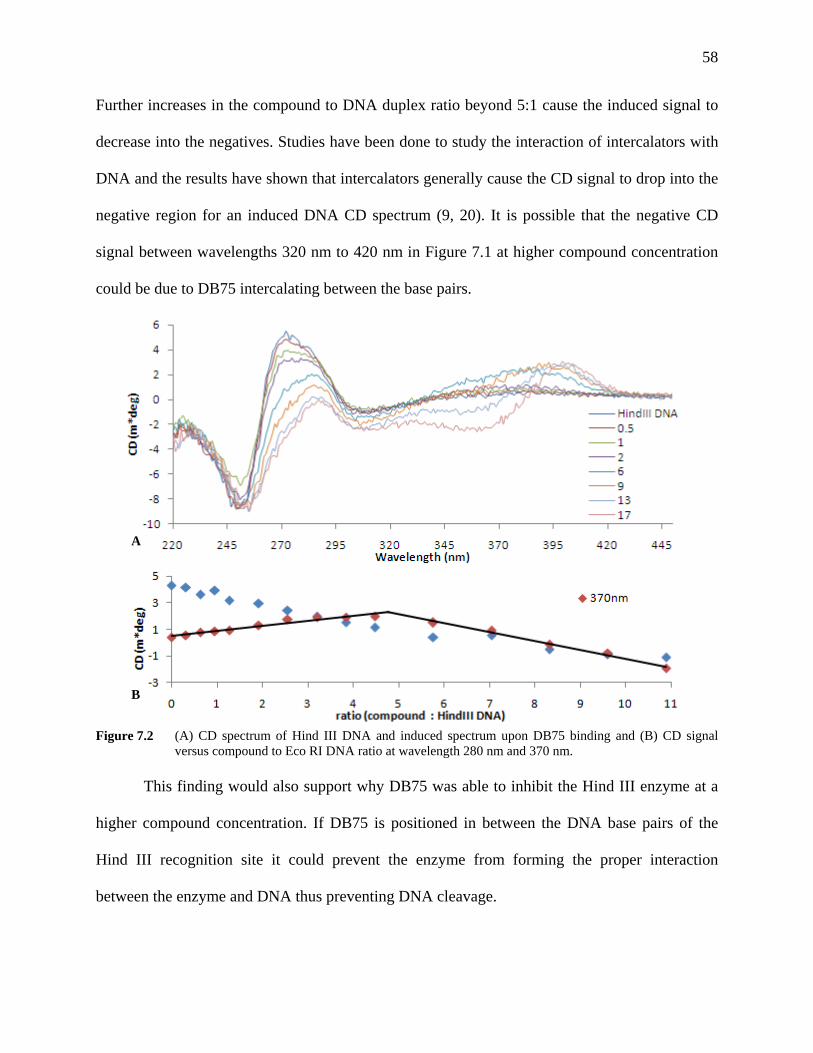
58
Further increases in the compound to DNA duplex ratio beyond 5:1 cause the induced signal to
decrease into the negatives. Studies have been done to study the interaction of intercalators with
DNA and the results have shown that intercalators generally cause the CD signal to drop into the
negative region for an induced DNA CD spectrum (9, 20). It is possible that the negative CD
signal between wavelengths 320 nm to 420 nm in Figure 7.1 at higher compound concentration
could be due to DB75 intercalating between the base pairs.
Figure 7.2 (A) CD spectrum of Hind III DNA and induced spectrum upon DB75 binding and (B) CD signal
versus compound to Eco RI DNA ratio at wavelength 280 nm and 370 nm. This finding would also support why DB75 was able to inhibit the Hind III enzyme at a
higher compound concentration. If DB75 is positioned in between the DNA base pairs of the
Hind III recognition site it could prevent the enzyme from forming the proper interaction
between the enzyme and DNA thus preventing DNA cleavage.
A
B

59
Figure 7.3 CD spectrum of Eco RI DNA and induced spectrum upon DB613 binding. DB613 was one of the reverse amidinium compound that was shown to be ineffective at
preventing the DNA cleaving ability of Eco RI. It was thought that this compound did not bind to
DNA or did bind to DNA but through weak interactions. The results in Table 6.1 reveal that
DB613 was able to stabilized DNA just as much as DB75 based on its ΔTm value. The CD
spectrum also gave high induced signals upon compound binding that leveled off at a compound
to DNA duplex ratio of 1:1 (Figure 7.3). Based on these result it can be determined that DB613
does bind to Eco RI DNA at the AATT site and is able to stabilize the DNA. While this
compound is able to bind and stabilize DNA, the interaction taking place between DB613 and
DNA must be different from those of DB75 due to the lack of Eco RI inhibition. As stated in
Section 4.2, the structural modification of an amidine end to a reverse amidine end seems to
affect the compounds ability to inhibit Eco RI.
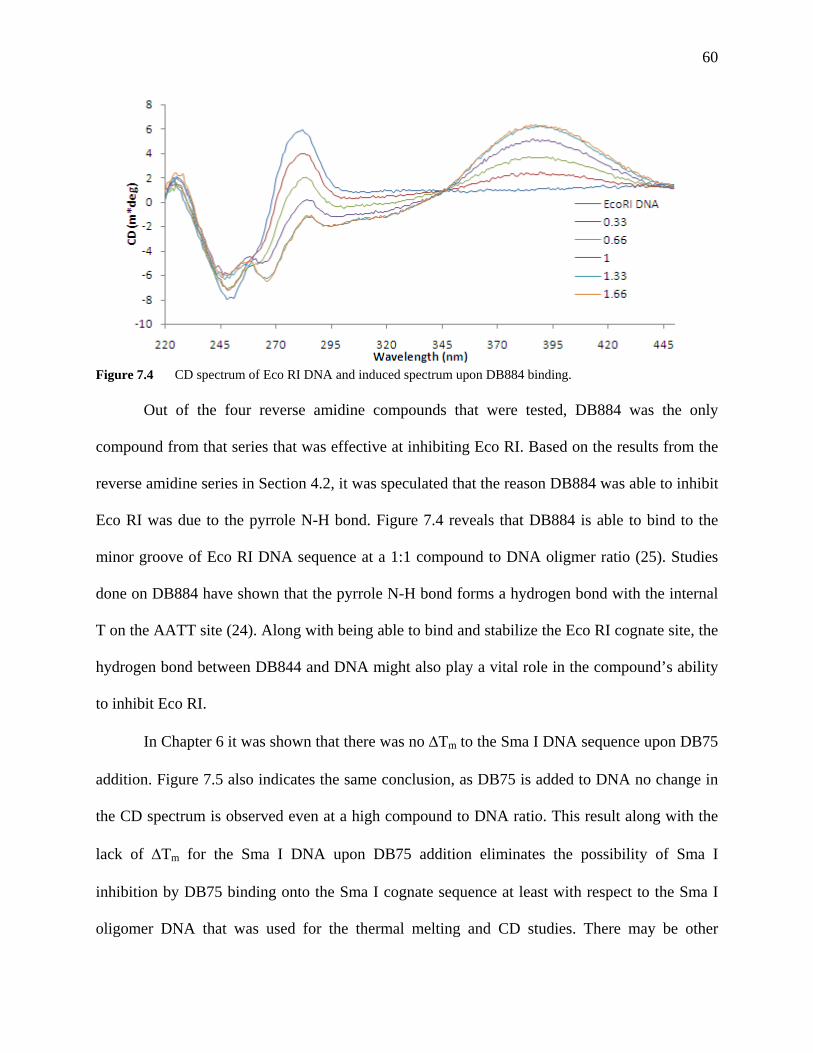
60
Figure 7.4 CD spectrum of Eco RI DNA and induced spectrum upon DB884 binding. Out of the four reverse amidine compounds that were tested, DB884 was the only
compound from that series that was effective at inhibiting Eco RI. Based on the results from the
reverse amidine series in Section 4.2, it was speculated that the reason DB884 was able to inhibit
Eco RI was due to the pyrrole N-H bond. Figure 7.4 reveals that DB884 is able to bind to the
minor groove of Eco RI DNA sequence at a 1:1 compound to DNA oligmer ratio (25). Studies
done on DB884 have shown that the pyrrole N-H bond forms a hydrogen bond with the internal
T on the AATT site (24). Along with being able to bind and stabilize the Eco RI cognate site, the
hydrogen bond between DB844 and DNA might also play a vital role in the compound’s ability
to inhibit Eco RI.
In Chapter 6 it was shown that there was no ΔTm to the Sma I DNA sequence upon DB75
addition. Figure 7.5 also indicates the same conclusion, as DB75 is added to DNA no change in
the CD spectrum is observed even at a high compound to DNA ratio. This result along with the
lack of ΔTm for the Sma I DNA upon DB75 addition eliminates the possibility of Sma I
inhibition by DB75 binding onto the Sma I cognate sequence at least with respect to the Sma I
oligomer DNA that was used for the thermal melting and CD studies. There may be other
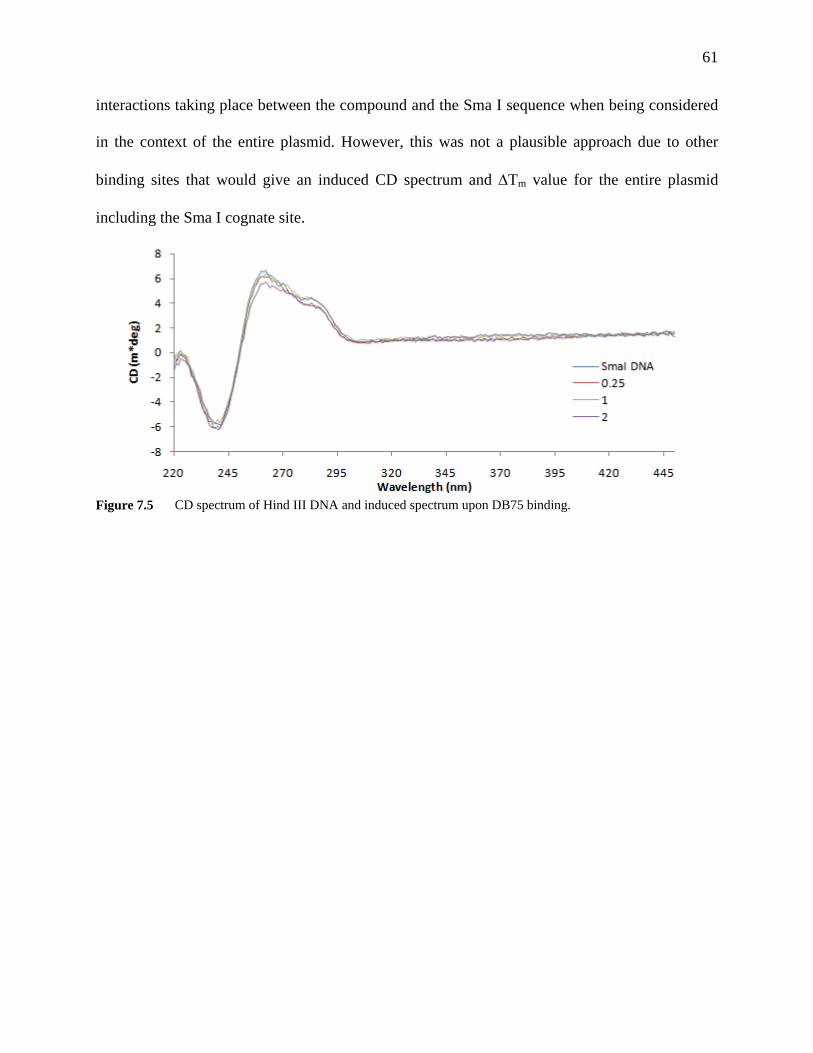
61
interactions taking place between the compound and the Sma I sequence when being considered
in the context of the entire plasmid. However, this was not a plausible approach due to other
binding sites that would give an induced CD spectrum and ΔTm value for the entire plasmid
including the Sma I cognate site.
Figure 7.5 CD spectrum of Hind III DNA and induced spectrum upon DB75 binding.
62
8. CONCLUSION
The results from this study answered the question regarding the inhibition of type II
restriction enzymes by dication minor groove binders. Dications that bind to the minor groove of
AT rich DNA were able to inhibit the cleaving mechanism of type II restriction enzymes, which
bind to the major groove of DNA. But enzyme inhibition is heavily dependent on the structure of
the dication and the enzyme DNA cognate site. Most of the compounds used to inhibit Eco RI
were effective. This was expected since the Eco RI cognate site contains an AATT DNA
sequence which also happens to be a favorable binding sequence to most of the compound
studies in this research. Some of the compounds that were ineffective against Eco RI were
DB569 and most of the compounds from the reverse amidine series. The only reverse amidine
that was able to inhibit Eco RI was DB884.
The inhibition of the Hind III enzyme was not as simple as the inhibition of Eco RI due to
the GC bases in the center of its cognate region. Compounds that were able to inhibit this
enzyme did so, most likely, through means of secondary interactions. At low compound
concentration little or no inhibition was observed but at higher compound concentration enzyme
inhibition was noticed supporting the idea that DNA cleavage inhibition was achieved through
secondary interactions between the Hind III cognate site and compound. Compounds with
minimal secondary binding properties were not able to inhibit this enzyme, even at a relatively
high compound concentration.
Sma I is an enzyme that targets a pure GC sequence and therefore was not expected to be
inhibited by the dications. The results reveal that some of the dications were in fact able to
inhibit this enzyme. As the compound structure deviates more from that of DB75 the ability of

63
the compound to inhibit Sma I decreases. At first it was thought that inhibition was due to DNA
topology and/or the flanking sequences of Sma I but the information from this study reveals that
these two factors play a minor role in DB75’s ability to inhibit Sma I. Another likely explanation
for these results was thought to be due to the G repeats in the Sma I cognate site but the
inhibition of Nar I, another enzyme that cleaves a pure GC site, by DB75 dismisses this
explanation. Currently the inhibition of Sma I by heterocyclic diamidines remains to be a
mystery but the data obtained from this study can assist in eliminating factors that have minimal
roles in the inhibition of Sma I and narrow down the possibilities for why inhibition of this
enzyme is observed, as well as other enzymes that target a GC pure site.
An explanation for how these compounds inhibit restriction enzymes would be to
examine the interactions between compound, DNA, and enzymes from a structural point of view.
It is known that in order for Eco RI to cleave DNA it has to rotate and unwind the DNA duplex
by 28o, but once a compound binds to DNA not only does the compound cause conformational
change to DNA, although only minimal changes are observed for DB75, but the compound could
also act as a lock forcing the DNA duplex into a rigid structure that prevents Eco RI from
unwinding the DNA, thus, preventing DNA cleavage. This structural complex that is formed
between the compound and DNA is determined by the molecular interactions taking place
between the two. In order for the restriction enzyme to cleave DNA, certain interactions such as
hydrogen bonding and electrostatic connections must take place between the DNA and enzyme.
If the compound that is bound to DNA is interacting with the bases in the enzyme’s cognate
sequence it could be disrupting the interactions taking place between the enzyme and the DNA
recognition site thus preventing DNA cleavage.
64
The molecular and structural interactions taking place between the compound and DNA
can be most clearly seem in the reverse amidine series. From the CD and thermal melting study
of compound binding onto DNA it was shown that the reverse amidine drugs were able to bind
to DNA but the majority of these compounds were unable to inhibit the Eco RI enzyme. DB884
was the only reverse amidine from this series that was able to inhibit the Eco RI enzyme and that
was determined to be due to the hydrogen bond between the N-H of pyrrole and an internal T in
the AATT sequence of Eco RI.
The experiments carried out in this study helped in answering whether dication minor
groove binders were able to inhibit an enzyme that cleaves DNA from the major groove side.
Along with answering this question it also reveals how variation in enzyme DNA cognate sites
affect enzyme inhibition by dication compounds. These results, along with other information
obtained for heterocyclic diamidines, will be helpful in explaining protein, DNA, and compound
interaction as a factor for further compound design to be used as a potential treatment for a host
of disease or abnormalities.

65
REFERENCES
[1] Mulligan, W. H.; Potts, H. W. The African Trypanosomiases. George Allen & Unwin Ltd. 1970; Chapter 36, pp. 684 – 710.
[2] Fairlamb, A. H. Trend Parasitol. 2003, 19, 488-494. [3] Mathis, A.; Holman, J.; Sturk, L.; Ismail, M.; Boykin, D.; Tidwell, R.; Hall, J. Antimicrobial Agents and
Chemotherapy 2006, 50, 2185-2191. [4] Wood, H. D.; Hall, E. J.; Rose, G. B.; Tidwell, R. R. European Journal of Pharmacology 1998, 353, 97-
103. [5] Bernhard, C. S.; Nerima, B.; Maser, P.; Brun, R. International Journal of Parasitology 2007, 37, 1443-
1448. [6] Lanteri, C.; Tidwell, R.; Meshnuck, S. Antimicrobial Agents and Chemotherapy 2008, 52, 875-882. [7] Purfield, A.; Tidwell, R.; Meshnick, S. Antimicrobial Agents and Chemotherapy 2008, 52, 2253-2255. [8] Shapiro, T. A.; Englund, P. T. Annu. Rev. Microbiol. 1995, 49, 117-143. [9] Nguyen, B.; Tardy, C.; Bailly, C.; Colson, P.; Houssier, C.; Kumar, A.; Boykin, D. W.; Wilson, W. D.
Biopolyners 2002, 63, 281-297. [10] Laughton, A. C.; Tanious, F.; Numm, M. C.; Boykin, D. W.; Wilson, W. D.; Neidle, S. Biochemistry 1996,
35, 5655-5661. [11] Guerri, A.; Simpson, J.; Neidle, S. Nucleic Acid Research 1998, 36, 2873-2878. [12] Mazur, S.; Tanious, F.; Ding, D.; Kumar, A.; Boykin, D.; Simpson, I.; Neidle, S.; Wilson, D. Journal of
Molecular Biology 2000, 300, 321-337. [13] Blackurn, G. M.; Gait, J. M. Nucleic Acids in Chemistry and Biology, 2nd Edition. Oxford University Press,
1996; Chapter 9, pp. 421-427. [14] Berg, M. J.; Tymoczko, L. J.; Stryer, L. Biochemistry, 5th Edition. W. H. Freeman and Company, 2002;
Chapter 9, pp. 245-252. [15] Orlowshi, J.; Bujnicki, J. Nucleic Acids Research 2008, 1-18. [16] Linn, S.; Roberts, R. Nucleases. Cold Spring Harbor Laboratory, 1982, 1985; Chapter Type-II Restriction
and Modification Enzymes, pp. 109-154. [17] Blackurn, G. M.; Gait, J. M. Nucleic Acids in Chemistry and Biology, 2nd Edition. Oxford University Press,
1996; Chapter 2, pp. 22-25. [18] Ribeiro, S.C.; Monteiro, G.A.; Prazeres, D.M.F. Journal of Pharmacutical Sciences 2008, in press. [19] Rahman, M.; Yasuha, H.; Katsura, S.; Mizuno, A. Archives or Biochemistry and Biophysics 2007, 464, 28-
35. [20] Ushijima, K.; Ishibashi, T.; Yamakawa, H.; Tsukahara, S.; Takai, H.; Mayurana, T.; Takaku, H.
Biochemistry 1999, 38, 6570-6575.
66
[21] Bricker, M.; Chmielweshi, J. Chemistry & Biology 1998, 5, 339-343. [22] C. M. Nunn et al, Biochemistry 1997, 37, 4792-4799. [23] Lansiaux, A.; Tanious, F.; Mishal, Z.; Dassonneville, L.; Kumar, A.; Stephens, C.; Hu, Q.; Wilson, W. D.;
Boykin, D. W.; Bailly, C. Cancer Research 2002, 62, 7219–7229. [24] Munde, M.; Lee, M.; Neidle, S.; Arafa, R.; Boykin, D.; Lui, Y.; Bailly, C.; Wilson. D. W. Journal of
American Chemical Society 2006, 129, 5688-5698. [25] Lubitz, I,.; Borovok, N.; Kotlyar, A. Biochemistry 2007, 46, 12925-1292.