structural dynamics and synchronous silver fir decline in mixed old
TRANSCRIPT

© Institute of Chartered Foresters, 2011. All rights reserved. For Permissions, please email: [email protected]
Forestry, Vol. 84, No. 5, 2011. doi:10.1093/forestry/cpr030Advance Access publication date: 11 July 2011
Forestry An International Journal of Forest Research
Introduction
Research on old-growth forests is essential for understanding forest ecosystem functioning and for the development of forest management strategies. Their struc-tural dynamics depends on disturbance patterns (White and Pickett, 1985). In recent decades, much research in old-growth forests has focused on natural disturbances. However, over several centuries, the natural disturbance regime has been severely altered by forest fragmentation,
changes in fire regime, fauna extinctions, the introduction of forest management into the forest matrix surrounding old-growth, forest road infrastructure, and, in the last few decades, by overbrowsing, air pollution and climate change (Nowacki and Abrams, 1994; Uotila et al., 2002; Oulehle et al., 2010). Present-day old-growth forest struc-tures are often a result of complex interactions between natural and anthropogenic disturbances (McLachlan et al., 2000). In Europe, old-growth forests have been significantly influenced by millennia of civilization. Thus, studies of
Structural dynamics and synchronous silver fir decline in mixed old-growth mountain forests in Eastern and Southeastern EuropeJ. DIACI1*, D. ROZENBERGAR1, I. ANIC2, S. MIKAC2, M. SANIGA3, S. KUCBEL3, C. VISNJIC4 and D. BALLIAN4
1 Department of Forestry, University of Ljubljana, 83 Vecna pot, 1000 Ljubljana, Slovenia2 Faculty of Forestry, University of Zagreb, 25 Svetosimunska, 10002 Zagreb, Croatia3 Faculty of Forestry, Technical University of Zvolen, 24 Masaryka, 96053 Zvolen, Slovakia4 Faculty of Forestry, University of Sarajevo, 20 Zagrebacka, 71000 Sarajevo, Bosnia-Herzegovina*Corresponding author. E-mail: [email protected]
Summary
Studies of old-growth forests are becoming increasingly important for the improvement of silviculture and for understanding environmental changes. However, in Europe such forests are rare, fragmented and influenced by millennia of human activity. Comparative studies of old-growth forests across Europe are needed to improve knowledge on how direct and indirect anthropogenic factors influence their structure. We analysed structural dynamics in 15 silver fir-beech-Norway spruce old-growth forests in Slovenia, Croatia, Slovakia and Bosnia-Herzegovina. Changes in diameter distributions, stand parameters and regeneration were analysed at intervals of 6–116 years. Most diameter growth at breast height (d.b.h.) distributions approximated a rotated sigmoid shape, which could be explained by differences in growth and mortality rates with respect to d.b.h. class and by disturbance history. Our results suggest that different disturbance types are likely to cause different changes in d.b.h. distributions. For example, overbrowsing, canopy dieback of silver fir and windthrow decreased the density of small, intermediate and large-diameter silver fir, respectively. The slopes of the fitted diameter distribution curves were steeper for beech than for silver fir, which could be explained by their different life strategies. Despite disturbances, growing stocks remained stable over the long term. A synchronous silver fir decline was confirmed. It was more pronounced in Slovenia and Slovakia, both of which experienced more SO2 pollution and had higher ungulate densities. The silver fir sapling stage was often totally absent in both countries. Our results suggest that anthropogenic disturbances, especially air pollution and overbrowsing (resulting from human-induced increases in deer density), significantly influenced the coexistence of silver fir and beech; asynchronous, patchy changes in species mixture have been replaced by large-scale synchronous changes.
at UN
IVE
RSIT
Y O
F LJU
BL
JAN
A on January 25, 2012
http://forestry.oxfordjournals.org/D
ownloaded from

FORESTRY480
anthropogenic disturbance history could reveal new per-spectives on European old-growth forests.
Mixed silver fir (Abies alba Mill.), beech (Fagus sylvatica L.) and Norway spruce (Picea abies (L.) Karst.) mountain forests represent one of the major forest types in Eastern and Southeastern Europe (Horvat et al., 1974; Ellenberg, 1988). They are well preserved since they have been influenced by humans to a lesser extent than lowland or high mountain forests have (Korpel, 1995; Ficko et al., 2011). The majority of European temperate old-growth forests lie in this region (Leibundgut, 1982), while small-scale, uneven-aged silvi-cultural systems are typical of managed forests (Mlinsek, 1972; Matic, 1983; Korpel et al., 1991). The majority of mixed mountain forests have experienced changes in struc-ture and composition over the last few hundred years. From the beginning of regular management, conifers have been promoted by silvicultural measures, charcoal burning, the production of potash, localized forest litter collection and grazing and decreasing densities or extinction of ungulates (Matic, 1983; Kordis, 1993; Vrska et al., 2009). There-fore, the proportion of silver fir (hereafter fir) in the grow-ing stock in Eastern and Southeastern Europe peaked soon after World War II (WWII) (Korpel, 1995; Klopcic et al., 2010). Later, its proportion started to decline, probably due to the interplay of several factors, such as changes in forest management (abandonment of the selection system, intensi-fied cutting regimes, forest microclimate changes induced by construction of skid trails and forest roads), overbrowsing and canopy dieback of silver fir. However, an increase in beech in mixed old-growth forests may have started as long as 60 years ago (Safar, 1951, p. 302) and has been more noticeable in recent decades, indicating the importance of indirect human disturbances or natural processes (Korpel, 1995; Vrska et al., 2009). Therefore, a comparative study of mixed old-growth forests could verify whether these proc-esses have been significant on a larger scale. This would help to distinguish the natural, direct and indirect anthropogenic factors influencing compositional and structural changes.
The long-term influence of heavy air pollution on old-growth forests in Eastern and Southeastern Europe has not been given a great deal of attention (Oulehle et al., 2010) although SO2 emissions in this area have been reported to be among the world’s highest (Stern, 2006). Since old-growth forests are often game reserves, the elimination of palatable species by overbrowsing has become a key factor in species coexistence over the last few decades in many European regions (Korpel, 1995; Linder et al., 1997; Kenderes et al., 2008; Vrska et al., 2009; Diaci et al., 2010). Fir combines certain features that make it very vulnerable to browsing: it is one of the most palatable species, it grows very slowly in shaded conditions, and it recovers poorly from brows-ing damage (Gill, 1992; Motta, 1996). The significant dif-ferences in ungulate densities between countries in Eastern and Southeastern Europe make comparisons particularly interesting.
Stand parameters such as growing stock, basal area and tree density are basic inventory parameters in old-growth for-ests and are therefore often recorded. However, in Europe, such parameters have not often been used in integrative
and comparative research. Because of the rarity and frag-mentation of old-growth forests, this research is especially important (Leibundgut, 1982; Korpel, 1995; Vrska et al., 2009). Their spatiotemporal variability reflects the interplay between natural and anthropogenic factors on old-growth structure. These parameters, in particular, become more valuable when integrated with other characteristics such as diameter distributions, regeneration and disturbance history.
Spatiotemporal changes in diameter at breast height (d.b.h.) distributions are important in old-growth research since they help to trace past disturbances; understand regeneration, growth and mortality patterns; predict future development of stands and reveal the competitive relation-ship between tree species (Schmelz and Lindsey, 1965; Goff and West, 1975; Aldrich et al., 2005; Wang et al., 2009). Namely, in tree populations, size, social status and age con-siderably influence demographic processes. For d.b.h. dis-tributions of old-growth forests close to their demographic equilibrium, several shapes can be characteristic (Goff and West, 1975; Lorimer, 1980; Leak, 1996; Shimano, 2000; Westphal, et al., 2006): negative exponential (NE), nega-tive power function (NP), increasing Q (IQ) and rotated sigmoid (RS). The biological reason behind the distribution shapes is linked to their reduction rate (Q) with increasing d.b.h. class; it can be constant (NE), decreasing (NP), in-creasing (IQ) or variable (RS). IQ and RS shapes could also indicate past disturbances or management (Leak, 1996), while a unimodal shape (UNI) indicates heavier disturb-ance or succession (Aldrich et al., 2005; Janowiak et al., 2008). Old-growth stands are often composed of several species, which may add to the complexity of distribution shapes. Many studies of the d.b.h. structures of old growth forests have been done and many have focused solely on d.b.h. structures (overview Westphal, et al., 2006). How-ever, because of the many possible factors influencing d.b.h. distributions, they should always be interpreted in relation to other structural parameters or knowledge on the disturbance history of the forest in question (Lorimer, 1980; Goodburn and Lorimer, 1999).
The overall objective of the study was to describe the change in stand structure and composition and to discuss these changes in relation to the natural and anthropogenic disturbance history, especially air pollution and over-browsing resulting from human-induced increases in deer density. The aims of the study were to (1) examine whether mixed old-growth forests from different geographical re-gions in Eastern and Southeastern Europe have experienced similar structural and compositional changes in the past few decades; (2) compare the relevance of natural and an-thropogenic factors influencing composition and structure; (3) anticipate future developmental trends and (4) develop recommendations for old-growth management.
Methods
Study area and disturbance history
The study included 15 old-growth forests in four countries: Bosnia and Herzegovina (BiH), Croatia (CRO), Slovakia
at UN
IVE
RSIT
Y O
F LJU
BL
JAN
A on January 25, 2012
http://forestry.oxfordjournals.org/D
ownloaded from

SILVER FIR DECLINE IN MIXED OLD-GROWTH FORESTS 481
(SK) and Slovenia (SI). Their area varied in size from 10 to 660 ha, while the majority were ~50 ha in size (Table 1). All of the forests were in the mountain to upper mountain vegetation belt. The bedrock consisted partially of car-bonate and partially of acidic silicate rock; however, all of the old-growth sites were classified as the fir-beech-Norway spruce type according to Braun-Blanquet typology (Braun-Blanquet, 1964). The most recently recorded proportion of beech in the growing stock of these forests varied from 18 to 93 per cent. All forests are protected by law. Forest histories, especially past disturbances, were studied by an overview of the available literature and by a detailed for-malized questionnaire sent to all co-authors. It included 11 disturbance categories: overbrowsing on tree regeneration by wild ungulates, canopy dieback of silver fir, canopy dieback of Norway spruce (hereafter spruce), windthrow, fir bark beetle (native species: genera Pityokteines and Cryphalus), spruce bark beetle (native species: genera Ips and Pityogenes), felling, charcoal or potash production, grazing by domestic animals, proximity of forest roads and other. Canopy dieback of fir and spruce denotes the dieback from the 1960s to 1990s which was mainly attributed to elevated SO2 emissions as reported from several reserves (e.g. Korpel, 1995; Diaci et al., 2010). The disturbance intensity was scored on a scale from 0 (no disturbance) to 3 (severe disturbance). Scores were based on quantitative indicators for disturbance intensity and literature sources, e.g. the year of the event, ungulate density, the volume of damaged or killed trees, the quantity of and trends in SO2 emissions and general forest health status (Table 2).
Field methods
Diameter distribution data was obtained from callipering whole reserves in mainly 10-year intervals (seven reserves), from larger permanent plots (five reserves) and from com-binations of permanent plots and systematic sampling (three reserves; Table 3). However, all permanent plots and the total of the areas of the systematic sampling plots were larger than 0.9 ha. In BiH, Croatia and Slovenia, the lower d.b.h. limit was set at 10 cm, with 5-cm d.b.h. classes, while in Slovakia, the lower limit was set at 8 cm, with 4-cm d.b.h. classes. Volume was calculated by the volume tables that are typically used for old-growth research in each country. The data on regeneration was obtained for the same areas as the data on stand structure and was available for nine reserves. Common size classes were seed-lings (older than 1 year and lower than 0.5 m) and saplings (0.5 ≤ h < 3–4 m).
Data analysis
Diameter distributions were fit with multiple linear regres-sions, following the methodology presented in Leak (1996). The dependent variable was the base 10 logarithm of trees per hectare and the independent variables were all pos-sible combinations of the d.b.h. class midpoint, the mid-point squared or the midpoint cubed. The procedure for T
able
1: C
hara
cter
isti
cs o
f th
e 15
old
-gro
wth
for
ests
, inc
ludi
ng t
heir
eco
logi
cal v
aria
bles
Res
earc
h si
teC
ount
rySt
and
key*
Are
a (h
a)L
atit
ude
Lon
gitu
deA
ltit
ude
a.
s.l.
(m)
Ave
rage
ann
ual
prec
ipit
a-ti
on (
mm
)A
vera
ge a
nnua
l te
mpe
ratu
re (
C°)
Pare
nt m
ater
ial
Bee
ch/s
ilver
fir/
Nor
way
spr
uce
rati
o†
Raj
hena
vski
Rog
SIR
R52
.145
° 40′ N
15°
01′ E
740–
880
~176
06–
7C
arbo
nate
43/5
7/0
Peck
aSI
PE59
.545
° 46′ N
15°
00′ E
795–
910
~150
06–
7C
arbo
nate
82/1
8/0
Kro
kar
SIK
R74
.545
° 33′ N
14°
47′ E
840–
1170
~200
06
Car
bona
te93
/7/0
Strm
ecSI
ST15
.645
° 38′ N
14°
49′ E
840–
940
~177
06–
7C
arbo
nate
79/2
1/0
Buk
ov V
rhSI
BV
9.3
46°
00′ N
13°
53′ E
1200
–131
3~3
000
6.2
Car
bona
te90
/10/
0L
ucka
Bel
aSI
LB
20.0
46°
20′ N
14°
39′ E
1000
–140
0>2
000
<5C
arbo
nate
58/1
2/30
Sum
ikSI
SU19
.346
° 29′ N
15°
27′ E
700–
1050
>170
0<6
Silic
ate
65/3
0/5
Dev
cica
Tav
ani
CR
OD
T10
0.5
44°
90′ N
15°
05′ E
1192
–129
518
755
Car
bona
te57
/36/
7C
orko
va u
vala
CR
OC
U1,
280
.544
° 55′ N
15°
32′ E
860–
1030
~153
07
Car
bona
te43
/50/
7Ig
man
BiH
IG45
.143
° 43′ N
18°
16′ E
1350
1680
4.5
Car
bona
te18
/80/
2T
rsti
onic
aB
iHT
R30
.544
° 14′ N
18°
16′ E
1100
804
7Si
licat
e52
/44/
4Pl
jesi
vica
BiH
PL38
.844
° 45′ N
15°
45′ E
1120
>140
05.
2C
arbo
nate
56/4
1/3
Bad
inSK
BA
30.7
48°
41′ N
19°
03′ E
750–
850
900
5.5–
6Si
licat
e90
/10/
0D
obro
cSK
DO
49.8
48°
41′ N
19°
49′ E
720–
1000
960
4.5–
5Si
licat
e35
/37/
23St
uzic
aSK
SA65
9.4
49°
04′ N
22°
32′ E
650–
1220
850–
1000
5–6
Silic
ate
93/7
/0
*
Stan
d ke
y is
use
d fu
rthe
r in
the
tex
t an
d fig
ures
.
† Pr
opor
tion
in li
ving
vol
ume
of t
he m
ost
rece
nt in
vent
ory.
If
prop
orti
ons
of o
ther
spe
cies
wer
e be
low
2%
, the
ir p
ropo
rtio
ns w
ere
adde
d to
the
mai
n sp
ecie
s, a
nd in
oth
er
case
s th
e su
m o
f pr
opor
tion
s is
low
er t
han
100%
.
at UN
IVE
RSIT
Y O
F LJU
BL
JAN
A on January 25, 2012
http://forestry.oxfordjournals.org/D
ownloaded from
FORESTRY482
selecting the best-fitting model and diameter distribution shapes to use for classification followed the methodology described in Janowiak et al. (2008). The highest adjusted R2 and lowest root mean square error values were used as a basis for selection of the best-fitting model from all significant models (P < 0.05). If shapes were inconsistent or variable (Janowiak et al. 2008), the second best-fitting model was used. Out of 49 fits, 3 per cent of the cumulative distributions were variable shapes, and out of 96 fits, 8 per cent of species-specific distributions were variable shapes. A chi-square test of independence was applied to determine whether the d.b.h. distributions varied between different old-growth forests, species, before and after 1980 (signifi-cant increase of anthropogenic disturbances: e.g. SO2 emis-sions and overbrowsing) and successive inventories of the same old-growth forest (for cumulative and species specific data). The differences in intercepts and the slopes of the fitted regression lines (between d.b.h. class midpoints and log n) were tested with an analysis of covariance. In order to linearly approximate the most frequent RS shape, the d.b.h. interval was divided into three sections: (1) d.b.h. ≤ 30 cm, (2) 30 cm < d.b.h. ≤ 55 cm and (3) d.b.h. > 55 cm. Additionally, differences in slopes and intercepts for pooled unsectioned data were tested. Cochran’s C test was applied to test the assumption of the homogeneity of variances, and residuals were visually inspected for any trends. To compare dependent samples, a nonparametric Wilcoxon test was applied.
Results
Disturbance history
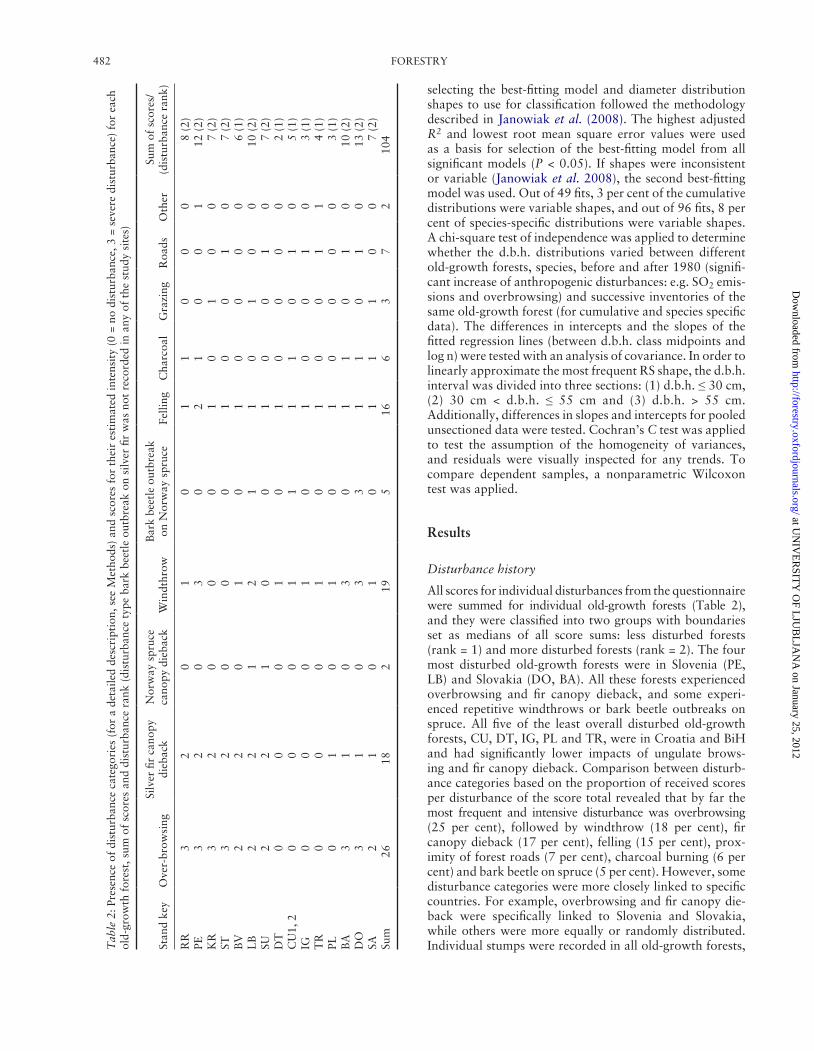
All scores for individual disturbances from the questionnaire were summed for individual old-growth forests (Table 2), and they were classified into two groups with boundaries set as medians of all score sums: less disturbed forests (rank = 1) and more disturbed forests (rank = 2). The four most disturbed old-growth forests were in Slovenia (PE, LB) and Slovakia (DO, BA). All these forests experienced overbrowsing and fir canopy dieback, and some experi-enced repetitive windthrows or bark beetle outbreaks on spruce. All five of the least overall disturbed old-growth forests, CU, DT, IG, PL and TR, were in Croatia and BiH and had significantly lower impacts of ungulate brows-ing and fir canopy dieback. Comparison between disturb-ance categories based on the proportion of received scores per disturbance of the score total revealed that by far the most frequent and intensive disturbance was overbrowsing (25 per cent), followed by windthrow (18 per cent), fir canopy dieback (17 per cent), felling (15 per cent), prox-imity of forest roads (7 per cent), charcoal burning (6 per cent) and bark beetle on spruce (5 per cent). However, some disturbance categories were more closely linked to specific countries. For example, overbrowsing and fir canopy die-back were specifically linked to Slovenia and Slovakia, while others were more equally or randomly distributed. Individual stumps were recorded in all old-growth forests, T
able
2: P
rese
nce
of d
istu
rban
ce c
ateg
orie
s (f
or a
det
aile
d de
scri
ptio
n, s
ee M
etho
ds)
and
scor
es f
or t
heir
est
imat
ed in
tens
ity
(0 =
no
dist
urba
nce,
3 =
sev
ere
dist
urba
nce)
for
eac
h ol
d-gr
owth
for
est,
sum
of
scor
es a
nd d
istu
rban
ce r
ank
(dis
turb
ance
typ
e ba
rk b
eetl
e ou
tbre
ak o
n si
lver
fir
was
not
rec
orde
d in
any
of
the
stud
y si
tes)
Stan
d ke
yO
ver-
brow
sing
Silv
er fi
r ca
nopy
di
ebac
kN
orw
ay s
pruc
e
cano
py d
ieba
ckW
indt
hrow
Bar
k be
etle
out
brea
k
on N
orw
ay s
pruc
eFe
lling
Cha
rcoa
lG
razi
ngR
oads
Oth
erSu
m o
f sc
ores
/(d
istu
rban
ce r
ank)
RR
32
01
01
10
00
8 (2
)PE
32
03
02
10
01
12 (
2)K
R3
20
00
10
10
07
(2)
ST3
20
00
10
01
07
(2)
BV
22
01
01
00
00
6 (1
)L
B2
21
21
10
10
010
(2)
SU2
21
00
10
01
07
(2)
DT
00
01
01
00
00
2 (1
)C
U1,
20
00
11
11
01
05
(1)
IG0
00
10
10
01
03
(1)
TR
00
01
01
00
11
4 (1
)PL
01
01
01
00
00
3 (1
)B
A3
10
30
11
01
010
(2)
DO
31
03
31
10
10
13 (
2)SA
21
01
01
11
00
7 (2
)Su
m26
182
195
166
37
210
4
at UN
IVE
RSIT
Y O
F LJU
BL
JAN
A on January 25, 2012
http://forestry.oxfordjournals.org/D
ownloaded from

SILVER FIR DECLINE IN MIXED OLD-GROWTH FORESTS 483
yet most fellings occurred in the period following WWII, and they were usually located at the old-growth borders. Grazing by domestic animals (3 per cent), spruce canopy dieback (2 per cent) and bark beetle outbreaks on fir (0 per cent) were less important disturbances overall. Other dis-turbances (2 per cent) were mentioned in two cases, namely the harvesting of small-diameter woody debris (TR) and reports from WWII on partisan warfare and a hospital (PE). The average distance from reserves to a forest road was ~370 m. However, seven old-growth forests shared one of the borders with a forest road, while the longest distance to a forest road was from forest SA (~2000 m).
Diameter distribution shape
We fitted curves to 49 cumulative d.b.h. distributions, 49 beech d.b.h. distributions and 47 fir d.b.h. distributions. Fewer fits for fir were due the insufficient number of fir trees in forest SA in the last two inventories in 1991 and 2001. The most frequent shape of the cumulative d.b.h. distributions was the RS shape, followed by the IQ, NE and UNI shapes (Figure 1; Table 4). Similar results were also obtained for shape frequency derived from the pool of all individual species-specific d.b.h. distributions (N = 96), although with slightly less RS and IQ shapes and more NE shapes. The RS shape was also the most frequent shape when d.b.h. distributions for beech and fir were analysed
separately (Figure 2). However, for fir, the NE shape was the second most frequent, and for beech, the IQ shape was the second most frequent, closely followed by the UNI shape. For the chi-square test of independence, shapes with lower frequency than 5 (CO and UNI) were merged into one group. The shapes and tree species were not re-lated (chi-square = 2.742, P = 0.4331). All fitted shapes explained more variance in beech than in fir (Wilcoxon matched pairs test: Z = 2.949; P = 0.0032) with R2 medians of 0.9694 and 0.9055, respectively.
Further, we compared shapes with the best fit between forests with low (rank = 1) and severe disturbance impact (rank = 2; Table 2). In the first group, the most frequent shape was the RS shape followed by the NE and IQ shapes. The RS shape was also the most frequent in forests with severe disturbances, but, in contrast to the first group, the difference in frequency between this shape and other shapes was greater. The RS shape was followed by the UNI and NE shapes, while the IQ shape was much less frequent compared with less disturbed forests. For the chi-square test, shapes having lower frequency than five (UNI and CO) were merged into one group. The test confirmed depend-ence between shapes and the severity of old-growth forest disturbance (chi-square = 11.370, P = 0.0099). On the other hand, the dependence between d.b.h. shapes and year intervals (<1980, ≥1980) was not confirmed (chi-square = 0.241, P = 0.9707; Table 4).
Table 3: Overview of the methods for data collection in 15 old-growth forests and years of measurements
Stand key d.b.h distributions, N*, growing stock Regeneration Reference
RR 7 × full callipering: 1892†, 1957, 1967, 1976, 1985, 1995, 2007
2 × systematic sampling: 1984, 2008 Diaci et al. (2010)
PE 7 × full callipering: 1892†, 1953, 1963†, 1973, 1982, 1994, 2003
3 × systematic sampling: 1988, 1994, 2007
Nagel and Diaci (2006)
KR 4 × full callipering: 1961, 1984, 1995, 2004 n.a.‡
ST 3 × full callipering: 1984, 1994, 2004 1 × sampling in gaps: 2000 Konecnik and Zaplotnik (2001)
BV 2 × full callipering: 1983, 1998 n.a. Kovac (1999)LB 2 × full callipering: 1953†, 1963†; 2 × sampling:
1991, 2007n.a. Firm et al. (2008)
SU 2 × permanent plot (0.9 ha): 1979, 1998 n.a. Vrecl (1999)DT 2 × permanent plot (1 ha): 1972, 1978 n.a. Mikac (2010)CU1 6 × permanent plot (1 ha): 1957, 1965, 1970,
1975, 1987, 2007n.a. Mikac (2010)
CU2 3 × systematic sampling: 1977, 1985, 2007 1 × systematic sampling: 2007 Mikac (2010)IG 2 × permanent plot (1 ha): 1978, 1988 n.a.TR 4 × sampling: 1963†, 1972†, 1985†, 2001†;
2 × line transect: 2002, 20071 × line transect: 2007 Ballian and Mikic (2003)
PL 1 × permanent plot (1 ha): 2008 1 × permanent plot (1 ha): 2008 Visnjic et al. (2009)BA 6 × full callipering: 1957†, 1970†, 1977, 1986,
1997, 20084 × systematic sampling: 1977, 1986, 1997, 2008; 3 × permanent plot: 1957, 1970, 1986
Korpel (1995)
DO 4 × full callipering: 1978, 1988, 1998, 2010; 3 × permanent plots: 1948†, 1958†, 1968†
4 × systematic sampling: 1978, 1988, 1998, 2008
Korpel (1995)
SA 4 × permanent plots (6 × 0.5 ha): 1971, 1981, 1991, 2001
4 × systematic sampling within permanent plots: 1971, 1981, 1991, 2001
Korpel (1995)
* Tree density. † Only data for tree species proportions in relation to growing stock was available. ‡ Data was not available.
at UN
IVE
RSIT
Y O
F LJU
BL
JAN
A on January 25, 2012
http://forestry.oxfordjournals.org/D
ownloaded from

FORESTRY484
The comparison of cumulative and species-specific d.b.h. distributions from successive inventories of the same old-growth forests revealed that out of a total of 180 compari-sons (i.e. 15 old-growth forests with two to six inventories, see Table 3), 81 were significantly different (45.7 per cent). When comparisons were divided into decades that had elapsed between the individual inventories, we discovered that after 10 years, 10 of the 69 (14.5 per cent) compari-sons were significantly different; after 11–20 years, 34 of 57 (59.6 per cent) comparisons were significantly different and after more than 20 years, 37 of 51 (72.5 per cent) com-parisons were significantly different.
When fitted species-specific shapes were observed visu-ally, we discovered a recurring pattern of a more steeply declining slope for beech in the 55-cm and larger d.b.h. classes when compared with fir (compare Figure 2). The results of analysis of covariance confirmed a higher intercept of beech d.b.h. sections (see Methods) in all comparisons
(Table 5). Slopes of beech d.b.h. sections were generally steeper; however, they were significantly different only for the large-diameter section (d.b.h. > 55 cm) and for the unsectioned data. In all analyses, the fitted regression lines explained less overall variability for fir than for beech. Visual inspection of figures revealed that this was mostly due to the higher variability of data.
Dynamics of stand parameters
The mean growing stock for all inventories was 723.5 (±16.3 SE) m3 ha21, with minimum and maximum values of 446.2 and 1010.0 m3 ha21, respectively (Figure 3a). On the lower end, there were forests on more extreme sites with steeper slopes and at higher altitudes, such as forests BV and KR, and on the upper end were forests where data was taken from smaller permanent research plots, which
Table 4: Percentages of best-fitting shapes for cumulative (N = 49) and species-specific diameter distributions (N = 96) for 15 old-growth forests and several inventory years per shape
Cumulative Per species Disturbance Period
Shapes All All Fir Beech Low Severe <1980 ≥1980
RS 59.2 52.1 53.2 53.1 33.3 62.1 50.0 54.6UNI 10.2 11.2 6.4 16.3 6.7 13.6 10.0 12.1NE 12.2 17.4 23.4 12.2 26.7 13.6 20.0 16.7IQ 18.4 15.3 12.8 18.4 30.0 9.1 16.7 15.2CO 0.0 2.0 4.3 0.0 3.3 1.5 3.3 1.5N 49 96 47 49 33 66 30 66
Note: RS, rotated sigmoid; UNI, unimodal; NE, negative exponential; IQ, increasing Q; CO, concave (after Janowiak et al., 2008).
Figure 1. Temporal changes in cumulative diameter distributions for all species of representative old-growth forests in (a) Slo-venia (Rajhenavski Rog), (b) Slovakia (Badin), (c) Croatia (Corkova Uvala, Devcica Tavani) and (d) BiH (Igman, Trstionica). Curves and lines represent the best regression models. The number following the stand key is the year of measurement and the abbreviation following the year of measurement is the key for the shape, e.g. NE for negative exponential function.
at UN
IVE
RSIT
Y O
F LJU
BL
JAN
A on January 25, 2012
http://forestry.oxfordjournals.org/D
ownloaded from

SILVER FIR DECLINE IN MIXED OLD-GROWTH FORESTS 485
were often selected in optimal and more productive parts of the stands (e.g. IG and CU1). However, the majority of old-growth forests had relatively stable growing stock. For example, the growing stock in forest RR varied by a range of only 56 m3 ha21 over a 50-year period (1957–2006). Exceptions were forests that experienced large disturbances, especially windthrows. For example, forest PE experienced a 244 m3 ha21 drop in growing stock during the same period.
The mean basal area was 44.8 m2 ha21 (±0.89 SE), with minimum and maximum values of 33.6 and 59.0 m2 ha21, respectively. All forests with extreme values were influ-enced by windthrow, but at different times. Forest DO was still recovering from a large-scale windthrow in 1931, forest PE had a substantial decrease in stand basal area after two successive windstorms (1983, 2004), and forest
LB, with the highest basal area, had achieved a even-sized stand structure after a stand replacing event 150 years ago.
The distribution of the density of trees with d.b.h. larger than 10 cm in Slovenia and 8 cm in Slovakia from indi-vidual forests did not follow normal distribution. The median value amounted to 370.5 trees per hectare, and the minimum and maximum values amounted to 231.2 and 736.0 trees per hectare, respectively (Figure 3b). About 75 per cent of all measurements fell between 325 and 470 trees per hectare. The highest numbers were from forests at higher altitudes (DT, LB and BV) or from smaller per-manent research plots from optimal parts of old-growth forests (TR and CU1).
The proportion of fir in the growing stock decreased synchronously in almost all old-growth forests during the last 50 years (Figure 3c). Exceptions were forest IG in BiH,
Figure 2. Representative examples of temporal changes in species-specific diameter distributions in (a) Slovenia (Rajhenavski Rog), (b) Slovakia (Badin), (c) Croatia (Corkova Uvala, Devcica Tavani) and (d) BiH (Igman, Trstionica). Curves and lines rep-resent the best regression models. The third and fourth letter following the stand key are the species abbreviations (e.g. FI for silver fir), the next two numbers represent the year of measurement, while the last two letters denote the key for the shape, e.g. NE for negative exponential function.
Table 5: Analysis of covariance of pooled data from all reserves and measurements for comparing intercept and parallelism of the regression lines for log of tree density in dependence of d.b.h. class midpoints for silver fir and beech.
d.b.h. (cm)
Fir Beech F-test
R2 a b N R2 a b N Pa Pb
10–30 0.077 1.47 –0.024 199 0.386 2.10 –0.036 204 0.0000 0.052231–55 0.022 1.04 –0.010 240 0.036 1.47 –0.010 242 0.0000 0.9044>55 0.641 2.15 –0.026 440 0.802 2.91 –0.034 428 0.0205 0.0000Unsectioned data 0.589 1.45 –0.018 879 0.779 2.01 –0.023 874 0.0000 0.0000
The first three rows show the results for the three sections of the curve along the d.b.h. classes, and the final row is for unsectioned data.Note: N = sample size, R2 = coefficient of determination, a = intercept, b = regression coefficient, Pa = F-test significance for intercept, Pb = F-test significance for slope.
at UN
IVE
RSIT
Y O
F LJU
BL
JAN
A on January 25, 2012
http://forestry.oxfordjournals.org/D
ownloaded from

FORESTRY486
with a short-time interval of measurements and no recent data, and the recent inventories of forests DO and BA in Slovakia. The overall average change in fir in the growing stock was –0.29 per cent per year. In Slovakia, Slovenia, Croatia and BiH, it amounted to –0.45, –0.32, –0.15 and 0.02 per cent per year, respectively. The steepest declines were recorded in forest PE during the 1990s (–2.33 per cent per year), in forest BA during the 1970s (–1.70 per cent per year) and in forest ST during the 1980s (–1.16 per cent per year). In addition to air pollution, the fir decrease in forest PE was influenced by the 1983 windrow. Fir decline in for-est ST was probably influenced by the steep, exposed south slope, while forest BA is at the lower altitude border of fir-beech forests. The largest increases of fir were recorded in forest RR during the first half of the 20th century (0.55 per cent per year), in forest DO during the 2000s (0.39 per cent per year) and in forest TR during the 1970s (0.37 per cent per year). The oldest data for forests PE and RR revealed that the proportion of fir was lower in the 1880s compared with the maximum values that were reached after WWII, before fir started to decrease again (Figure 3c).
The fir decrease was even more noticeable when calcu-lated as the difference in fir density (trees per hectare per year) between successive inventories for individual forests (Figure 3d). In the period 1892–2010, only 7 of 40 differ-ences were positive (16.7 per cent). Time intervals between inventories varied from 5 to 65 years, but the most fre-quent (62 per cent) was 10 years. The mean difference was negative and amounted to –1.17 trees per hectare per year
(±0.36 SE). The largest decrease in fir density was recorded in forest DT (–7.2 trees per hectare per year), followed by forest ST (–6.3 trees per hectare per year), while the largest increase was recorded in forest TR (4.9 trees per hectare per year). The largest fir decrease was recorded during the 1980s (Figure 3d).
Natural regeneration
Data on regeneration was available for nine forests and a total of 24 inventories. It was not normally distributed; therefore, median values with lower and upper quartiles (in parentheses) are presented. Median seedling, sapling and small-diameter tree density (8–10 ≤ d.b.h. < 20 cm) per hectare amounted to 13 395 (2357, 29 302), 3566 (1752, 9548) and 150 (115, 215), respectively. Comparisons of regeneration between old-growth forests revealed signifi-cant differences in fir density and proportion (Figure 4a and b). In four forests, fir was totally absent from the sapling class in all inventories (RR, PE, ST and DO). Very low numbers of saplings were recorded in forest BA also, especially when compared with its proportion in the grow-ing stock. Seedling densities were less variable; they con-firmed fir establishment potential. However, in Slovenia, the repeated inventories also revealed a decrease among seedlings, while in Slovakia, the repeated inventories showed a more stable proportion of fir among seedlings or even an increase in the case of forest DO. In contrast, forest
Figure 3. Temporal changes of stand parameters in 15 old-growth forest from Slovenia, Slovakia, Croatia and BiH: (a) growing stock, (b) tree density per hectare (d.b.h. > 8–10 cm), (c) proportion of silver fir in the growing stock and (d) difference in silver fir density per hectare and year (the curve was fitted by the distance-weighted least squares method). For the legend of stand keys, see Table 1.
at UN
IVE
RSIT
Y O
F LJU
BL
JAN
A on January 25, 2012
http://forestry.oxfordjournals.org/D
ownloaded from

SILVER FIR DECLINE IN MIXED OLD-GROWTH FORESTS 487
SA and all three forests in Croatia (CU2) and BiH (PL, TR) exhibited more stable proportions of fir in the seedling and sapling classes (Figure 4b).
The proportion of fir in the total tree density was not constant in successive tree size classes (Figure 4a). Median values of fir proportions among seedlings, saplings, small trees, medium-diameter trees (20 ≤ d.b.h. < 80 cm) and large-diameter trees (d.b.h. ≥ 80 cm) amounted to 11.3, 0.7, 22.2, 25.9 and 49.3 per cent, respectively. Two extreme size classes could be distinguished: saplings, which had an extremely low proportion of fir, and large trees, which had a high proportion of fir. However, fir proportions were highly variable, not only between forests, but also between different developmental stages within forests. Again, two groups of forests with light (SA, CU2, TR, PL) and heavy (RR, PE, ST, DO, BA) ungulate impact could be distin-guished (see Table 2). The three old-growth forests with the lowest deer densities (CU2, TR, PL) did not exhibit an increase in the proportion of fir with respect to successive size classes; only large trees showed a significant increase. This indicated that in the overbrowsed old-growth stands, browsing had already decreased the proportion of fir in
Figure 4. (a) Proportion of silver fir in 15 old-growth forests according to tree classes: seedlings (h < 0.5 m), saplings (0.5 ≤ h < 3–4 m), small-diameter trees (8–10 ≤ d.b.h. < 20 cm), me-dium-diameter trees (20 ≤ d.b.h. < 80 cm) and large-diameter trees (d.b.h. ≥ 80 cm). (b) Proportion of silver fir in represen-tative old-growth forests (stand key) from Slovenia, Slovakia, Croatia and BiH and year of inventory (numbers following the stand key) according to tree classes.
the small tree class. To get an insight into the conditions before the heaviest impact of browsing, fir proportions in different size classes from less disturbed old-growth forests were analysed. For this, we used all data from Croatia and BiH (N = 16) as well as data from Slovenia and Slovakia from inventories before 1980 (N = 15). Data on seedling and sapling classes were not available for this analysis. Median values of the proportion of fir in small-diameter trees, medium-diameter trees and large-diameter trees amounted 32.8, 26.4 and 66.7 per cent, respectively.
Discussion
D.b.h distribution shapes were influenced by disturbances
Comparison of cumulative and species-specific d.b.h. dis-tributions in our study revealed that the RS distribution was the most frequent best fit. Goff and West (1975), who analysed hardwoods in North America, argued that the RS shape has a biological cause which has to do with the vigorous growth and low mortality of trees just entering the upper canopy when compared with younger or senes-cent trees. This has been confirmed by subsequent research (Goodburn and Lorimer, 1999; Janowiak et al., 2008) and validated by U-shaped mortality functions (Lorimer and Frelich, 1984; Lorimer et al., 2001). However, in our study, the frequency of the RS shape was also positively in-fluenced by disturbance severity. More severe disturbances were characterized by UNI and CO shapes, which tended to change to the RS shape over time. Less disturbed old-growth forests had similar proportions of RS, NE and IQ shapes. The NE shape was often attributed to old-growth forests, while the RS shape was connected with past dis-turbance (Schmelz and Lindsey 1965; Leak, 1996). How-ever, IQ shapes also indicate the absence of large-diameter trees, which is a feature of managed forests (Leibundgut, 1982; Leak, 1996; Janowiak et al., 2008) or old-growth forests damaged by windthrow.
Different disturbance types and intensities may cause different changes in d.b.h. distributions (Lorimer, 1980). In our analysis, long-term ungulate overbrowsing de-creased the density of fir in the small d.b.h. classes. Shape changes in d.b.h. distributions over time in this study (Figure 2) and in a comparable study (Diaci et al., 2010) indicated that canopy dieback of fir lowered the distribu-tion across the intermediate d.b.h classes. On the other hand, windthrow lowered the d.b.h. distribution among large-diameters since taller trees were more likely to be damaged (Nagel and Diaci, 2006). Different factors con-tribute to the shape of d.b.h. distributions, including the type of disturbance (Lorimer, 1980; Leak, 1996); natural mortality patterns (Goff and West, 1975); species-specific recruitment, growth and mortality rates (Shimano, 2000) and the size of the reserve and research plot (Janowiak et al., 2008). It seems the RS shape plays an important role in forests with shade tolerant fir and beech since U-shaped mortality functions could be anticipated. However, the NE shape also appears to be frequent in less anthropogenically or naturally disturbed forests.
at UN
IVE
RSIT
Y O
F LJU
BL
JAN
A on January 25, 2012
http://forestry.oxfordjournals.org/D
ownloaded from

FORESTRY488
Our results indicate that species-specific distributions differ slightly, with the RS shape being the most frequent for both species and the NE and IQ shapes being the second most frequent shapes for fir and beech, respectively. This could be biologically meaningful since a constant, decreasing rate of the NE shape would be more expected for fir, which is more shade-tolerant and attains larger sizes and often greater ages (Korpel, 1995), whereas the IQ shape, in which the mortality rate increases with increasing d.b.h. class, would be more expected for beech. Westphal et al. (2006) found, when comparing European beech old-growth forests, significant deviations from the NE shape towards the RS shape; the IQ shape was not included in the study. In our study, overall fitted shapes, more vari-ance was explained in beech than in fir. This was most likely due to different anthropogenic disturbances, such as overbrowsing and pollution, than caused by some specific recruitment or mortality pattern. We also recorded signifi-cant variations in d.b.h. distributions between forests and within the same forest over time. After 21 years or more, ~75 per cent of the recorded distributions were already significantly different from the initial distribution of the same forests. This analysis also showed faster changes in fir compared with beech. Westphal et al. (2006) determined that only 11 per cent of d.b.h. distributions between nine beech old-growth forests were statistically similar.
Further, we discovered that beech had a more steeply sloped curve than fir in the d.b.h. range above 55 cm. This could indicate a lower mortality rate of fir compared with beech in larger diameters and is consistent with analyses of distribution shapes (more NE in fir) and proportions of fir across different size classes. Similar results were reported by Shimano (2000), who discovered that differences in inter-cepts and slopes could be used to distinguish between climax and pioneer species. The latter would have a high intercept and a steep slope. In our case, differences were relatively small since the ecology of fir and beech is more similar (Ellenberg, 1988). However, despite a possible biological meaning, the results for smaller diameters should be interpreted with caution because of overbrowsing in some reserves.
Long-term stability of growing stock and variability of other parameters
Despite disturbances, many old-growth forests retained a high and relatively stable growing stock and basal area over time. This is in agreement with previous studies of the same or comparable forests (Korpel, 1995). Other parameters fluctuated more, especially tree density and the proportion of fir in the growing stock. Differences in growing stock, basal area and tree density could be linked with disturbance history and site quality. Stand parameters were similar to those presented in Leibundgut (1982) and Korpel (1995). The proportion of fir in the growing stock decreased simultaneously in almost all old-growth forests during the last 50 years. The mean loss was about one tree per hectare per year, and it peaked in the 1980s at about two trees per hectare per year. However, it seems that
silver fir decline was compensated by the intensified growth of remaining trees and by the accelerated recruitment of advance beech regeneration into the subcanopy. Thus, forest climate was largely sustained, and shade-intolerant species could not recruit into the canopy. The stability of stand parameters is a function of the disturbance patch, disturbance severity and the size of the reserve. Busing and White (1993) further suggested that biomass equilibrium in old-growth forest does not imply compositional equi-librium, which is usually achieved at larger spatial scales. Our study forests were relatively large in comparison with the prevalent natural disturbance patches. Canopy dieback of fir, which affected whole reserves, was a chronic, long-term, and relatively slow process that gave survivors and other species enough time to acquire free growing space and compensate for the loss of growing stock.
Impact of chronic overbrowsing on regional regeneration
Natural regeneration was generally abundant, but saplings were rare in Slovenia and Slovakia. This can be attributed to heavy impact by ungulates. While seedling densities indicated fir establishment potential, in Slovenia there were no firs in the sapling class in any of the inventories (N = 6). The same was true of forest DO in Slovakia. Moreover, very low values were also recorded in forest BA. The re-ported deer density in the regions surrounding old-growth forests was different in different countries, with the high-est densities in Slovenia and Slovakia. For example, there were about one and seven individuals per square kilometre of roe (Capreolus capreolus L.) and red deer (Cervus elaphus L.), respectively, in the area of forest RR (Jerina, 2006) and one to three and six individuals square kilometre of roe and red deer, respectively, in the area of forests BA and DO in Slovakia (M. Saniga, personal communication). Significantly lower densities were reported in Croatia and BiH, rarely amounting to more than one deer per square kilometre in total (Anonymous, 2007, 2010). All reported deer densities should be evaluated critically since they are difficult to estimate. Moreover, they were assessed for larger areas of managed forests surrounding old-growth forests. Thus, deer densities might be underestimated. Heavy deer browsing has been frequently reported in European (Korpel, 1995; Linder et al., 1997; Kenderes et al., 2008), North American (Nowacki and Abrams, 1994; Davis, 1996; Rooney, 2001; Long et al., 2007; Stroh et al., 2008) and Japanese old-growth forests (Abrams et al., 1999). Deer may be more common in old-growth forests since hunting is often prohibited and since they are less disturbed by logging, harvesting and traffic. Besides this, low light levels in old-growth forests result in fewer food resources for deer and in the slow growth of fir; therefore, the most palatable species remain vulnerable to browsing for long periods.
When forests less disturbed by ungulates were analysed, we discovered that the proportion of fir (in density) was not constant among different tree size classes. There was some evidence of a higher proportion among small-diameter trees compared with medium-diameter trees, which could
at UN
IVE
RSIT
Y O
F LJU
BL
JAN
A on January 25, 2012
http://forestry.oxfordjournals.org/D
ownloaded from

SILVER FIR DECLINE IN MIXED OLD-GROWTH FORESTS 489
be explained by its greater shade tolerance in relation to beech. The increase in the proportion of fir among large-diameter trees could be a result of fir lower mortality in this size class; it attains larger diameters and heights than beech. Leibundgut (1982) and Korpel (1995) also reported this feature.
Evidence of overriding anthropogenic disturbances in mixed old-growth forests
The inquiry on disturbance history revealed a high fre-quency and intensity of natural and anthropogenic disturbances. The latter were more important, with human- induced ungulate overbrowsing being the most severe, followed by fir canopy dieback and felling. Results from disturbance inquiries were consistent with results from analyses of d.b.h. distributions, structural parameters and regeneration. Similar results regarding long-term anthropogenic influences in old-growth forests have been reported on different continents (Nowacki and Abrams, 1994; Abrams et al., 1999; Uotila et al., 2002; Aldrich et al., 2005; Oulehle et al., 2010).
One of the most intriguing phenomena of mixed forests was the canopy dieback of fir (Ficko et al., 2011). The first reports of local and regional fir canopy dieback in South-eastern Europe date from the end of the 1920s (Safar, 1951). It occurred along the borders of fir’s natural range, where it affected mostly sun exposed, rockier and drier slopes. It was probably triggered by harsh winters and hot dry summers (e.g. 1950). Acute fir canopy dieback was often accompanied by bark beetle calamities. The spread of fir canopy dieback occurred from the mid 1950s onward, when it also affected younger trees and extended to larger areas (Mlinsek, 1964). Fir canopy dieback involved several factors (Krause et al., 1986); however, the acute fir dieback in the 1970s and 1980s was predominantly influenced by regional and temporal patterns of SO2 air pollution cou-pled with climatic extremes (Elling et al., 2009). According to the information presented in Stern (2006), in the period from 1975 to 1993, Eastern Europe was the world’s lar-gest emitter of sulphur. After 1993, Eastern Europe was surpassed by Asia. The SO2 deposits in study area were not as high as in the northern Czech Republic, southeast-ern Germany or southern Poland (Saltbones and Dovland, 1986). However, the forests of former Yugoslavia were also affected by SO2 emissions from Western and Northern Europe (Komlenovic, 1989). The peak in emissions for re-gions under research took place at different times, but the overall peak probably occurred in the 1980s (Saltbones and Dovland, 1986; Oszlanyi, 1997; ARSO, 2010; Oulehle et al., 2010). The rank of countries according to actual SO2 impact on forest ecosystems is likely Slovenia and Slovakia followed by BiH and Croatia. This rank is inversely related to the rank of overall forest health status based on the per-centage of foliage loss (Prpic, 1989; Oszlanyi, 1997). Our results from the disturbance survey as well as the analysis of the decrease in the proportion of fir also followed this rank. We did not study direct causal relations between fir
canopy dieback and SO2 emissions; however, many in-direct indices suggested its strong impact on old-growth structure and composition, especially in countries with the highest emission (Slovenia, Slovakia). Fir canopy dieback in old-growth forests was often underestimated, probably due to the abundance of old and non-vital trees, although old-growth forests may be more sensitive to air pollution than younger managed forests. The significant influence of air pollution on old-growth forests was also reported in North America (Elliott et al., 2008). However, besides air pollution and overbrowsing, other disturbances may have also caused the decrease in fir. For example, taller fir trees are more susceptible to wind (Nagel and Diaci, 2006) and in large gaps caused by windthrow, beech regeneration has an advantage (Nagel et al., 2010). This may lead to a change in species composition after windthrow. Moreover, fir is susceptible to drought and bark beetle outbreaks.
In addition to air pollution and overbrowsing, felling was the third most frequent anthropogenic disturbance. However, it was mostly dispersed along the borders of the reserves, and it occurred before or shortly after WWII. Similar events were frequently reported in many old-growth forests in Europe and North America and should be considered more critically when discussing species coexistence and successional development (Nowacki and Abrams, 1994; McLachlan et al., 2000; Uotila et al., 2002; Aldrich et al., 2005). The most important natural disturb-ance was windthrow. In the majority of old-growth for-ests, broken trees or groups of broken trees resulting from windthrow were observed. Intermediate wind disturbance was documented in four old-growth forests: BA (1947), DO (1931, 1992–95; data for both forests is presented in Korpel, 1995), PE (1950s, 1983, 2004; Nagel et al., 2007) and LB (1880s; Firm et al., 2008).
Conclusions
It seems that old-growth forests in Eastern and South-eastern Europe have been influenced by natural and an-thropogenic disturbances more than previously thought (Leibundgut, 1982). Our results suggest that when discuss-ing old-growth structural dynamics, long-term disturbance history should be considered. Coexistence of fir and beech in mixed mountain forests is influenced by several factors, natural and anthropogenic, which operate at different spa-tial scales. Differences in autoecology, growth rates and tree architecture (Ellenberg, 1988; Stancioiu and O’Hara, 2006) drive their neighbourhood interactions on a local scale. Different ungulate densities, silvicultural systems and air pollution influence the development of mixed forests on a regional scale, as does climate change on an even larger scale. However, it seems that in the last 50 years, the most important factors have been anthropogenic influ-ences, especially air pollution and overbrowsing. Instead of asynchronous, patchy changes in species mixture (White and Pickett, 1985), we have experienced large-scale syn-chronous changes. Firstly, fir had been directly and indir-ectly anthropogenically favoured across the whole forest
at UN
IVE
RSIT
Y O
F LJU
BL
JAN
A on January 25, 2012
http://forestry.oxfordjournals.org/D
ownloaded from

FORESTRY490
landscape until the second half of the 20th century, when anthropogenically influenced decline began. Even with the current radical decrease in SO2 emissions in the region (Stern, 2006), recent trends in Slovenia, and to a certain extent in Slovakia, point to further fir decrease due to lack of regeneration. Our results suggest that the restoration of fir regeneration in old-growth forests would require a sig-nificant reduction in deer abundance, a cessation of feeding and the maintenance of low deer densities over extended periods of time. Because similar processes are found in old-growth and managed forests, the promotion of fir overall also requires the adaptation of silviculture to fir ecology, e.g. the maintenance of high growing stock, longer rotation and regeneration periods, larger target diameters and special modes of regeneration.
Funding
Slovenian Research Agency (P4-0059); Ministry of Agriculture, For-estry, and Food (CRP V4-0540). Regarding the Slovak co-authors, this publication is the result of the project implementation: Centre of Excellence ‘Adaptive Forest Ecosystems’, ITMS: 26220120006, supported by the Research & Development Operational Programme funded by the ERDF.
Acknowledgements
The authors thank Gary Kerr, Thomas A. Nagel, Jan Nagel and two anonymous referees for their valuable comments on the manuscript.
Conflict of interest statement
None declared.
References
Abrams, M.D., Copenheaver, C.A., Terazawa, K., Umeki, K., Takiya, M. and Akashi, N. 1999 A 370-year dendroecological history of an old-growth Abies-Acer-Quercus forest in Hokkaido, northern Japan. Can. J. For. Res. 29, 1891–1899.
Aldrich, P.R., Parker, G.R., Romero-Severson, J. and Michler, C.H. 2005 Confirmation of oak recruitment failure in Indiana old-growth forest: 75 years of data. For. Sci. 51, 406–416.
Anonymous, 2007 Game Density in Hunting Areas of Krivi javor, Golo trlo, Vrhovine i Krekovaca. Unpublished report. Hunting societies of Croatia, Zagreb, Croatia.
Anonymous, 2010 Census of Game Density in Hunting Areas Unsko-Sanske Sume, Sarajevo Sume, Kakanj. Unpublished report. Hunting societies of BiH, Sarajevo, Bosnia and Herzegovina.
ARSO. 2010 EIONET (Environmental Information and Observation Network). http://eionet-en.arso.gov.si/ (accessed on 13 October, 2010). ARSO Environmental Agency of the Republic of Slovenia.
Ballian, D. and Mikic, T. 2003 Changes in the structure of the virgin forest preserve Trstionica. Mitt. aus der Forschungsanstalt für Waldökologie und Forstwirtsch. Rheinl.-Pfalz 50, 238–247.
Braun-Blanquet, J. 1964 Pflanzensoziologie. Grundzüge der Vegetationskunde. Springer Wien, New York, NY.
Busing, R.T. and White, P.S. 1993 Effects of area on old-growth forest attributes: implications for the equilibrium landscape concept. Landsc. Ecol. 8, 119–126.
Davis, M.B. 1996 Eastern Old–Growth Forests: Prospects for Rediscovery and Recovery. Island Press, Washington, DC.
Diaci, J., Rozenbergar, D. and Boncina, A. 2010 Stand dynamics of Dinaric old-growth forest in Slovenia: are indirect human influences relevant? Plant Biosyst. 144, 194–201.
Ellenberg, H. 1988 Vegetation Ecology of Central Europe. Cambridge University Press, Cambridge.
Elling, W., Dittmar, C., Pfaffelmoser, K. and Rötzer, T. 2009 Dendroecological assessment of the complex causes of decline and recovery of the growth of silver fir (Abies alba Mill.) in Southern Germany. For. Ecol. Manage. 257, 1175–1187.
Elliott, K.J., Vose, J.M., Knoepp, J.D., Johnson, D.W., Swank, W.T. and Jackson, W. 2008 Simulated effects of sulfur deposition on nutrient cycling in class I wilderness areas. J. Environ. Qual. 37, 1419–1431.
Ficko, A., Poljanec, A. and Boncina, A. 2011 Do changes in spatial distribution, structure and abundance of silver fir (Abies alba Mill.) indicate its decline? For. Ecol. Manage. 261, 844–854.
Firm, D., Nagel, T.A. and Diaci, J. 2008 Disturbance history and dynamics of an old-growth mixed species mountain forest in the Slovenian Alps. For. Ecol. Manage. 257, 1893–1901.
Gill, R.M.A. 1992 A review of damage by mammals in north tem-perate forests: 3. impact on trees and forests. Forestry 65, 363–388.
Goff, F.G. and West, D. 1975 Canopy-understorey interaction effects on forest population structure. For. Sci. 21, 98–108.
Goodburn, J.M. and Lorimer, C.G. 1999 Population structure in old-growth and managed northern hardwoods: an examination of the balanced diameter distribution concept. For. Ecol. Manage. 118, 11–29.
Horvat, I., Glavac, V. and Ellenberg, H. 1974 Vegetation Sudosteuropas. G. Fischer, Stuttgart, Germany.
Janowiak, M.K., Nagel, L.M. and Webster, C.R. 2008 Spatial scale and stand structure in northern hardwood forests: implications for quantifying diameter distributions. For. Sci. 54, 497–506.
Jerina, K. 2006 Prostorska razporeditev, obmocja aktivnosti in telesna masa jelenjadi (Cervus elaphus L.) glede na okoljske dejavnike. Unpublished Ph.D. thesis, University of Ljubljana, Ljubljana, Slovenia.
Kenderes, K., Mihok, B. and Standovar, T. 2008 Thirty years of gap dynamics in a central European beech forest reserve. Forestry 81, 111–123.
Klopcic, M., Jerina, K. and Boncina, A. 2010 Long-term changes of structure and tree species composition in Dinaric uneven-aged forests: are red deer an important factor? Eur. J. For. Res. 129, 277–288.
Komlenovic, N. 1989 Utjecaj SO2 i nekih drugih polutanata na sumsko drvece s posebnim osvrtom na SR Hrvatsku. Sumarski list 113, 243–260.
Konecnik, K. and Zaplotnik, V. 2001 Pragozdni rezervat Strme c. Unpublished MSc thesis. University in Ljubljana, Ljubljana, Slovenia.
Kordis, F. 1993 Dinarski jelovo bukovi gozdovi v Republiki Sloveniji. Biotehniska fakulteta. Oddelek za gozdarstvo, Ljubljana, Slovenia.
at UN
IVE
RSIT
Y O
F LJU
BL
JAN
A on January 25, 2012
http://forestry.oxfordjournals.org/D
ownloaded from

SILVER FIR DECLINE IN MIXED OLD-GROWTH FORESTS 491
Korpel, S. 1995 Die Urwälder der Westkarpaten. Gustav Fischer Verlag, Stuttgart.
Korpel, S., Penaz, J., Saniga, M. and Tesar, V. 1991 Pestovanie lesa. Priroda, Bratislava, Slovakia.
Kovac, J. 1999 Zgradba pragozdnega ostanka Bukov vrh. GozdV 57, 227–236.
Krause, G., Arndt, U., Brandt, C.J., Bucher, J., Kenk, G. and Matzner, E. 1986 Forest decline in Europe: development and possible causes. Water. Air. Soil. Pollut. 31, 647–668.
Leak, W.A. 1996 Long-term structural change in uneven-aged northern hardwoods. For. Sci. 42, 160–165.
Leibundgut, H. 1982 Europäische Urwälder der Bergstufe. Haupt, Bern, Germany.
Linder, P., Elfving, B. and Zackrisson, O. 1997 Stand struc-ture and successional trends in virgin boreal forest reserves in Sweden. For. Ecol. Manage. 98, 17–33.
Long, Z.T., Pendergast, T.H. IV and Carson, W.P. 2007 The impact of deer on relationships between tree growth and mortality in an old-growth beech-maple forest. For. Ecol. Manage. 252, 230–238.
Lorimer, C.G. 1980 Age structure and disturbance history of a southern appalachian virgin forest. Ecology 61, 1169–1184.
Lorimer, C.G., Dahir, S.E. and Nordheim, E.V. 2001 Tree mortality rates and longevity in mature and old-growth hemlock-hardwood forests. J. Ecol. 89, 960–971.
Lorimer, C.G. and Frelich, L.E. 1984 A simulation of equilibrium diameter distribution of sugar maple (Acer saccharum). Bull. Torr. Bot. Club 111, 193–199.
Matic, S. 1983 Utjecaj ekoloskih i strukturnih cinilaca na prirodno pomladivanje prebornih suma jele i bukve u Gorskom kotaru. Glas. sumske pokuse 21, 223–400.
McLachlan, J.S., Foster, D.R. and Menalled, F. 2000 Anthropo-genic ties to late-successional structure and composition in four New England hemlock stands. Ecology 81, 717–733.
Mikac, S. 2010 Strukturna i regeneracijska dinamika bukovo-jelove prasume Corkova uvala. Unpublished Ph.D. thesis. University in Zagreb.
Mlinsek, D. 1964 Susenje jelke v Sloveniji—prvi izsledki. GozdV 22, 145–159.
Mlinsek, D. 1972 Ein Beitrag zur Entdeckung der Postojna Kontroll methode in Slowenien. Forstw. Cbl. 91, 291–296.
Motta, R. 1996 Impact of wild ungulates on forest regeneration and tree composition of mountain forests in the Western Italian Alps. For. Ecol. Manage. 88, 93–98.
Nagel, T.A. and Diaci, J. 2006 Intermediate wind disturbance in an old-growth beech-fir forest in southeastern Slovenia. Can. J. For. Res. 36, 629–638.
Nagel, T.A., Levanic, T. and Diaci, J. 2007 A dendroecological reconstruction of disturbance in an old-growth Fagus-Abies forest in Slovenia. Ann. For. Sci. 64, 891–897.
Nagel, T.A., Svoboda, M., Rugani, T. and Diaci, J. 2010 Gap regeneration and replacement patterns in an old-growth Fagus Abies forest of Bosnia and Herzegovina. Plant. Ecol. 208, 307–318.
Nowacki, G.J. and Abrams, M.D. 1994 Forest composition, structure, and disturbance history of the Alan-Seeger-Natural-Area, Huntington County, Pennsylvania. Bull. Torrey. Bot. Club. 121, 277–291.
Oszlanyi, J. 1997 Forest health and environmental pollution in Slovakia. Environ. Pollut. 98, 389–392.
Oulehle, F., Hleb, R., Houska, J., Samonil, P., Hofmeister, J. and Hruska, J. 2010 Anthropogenic acidification effects in primeval forests in the Transcarpathian Mts., western Ukraine. Sci. Total. Environ. 408, 856–864.
Prpic, B. 1989 Propadanje suma u SR Hrvatskoj i Jugoslaviji. Sumarksi list 113, 235–243.
Rooney, T.P. 2001 Deer impacts on forest ecosystems: a North American perspective. Forestry 74, 201–208.
Safar, J. 1951 Ugibanje i obnavljanje jele u prebornim sumama Gorskog Kotara. Sumarski list 75, 299–303.
Saltbones, J. and Dovland, H. 1986 Emissons of Sulphur Dioxide in Europe in 1980 and 1983. EMEP MSC-W Report 1/86. Norwegian Meteorological Institute, Oslo, Norway.
Schmelz, D.V. and Lindsey, A.A. 1965 Size-class structure of old-growth forests in Indiana. For. Sci. 11, 258–264.
Shimano, K. 2000 A power function for forest structure and regeneration pattern of pioneer and climax species in patch mosaic forests. Plant Ecol. 146, 207–220.
Stancioiu, P.T. and O’Hara, K.L. 2006 Leaf area and growth efficiency of regeneration in mixed species, multiaged forests of the Romanian Carpathians. For. Ecol. Manage. 222, 55–66.
Stern, D.I. 2006 Reversal of the trend in global anthropogenic sulphur emissions. Glob. Environ. Change 16, 207–220.
Stroh, N., Baltzinger, C. and Martin, J.-L. 2008 Deer prevent western redcedar (Thuya plicata) regeneration in old-growth forests of Haida Gwaii: is there a potential for recovery? For. Ecol. Manage. 255, 3973–3979.
Uotila, A., Kouki, J., Kontkanen, H. and Pulkkinen, P. 2002 Assessing the naturalness of boreal forests in eastern Fenno-scandia. For. Ecol. Manage. 161, 257–277.
Visnjic, C., Vojnikovic, S., Florin, I., Dautbasic, M., Abrudan, I.V. and Gurean, D. et al. 2009 Virgin status assessment of Pljesevica forest in Bosnia-Herzegovina. Not. Bot. Hort. Agrobot. Cluj. 37, 22–27.
Vrecl, M. 1999 Razvoj pragozda Sumik v obdobju 1979–1998. Unpublished report, Slovenia Forest Service, OE Maribor, Slovenia.
Vrska, T., Adam, D., Hort, L., Kolár, T. and Janík, D. 2009 European beech (Fagus sylvatica L.) and silver fir (Abies alba Mill.) rotation in the Carpathians: A developmental cycle or a linear trend induced by man? For. Ecol. Manage. 258, 347–356.
Wang, X., Hao, Z., Zhang, J., Lian, J., Li, B. and Ye, J. et al. 2009 Tree size distributions in an old-growth temperate forest. Oikos 118, 25–36.
Westphal, C., Tremer, N., Oheimb, G.v, Hansen, J., Gadow, K.v and Hardtle, W. 2006 Is the reverse J-shaped diameter distri-bution universally applicable in European virgin beech forests? For. Ecol. Manage. 223, 75–83.
White, P.S. and Pickett, S.T.A. 1985 The Ecology of Natural Disturbance and Patch Dynamics. Academic press, San Diego, CA.
Received 21 January 2011
at UN
IVE
RSIT
Y O
F LJU
BL
JAN
A on January 25, 2012
http://forestry.oxfordjournals.org/D
ownloaded from