structural determination of organic compounds · 2019-11-12 · organic spectroscopy: interaction...
TRANSCRIPT

Structural Determination of Organic Compounds
How do you know your reaction worked?
How do you know your final product is what you wanted?
Is the molecular formula of the product correct?
Are the atoms connected correctly to give you the desired structure?Can you identify all the functional groups of your product?
How can you answer these questions?

Organic Spectroscopy: Interaction of Light/Energy with matter
Mass Spectrometry (Chapter 14)
UV-vis Spectroscopy
IR Spectroscopy
NMR Spectroscopy
The compounds are charged (positive or negative ion) and separated based on the m/z (mass/charge) ratio
Presence or not of a chromophore (double bond containing compound)
Presence or not of different functional groups
- Presence or not of different functional groups - Information on C-C and C-H bonding
Provides the molecular mass of a compound

Mass Spectrometry (Chapter 14)

• The tallest peak in the mass spectrum is called the base peak. • For methane the base peak is also the M peak (molecular ion), although this is usually
not the case. • Though most C atoms have an atomic mass of 12, 1.1% have a mass of 13. • Thus, 13CH4 is responsible for the peak at m/z = 17. This is called the M + 1 peak.
Understanding Mass Spectra (Chapter 14)


Organic Spectroscopy: Interaction of Light/Energy with matter
Mass Spectrometry
UV-vis Spectroscopy
IR Spectroscopy (Chapter 12)
NMR Spectroscopy (Chapter 13)
The compounds are charged (positive or negative ion) and separated based on the m/z (mass/charge) ratio
Presence or not of a chromophore (double bond containing compound)
Presence or not of different functional groups
- Presence or not of different functional groups - Information on C-C and C-H bonding
Provides the molecular mass of a compound
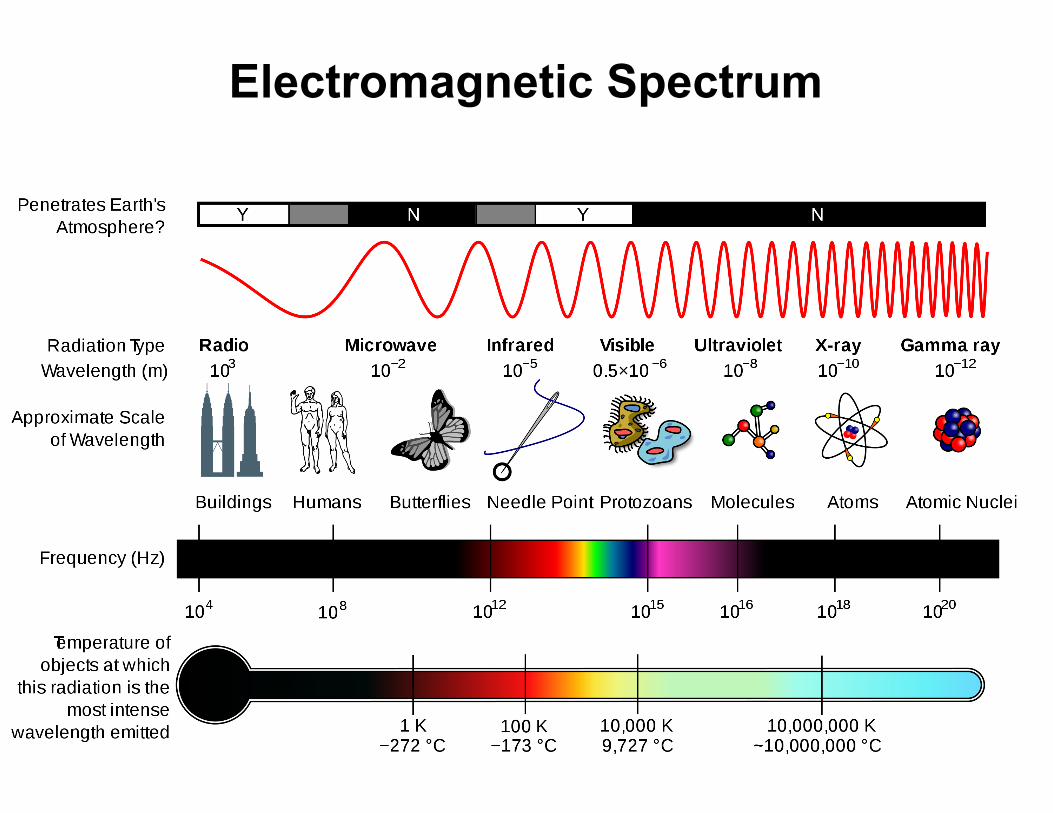
Electromagnetic Spectrum
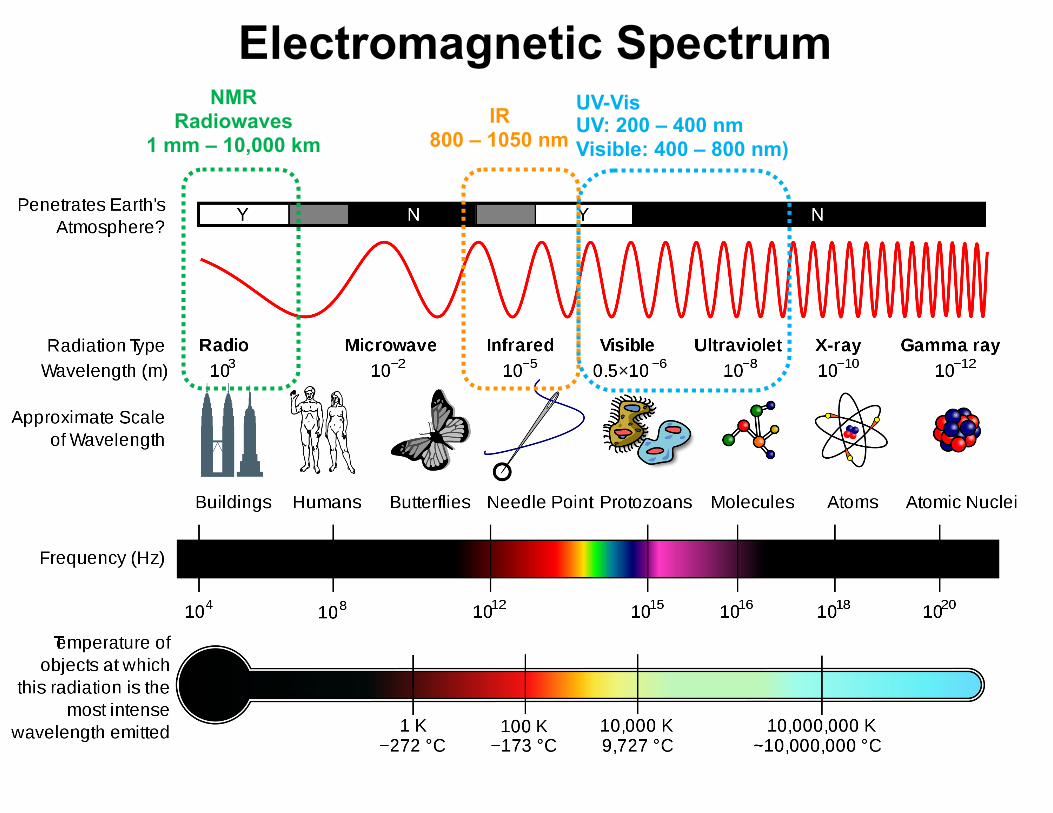
Electromagnetic SpectrumUV-Vis UV: 200 – 400 nm Visible: 400 – 800 nm)
IR 800 – 1050 nm
NMR Radiowaves
1 mm – 10,000 km

IR Spectroscopy (Chapter 12)• Absorption of IR light causes changes in the vibrational
motions of a molecule.

• The different vibrational modes available to a molecule include stretching and bending modes.
• The vibrational modes of a molecule are quantized, so they occur only at specific frequencies which correspond to the frequency of IR light.
Absorption of IR Light

• When the frequency of IR light matches the frequency of a particular vibrational mode, the IR light is absorbed, causing the amplitude of the particular bond stretch or bond bend to increase.
Bond Stretching and Bending

12
• In an IR spectrometer, light passes through a sample. • Frequencies that match the vibrational frequencies are absorbed,
and the remaining light is transmitted to a detector. • An IR spectrum is a plot of the amount of transmitted light versus
its wavenumber. • Most bonds in organic molecules absorb in the region of 4000 cm−1
to 400 cm−1.
Characteristics of an IR Spectrum

13
• The IR spectrum is divided into two regions: the functional group region (at ≥ 1500 cm−1), and the fingerprint region (at < 1500 cm−1).
Figure 13.9
Regions of an IR Spectrum

14
• Bonds absorb in four predictable regions of an IR spectrum.
Four Regions of an IR Spectrum

15

16
• The OH group of the alcohol shows a strong absorption at 3600-3200 cm−1.
• The peak at ~ 3000 cm−1 is due to sp3 hybridized C−H bonds.
IR Spectrum of 2-Butanol

17
• The C=O group in the ketone shows a strong absorption at ~ 1700 cm−1.
• The peak at ~ 3000 cm-1 is due to sp3 hybridized C−H bonds.
IR Spectrum of 2-Butanone

18
• The N−H bonds in the amine give rise to two weak absorptions at 3300 and 3400 cm−1.
IR Spectrum of Octylamine

19
• The amide exhibits absorptions above 1500 cm−1 for both its N−H and C=O groups: N−H (two peaks) at 3200 and 3400 cm−1; C=O at 1660 cm−1.
IR Spectrum of Propanamide

20
• The C≡N of the nitrile absorbs in the triple bond region at ~ 2250 cm−1.
IR Spectrum of Octanenitrile

• OH

• C=O
NMR Spectroscopy (Chapter 13)

24
Nuclear Magnetic Resonance Spectroscopy
• Nuclear magnetic resonance spectroscopy is a powerful analytical technique used to characterize organic molecules by identifying carbon-hydrogen frameworks within molecules.
• Two common types of NMR spectroscopy are used to characterize organic structure:
• 1H NMR is used to determine the type and number of H atoms in a molecule; and
• 13C NMR is used to determine the type of carbon atoms in a molecule.
• The source of energy in NMR is radio waves which have long wavelengths, and thus low energy and frequency.
• When low-energy radio waves interact with a molecule, they can change the nuclear spins of some elements, including 1H and 13C.

NMR (Nuclear Magnetic Resonance)
Spectroscopy

MRI (Magnetic Resonance Image)
NMR spectroscopy is applied to small and medium sized (proteins) organic molecules. Most commonly used: 1H NMR All different hydrogens in a compound have a unique interaction with the applied magnetic field resulting in different NMR signals.What is the origin of the NMR signal?
Same basic technique as:
An MRI is NMR-spectroscopy applied to whole body parts, not individual molecules (Biological NMR).
Human body: 75% water The 1H atoms in each water molecule interact differently with the applied magnetic field based on their different environments, resulting in different signals...

27
• When a charged particle such as a proton spins on its axis, it creates a magnetic field, causing the nucleus to act like a tiny bar magnet.
• Normally, these tiny bar magnets are randomly oriented in space. • However, in the presence of a magnetic field (B0), they are
oriented with or against this applied field. • More nuclei are oriented with the applied field because this
arrangement is lower in energy. • The energy difference between these two states is very small (<0.1
cal).
Magnetic Fields in NMR

28
• An NMR spectrum is a plot of the intensity of a peak against its chemical shift, measured in parts per million (ppm).
1H NMR Spectra


33
Regions in the 1H NMR Spectrum


39
• 13C Spectra are easier to analyze than 1H spectra because the signals are not split.
• Each type of carbon atom appears as a single peak.
13C NMR Spectrum Example