structural and biochemical invest igations of the
TRANSCRIPT

STRUCTURAL AND BIOCHEMICAL INVESTIGATIONS OF THE MECHANISM OF
HEME CAPTURE BY THE HEMOPHORE HasAp SECRETED BY
PSEUDOMONAS AERUGINOSA
BY
GRACE JEPKORIR LAGAT
B.Ed. (Sci.), Kenyatta University, 1999 Nairobi, Kenya
M.Ed. (Adm.), University of Eastern Africa, Baraton, 2002 Eldoret, Kenya
Submitted to the graduate degree program in Chemistry and the Graduate Faculty of the University of Kansas in partial fulfillment of the requirements for the degree of
Doctor of Philosophy
Committee members:
___________________________ Mario Rivera, Ph. D. (Chair) ___________________________ Robert C. Dunn, Ph. D. ___________________________ Susan Lunte, Ph. D. ___________________________ Mikhail Barybin, Ph. D. ___________________________ Minae Mure, Ph. D.
___________________________ Wonpil Im, Ph. D.
Date Defended: April 19, 2011

ii
The Dissertation Committee for Grace Jepkorir Lagat certifies that
this is the approved version of the following dissertation:
STRUCTURAL AND BIOCHEMICAL INVESTIGATIONS OF THE MECHANISM OF
HEME CAPTURE BY THE HEMOPHORE HasAp SECRETED BY
PSEUDOMONAS AERUGINOSA
Committee:
___________________________ Mario Rivera, Ph. D. (Chair) ___________________________ Robert C. Dunn, Ph. D. ___________________________ Susan Lunte, Ph. D. ___________________________ Mikhail Barybin, Ph. D. ___________________________ Minae Mure, Ph. D.
___________________________ Wonpil Im, Ph. D.
Date Approved: April 19, 2011
iii
ABSTRACT
HasAp is a hemophore secreted by Pseudomonas aeruginosa to the extracellular media
under iron limited conditions to sequester heme from the host cell. The heme HasAp complex is
captured by the specific cell surface receptor HasR for subsequent internalization. X-ray and
solution NMR structures of holo and apo hemophores have been solved but so far no studies
have been done to elucidate the mechanism of heme loading. In the apo form, the loop bearing
the distal heme iron ligand His 32 is located nearly 30 Å away from its position in the holo form.
In contrast, the loop bearing the proximal ligand Tyr 75 maintains structural integrity in the apo
and holo forms. This study aimed at investigating the sequential steps that lead to heme binding
by HasAp and the role played by the axial-ligand bearing loops in the process of heme capture. A
chromatographic method was developed to isolate and purify wild type and H32A apo HasAp.
Heme binding was monitored by stopped flow spectroscopy. The results show that heme loading
proceeds in two discrete kinetic phases; an initial rapid phase which entail loading of the heme
onto the Tyr 75 loop followed by a slow phase where the His 32 loop undergoes a large
conformational rearrangement and subsequent coordination of the heme. Molecular dynamic
simulations provided more insights into the molecular motions that relay the presence of the
heme in the Tyr 75 loop to the His 32 loop.
To investigate the role played by the axial ligand bearing loops in heme binding, crystal
structures and solution NMR studies of the apo and holo H32A-HasAp, as well as H32A-
imidazole complex were carried out. The results reveal that the His 32 loop assumes a position
similar to the wild type protein even in the absence of a coordinating residue. This implies that
the presence of the heme in the Tyr 75 loop triggers the relocation of the His 32 loop and that this

iv
loop is important in protecting the macrocycle from the aqueous media. The crystal structures of
Y75A and H83A show that the proteins assume the original fold although there are some
conformational changes in the His 32 loop and in the secondary structure elements in regions of
the protein implicated to interact with the receptor during heme release. These observations
imply that information is relayed between the Tyr 75 loop and the secondary structure elements
affected likely via the His 32 loop. It was also established that His 83 does not necessarily
coordinate the heme in the absence of Tyr 75.
Heme transfer experiments using methemalbumin as a heme source revealed that the rate
of heme release from methemalbumin correlates with the rate of heme uptake by apo-HasAp.
These rates are comparatively higher than the rate of heme uptake from other host heme proteins;
however, they are comparable to the rate of dissociation of heme from methemalbumin in the
absence of the hemophore. These results mean that methemalbumin is likely the potential target
for HasAp and that heme transfers by passive diffusion and is affinity driven.

v
ACKNOWLEDGMENTS
First and foremost I thank God for life, wisdom, and knowledge, and for sustaining me,
through it all, during the course of my studies.
Northing worthwhile is ever done alone under the sun. My achievement is a worthwhile
course that has taken the positive minds and caring hearts of all the people who have crossed my
path ever since I took the initial step to climb the academic ladder. I am always and will ever be
grateful to my dear parents for raising me and bringing me this far through their endless love,
self-sacrifice, encouragement, and most of all for believing in me to make the best out of every
circumstance. “Dad and Mom, I was always reassured of your great love, care, and unfailing
support whenever you made a direct transatlantic call just to check on us. I reiterate my
appreciation - THANK YOU SO MUCH. We made it because of you.”
I am also deeply and humbly grateful to every other individual who in one way or another
made it possible for me to complete this journey. I especially thank my advisor, Dr. Mario Rivera
for granting me the opportunity to learn from him and work with him, and for guidance,
encouragement, and continuous support throughout my studies. I am also indebted to my
committee members: Dr. Robert Dunn, Dr. Susan Lunte, Dr. Mikhail Barybin, Dr. Minae Mure
and Dr. Wonpil Im for all their help and advice, and for taking the time to critique my work.
I owe great appreciation to the current and past members of Dr. Rivera Lab: Dr. Juan
Carlos Rodriguez, Dr. Yuhong Zeng, Dr. Christopher O. Damaso, Dr. Andy Wang, Dr. Aileen Y.
Alontaga, Bailey Morgan, Jordan Stobaugh, Maggie Murphy, Casey Gee, Dr. Huili Yao, Dr.
Saroja Weeratunga, Yan Wang, Pavithra N. Vani, Ritesh Kumar and Kate Eshelman. Thank you

vi
for your support, positive criticisms, and encouragement more so when I had to burn the
midnight lamp working in the lab.
I thank our collaborator Dr. Pierre Moënne- Loccoz for the EPR, RR, and SFS results; Dr.
Scott Lovel for his helpful advice on screening for protein crystal growth and for solving the
crystal structures of the proteins; Kevin. P. Battaile for collecting crystallographic data; and Dr.
Wonpil Im and Huan Rui for the molecular dynamics simulation results.
I also wish to thank Pr. Tony Cash and all the Lawrence (KS) and Philadelphia (IA)
Adventist church members, all my relatives and neighbors, and everyone else who stood by me
throughout this journey. I cannot enlist all your names but please know that your prayers, your
love and your support were a constant source of strength and encouragement.
To my great mentor Prof. Denford Musvosvi, and my true and exemplary friends Dr.
Donita Massengill-Shaw, Dr. Jeraldine Wilson, Dr. Janet Tarus, Dr. Maru Kering, Sarah and
Luka Kapkiai, Louisa Murunga, Dr. Aileen Alontaga, Rebecca Llasaca, Sayool Oh, and Dr.
Jackie Obey, thank you so much for your friendship, selfless actions and kind thoughts. You
were my inspiration to strive and to work harder.
Last but not least I owe a lot to all my wonderful siblings: Luke, Joshua, Janet, Japheth,
Damaris, Abigael, Lucy, Rupo, and Gladys. Words cannot express how much I appreciate you
all for the many ways you supported me and gave me your shoulders to lean on at all times. I
will never be able to give back anything in return but please know that I deeply appreciate each
and every one of you.
To my husband Steve, “you are one of a kind. Thank you for opening the door for me,
bearing my absence from home for the longest possible period, and for enduring all the
challenges to the very end.” My precious daughter Beverly, “your unfailing love, your smile, and

vii
your patience gave me a reason to rise up every day determined to achieve my goal. This
milestone is our achievement. God has brought us this far and together we have made it!” Thank
You Bev. Thank You All.

viii
DEDICATION
To
My Dear Parents
(Mr. and Mrs. Eliud Lagat)

ix
TABLE OF CONTENTS
CHAPTER I 1 INTRODUCTION….……………………………………………………………………….…...1
Iron uptake by bacteria………………………………………………….…………….…...2
Heme uptake systems in Gram negative bacteria................................................................ 4
Hemophore-dependent heme acquisition systems…...…………………..................…......6
Proposed working mechanism of hasA...............................................................................7
Structure of the model hemophore HasAs…………………………..………………….. 12
Mechanism of heme uptake in HasA……………………………..…….…………….….16
Heme binding studies…………………………………………………………………….16
RESEARCH PROBLEM AND RATIONALE…….………………………………………….....17
REFERENCES ……………………………….………………………………….…...……..…. 20
CHAPTER II 27
Structural, NMR Spectroscopic and Computational Investigation
of Heme Loading in the Hemophore HasAp from Pseudomonas
aeruginosa
INTRODUCTION ……….……………….……………………………….…………….………27
EXPERIMENTAL PROCEDURES ….……………..……………………………......................30
Construction of H32A-HasAp ………………….…………………………….…………30
Expression and Purification of apo-proteins………………………………………….…30
Expression and Purification of Uniformly Labeled Proteins …………...………………33
Expression and Purification of Selectively Labeled Proteins……………………………34
Sample preparation……………………………………………………………..………..35
Determination of molecular weight …………………………………………….……….36
Resonance Raman (RR) and EPR Spectroscopy……………………….……………..…38
X-Ray Crystallography…………………………………………………………………..38
NMR Spectroscopy…………………………………..….……………………………….39

x
Targeted Molecular Dynamics (TMD) Simulations …….…………………..…………..42
RESULTS…………………………………………………………………………………..…....46
Purification of the apo-proteins ………………………………………………………....46
Structural Characterization of apo-HasAp ….…………………………………………..46
Conformational changes observed upon hemin binding onto apo-HasAp……...……….51
Characterization of H32A-HasAp mutant……………………………………………….53
Structural Characterization of H32A-holo-HasAp by X-ray crystallography…………...57
Imidazole complex of monomeric H32A-holo-HasAp…………………………………..62
X-ray crystal structure of the H32A-imidazole complex………………………………...62
Characterization of monomeric H32A-HasAp by NMR Spectroscopy………………….65
Targeted Molecular Dynamics Simulations (TMD)………………………….….………72
DISCUSSION …………………………………………………………………………………...76
Structure of apo-HasAp and conformational changes that occur upon heme loading…..76
Characterization of H32A-HasAp mutant…………………………………………….…77
Kinetic and spectroscopic studies reveal a two-step mechanism of heme-loading
by HasAp…………...………………………………………………………………...….78
Structural characterization of H32A-HasAp mutant by X-ray crystallography
and NMR spectroscopy…………………………………………………………………..80
Relocation of His32 loop proceed via a well-defined path ………………………….…..82
APPENDICES….………………………………………………………………………………..84
REFERENCES ………………………………………………………….……………...…...…..97
CHAPTER III 103
Effects of Proximal Ligand Substitutions on Heme Coordination
and Structural Integrity of HasAp
INTRODUCTION ……………………………………………………………………………..103
EXPERIMENTAL PROCEDURES……….………………………………………...................106
Construction of Y75A and H83A HasAp mutants….……………….………….………106
Expression and purification of Y75A and H83A mutants..…………………………….107
Preparation of holo protein………………………………………………………...…...110

xi
Determination of extinction coefficient for the Y75A- and H83A-heme complex.……110
Protein crystallization……………………………………………………………...…...111
Data collection, structure determination and refinement..……………..........................112
RESULTS ………………………..…………………………………………………………….117
Purification of Y75A and H83A mutants…………………………………………..…..117
Characterization by UV-vis spectroscopy……………………………...………………118
X-ray Crystallography……………………………………………………………...…..121
Crystallization of Y75A and H83A HasAp mutants ………………………..…122
Crystal structures of Y75A and H83A HasAp mutants ……………………….…...…...123
Heme iron coordination and conformational changes involving His 32 and
Tyr 75 loops…. …...........................................................................................................129
Overall structure of HasAp mutants .………………………………………………….130
DISCUSSION ………………………………………………………………………………….136
APPENDICES …………………………………………………………………………………140
REFERENCES ………………………………………………………………………………...145
CHAPTER IV 148
Methemalbumin is the potential target for the hemophore HasAp
as a heme source; inferences from heme transfer studies
INTRODUCTION ………………………………………………………………......................148
EXPERIMENTAL PROCEDURES …………………………………………………………...150
Expression and Purification of apo-HasAp……...……………………………………...150
Preparation of Human Serum Albumin (HSA)…………………………….…………...151
Quantitation of heme in methemalbumin…………………………………...………….151
Heme transfer assays….………………………. …………………………………….....152
Evaluation of heme transfer by polyacrylamide gel electrophoresis (PAGE)…….……152
Quantitation of heme transfer……………………………………………...………...…153

xii
RESULTS AND DISCUSSION …………………………………………………....................153
Sample preparation…………………………………………….……………………….153
Spectroscopic changes observed upon incubation of apo-HasAp
with methemalbumin……………………………………………………………...........154
Heme uptake by apo-HasAp correlates with heme loss from methemalbumin………...157
Evaluation of heme transfer by PAGE………………………………………………….160
Heme transfer from methemalbumin to H32A-HasAp mutant……………………........164
REFERENCES…………………………………………………………………………………167
CHAPTER V 170
SUMMARY ……………………………………………………………………………………170
REFERENCES ………………………………………………………………………………...175

xiii
LIST OF TABLES
CHAPTER 2
Table 1. Crystallographic data of HasAp structures........................
44
CHAPTER 3
Table 1. Data collection and Refinement Statistics of HasAp mutants …………………………………........................
116
Table 2. Distances between key residues or molecules and heme-
iron……………………………………………………….
129

xiv
LIST OF FIGURES
CHAPTER 1
Figure 1. Map of the P. aeruginosa heme uptake locus containing the phuR gene and the phuSTUVW operon. Three Fur binding elements are shown as white boxes (adapted from ref 34)……....
4
Figure 2. Genetic organization of the has systems in P.a., Pseudomonas aeruginosa and S.m., Serratia marcescens. HasI and hasS encode sigma and antisigma factors, respectively. The white boxes indicate consensus Fur boxes (adapted from ref 41)……...
6
Figure 3. Simplified schematic of the proposed working mechanism of the has system………………………………………………………..
8
Figure 4. Schematic illustration of the protein complex involved in energy transduction from the cytoplasmic membrane to the outer membrane in Gram-negative bacteria. OM: outer membrane; PP: periplasmic space; CM: cytoplasmic membrane (adapted from ref 54)…………………………………………………………….
9
Figure 5. Comparison of the crystal structure of Holo-HasASM (PDB ID. 1DKO) (A), and the crystal structure of HasAp (PDB ID. 3ELL) (B) showing the elements of secondary structure. The -helices are shown in cyan, -sheet in magenta, loops in green, heme in red and ligands in blue. His 83 is colored orange…………….....
13
Figure 6. Zoomed in view of the heme binding site in the crystal structure of HasAs. (A) solvent exposed prosthetic group; heme is shown in red while the water molecules are represented by blue spheres. (B) Hemin coordination ligands His 32 and Tyr 75 (blue) and the adjacent residue His 83 (orange)……………………………..
14

xv
Figure 7. Amino acid sequence alignment of full-length HasA sequences
from P. aeruginosa (Pa), Serratia marcescens (Sm), P. entomophila (Pe), P. fluorescens (Pf), Yersinia pseudotuberculosis (Yps), Pectobacterium carotovorum (Pc), Erwinia carotovora (Ec), Yersinia pestis (Yp), and Yersinia pestis bv. Antiqua (Ypa) aligned against the sequence of HasA from P. aeruginosa. Truncated HasAp used in these investigations stops at residue 184 (full-length minus 21 amino acids) [13]. Residues highlighted in red are conserved. The alignment was performed using ClustalW [68]…………………..
15
CHAPTER 2
Figure 1. X-ray crystal structure of truncated HasAp monomer B (PDB: 3ELL) showing -helices (cyan), -strands (magenta), loops (wheat), heme (red), and heme axial ligands (green)………...................………………………. 29
Figure 2. DNA and amino acid sequence of HasAp-TR. The Nde I and BamHI restriction endonuclease sites were constructed at the 5' and 3' ends, respectively, for subcloning. The underlined codon represents the mutation of His to Ala at position 32…….……………………………………….......
32
Figure 3. The simulation system of hemin bound apo-HasAp. (A) Hemin bound apo-HasAp. (B) Hemin bound apo-HasAp with 0.15 M KCl. (C) Hemin bound apo-HasAp with 0.15 M KCl aqueous solution. Apo-HasAp (yellow) is shown in cartoon representation with the His32 and Tyr75 loops highlighted in magenta. Hemin is shown in red sticks, hemin iron as an orange sphere, K+ as magenta spheres, and Cl- as green spheres. Waters molecules are represented by lines (marine)……………….……………….
43
Figure 4. X-ray crystal structure of apo-HasAp (PDB: 3MOK). His32 loop is shown in green, Tyr75 loop is shown in red, while His 32 and Tyr 75 are shown in magenta and orange, respectively………………………………………………....………… 47
Figure 5. Overlaid x-ray crystal structures of HasAp showing the position of the loops in apo- (green) and holo-(red) wild type protein. Hemin is colored blue, axial ligands in holo-HasAp are shown in orange …………………………………………….………………...………
48

xvi
Figure 6. Amino acid sequence alignment of full-length HasA sequences from P. aeruginosa (Pa), Serratia marcescens (Sm), P. entomophila (Pe), P. fluorescens (Pf), Yersinia pseudotuberculosis (Yps), Pectobacterium carotovorum (Pc), Erwinia carotovora (Ec), Yersinia pestis (Yp), and Yersinia pestis bv. Antiqua (Ypa) aligned against the sequence of HasA from P. aeruginosa. Truncated HasAp used in these investigations stops at residue 184 (full-length minus 21 amino acids) [13]. Residues highlighted in red are conserved while those in blue are the His32 loop “hinge” residues in HasAp. The alignment was performed using ClustalW [45]…………………….……………………………………………………. 49
Figure 7. (A) Overlay of apo (magenta) and holo (turquoise, PDB: 3ELL) HasAp showing a zoomed in view of the “hinge” region of the His32 bearing loop.(B) Apo-HasAp showing the aromatic side chains (green) that stabilize the �1-loop near the Gly 28 hinge; the H32 loop is shown in magenta. (C) Apo-HasAp showing the aromatic side chains (green) that stabilize the structure near the Gly 44 hinge. The hemin molecule of holo-HasAp (PDB: 3ELL) is shown in red for reference…..…………................................................................................... 50
Figure 8. Overlay of apo (magenta) and holo (turquoise, PDB: 3ELL) HasAp (A) Zoomed in view of the heme binding pocket showing conformational differences between certain residues upon hemin binding. (B) Displacement of helix �2 and the short loop comprised by G143 and D144 relative to the apoprotein upon hemin binding; movement of the latter enables hinge residue G 28 in the holo structure to adopt its hemin bound conformation…………………….…………………………………………..
52
Figure 9. (A) Elution profile of H32A holo-HasAp from a Sephadex G-75 column; open circles track the Soret band absorption (∼A400 nm) and black circles track A280 nm. (B) Electronic absorption spectra of fractions in the fast eluting peak (black, dimer) and in the slow eluting peak (red, monomer). The ratio of dimer to monomer obtained under these experimental conditions is ∼15%. (B) Elution volumes (Ve) from a calibrated Superdex 75 column and estimated molecular weights for monomer holo H32A HasAp (red triangle), dimer holo H32A HasAp (green diamond), and apo H32A HasAp (blue triangle); the average molecular weight was obtained from two experiments. The Superdex 75 column was calibrated with albumin (67 kDa), ovalbumin (44 kDa), chymotrypsin (25 kDa), and cytochrome c (12.4 kDa) shown in black filled circles….……………….…
54

xvii
Figure 10. (A) Resonance Raman spectra (obtained at 105 K) of the first and second fractions of H32A-holo-HasAp (λexc = 413 nm, 20 mW; the spectra were normalized on the intensity of the 4 observed at 1375 cm-1). (B) X-band EPR spectra of the first and second fractions of H32A-holo-HasAp obtained at 10 K (0.03 mW microwave power, 9.66 GHz microwave frequency; 10 G modulation amplitude). The two spectra were normalized based on their hemin content determined by the pyridine hemochrome assay.………………………………………………………..………….…… 55
Figure 11. 15 % SDS-PAGE of HasAp pure samples; M- protein ladder, 1- slow eluting band (monomer), 2- fast eluting band (dimer), and 3-apo-HasAp.………………………………………...……………………………. 56
Figure 12. (A) Structure of the H32A holo-HasAp dimer. Subunits A is colored light pink and B is colored slate. Disordered residues in subunit B are located between the asterisks. Heme in subunit A and B is colored pink and blue, respectively. (B) Proximal site of heme in subunit A showing Tyr 75 coordination, and H-bonding interactions involving the propionates and Arg 129 from the same subunit and Tyr 138 from subunit B. Tyr75 loop is colored wheat. (C) 2Fo – Fc electron density maps of the hemin molecules in the dimer contoured at 1σ represented as a green surface ………................................................................................................
58
Figure 13. (A) Superimposed crystal structures showing H32 loops of apo wt (magenta), holo wt (cyan), and holo H32A (red) HasAp. The heme molecules associated with holo wt and holo-H32A are colored blue and gold, respectively (B) Spherical representation of subunit A and associated heme (orange). The H32 loop is colored red, and hydrophobic residues Phe 51, Tyr 75, Leu 77, Phe 78, and His 83 in the heme binding site are colored green………….…………………………………………………………….. 59
Figure 14. UV-Vis spectra of monomeric holo-H32A-HasAp (red) and induced dimer (black). …………………………………………………….....…………….
61
Figure 15. Family of electronic absorption spectra (A) and the binding curve (B) obtained upon mixing imidazole and H32A holo-HasAp. The complex was formed by adding fresh protein (final concentration 5 uM) to known concentrations of imidazole buffer (0-100 mM), pH 7.0. Each data point was recorded after 2 min incubation.……………………………………..… 63

xviii
Figure 16. X-ray crystal structure of H32A-imidazole complex. (A) Molecule A; heme and imidazole are colored magenta while His 32 and Tyr 75 loops are colored light pink. (B) Molecule B; heme and imidazole are colored cyan while the His32 and Tyr75 loops are colored light cyan. Disordered residues are indicated between the asterisks in both molecules. (C) 2Fo - Fc electron density maps of the heme and heme-bound imidazole in molecule A (top) and molecule B (bottom) of the H32A-imidazole complex contoured at 1σ. (D) Surface representation of the H32 loop in the structure of the H32A-imidazole complex. The imidazole molecule (magenta) is locked in place by Val 38 and Met 141 side chains, and a hydrogen bond formed with the carbonyl oxygen of Asn 42. (E) Superposition of molecule A of the H32A-imidazole complex (magenta) with molecule A of wt holo-HasAp (cyan). Residues in the H32 loop are colored darker…………………………………………………………...….. 64
Figure 17. 1H-15N-HSQC-TROSY spectra of H32A HasAp (A) and H32A-imidazole (B). Spectra were taken at 32 oC using a Varian Inova spectrometer operating at 600 MHz 1H frequency. Acquisition parameters are as follows: 1,710 (1H) x 400 (15N) complex points; 8.9 kHz (1H) and 2.3 kHz (15N) spectral widths; 8 scans per increment; d1=1s. Spectra were processed using NMRPipe software as follows: data in the 15N dimension were linear predicted to twice the number of points and zero-filled in each dimension to yield a data matrix of 4k x 4k points. Spectra were referenced to internal DSS using the methyl peak at 0 ppm for the 1H dimension and indirectly using the ratio of gyromagnetic ratios for the 15N dimension…………………………………………………………………… 66
Figure 18.
Resonance assignments available for H32A-HasAp (A), H32A-imidazole (B), and wt HasAp (C) are mapped in gray on the structure of wt holo-HasAp; residues for which resonances could not be obtained are shown in green, prolines are in blue, and the hemin is in red…...…………………….
67
Figure 19. HSQC spectra obtained with samples of 15N-Gly-H32A-imidazole using standard (A) and fast-repetition (B-E) conditions. Spectra were taken at 32 °C (A and D), 15 °C (B), 25 °C (C), and 38 °C (E). Cross-peaks are labeled according to the corresponding sequential assignment. The cross-peak identified as Gly44 is observed only in spectra collected at 32 and 38 °C using a short relaxation delay (50 ms) and short acquisition time (35 ms). The spectra were recorded with 100 increments in t1 (15N); 630 complex points in t2 (1H), over a spectral width of 8.9 kHz (1H) and 2.3 kHz (15N), with 256 scans per increment for all temperatures except 15 °C, for which 512 scans were used. The data were processed using NMRPipe applying a 90°-shifted squared sine bell apodization function in each dimension,

xix
followed by zero filling to 4k data points in t2, and linear prediction to twice the number of points and zero filling to 4k data points in t1. Subsequent Fourier transformation and phasing rendered matrices of 4k × 4k points………………………………………………….…...……………
69
Figure 20. HSQC spectra obtained with samples of 15N-Val-H32A-HasAp (A and B) and 15N-Val-H32A-imidazole (C and D). Spectra in (A) and(C) were acquired with standard acquisition parameters, whereas spectra in (B) and (D) were collected with fast-repetition conditions. Dashed lines in spectra (C) and (D) highlight one of the cross-peaks attributed to Val 37 or Val 38, which is clearly visible only in the HSQC spectrum (and corresponding 1D trace) acquired with fast repetition conditions. Cross-peaks are labeled according to their sequential assignment. Cross-peaks originating from backbone amides of Ala residues are present because of isotopic scrambling, and are clearly identified by comparison with the HSQC spectrum obtained with uniformly labeled protein.…………………………
71
Figure 21. A possible path for closing of the H32 loop upon hemin binding; the heavy atom rmsd between initial (apo-) and final (holo-) structures is 5.73 Å, including snapshots at rmsd 5.42 Å (A), 4.87 Å (B), 4.06 Å (C), 2.64 Å (D), 1.61 Å (E), and 0.61 Å (F). The apo- (gray) and intermediate (cyan) structures are shown in cartoon representation. Residues involved in important interactions are shown in either stick or sphere representation, and when appropriate, the same residues in the apo-structure are also shown to indicate their initial positions. The His32 loop and the turn (Ser 60 to Ser 63) are highlighted in magenta and yellow, respectively. The hemin and hemin-iron are shown as red sticks and orange spheres, respectively..…………………………….......................................................
74
Figure 22. (A) Absorption spectra of wild type HasAp (black), H32A variant (red), and heme (blue). Stopped-flow absorption traces obtained with apo-wt (B) and apo-H32A (C) upon mixing with hemin……………………………….. 80
CHAPTER 3
Figure 1. Zoomed in view of the heme pocket in the hemophore HasAp. Heme coordination ligands His 32 and Tyr 75 are colored blue. His 83 is colored orange. ………………………………...……… 103

xx
Figure 2. DNA and amino acid sequence of HasAp-TR. The Nde I and BamHI restriction endonuclease sites were constructed at the 5' and 3' ends, respectively, for subcloning. The underlined codon represents the mutation of Tyr or His to Ala at position 75 and 83, respectively ………...…………………………………………….
109
Figure 3. X-ray fluorescence scan for zinc using a H83A crystal ………… 114
Figure 4. Phased anomalous difference map calculated using data collected at λ=1.0000 Å (red mesh) contoured at 4σ showing the Zinc ion sites in H83A ……………………………..…….………………… 114
Figure 5. Phased anomalous difference map using data collected at λ=1.0000 Å (red mesh) and 1.28414 Å (low energy remote, green mesh) contoured at 4σ. The anomalous difference density increases at the hemin Fe atom and disappears at the Zinc ion site when using the low energy remote wavelength data……………...
115
Figure 6.
Elution profile of Y75A-HasAp from Sephadex G-75 column; open circles track the soret band abruption (~406 nm) and the black circles track absorbance at 280 nm. A similar profile was observed with the H83A-HasAp mutant….……………………… 117
Figure 7.
Elution volumes (Ve) from a calibrated Superdex 75 column and estimated molecular weight of Y75A HasAp (red triangle) and H83A HasAp (green diamond). The Superdex 75 column was calibrated with albumin (67 kDa), ovalbumin (44 kDa), chymotrypsin (25 kDa), and cytochrome c (12.4 kDa) shown in black filled circles…………………………………………………
118
Figure 8. Electronic absorbance spectra of Y75A (black) and H83A (red) recorded in sodium phosphate buffer (µ = 0.1, pH 7.8).…….…….
120
Figure 9. pH titration spectra of H83A over a pH range of 5.0 to 9.5 in sodium phosphate buffer , µ = 0.1.……………………………….. 120

xxi
Figure 10. (A) Original crystals of H83A obtained from 10% isopropanol, 100 mM sodium cacodylate pH 6.5, 200 mM zinc acetate; (B) Refined crystals obtained from 10% isopropanol, 100 mM sodium cacodylate pH 6.5, 200 mM Zinc acetate, 3% dioxane. (C) Single crystals of Y75A obtained from Hampton Crystal Screen 2 #32 ((1.6M (NH4)2SO4, 100 mM HEPES pH 7.5, 200 mM NaCl)……………………………….………………………... 123
Figure 11. 2Fo-Fc electron density map contoured at 1; (A) Electron density at the heme showing that it adopts a single orientation; (B) Electron density of the refined formate ion; (C) Zoomed in view of heme binding pocket. (D) Sphere representation of Tyr75 loop and coordinated formate ion.………………………………...
125
Figure 12. 2Fo-Fc electron density map at the heme contoured at 1 (A), and zoomed in view of heme binding pocket in H83A crystal form 2 (B) and H83A crystal form 1(C)………………………………….
126
Figure 13. Heme-iron ligands and residues that make direct contact with the
propionates in WT, Y75A, and H83A HasAp mutants…………..
127
Figure 14. Zoomed in view of His32 and Tyr75 loops of wild type HasAp (magenta), Y75A (green), H83A crystal form 1(cyan), and H83A crystal form 2 (lemon)……………………………………………
128
Figure 15. Conformational changes in the backbone and side chains of amino acid residues that constitute His 32 loop and Tyr 75 loop in Y75A (green) and H83A (cyan) compared to WT (magenta)…....
130
Figure 16. X-ray crystal structures of (A) WT HasAp monomer B (PDB: 3ELL), (B) Y75A (C) H83A crystal form 2, (D) H83A crystal form 1. Secondary structures are colored cyan (a-helices), magenta (b-strands) and green (loops). 310-helices, reflecting a gain in secondary structure elements are colored purple (Fig. B and C). 5* and 7* (Fig C and D) are new hairpin loops

xxii
resulting from loss of corresponding beta sheet character. Missing electron density is marked with white asterisks (Fig D)…………. 132
Figure 17. Conserved hydrogen bonding interactions involving residues in 2 (Asn 47), 3 (Ser 54, Gln 55) and the loop connecting 6 and 7 (Ala 102 and Tyr 107)…………………………………….……
134
Figure 18. Putty representation of B-factors color traced on the structures
increasing from blue to red and corresponding per residue
plots.................................................................................................. 135
CHAPTER 4
Figure 1. UV-vis spectra of methemalbumin (black), and holo-HasAp red)…………………………………………………….………….
155
Figure 2. A family of electronic absorption spectra of methemalbumin (~10 M) incubated with apo-HasAp (40 M) at 37 o C recorded as a function of time. Arrows show the direction of spectral changes as the reaction progressnot perturbed are in green. Residues which disappear are in marine. The heme is in magenta………..... 155
Figure 3. UV-Vis spectra of the reaction product (red) and holo-HasAp (black) with similar concentrations. The spectrum of methemalbumin (blue) is shown for reference …………….…….. 156
Figure 4. Elution profile of serum albumin and HasAp from a Sephadex G-75 column; blue circles track A280nm while red circles track the soret ………………………………………………………..……. 157
Figure 5. A plot showing changes in absorbance at 407 nm when methemalbumin is incubated with 4-fold excess apo-HasAp with constant stirring at 37 oC. ………………………………………. 158
Figure 6. A plot showing absorbance changes occurring in the visible region when methemalbumin was incubated with four-fold apo-

xxiii
HasAp. The reaction was monitored as a function of time at 500, 535, 574, and 618 nm.…………………………………………… 158
Figure 7. 13 % native polyacrylamide gel showing the reaction products obtained from a mixture of apo-HasAp and methemalbumin incubated for 2, 5, 10, 20, 30, 60 min at 37 oC.…………………..
162
Figure 8. 13 % Native gel (A) and SDS gel (B), stained with coomassie brilliant blue. Samples were aliquoted at certain time intervals (1, 3, 5, 7, 12, 20 min), immediately flash frozen in liquid nitrogen, and thawed just before loading. Lanes C, C`, S, and S` are controls apo-HSA, methemalbumin, apo-HasAp, and holo-HasAp, respectively ………………………..……………………..
163
Figure 9. Elution profile of serum albumin and HasAp from a Sephadex G-75 column; blue circles track A280nm while red circles track the soret. ……………………………………………………………… 163
Figure 10. UV-Vis spectra of the reaction product (red) and holo-HasAp (black) with similar concentrations. The spectrum of methemalbumin (blue) is shown for reference..………………….. 165
Figure 11. Elution volumes (Ve) from a calibrated Superdex 75 column and
estimated molecular weights for the reaction products obtained
from a reaction mixture of methemalbumin and apo-H32A-
HasAp: holo-H32A-HasAp (21 kDa, green diamond), and serum
albumin ( 63 kDa, red triangle). The Superdex 75 column was
calibrated with ribonuclease A (75 kDa), Carbonic anhydrase (44
kDa), ovalbumin (29 kDa), and conalbumin (13 kDa) shown in
black filled circles...………………...............................................
165

xxiv
LIST OF SCHEMES
CHAPTER 1
Scheme 1. Oxidative heme degradation catalyzed by heme oxygenase…….. 11
CHAPTER 3
Scheme 1. Proposed coordination state of the heme iron in H83A-HasAs at different pH. ………………………………………………..........
105

xxv
LIST OF APPENDICES
CHAPTER 2
Appendix 1. Protein crystallization conditions-Wizard II Random Sparse Matrix ……..………………………………………………..….
84
Appendix 2. Backbone resonance assignments for H32A HasAp and H32A-imidazole ……………………………………………...……….
87
CHAPTER 3
Appendix 1. Protein crystallization conditions-Wizard II Random Sparse Matrix ………………………………………………………….
140
Appendix 2. ESI/MS spectrum of Y75A-HasAp ……………...……………. 143
Appendix 3. ESI/MS spectrum of H83A-HasAp ………………………...…. 144

xxvi
ABBREVIATIONS
DMSO Dimethyl Sulfoxide
EPR Electron Paramagnetic Resonance
Has Heme Acquisition System
HasAp Heme Acquisition System Pseudomonas aeruginosa
HasR Heme Acquisition System Receptor
HasAs Heme Acquisition System Serratia marcescens
Hb Hemoglobin
Hp Haptoglobin
HPX Hemopexin
IPTG Isopropyl--D-thiogalactopyranoside
NMR Nuclear Magnetic Resonance
OD Optical Density
PCR Polymerase Chain Reaction
PDB Protein Data Bank
SDS PAGE Sodium dodecyl Sulfate Polyacrylamide Gel Electrophoresis
TMB Tetramethylbenzidine
TROSY Transverse relaxation optimized spectroscopy
RR Resonance Raman
UV-Vis Ultraviolet-Visible

1
CHAPTER 1
Introduction
Pseudomonas aeruginosa (P. aeruginosa) is an opportunistic infectious microorganism
that is ubiquitous in nature; it inhabits soil, water, plants and animals including humans. It rarely
causes disease in healthy persons but has the potential to severely infect individuals whose local
or systemic immune defense is compromised [1,2]. As a nosocomial pathogen, it is the third most
commonly isolated organism, leading primarily to urinary track or wound infections in
immunocompromised patients [3,4]. According to the Center of Disease Control and Prevention
(CDC), the overall incidence of P. aeruginosa infections in US hospitals averages about 0.4
percent (4 per 1000 discharges), while an estimated 50 % of patients hospitalized with cancer,
cystic fibrosis (CF), and burns succumb to p. aeruginosa infection [5].
It has been established that growth and subsequent pathogenicity in P.aeruginosa depends
on the ability of this bacterium to sequester and utilize iron from the host cell [6]. The most
convincing findings were reported by Singh and coworker [7,8] who demonstrated that the iron
binding protein lactoferrin can block biofilm development (the common mode of growth of P.
aeruginosa in chronically infected patients [9]) at concentrations below those that kill or prevent
growth. It was proposed that by chelating iron, thereby lowering intracellular levels, lactoferrin
stimulates twitching motility, which in turn causes the bacteria to wander across the surface
instead of forming cell clusters and biofilms. This and other findings strongly suggest that
growth and hence pathogenicity in P. aeruginosa can be minimized or prevented by depriving the
pathogen of the most essential nutrient, iron. It is therefore important to understand the
mechanisms by which this bacterium sequesters iron from the host cell because this information

2
is expected to give more insights into rational drug design to combat P. aeruginosa and other
related bacterial infections.
Iron uptake by bacteria
Iron is an essential nutrient that plays significant roles in biological processes. It is
generally required for metabolic processes in organisms that consume oxygen. However, in
aerobic conditions, Fe3+ is extremely insoluble and the concentration of free iron is very low (10-
18 M) at neutral pH [10]. The concentration of iron available to mammalian bacterial pathogens is
even significantly lower (10-24 M), because Fe3+ is sequestered by host iron carrier proteins such
as lactoferrin and transferrin, or by heme. However, since this element is essential for growth and
pathogenesis of bacteria, invading microorganisms have developed intricate iron uptake
pathways to overcome iron restriction and assimilate this nutrient from one or more of the
diverse mammalian iron sources.
One way by which invading microbes acquire iron involves production and secretion of
small molecular weight compounds called siderophores that strongly and specifically chelate
ferric iron, solubilize it from mineral or organic complexes, and deliver it to the microbial cells
via specific cell surface receptors. In Gram-negative bacteria, iron-siderophore complexes are
recognized and bound by specific outer membrane receptors at the cell surface and then
transported through the inner membrane by periplasmic protein-dependent ABC permeases. P.
aruginosa produces two siderophores; pyoverdine and pyochelin [11,12] under the regulation of
Fur (Ferric uptake regulator) [13]. Under iron-replete conditions, the biosynthesis of pyochelin
and the uptake system of the ferric-pyochelin complex are repressed by Fur. Pyoverdine
synthesis is indirectly regulated in response to iron through the Fur-controlled sigma factor PvdS

3
[14]. When Fur is complexed with ferrous iron (under iron-replete conditions), it binds to a
conserved sequence element (Fur-box) in the promoter regions of iron regulated genes and
blocks their transcription [15]. In contrast, when iron is limiting, Fur dissociates from the Fur-
box allowing a basal level of gene expression to occur. Expression of siderophore receptors are
also regulated by Fur. A combination of negative regulation by Fur and transcriptional activation
by the AraC regulator PchR [16] determines the level of pyochelin receptor FptA in the cell. The
regulation of expression of iron uptake, transport and utilization proteins in general is complex
and involves a number of feedback mechanisms for sensing the iron status of the cell and
availability of these proteins in the cell. This tight control is responsible for the virulence factors
of the bacteria.
In addition to siderophore secretion, some bacteria directly bind host iron-binding
proteins [17,18], reduce the insoluble form of iron (Fe3+) to the usable soluble form (Fe2+) [19],
secrete extracellular proteinases that degrade host iron-binding proteins [20,21], or produce
lethal compounds (exotoxins) that may eliminate competitors for usable iron resources [22,23].
Bacteria can also acquire iron from heme. However, like iron, free heme is toxic and
causes oxidative damage to cells by catalyzing formation of reactive oxygen intermediates
generated by Fenton-type reactions. To avoid this deleterious effect free heme appearing in
plasma is rapidly sequestered by the host heme binding proteins hemopexin (Hpx), and human
serum albumin (HSA). Under pathologic conditions HPX, HSA, hemoglobin (Hb) and
hemoglobin binding haptoglobin (Hp) are potential heme-iron sources to invading bacteria. Since
these proteins bind heme with high affinity, under iron-limiting conditions, bacteria employ
sophisticated mechanisms to sequester the heme from these sources and transport it into the
cytoplasm where iron is extracted by heme oxygenanses that break the tetrapyrrole ring [24], or

4
iron is released and the tetrapyrole ring is left intact (de-ferration) [25]. Different heme uptake
mechanisms exist in gram positive and gram negative bacteria. Examples of heme uptake
systems in gram negative bacteria will be discussed.
Heme uptake systems in Gram negative bacteria
Heme-uptake systems in Gram-negative bacteria have been extensively studied and can
be classified into three groups. The first group involves direct binding of heme or host heme-
containing proteins (HSA, Hpx, Hb, or Hp-Hb complex) to specific outer membrane receptors
located on the bacterial surface whereupon the heme is translocated across the membrane to the
cytoplasm. Examples of systems in this category are the the hmuRSTUV system in Yersinia pestis
[26], the hemR-hemSTUV system in Yersinia enterocolitica [27], the shuASTUV system of
Shigella dysenteriae [28,29] and the phuRSTUVW system in Pseudomonas aeruginosa
[30,31,32]. The phu (Pseudomonas heme uptake) system in P. aeruginosa involves a single
outer membrane heme receptor gene (PhuR), a periplasmic heme transport protein (PhuT), inner
membrane proteins (PhuUVW) typical for an ABC transport system, and a cytoplasmic protein
(PhuS) [33] (Figure 1, adapted from ref. 34).
Figure 1. Map of the P. aeruginosa heme uptake locus containing the phuR gene and the
phuSTUVW operon. Three Fur binding elements are shown as white boxes adapted from

5
The second heme-uptake system closely related to the preceding category is the bipartite
Hb / Hp-hb receptor HpuAB in Neisseria meningitidis [35,36]. HpuAB consists of two outer
membrane proteins; a TonB dependent outer membrane receptor HpuB similar to other single
component TonB-dependent receptors and an accessory outer membrane lipoprotein HpuA. Both
proteins are required for Hb, Hp-hb, and apo-haptoglobin binding to whole cells. HpuAB is
analogous to the bipartite transferrin receptors Tbp1 and Tbp2 [37]; Tbp1 is an integral TonB-
dependent outer membrane protein while Tbp2 is a lipoprotein. Whereas both receptors are
necessary for efficient transferrin binding, the latter discriminates between the iron-bound and
iron-free transferrin and binds the former with 100 times higher affinity.
Secretion of small heme-binding proteins called hemophores to the extracellular medium
constitutes the third category of heme-uptake systems. Secreted hemophores bind hemin (free or
hemoprotein-bound) and deliver it to a TonB dependent specific outer membrane receptor on the
cell surface. This category include the hemophore systems hasRADEBF in S. marcescens and P.
aeruginosa [38], and the hxuCBA system found only in H. influenza [39,40]. Figure 2 shows
genetic organization of the has (heme acquisition system) systems [41]. The has operon in
Serratia, which is similar to that of Pseudomonas, is negatively regulated by the Fur repressor in
the presence of iron and the extracytoplasmic function (ECF) sigmas. The latter is dependent on
the receptor HasR and the two genes located upstream of HasR; HasI (extrecytoplasmic sigma
factor) and its modulator HasS. Bivelle and coworkers [42] have shown that HasI and HasS
genes cooperate with Fur-dependent mechanism to tune the has system under iron limiting
condition. Binding of HasA (the hemophore) to HasR (the receptor) activates the sigma gene
HasI but inactivates HasS and in effect the transcription of has signal cascade is enabled.

6
By contrast, at optimal iron concentrations, HasI induces transcription of HasS turning off its
anti-sigma. As a consequence, inactivated HasS accumulates and only turns on when the heme
concentration is low or/ and when hemin loaded HasA is not bound to the receptor. This
feedback mechanism is analogous to that involving iron uptake and transport proteins where the
bacterium senses the concentration of iron in the cell and only turns on the genes necessary for
transcription of relevant enzymes [38,43,44].
Hemophore-dependent heme acquisition systems
In H. influenza, the hemophore HxuA is secreted by a signal-peptide dependent pathway
involving one outer membrane helper protein [45]. Once in the extracellular medium, HxuA
acquires heme from HPX and shuttles it to a cell surface receptor which is thought to be HxuC.
The only other known hemophore in gram negative bacteria, HasA, is found in P. aeruginosa, P.
Figure 2. Genetic organization of the has systems in Pseudomonas aeruginosa (P.a.) and
Serratia marcescens (S.m.). HasI and hasS encode sigma and antisigma factors, respectively.
The white boxes indicate consensus Fur boxes (adapted from ref 41).

7
fluorescens, S. marcescens, Y. pestis, and Y. enterocolitica [46,47,48,49]. HasA belongs to a
novel family of proteins without homology to any other known proteins. They do not have a
signal peptide and are secreted by ABC transporters directly into the extracellular medium where
they bind free heme or extract heme from hemoproteins and deliver it to the specific outer
membrane receptor HasR. Whereas the receptor is important in heme acquisition, the hemophore
is not but the synergy increases the efficiency of free heme or hemoglobin acquisition 100-fold
[50]. This observation portrays the importance of the hemophore in enhancing the capacity of the
system and broadening the spectrum of substrate sources when the bacterium is faced with
limited amounts of iron in the cell. This study focuses on the structural and biochemical
characterization of the mechanism of heme capture by the hemophore HasAp from P.
aeruginosa. Therefore a general overview of the working mechanism of the has system,
structural information of characterized HasA, and heme binding studies are discussed in this
introduction.
Proposed working mechanism of hasA
A simplified schematic of the proposed working mechanism of HasA is shown in Figure
3. Under iron limiting conditions, the hemophore HasA is secreted to the extracellular medium
where it sequesters heme from host heme binding proteins and shuttles it to the specific outer
membrane receptor HasR [51]. Once the heme is delivered to the receptor, apo HasA is released
[52]. The heme is then translocated across the membrane into the cytosol where it is thought to
be uptaken by a cytoplasmic protein (PhuS). PhuS is thought to deliver the heme to heme
oxygenase [30] which is thought to degrade the macrocycle to release iron [53]. The protein
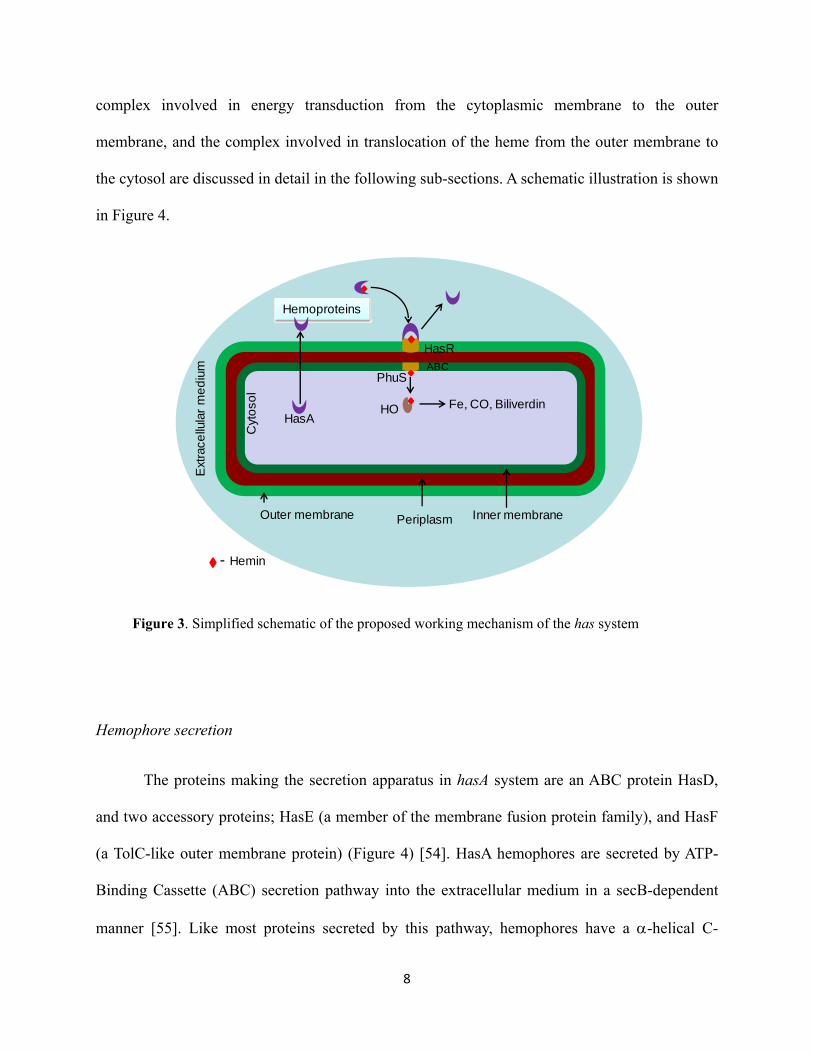
8
complex involved in energy transduction from the cytoplasmic membrane to the outer
membrane, and the complex involved in translocation of the heme from the outer membrane to
the cytosol are discussed in detail in the following sub-sections. A schematic illustration is shown
in Figure 4.
Periplasm Inner membrane
Ext
race
llula
r m
ed
ium
Outer membrane
Hemoproteins
HO
HasR
HasA
ABC
Fe, CO, Biliverdin
Cyt
oso
l
- Hemin
PhuS
Hemophore secretion
The proteins making the secretion apparatus in hasA system are an ABC protein HasD,
and two accessory proteins; HasE (a member of the membrane fusion protein family), and HasF
(a TolC-like outer membrane protein) (Figure 4) [54]. HasA hemophores are secreted by ATP-
Binding Cassette (ABC) secretion pathway into the extracellular medium in a secB-dependent
manner [55]. Like most proteins secreted by this pathway, hemophores have a -helical C-
Figure 3. Simplified schematic of the proposed working mechanism of the has system

9
terminal secretion signal characterized by the presence of a negatively charged amino acid
residue followed by several hydrophobic residues [56]. This secretion signal interacts with the
ABC transport protein, regulates its ATPase activity and induces a multiprotein complex
formation comprising the secreted protein (HasA) and the three secretion proteins (HasD, HasE
and HasF) [52]. The location of the ABC secretion signal (C` terminus) indicates that the protein
is fully synthesized before the signal is recognized. The absence of the secretion apparatus, secB,
presents two main problems to the bacterium; first, HasA accumulates in the cytoplasm, folds,
and binds heme from other cytoplasmic proteins [38]; second, folding renders the protein
incompetent for secretion yet it can still interact with the transporter; as a result secretion of
newly synthesized proteins is inhibited [57]. SecB chaperon is therefore important in keeping the
newly synthesized proteins in a conformation that is competent for secretion [58].
Figure 4. Schematic illustration of the protein complex involved in energy transduction from the
cytoplasmic membrane to the outer membrane in Gram-negative bacteria. OM: outer membrane;
PP: periplasmic space; CM: cytoplasmic membrane. Adapted from ref. 54.

10
Heme binding to HasA and interaction of HasA with the receptor HasR
HasA has a high affinity for heme (Kd = 10-11 M) [59]. When it is secreted to the
extracellular medium, it may extract heme from a large range of substrates including
hemoglobin, hemoglobin-haptoglobin complex, myoglobin or serum albumin. Although heme
sequestration from these hemeproteins has been documented, previous to our study, the
mechanism by which heme binds to HasA was not known. The mechanism of hemin delivery to
the receptor is also not clearly understood. Of interest is the fact that the hemophore has a
markedly higher affinity for heme than the cognate receptor (Kd ~ 10−6 M) [52] and that both
hemin-free and hemin-loaded HasA bind the receptor HasR on two overlapping sites (-strands,
S51-T60 and G95-S107) with the same apparent affinity (Kd 5 nm) [60]. In addition, it has been
suggested that HasA interaction with HasR induce some conformational changes which may
move heme away from the distal ligand and as a result the central iron is reduced or coordinates
one of HasR residue facilitating transfer.
Translocation of hemin across the membrane
Hemin bound to the receptor is translocated from the outer membrane to the periplasm in
a TonB-dependent process and involve formation of a HasB-ExbB-ExbD protein complex. Once
in the periplasm, the heme is bound by a heme-specific periplasmic transport protein (HTP) (e.g
PhuT in P. aeruginosa), which mediates heme transfer to the cytoplasm through ATP-binding
cassette (ABC) transporter. Association of the ABC transporter and HTP forms a complete heme-
uptake permease [61,62].

11
Hemin degradation and iron releasing in the cytosol
Free hemin is toxic to cells and so once it is delivered to the cytoplasm, it is believed to
be sequestered by a PhuS analogue which passes it on to heme oxygenase (HO) via protein-
protein interactions [63]. HO then catalyzes the oxidation degradation of heme to release iron
which can then be utilized by the bacterium. The process of hemin catabolism is summarized in
Scheme 1 below [64,65]. Three oxygen molecules and seven electrons (supplied by NADPH in
the case of P. aeruginosa) are involved. The catabolic process begins with reduction of the
central metal iron (Fe3+) to form a metastable oxyferrous complex (Fe2+-O2). This complex then
accepts a proton (from the distal pocket water) and a second electron to form an intermediate
species (Fe3+-OOH). The terminal oxygen of Fe3+-OOH then attacks the α-meso-carbon of the
porphyrin ring to form ferric α-meso-hydroxyheme which oxidizes to ferric verdoheme in the
presence of oxygen releasing CO. A third oxygen molecule inserts into the macrocyle thereby
breaking the tetrapyrole ring to release iron.
N
NN
NF eII
H3C H3C
CH3
CH3HO2C
HO2C
OO
O2
e-
H+e-
O2
CO
O2
Fe2+ H
N
NN
NF eII I
H3C H3C
C H3
C H3HO2C
O2C
O H
-meso-hydroxyheme
N
O+NN
NF eII
H3C H3C
C H3
C H3HO2C
HO2C
verdoheme
N
NN H
HN
H3C H3C
C H3
C H3HO2C
HO2C
OO
β
δ
γ α
N
NN
NFeII I
H3C H3C
CH3
CH3HO2C
HO2C
heme
N
NN
NFeII I
H3C H3C
CH3
CH3HO2C
HO2C
OOH
β
δ
γ α
β
δ
γα
β
δ
γα
β
δ
γ
α-biliverdin
α
N
NN
NF eII
H3C H3C
CH3
CH3HO2C
HO2C
OO
N
NN
NF eII
H3C H3C
CH3
CH3HO2C
HO2C
OO
O2
e-
H+e-
O2
CO
O2
Fe2+ H
N
NN
NF eII I
H3C H3C
C H3
C H3HO2C
O2C
O H
H
N
NN
NF eII I
H3C H3C
C H3
C H3HO2C
O2C
O H
-meso-hydroxyheme
N
O+NN
NF eII
H3C H3C
C H3
C H3HO2C
HO2C
N
O+NN
NF eII
H3C H3C
C H3
C H3HO2C
HO2C
verdoheme
N
NN H
HN
H3C H3C
C H3
C H3HO2C
HO2C
OON
NN H
HN
H3C H3C
C H3
C H3HO2C
HO2C
OO
β
δ
γ α
N
NN
NFeII I
H3C H3C
CH3
CH3HO2C
HO2C
heme
N
NN
NFeII I
H3C H3C
CH3
CH3HO2C
HO2C
heme
N
NN
NFeII I
H3C H3C
CH3
CH3HO2C
HO2C
OOH
N
NN
NFeII I
H3C H3C
CH3
CH3HO2C
HO2C
OOH
β
δ
γ α
β
δ
γα
β
δ
γα
β
δ
γ
α-biliverdin
α
Scheme 1. Oxidative heme degradation catalyzed by heme oxygenase

12
Structure of the model hemophore HasAs
HasAs from S. marcescens was the first hemophore to be identified, and it is the most
characterized of all the hemophores studied so far. It is a 19 kDa monomeric protein that binds b-
type heme in a 1:1 stoichiometry and with a high affinity (Kd ~ 10−11 M) [67]. The crystal
structure determined at 1.9 Å resolution [58] (Figure 5-A) shows an original α/β fold in which
seven β-strands form an antiparallel β-sheet wall on one face of the protein, while four α-helices
form an -helix wall on the opposite face. Hemin is coordinated by a unique pair of ligands His
32 and Tyr 75 located in two flexible loops (His 32 and Tyr 75 loop, respectively) at the interface
between the α-helix and β-sheet walls. Adjacent to Tyr 75 is another His residue (His 83), which
is within hydrogen bonding distance (2.8 Å) with Oη of Tyr 75 (Figure 6-B). This hydrogen
bonding interaction is thought to modulate the Tyr-Fe bond. Sequence alignment of identified
hemophores reveal that the proximal pair, Tyr 75 and His 83 is conserved but the His 32 is not
(Figure 7) [66]. The crystal structure also reveals that a large portion of the prosthetic group is
exposed to the solvent (186 Å) (Figure 6-A). Nonetheless, the macrocycle is tightly anchored by
coordination of the axial ligands, and favorable stacking and hydrophobic interactions with
residues within the binding site.
The high affinity for hemin, and the flexible secondary structure elements constituting
hemin binding site likely makes the hemophore efficient for hemin sequestration from host heme
proteins, and for release of hemin to the receptor HasR. Similar structural elements are observed
in the crystal structure of HasAp (Figure 5-B) except that HasAp has an extra -sheet (8) at the
C` terminal.

13
Figure 5. Comparison of the crystal structure of Holo-HasASM (PDB ID. 1DKO) (A), and the
crystal structure of HasAp (PDB ID. 3ELL) (B) showing the elements of secondary structure.
The -helices are shown in cyan, -sheet in magenta, loops in green, heme in red and ligands in
blue. His83 is colored orange.
A
B

14
Solution NMR structure of apo-HasAs has been solved. Overall, the protein has a similar
polypeptide fold with the holo counterpart except for the loop harboring the distal ligand His 32
which is relocated nearly 30 Å away (“open” conformation) relative to its position in the holo
protein (“closed” conformation) [67]. In this work, we solved the crystal structure of apo-HasAp
and investigated the overall structural changes accompanying hemin loading. Capitalizing from
the availability of the apo and holo HasAp crystal structures, we determined a plausible path
taken by the His 32 loop as it transitions from the “open” to the “closed” conformation using
molecular dynamics simulations. The results are discussed in detail in chapter II.
A B
Tyr 75
His 32
His 83
Figure 6. Zoomed in view of the heme binding site in the crystal structure of HasAs.( A)
solvent exposed prosthetic group; heme is shown in red while the water molecules are
represented by blue spheres. (B) Hemin coordination ligands His 32 and Tyr 75 (blue) and
the adjacent His 83 (orange).

15
10 20 30 40 50 60 | | | | | | Pa MSISISYSTTYSGWTVADYLADWSAYFGDVNHRPGQVV-DGSNTGGFNPGP--FDGSQYALKS-TASDAAFIA Sm MAFSVNYDSSFGGYSIHDYLGQWASTFGDVNHTNGN-V-TDANSGGFYGGS--LSGSQYAISSTANQVTAFVA Pe MTISVNYDAAFASSTIDDYLAFWSAGFVTAGHG-------YSNTGGFSNGT--YDGDQYATHGRNSSDYAFIA Pf MSISISYSATYGGNTVAQYLTDWSAYFGDVNHRPGEVV-DGTNTGGFNPGP--FDGTQYAIKS-TASDAAFVA Yps MSTTIQYNSNYADYSISSYLREWANNFGDIDQAPAETK----DRGSFSGSSTLFSGTQYAIGSSHGNPEGMIA Pc MSFAITYDAYYANYSIASYLTEWSAAFGDVNHTAGNTQVGGNNTGGFYGGDTFIDGTQYAITSTQNDFSALIA Ec MSFAITYDAYYANYSIANYLTEWSAAFGDVNHTTGNTQVGGNNTGGFYGGDTFIDGSQYAITSTQNDFSALIA Yp MSTTIQYNSNYADYSISSYLREWANNFGDIDQAPAETK----DRGSFSGSSTLFSGTQYAIGSSHSNPEGMIA Ypa MSTTIQYNSNYADYSISSYLREWANNFGDIDQAPAETK----DRGSFSGSSTLFSGTQYAIGSSHSNPEGMIA 70 80 90 100 110 120 | | | | | | Pa GGD----LHYTLFS------NPSHTLWGKLDSIALGDTLT---GGASSGG-YALDSQEVSFSNLGLDSPIAQ- Sm GGN----LTYTLFN------EPAHTLYGQLDSLSFGDGLS---GGDTSP--YSIQVPDVSFGGLNLSSLQAQ- Pe DSNNANGLHYVFDPSKAPGDNLNHYLWGSLDNVSLGEVLG---GGSGSD--FTLGNYVVNFNGLDLDAAHGA- Pf DGN----LHYTLFS------NPSHTLWGSVDTISLGDTLA---GGSGSN--YNLVSQEVSFTNLGLNSLKEE- Yps EGN----LKYSFM--------PQHTFYGQIDTLQFGKDLATNAGGPSAG--KHLEKIDITFNELDLSGEFDSG Pc GGD----LTYSLFT------PPAHTLYGDLDSLSFGNVLQ---GGTTAGTTYSLAEPEVTFSGLDLSTDVAN- Ec GGD----LTYSLFS------PPAHTLYGDLDSLSFGNVLQ---GGTTAGTTYSLVEPEVTFSGLDLSTDVAN- Yp EGD----LKYSFM--------PQHTFHGQIDTLQFGKDLATNAGGPSAG--KHLEKIDITFNELDLSGEFDSG Ypa EGD----LKYSFM--------PQHTFHGQIDTLQFGKDLATNAGGPSAG--KHLEKIDITFNELDLSGEFDSG 130 140 150 160 170 180 190 | | | | | | | Pa ---GR-DG-TVHKVVYGLMSGDSSALQGQIDALLKAVDPSLSINSTFDQLAAAGVAHATP-AAAAAEVGVVGV Sm ---GH-DG-VVHQVVYGLMSGDTGALETALNGILDDYG--LSVNSTFDQVAAA----T-----------AVGV Pe ---GR-AGNEVQTVIYGLMQGNTAGLEGVLDTLLASYG--VSTNDTFDVVAAA----LGG-ASGAASAQAVGV Pf ---GR-AG-EVHKVVYGLMSGDSSALAGEIDALLKAIDPSLSVNSTFDDLAAAGVAHVNPAAAAAADVGLVGV Yps KSMTENHQGDMHKAILGLRKGNA----DPMLEVMKAKG--FDVDTAFKDLSIASQYPDSGYMSDAPMVDTVGV Pc --LTVSDRGVVHDVIYGLMSGQV----QPLLDALTNAG--IDINASLDSLSFATATSDAALSADT-VVDVVGV Ec --LTVSDRGVVHDVIYGLMGGQV----QPLLDALTNAG--IDINASLDSLSFATATSDAALSADT-VVDVVGV Yp KSMTENHQGDMHKSVRGLMKGNP----DPMLEVMKAKG--INVDTAFKDLSIASQYPDSGYMSDAPMVDTVGV Ypa KSMTENHQGDMHKSVRGLMKGNP----DPMLEVMKAKG--INVDTAFKDLSIASQYPDSGYMSDAPMVDTVGV 200 205 | | Pa QELPHDLALAA Sm QHADSPELLAA Pe QALPEDLALAA Pf QDVAQDWALAA Yps MDSN-DMLLAA Pc AETA-DLLAA- Ec AETA-DLLAA- Yp VDCH-DMLLAA Ypa VDCH-DMLLAA
Figure 7. Amino acid sequence alignment of full-length HasA sequences from P. aeruginosa
(Pa), Serratia marcescens (Sm), P. entomophila (Pe), P. fluorescens (Pf), Yersinia
pseudotuberculosis (Yps), Pectobacterium carotovorum (Pc), Erwinia carotovora (Ec), Yersinia
pestis (Yp), and Yersinia pestis bv. Antiqua (Ypa) aligned against the sequence of HasA from P.
aeruginosa. Truncated HasAp used in these investigations stops at residue 184 (full-length minus
21 amino acids) [13]. Residues highlighted in red are conserved while those in blue are the His32
loop “hinge” residues in HasAp. The alignment was performed using ClustalW [68].

16
Mechanism of heme uptake in HasA
Prior to our study, the mechanism of hemin loading onto HasA was unknown. However,
Wolff and coworkers [67] proposed a two-step mechanism where hemin is initially loaded onto
the loop harboring the proximal hemin-iron ligand Tyr 75 followed by closure of the His 32 loop.
Two recent independent studies strengthened this proposal. First, Lukat-Rodgers et al [69]
observed that when wild type holo-HasAs is reduced with dithionite in the presence of CO, a
ferrous hexacoordinate complex in which His 32 is displaced by CO at the distal site is formed.
Second, the crystal structure of HasAs in complex with its receptor (HasR), recently reported by
Krieg et al [70], shows that hemin in the hemophore is coordinated only by Tyr 75 at the
proximal site while the His 32 loop is turned away from its heme-binding conformation.
Together, these studies suggest that His 32 is more labile and that the loop harboring it is more
flexible relative to the Tyr 75 loop. In this study extensive investigations were carried out to
elucidate the mechanism of hemin loading onto HasAp using wild type apo HasAp and H32A-
HasAp mutant. The results of this investigation are presented in chapter II.
Heme binding studies
Hemin binding studies in HasA have been extensively carried out with the hemophore
HasAs using free heme in solution as the heme source [71]. Biochemical characterization of
heme loaded proteins revealed that one ligand is efficient and sufficient to coordinate heme in the
heme-HasAs complex. It was thus proposed that His 83 (adjacent to the proximal heme-iron
ligand Tyr 75 in wild type HasA) can act as an alternate ligand in the absence of Tyr 75.
However, there is no reliable structural information to support this proposal. In this study,

17
corresponding HasAp mutants in which the proximal residues were replaced by a
noncoordinative residue Ala (Y75A and H83A) were prepared and characterized by X-ray
crystallography. The overall architecture of the mutants and the coordination state or hemin-iron
are discussed in Chapter III.
Studies in hemophore acquisition of heme from hemoproteins have focused primarily on
hemoglobin as the heme source. Kinetic analysis of heme transfer from hemoglobin to HasAs or
HasAp revealed that the rate of heme transfer is relatively slow [72]. It was concluded that heme
transfer is by passive diffusion and affinity driven. We hypothesize that methemalbumin (heme
loaded serum albumin) is the potential target for the secreted hemophore HasAp from P.
aeruginosa. This argument is based on two lines of thought; i, the association between serum
albumin and heme is relatively weak (Kd = 10 -8 M) [73], and ii, under hemolytic conditions as
is the case during Pseudomonas infection, the heme carrier protein HPX is saturated leaving
enormous amounts of heme bound to serum albumin . We carried out heme transfer studies using
apo HasAp and methemalbumin to test this possibility. The results are described in detail in
chapter IV.
RESEARCH PROBLEM AND RATIONALE
Iron is an essential element for virtually all living organisms. Its ligand binding
capability, reactivity and redox properties make it attractive for diverse biological processes.
However, the same properties that make iron attractive in biological applications pose enormous
problems. First, the easy one electron inter-conversion of Fe2+and Fe 3+ makes iron very toxic by
catalyzing the generation of damaging oxygen-derived radicals through Fenton-type reactions.

18
Second, under aerobic conditions Fe3+ is thermodynamically favored, leading to problems of
solubilization. For these reasons, living organisms have evolved molecular systems to limit iron
availability; by sensing adequate iron levels, limiting uptake, and storing excess iron in storage
proteins. Iron, in the form of heme is similarly very toxic to cells, thus once heme appears in
plasma it is rapidly sequestered by heme binding proteins (hemopexin and serum albumin) and
subsequently cleared from circulation via receptor-mediated endocytosis.
Invading pathogenic bacteria including P. aeruginosa require iron for growth and for the
successful colonization of the host cells. However, as alluded to earlier, the human host presents
a hostile, iron restrictive environment to bacterial invaders. To overcome this iron limitation, P.
aeruginosa has developed sophisticated iron and heme-iron acquisition mechanisms to
circumvent host sequestration of iron sources. It follows therefore that molecules or/and
compounds that are capable of inhibiting or interrupting iron acquisition paths may constitute a
new class of antibiotics to fight Pseudomonas infections. Prospects for rational drug design of
these antibiotics, structure-based or otherwise, require molecular level understanding of the
intricate pathways employed by this bacterium to sequester iron from the host cell.
Under iron limiting conditions, P.aeruginosa secretes the hemophore HasAp to the
extracellular medium where it sequesters heme and shuttles it to the cognate outer membrane
receptor HasR. However, the mechanism of heme binding to the hemophore HasAp and the
target host heme binding protein are not known. This investigation focused on elucidating the
mechanism of heme loading as well as determining the potential host heme iron source targeted
by HasAp.

19
To achieve this objective, a chromatographic method was developed to isolate apo-
HasAp from the holo fraction and to purify it to homogeneity. Pure apo-HasAp was then
characterized by X-ray crystallography and solution NMR spectroscopy. To be able to elucidate
the mechanism of heme binding to the hemophore, HasAp variant in which the distal ligand His
32 was replaced with the non-coordinative residue Ala (H32A) was purified in the apo form.
Kinetic studies of heme binding were carried using a stopped flow spectrometer. A parallel
experiment was done using the wild type protein for comparison. Heme loaded H32A-HasAp
was further characterized by X-ray crystallography, and by EPR and Resonance Raman
Spectroscopy to elucidate the coordination state and spin state of heme-iron. H32A-HasAp
mutant in complex with imidazole (H32A-Imidazole) was characterized by X-ray
crystallography and solution NMR to establish the topological position of His 32 loop in the
heme loaded protein. The results and discussion are presented in chapter II. Capitalizing on the
availability of the structures of holo and apo HasAp, molecular dynamic simulations were carried
out to obtain information pertaining to His 32 loop closing as it transitions from the “open” to the
“closed” state. The results of these studies are also presented in detail in chapter II.
The crystal structures of HasAp mutants involving the proximal heme residues Tyr 75
and His 83 (Y75A and H83A) are presented in chapter III. The overall protein fold, hemin
coordination states and spin states are compared to wild type HasAp.
Chapter IV describes preliminary studies aimed at understanding heme acquisition from
the host heme-binding protein serum albumin. Experiments were carried out using UV-vis
spectroscopy, gel filtration, and polyacrylamide gel electrophoresis.
20
References
1. Woods, D. E., and Vasil, M. L., Pathogenesis of Pseudomonas aeruginosa infections. In
Pseudomonas aeruginosa Infections and Treatment, 1994. Marcel Dekerr Inc. New York. 2. Ferguson, D., Cahill, O. J., and Quilty, B., Phenotypic, molecular and antibiotic
resistance profiling of nosocomial Pseudomonas aeruginosa strains isolated from two Irish Hospitals. J Med, 2007. 1: np. http://www.scientificjournals.org/journals2007/articles/1055
3. Goldsworthy, M. J. H., Gene expression of Pseudomonas aeruginosa and MRSA within a
catheter associated urinary track biofilm model. Biosci Horz, 2008. 1: p. 28-37. 4. Goldberg, J. B., Hancock, R. E., Parales, R. E., Loper, J. and Cornalis, P., Pseudomonas
2007. J Bacteriol. , 2008. 190: p. 2649-2662. 5. http://www.polyphor.com/infections-caused-by-pseudomonas-aeruginosa.html 6. Weinberg, E. D., Iron and infection. Microbiol. Rev., 1978. 42: p. 45-66. 7. Singh, P. K., Iron sequestration by human lactoferrin stimulates P. aeruginosa surface
motility and blocks biofilm formation. Biometals, 2004. 17: p. 267-70. 8. Singh. P. K., Parsek, M. R., Greenberg, E. P., and Welsh, M. J., A component of innate
immunity prevents bacterial biofilm development. Nature, 2002. 417: p. 552-555. 9. Bjarnsholt, T., and Givsko, M., Costerton, J, W., The role of quorum sensing in the
pathogenisity of the cunning aggressor Pseudomonas aeruginosa. Anal Bioanal Chem, 2007. 387: p. 409-414.
10. Braun, V., and Killman, H., Bacterial solutions to the iron-supply problem. Trends
Biochem Sci, 1999. 24: p. 104-109. 11. Bodilis, J., and Cornelis, P., A survey of TonB-dependent receptors in fluorescent
pseudomonads. Environ Microbiol Rep, 2009. 1: p. 256-262. 12. Cornelis, P., Iron uptake and metabolism in pseudomonads. Appl Microbiol Biotechnol,
2010. 86: p. 1637-1645. 13. Ochsner, U. A., Vasil, A. I., and Vasil, M. L., Role of the Ferric Uptake Regulator of
Pseudomonas aeruginosa in th Regulation of Siderophores and Exotoxin A Expression: Purification and Activity on Iron-Regulated Promoters. J. Bactriol., 1995. 177: p. 7194-7201.

21
14. Vasil., M. L., and Ochsner, U. A., The response of Pseudomonas aeruginosa to iron:
genetics, biochemistry and virulence. Molecular Microbiology, 1999. 34: p. 399-413. 15. Escolar, L., Perez-Martin, J., and de Lorenzo, V., Opening the iron box: transcriptional
metalloregulation by the Fur protein. J Bactriol, 1999. 181: p. 6223-6229. 16. Michel, L., Gonzalez, N., Jagdeep, S., Nguyen-Ngoc, T. , and Reimmann, C., PchR-box
recognition by the AraC-type regulator PchR of pseudomonas aeruginosa reguires the siderophore pyochelin as an effector . Mol Microbiol, 2005. 58: p. 495-509.
17. Cornelissen, C., and Sparling, P., Iron piracy: acquisition of transferrin-bound iron by
bacterial pathogens. Mol Microbiol, 1994. 14: p. 843-850. 18. Mietzner, T. A., and Morse, S. A., The role of iron-binding proteins in the survival of
pathogenic bacteria. Annu. Rev. Nutr., 1994. 14: p. 471-493. 19. Coulanges, V., Andre, P., Ziegler, O., Bucheit, L., and Vidon, D., Utilization of iron-
catecholamine complexes involving ferric reductase activity in Listeria monocytogenes. Infect Immun, 1997. 65: p. 2778-2785.
20. Wolz, C., Hohloch, K., Ocaktan, A., Poole, K., Rochel, N., Albrecht-Gary, A., et al. Iron
release from transferrin by pyoverding and elastase from Pseudomonas aeruginosa. Infect Immun, 1994a. 62: p. 4021-4027.
21. Wilderman, P. J., et al, Charactrization of an endoprotease (PrpL) encoded by PvdS-
regulated gene in Pseudomonas aeruginosa. Infect Immun, 2001. 69: p. 5385-5394. 22. Bjorn, M., Iglewski, B.H., Sadoff, J., and Vasil, M.L., Effect of iron on yields of exotoxin
A in cultures of Pseudomonas aeruginosa PA103. Infect Immun, 1978. 19: p. 785-791. 23. Calderwood, S.B., and Mekalanos, J.J., Iron regulation of Shiga-like toxin expression in
Escherichia coli is mediated by the fur locus. J Bacteriol, 1987. 169: p. 4759-4764. 24. Yoshida, T., Noguchi, M., Kikuchi, G., and Sano, S., Degradation of mesoheme and
hydroxymesoheme catalyzed by the heme oxygenase system: involvement of hydroxyheme in the sequence of heme catabolism. J Biochem., 1981. 90: p.125 -131.
25. Cornelis, P., Iron uptake and metabolism in pseudomonads. Appl Microbio Biotechnol,
2020. 86: p 1637-1645. 26. Hornung, J. M., Jones, H. A., Perry, R. D., The hmu locus of Yersinia pestis is essential
for utilization of free haemin and haem--protein complexes as iron sources. Mol Microbiol., 1996. 20: p. 725-39.

22
27. Stojiljkovic I, and Hantke K., Hemin uptake system of Yersinia enterocolitica:
similarities with other TonB-dependent systems in gram-negative bacteria. EMBO J., 1992. 11: p. 4359 - 4367.
28. Eakanunkul, S., Lukat-Rodgers, G. S., Sumithran, S., Ghosh, A., Rodgers, K. R., Dawson
J. H., and Wilks, A., Characterization of the periplasmic heme-binding protein shut from the heme uptake system of Shigella dysenteriae. Biochemistry, 2005. 44: p.13179-13191.
29. Burkhard, K. A., Wilks, A., Characterization of the outer membrane receptor ShuA from
the heme uptake system of Shigella dysenteriae. Substrate specificity and identification of the heme protein ligands. J Biol Chem., 2007. 282: p. 15126-36.
30. Lansky, I. B., Lukat-Rodgers, G. S., Block, D., Rodgers, K. R., Ratliff, M., and Wilks,
A., The cytoplasmic heme-binding protein (PhuS) from the heme uptake system of Pseudomonas aeruginosa is an intracellular heme-trafficking protein to the delta-regioselective heme oxygenase. J Biol Chem., 2006. 281: p. 13652-13662.
31. Ho, W. W., Li, H., Eakanunkul, S., Tong, Y., Wilks, A., Guo, M.,and Poulos, T.L., Holo-
and apo-bound structures of bacterial periplasmic heme-binding proteins. J Biol Chem., 2007. 282: p. 35796-802.
32. Ochsner, U. A., Johnson, Z., and Vasil, M.L., Genetics and regulation of two distinct
haem-uptake systems, phu and has, in Pseudomonas aeruginosa. Microbiology, 2000. 146 : p. 185-198.
33. Tong, Y., Guo, M., Bacterial heme-transport proteins and their heme-coordination
modes. J Biol Inorg Chem, 2007.12: p. 735-750. 34. Tong, Y., and Guo, M., Cloning and characterization of a novel periplasmic heme-
transport protein from the human pathogen Pseudomonas aeruginosa. J Biol Inorg Chem., 2007. 12: p. 735-750.
35. Lewis, L. A., Gray, E., Wang, Y. P., Ro, B. A., and Dyer, D. W., Molecular
characterization of hpuAB, the haemoglobin-haptoglobin-utilization operon of Neisseria meningitidis. Mol Microbiol., 1997. 23: p. 737-749.
36. Lewis, L. A., and Dyer, D. W., Identification of an iron-regulated outer membrane
protein of Neisseria meningitidis involved in the utilization of hemoglobin complexed to haptoglobin. J Bacteriol., 1995. 177: p.1299-1306.
37. Cornelissen, C., and Sparling, P., Iron piracy: acquisition of transferrin-bound iron by
bacterial pathogens. Mol Microbiol, 1994. 14: p. 843-850. 38. Cescau, S., Cwerman, H., Létoffé, S., Delepelaire, P., Wandersman, C., and Biville, F.,
Heme acquisition by hemophores . Biometals, 2007. 20: p. 603-613.

23
39. Hanson, M. S., Pelzel, S. E., Latimer, J., Muller-Eberhard, U., and Hansen, E. J.,
Identification of a genetic locus of Haemophilus influenzae type b necessary for the binding and utilization of heme bound to human hemopexin . Proc Natl Acad Sci USA, 1992. 89: p. 1973-1977.
40. Cope, L. D., Thomas, S. E., Hrkal, Z., and Hansen, E. J., Binding of heme-hemopexin
complexes by soluble HxuA protein allows utilization of this complexed heme by Haemophilus influenzae. Infect Immun., 1998. 66: p. 4511-4516.
41. Poole, K., and McKay, G. A., Iron Acquisition and Its Control in Pseudomonas
aeruginosa: Many Roads Lead To Rome. Front. Biosci., 2003. 8: p. 661-686. 42. Bivelle, F., Cwerman, H., Létoffé, S., Rossi, M.-S., Drouet, V., Ghigo, J. M., and
Wandersman, C., Haemophore-Mediated Signalling in Serratia marcescens: A New Mode of Regulation for an Extra Cytoplasmic Function (ECF) Sigma Factor Involved in Haem Acquisition. Mol. Microbiol., 2004. 53: p. 1267-1277.
43. Rossi, M.-S., Paquelin, A., Ghigo, J. -M., and Wandersman, C., Haemophore-Mediated
Signal Transduction Across the Bacterial Cell Envelope in Serratia marcescens: The Inducer and the Transported Substrate are Different Molecules. Mol. Microbiol., 2003. 48: p. 1467-1480.
44. Cwerman, H., Wandersman, C., and Biville, F., Heme and a Five-Amino-Acid
Hemophore Region Form the Bipartite Stimulus Triggering the has Signalling Cascade. J. Bacteriol., 2006. 188: p. 3357-3364.
45. Hanson, M.S., Pelzel, S. E., Latimer, J., Muller-Eberhard, U., and Hansen, E. J.,
Identification of a genetic locus of Haemophilus influenzae type b necessary for the binding and utilization of heme bound to human hemopexin. Proc. Natl. Acad. Sci. USA., 1992. 89: p. 1973-1977.
46. Létoffé S, Omori K, Wandersman C. Functional characterization of the HasAPF
hemophore and its truncated and chimeric variants: determination of a region involved in binding to the hemophore receptor J Bacteriol , 2000. 182: p. 4401-4405.
47. Létoffé S, Ghigo JM, Wandersman C., Secretion of the Serratia marcescens HasA
protein by an ABC transporter. J Bacteriol, 1994.176: p. 5372-5377. 48. Rossi, M. S., Fetherston, J. D., Letoffe, S., Carniel, E., Perry, R. D., and Ghigo, J. M.,
Identification and Characterization of the Hemophore-Dependent Heme Acquisition System of Yersinia pestis. Infect Immun, 2001. 69: p. 6707-6717.

24
49. Stojiljkovic I, Hantke K., Transport of haemin across the cytoplasmic membrane
through a haemin-specific periplasmic binding-protein-dependent transport system in Yersinia enterocolitica. Mol Microbiol. 1994.13: p. 719-732.
50. Ghigo, J., Le´Toffe´, S., and Wandersman, C., A New Type of Hemophore-Dependent
Heme Acquisition System of Serratia marcescens Reconstituted in Escherichia coli. J of Bacteriol, 1997. 179: p. 3572-3579.
51. Létoffé, S., Nato, F., Goldberg, M. E., and Wandersman, C., Interactions of HasA, a Bacterial Haemophore with Haemoglobin and with Its Outer Membrane Receptor HasR. Mol. Microbiol., 1999. 33: p. 546-555.
52. Le´toffe´, S., Delepelaire, P., and Wandersman, C., Free and Hemophore-Bound Heme Acquisitions through the Outer Membrane Receptor HasR Have Different Requirements for the TonB-ExbB-ExbD Complex. J of Bacteriol, 2004. 186: p. 4067- 4074.
53. Ratliff, M., Zhu, W., Deshmukh, R., Wilks, A., and Stojiljkovic, I., Homologues of Neisserial Heme Oxygenase in Gram-Negative Bacteria: Degradation of Heme by the Product of the pigA Gene or Pseudomonas aeruginosa. J. Bacteriol., 2001. 183: p. 6394-6403.
54. Poole, K., and McKay, G. A., Iron Acquisition and Its Control in Pseudomonas aeruginosa: Many Roads Lead To Rome. Front. Biosci., 2003. 8: p. 661-686.
55. Sapriel, G., Wandersman, C., and Delepelaire, P., The N Terminus of the HasA Protein
and the SecB Chaperone Cooperate in the Efficient Targeting and Secretion of HasA via the ATP-binding Cassette Transporter. J of Biol Chem., 2002. 277: p. 6726-6732.
56. Ghigo, J. M, and Wandersman, C., A carboxyl-terminal four-amino acid motif is required for secretion of the metalloprotease PrtG through the Erwinia chrysanthemi protease secretion pathway. J Biol Chem, 1994. 269: p. 8979 - 8985.
57. Debarbieux, L., and Wandersman, C., Folded HasA inhibits its own secretion through its ABC exporter. EMBO J., 2001. 20: p. 4657-4663.
58. Wolff, N., Sapriel, G., Bodenreider, C., Chaffotte, A., and Delepelaire, P., Antifolding Activity of the SecB Chaperone is Essential for Secretion of HasA, a Quickly Folding ABC Pathway Substrate. J. Biol. Chem., 2003. 278: p. 38247-38253.
59. Izadi-Pruneyre. N., Huché, F., Lukat-Rodgers, G. S., Lecroisey, A., Gilli, R., Rodgers, K. R., Wandersman, C., and Delepelaire, P., The heme transfer from the soluble HasA hemophore to its membrane-bound receptor HasR is driven by protein-protein interaction from a high to a lower affinity binding site. J Biol Chem., 2006 281: p. 25541-25550.

25
60. Létoffé, S., Debarbieux, L., Izadi, N., Delepelaire, P., and Wandersman, C., Ligand
Delivery by Haem Carrier Proteins: The Binding of Serratia marcescens Haemophore to Its Outer Membrane Receptor is Mediated by Two Distinct Peptide Regions. Mol. Microbiol., 2003. 50: p. 77-88.
61. Rossi, M.-S., Paquelin, A., Ghigo, J. -M., and Wandersman, C., Haemophore-Mediated
Signal Transduction Across the Bacterial Cell Envelope in Serratia marcescens: The Inducer and the Transported Substrate are Different Molecules. Mol. Microbiol., 2003. 48: p. 1467-1480.
62. Ghigo, J.-M., Létoffé, S., and Wandersman, C., A New Type of Hemophore-Dependent Heme Acquisition System of Serratia marcescens Reconstituted in Escherichia coli. J. Bacteriol., 1997. 179: p. 3572-3579.
63. Block, D. R., Lukat-Rodgers, G. S., Rodgers, K. R., Wilks, A., Bhakta, M. N., Lansky, I.
B., Identification of Two Heme-binding Sites in the Cytoplasmic Heme-trafficking Protein PhuS from Pseudomonas aeruginosa and Their Relevance to Function Biochemistry, 2007. 46: p. 14391-14402.
64. Wilks, A., and Burkhard, K. A., Natural product reports, 2007. 24: p. 511-522. 65. Rivera, M. and Zeng, M., Heme oxygenase, steering dioxygen activation toward heme
hydroxylation. J Inorg Biochem. 2005. 99: p. 337-354.
66. Jepkorir, G., Rodríguez, J.C., Rui, H., Im, W., Lovell, S., Battaile, K.P., Alontaga, A.Y., Yukl, E.T., Moënne-Loccoz P., and Rivera, M., Structural, NMR Spectroscopic, and Computational Investigation of Hemin Loading in the Hemophore HasAp from Pseudomonas aeruginosa. J., Am Chem Soc., 2010. 132: p. 9857-9872.
67. Wolff, N., Izadi-Pruneyre, N., Couprie, J., Habeck, M., Linge, J., Riepeng, W.,
Wandersman, C., Nilges, M., Delepierre, M., and Lecroisey, A., Comparative Analysis of Structural and Dynamic Properties of the Loaded and Unloaded Hemophore HasA: Functional Implications. J. Mol. Biol., 2008. 376: p. 517-525.
68. Larkin, M. A., Blackshields, G., Brown, N. P., Chenna, R., McGettigan, P. R.,
McWilliam, H., Valentin, F., Wallace, I. M., Wilm, A., Lopez, R., Thompson, J. D., Gibson, T. J., and Higgins, D. G., Clustal W and Clustal X version 20. Bioinformatics, 2007. 23: p. 2947-2948.
69. Lukat-Rodgers, G. S., Rodgers, K. R., Caillet-Saguy, C., Izadi-Pruneyre, N., Lecroisey, A., Novel heme ligand displacement by CO in the soluble hemophore HasA and its proximal ligand mutants: implications for heme uptake and release. Biochemistry, 2008. 47: p. 2087-2098.

26
70. Krieg, S., Huche´, F., Diederichs, K., Izadi-Pruneyre, N., Lecroisey, A., Wandersman, C.,
Delepelaire, P., and Welte, W., Heme uptake across the outer membrane as revealed by crystal structures of the receptor-hemophore complex. Proc. Natl. Acad. Sci. U.S.A., 2009. 106: p. 1045-1050.
71. Deniau, C., Gilli. R., Izadi, N., Létoffé, S., Delepierre, M., Wandersman, C., Briand, C., Lecroisey, A., Thermodynamics of heme binding to the HasA(SM) hemophore: effect of mutations at three key residues for heme uptake. Biochemistry, 2003. 42: p. 10627-10633.
72. Alontaga, A. Y., Rodrı´guez, J. C., Scho¨nbrunn, E., Becker, A., Funke, T., Yukl, E. T.,
Hayashi, T., Stobaugh, J., Moe¨nne-Loccoz, P., and Rivera, M., Structural characterization of the hemophore HasAp from Pseudomonas aeruginosa: NMR spectroscopy reveals protein-protein interactions between Holo-HasAp and hemoglobin. Biochemistry, 2009. 48: p 96-109.
73. Adams, P. A., and Berman, M. C., Kinetics and mechanism of the interaction between human serum albumin and monomeric haemin. Biochem. J., 1980. 191: p 95-102.

27
CHAPTER II
Structural, NMR Spectroscopic and Computational Investigation of Heme
Loading in the Hemophore HasAp from Pseudomonas aeruginosa
Introduction
The opportunistic pathogen Pseudomonas aeruginosa (P. aeruginosa) prefers aerobic
metabolism which necessitates respiratory enzymes that need significant amounts of iron for
their function [1]. Typically, bacterial organisms (such as E.coli) require approximately 0.3-1.8
M of iron for optimal growth; however in a mammalian host iron is tightly sequestered by
dedicated iron binding and iron storage proteins such that the concentration of free iron is very
low (10-9 mM) [2]. Furthermore, under aerobic conditions at neutral pH, Fe3+ is extremely
insoluble (10-18 M) [3]. To thrive in mammalian host cells therefore, pathogenic bacteria have
evolved remarkable sophisticated mechanisms to circumvent host-mediated sequestration. One
of the systems developed by some Gram-negative pathogens (such as P.aeruginosa) involve
secretion of hemin binding proteins (hemophores) called HasA. The has (hemin acquisition
system) operon encodes for hasRADEBF genes where HasR is the hemophore-specific outer
membrane receptor, HasA is the hemophore, HasD an inner membrane ABC protein, HasE a
membrane fusion protein, HasB a TonB homologue and HasF an outer membrane protein [4].
HasA is secreted to the extracellular media where it binds heme (free or hemoprotein-bound) and
delivers it to the outer membrane hemophore-specific receptor HasR [5]. The gene coding for the
hemophore of P. aeruginosa, HasAp, is upregulated under iron limiting conditions and is

28
essential for growth of P. aeruginosa with hemoglobin as the only source of iron [6]. These
observations point to an important role of HasAp in the capture and subsequent utilization of
heme iron. The hemophore from Serratia marcescens (HasAs) [7] which shares function and
sequence similarities with HasAp binds heme with a high affinity (~ 5.3 × 10¹⁰ M-1) [8] and
shuttles it the outer membrane receptor HasR [9]. The high affinity of HasAs for heme has been
attributed to the presence of the proximal ligand Tyr 75 and its hydrogen bond partner His 83,
acting in concert to the hemin-HasAs complex [10].
In the holo form both HasAs [11,12] and HasAp [13] have similar structures composed of
an “-helix wall” and a “-sheet wall” connected by two extended loops that harbor the heme
coordinating ligands (His 32 and Tyr 75) (Figure 2). Henceforth, the loops which harbor His 32
and Tyr 75 will be referred to as His 32 loop and Tyr 75 loop respectively. Solution NMR
structure of apo-HasAs showed that His 32 loop is spatially re-oriented and is approximately 30
Å away relative to its position in the holo-protein, while the Tyr 75 loop and the rest of the
structure remain virtually unaffected [14]. It is thought that binding of hemin onto the Tyr 75
loop causes the His 32 loop to move toward the closed conformation where heme binding is
mediated by His 32 coordination and hydrogen bonding interactions between the propionate
groups and the protein to form a stable complex. When His 32 is replaced with a noncoordinative
residue Ala (H32A) in HasAs, the mutant still binds hemin albeit with a lower affinity (Ka ~ 1.0
X 1010 M-1); a similar replacement in Tyr 75 (Y75A) causes an appreciable decrease in affinity
by nearly 2 orders of magnitude (Ka ~ 1.3 X 10⁸) [8]. However, to date, there is no structural
information to complement these observations and hence neither the coordination state of the
heme iron in the mutants nor the topological position of the His 32 loop in the H32A mutant is
known. In addition, the mechanism by which heme loads onto the protein has not been

29
elucidated. Nevertheless it has been proposed that heme binding is a two-step where initially, the
heme loads onto the Tyr 75 loop followed by closure of the His32 loop [14]. Recent independent
studies in support of this proposition have been reported; (i) reduction of holo-HasAs with
dithionite in the presence of CO results in formation of a ferrous hexacoordinate complex in
which His 32 is displaced by CO at the distal site [15], (ii) the crystal structure of HasAs in
complex with its receptor (HasR) show that the heme in the hemophore is coordinated only by
Tyr 75 at the proximal site while the His32 loop is turned away from its heme-binding
conformation and either assumes multiple conformations or is disordered [16]. In both cases, His
32 is deemed more labile than Tyr 75 hence the hypothesis that the heme first “latch” onto the
Tyr 75 loop followed by relocation of the His 32 loop. If this mechanism applies, it would be
distinct from that elucidated for the Shp hemophore secreted by the Gram-positive Streptococcus
pyogenes [17], which binds heme with two axial Met ligands [18] without detectable
intermediates [19].
Figure 1: X-ray crystal structure of truncated HasAp monomer B (PDB: 3ELL) showing -helices
(cyan), -strands (magenta), loops (wheat), heme (red), and heme axial ligands (green).
8
5

30
In this study, we present experimental evidence which demonstrates that heme loading
proceeds in two distinct sequential steps: a fast kinetic phase where the heme initially loads onto
the Tyr 75 loop, followed by a slow phase which involve conformational rearrangement of the
His 32 loop and subsequent coordination of the heme. We also present tangible evidence that the
presence of the heme in the Tyr 75 loop triggers relocation of the His 32 loop regardless of the
presence or absence of the heme-iron distal ligand. We used targeted molecular dynamics
simulations utilizing the structures of heme-free and heme-loaded HasAp to gain more insights
in the molecular motions that accompany the transition of the His 32 loop from the “open” to
“closed” conformation and suggest a plausible path for its relocation.
Experimental Procedures
Construction of H32A-HasAp
A gene coding for a truncated form of HasAp missing the last 21 C′-terminal amino acids
relative to the full-length protein was constructed as described previously [13]. H32A-HasAp
mutant was constructed on the background of the truncated form of HasAp by site directed
mutagenesis using the QuickChange mutagenesis kit (Stratagene) (Figure 3) and the mutation
was confirmed by DNA sequencing (SeqWright) prior to transforming the plasmid into E. coli
BL 21 GOLD (DE3) competent cells.

31
Expression and Purification of apo-proteins
An overnight starter culture of 50 mL Luria-Bertani (LB) medium containing 100μg/mL
ampicillin was grown from a single colony of freshly transformed plasmid. 30 mL of the culture
was used to inoculate 1 L of M9 minimal medium supplemented with 200 μg/mL ampicillin.
Cells were grown at 37 oC with continuous shaking at 235 rpm. Once OD600 was ~ 0.8-0.9 the
temperature was lowered to 30 °C and incubated further until OD600 reached ∼1.0. At this point
protein expression was induced by addition of isopropyl-D-thiogalactopyranoside (IPTG) to a
final concentration of 1 mM. The cells were grown for 5 h at 30 °C, harvested by centrifugation
(4800 rpm for 12 min at 4 °C) and stored at -20 °C. The cell paste was resuspended in 20 mM
Tris-HCl, pH 7.6, (3 mL/g cell paste) and disrupted by sonication (amplitude-70%) in the
presence of DNase (Sigma-Aldrich, St. Louis, MO). Large particles and cell debris were
separated by initial centrifugation at 2800 rpm and 4 °C for 10 min using a table centrifuge,
followed by complete clarification by ultracentrifugation at 19500 rpm and 4 °C for 40 min.
HasAp expressed in E.coli produces a mixture of apo- and holo-protein and is recovered
in the soluble fraction. The apo form was gently isolated from the holo fraction using two
chromatographic technique; ion exchange chromatography (IEC) at 4 °C and hydrophobic
interaction chromatography (HIC) at ambient temperature. Specifically, the clarified supernatant
was loaded onto a Q-Sepharose Fast Flow column (2.6 cm i.d. × 15 cm; GE Healthcare) pre-
equilibrated with 20 mM Tris-HCl (pH 7.6). The column was then washed with at least 3 bed
volumes of the same buffer before the protein was eluted with the same buffer and a linear
gradient (0-600 mM) of NaCl. Fractions containing HasAp were pooled and to it ammonium
sulfate was added to a final concentration of 0.7 M. The sample was then loaded onto a Butyl
Sepharose Fast Flow (GE Healthcare) column (2.6 cm i.d. × 12 cm) pre-equilibrated with 50 mM

32
sodium phosphate/0.7 M ammonium sulfate, pH 7.0. Elution of the protein was achieved in two
stages: (i) 50 mM sodium phosphate/0.5 M ammonium sulfate, pH 7.0 was used to elute weakly
S N T G G F N P
CCG TTT GAT GGC AGC CAG TAT GCG CTG AAC AGC ACC GCG AGC GAT GCGP F D G S Q F A L K S T A S D A
TTT ATT GCG GGC GGC GAT CTG CAT TAT ACC CTG TTT AGC AAC CCG AGC CAT F I A G G D L H Y T L F S N P S
ACC CTG TGG GGC AAA CTG GAT AGC ATT GCG CTG GGC GAT ACC CTG ACC GGCT L W G K L D S G
GGC GCG AGC AGC GGC GGCTAT GCG CTG GAT AGC CAG GAA GTG AGC TTT AGC G A S S G G Y A L D S Q E V S F S
AAC CTG GGC CTG GAT AGC CCG ATT GCG CAG GGC CGT GAT GGC ACC GTGN L G L D S P I A Q G R D G T V
AAA GTG GTG TAT GGC CTG ATG AGC GGC GAT AGC AGC GCG CTG CAG GGC CAGK V V Y G L M S G D S S A L Q G
ATT GAT GCG CTG CTG AAA GCG GTT GAT CCG AGC CTG AGC ATT AAC AGC ACC I D A L L K A V D P S L S I N S
TTT GAT CAG CTG GCG GCG GCG GGC GTG GCG CAT GCG ACC CCG GCG GCG GCGF D Q L A A A G V A H A T P A A A
GCG GCG GAA GTG GGC GTG GTG GGC GTG CAG GAA CTG CCG CAT GAT CTG GCGA A E V G V V G V Q E L P H D L
Bam H ICTG GCG GCG TA
A GGATCC GGG
L A A
-
5 ' Nde IGGGCATATG AGC ATT AGC ATT AGC TAT AGC ACC ACCTAT AGC GGC TGG ACC
M S I S I S Y S T T Y S G W T
GTG GCG GAT TAT CTG GCG GAT TGG AGC GCG TAT TTT GGC GAT GTG AAC GCGV A D Y L A D W S A Y F G D V N A
CGT CCG GGC CAG GTG GTG GAT GGC AGC AAC ACC GGC GGC TTT AAC CCG GGCR P G Q V V D G G
GCGP F D G S Q F A A
TTT ATT GCG GGC F I A G G D L H H
T L W G K L D S I A L G D T L T
GGC GCG AGC
CATN L G L D S P I H
K V V Y G L M S Q
ATT GAT GCG CTG T
TTT GAT CAG CTG GCG
GCG GCG GAA GTG GGC GTGA
Bam H I
L A A
-
3 '
Figure 2. DNA and amino acid sequence of HasAp-TR. The Nde I and BamHI
restriction endonuclease sites were constructed at the 5' and 3' ends, respectively, for
subcloning. The underlined codon represents the mutation of His to Ala at position 32.

33
bound proteins and holo-HasAp, and (ii) a linear gradient of sodium phosphate buffer (50-20
mM)/ammonium sulfate (0.50-0 M) was used to elute apo-HasAp. It is noteworthy to mention
here that apo-HasAp tenaciously binds to the column and elutes toward the ends of the linear
gradient (~ 20 mM Napi). Thus following elution from the butyl column, fractions containing the
apo-protein were pooled and again ammonium sulfate was added to a final concentration of 0.7
M before being loaded onto a Phenyl Sepharose 6 Fast Flow high substitution (GE Healthcare)
column (2.6 cm i.d. × 12 cm) pre-equilibrated with the same buffer as in the butyl column. The
protein was similarly eluted using steps (i) and (ii) described above. The purity of the protein in
the resultant fractions was assessed by 15 % SDS-PAGE (sodium dodecyl sulfate polyacrylamide
gel electrophoresis), and if necessary, fractions containing apo-HasAp were purified again on a
second Butyl Sepharose column.
Expression and Purification of Uniformly Labeled Proteins
Uniformly labeled U-15N-H32A-HasAp and U-13C/U-15N-H32A-HasAp were prepared
using a minor modification of the above-described protocol: Cells grown to OD600 ~ 0.8-0.9 were
harvested by centrifugation (4800 rpm, at 4 oC, for 12 min) and resuspended in fresh 1 L M9
medium supplemented with 200 g/mL ampicillin containing 1.0 g of 15NH4Cl as the sole
nitrogen source for preparing U15N-H32A-HasAp or 1.0 g of 15NH4Cl and 2.0 g of 13C6-D-
glucose as the sole nitrogen and carbon sources for preparing U-13C/U-15N-H32A- HasAp. The
cells were grown until OD600 reached ~1.0 after which biosynthesis of polypeptide was induced
by adding isopropyl--D-thiogalactopyranoside (IPTG) to a final concentration of 1 mM. The
cells were incubated for 5 h at 30 °C, harvested, lysed and purified as described above.

34
Expression and Purification of Selectively Labeled Proteins
Expression of selectively labeled samples was done following previously described
protocols [20, 21, 22] with minor modifications. Prior to autoclaving, synthetic amino acids (g/L)
except L-Trp (0.05) were added to the M9 media: L-Ala (0.5), L-Arg (0.4), L-Asn (0.4), L-Asp
(0.4), L-Cys (0.05), L-Gln (0.4), L-Glu (0.65), Gly (0.55), L-His (0.1), L-Ile (0.23), L-Leu
(0.23), L-Lys hydrochloride (0.42), L-Met (0.25), L-Phe (0.13), L-Pro (0.1), L-Ser (2.10), L-Thr
(0.23), L-Tyr (0.17), and L-Val (0.23).
Expression of [15N-Gly]
1.0 L of M9 medium supplemented with all the amino acids except Gly was inoculated
with 30 mL of overnight E. coli BL21 GOLD (DE3) starter culture. When the OD600 approached
1.0, the temperature was lowered and biosynthesis of polypeptide was induced by adding IPTG
to a final concentration of 1 mM, followed by the addition of 0.55 g [15N-Gly]. The cells were
incubated for 5 h at 30 °C, harvested, lysed and purified as described above.
Expression of [15N-Ala]
1.0 L of M9 medium supplemented with all the amino acids except L-Ala was inoculated
with 30 mL of overnight E. coli BL21 GOLD (DE3) starter culture. When the OD600 approached
1.0, the temperature was lowered and biosynthesis of polypeptide was induced by adding IPTG
to a final concentration of 1 mM, followed by the addition of 0.50 g [15N-L-Ala]. The cells were
incubated for 5 h at 30 °C, harvested, lysed and purified as described above.

35
Expression of [15N-Val]
1.0 L of M9 medium supplemented with all the amino acids except L-Val was inoculated
with 30 mL of overnight E. coli BL21 GOLD (DE3) starter culture. When the OD600 approached
1.0, the temperature was lowered and biosynthesis of polypeptide was induced by adding IPTG
to a final concentration of 1 mM, followed by the addition of 0.23 g [15N- Val]. The cells were
incubated for 5 h at 30 °C, harvested, lysed and purified as described above.
Sample preparation
Preparation of H32A-holo-HasAp
1.8-2.0 μmol of apo-H32A (8-10 μM) in sodium phosphate buffer μ = 0.1, pH 7.8 were
reconstituted with hemin by titrating with a freshly prepared solution of hemin in DMSO (1 mM)
under constant stirring until the absorbance ratio (A280/A402) remained constant. The resultant
holo-protein was incubated overnight at 4 °C, concentrated to 2 mL using 10 kDa MWCO
Amicon ultracentrifuge filter devices, and passed through a G-75 Sephadex column (2.6 cm i.d.
× 90 cm; GE Healthcare) equilibrated with phosphate buffer (μ = 0.1, pH 7.8).
Preparation of H32A-Imidazole complex
H32A-imidazole complex was prepared by titrating a solution of H32A-holo-HasAp with
0.1 M imidazole (pH 7.0) until soret maximum remained constant. The reaction was monitored
with UV-vis spectrophotometer. The affinity of imidazole for H32A-HasAp was determined as
follows; fresh protein (final concentration of 5 μM) was added to 2 mL each of increasing
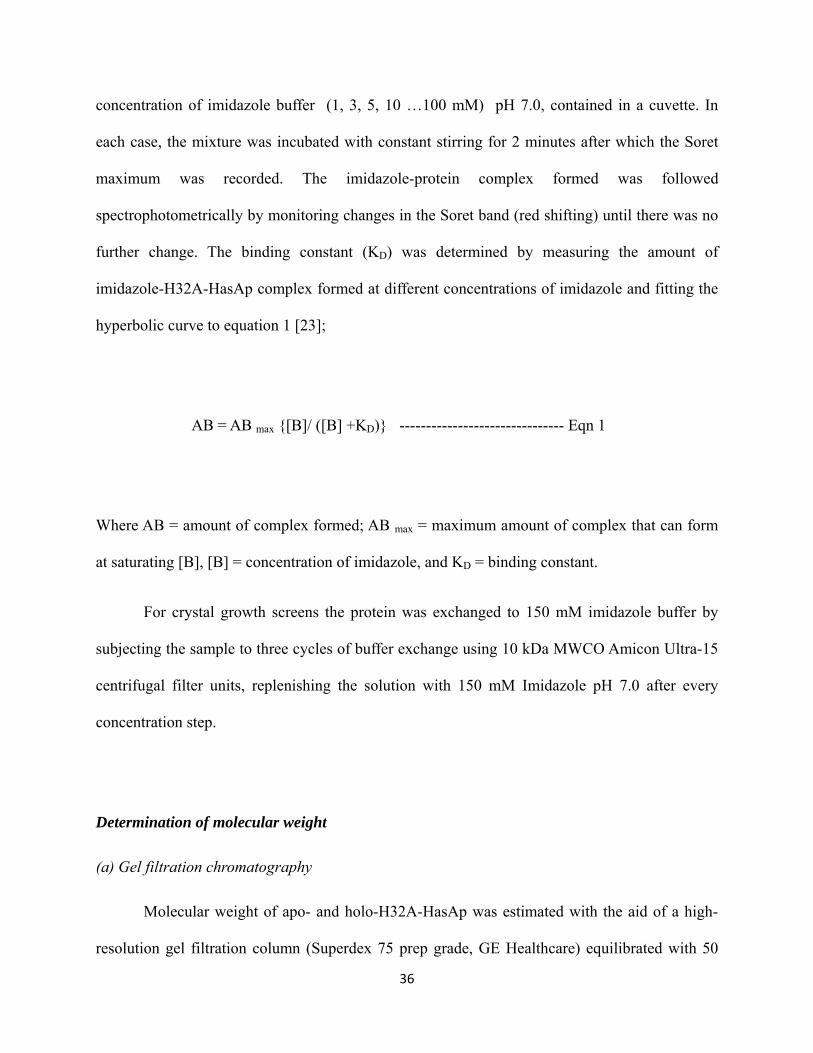
36
concentration of imidazole buffer (1, 3, 5, 10 …100 mM) pH 7.0, contained in a cuvette. In
each case, the mixture was incubated with constant stirring for 2 minutes after which the Soret
maximum was recorded. The imidazole-protein complex formed was followed
spectrophotometrically by monitoring changes in the Soret band (red shifting) until there was no
further change. The binding constant (KD) was determined by measuring the amount of
imidazole-H32A-HasAp complex formed at different concentrations of imidazole and fitting the
hyperbolic curve to equation 1 [23];
AB = AB max {[B]/ ([B] +KD)} ------------------------------- Eqn 1
Where AB = amount of complex formed; AB max = maximum amount of complex that can form
at saturating [B], [B] = concentration of imidazole, and KD = binding constant.
For crystal growth screens the protein was exchanged to 150 mM imidazole buffer by
subjecting the sample to three cycles of buffer exchange using 10 kDa MWCO Amicon Ultra-15
centrifugal filter units, replenishing the solution with 150 mM Imidazole pH 7.0 after every
concentration step.
Determination of molecular weight
(a) Gel filtration chromatography
Molecular weight of apo- and holo-H32A-HasAp was estimated with the aid of a high-
resolution gel filtration column (Superdex 75 prep grade, GE Healthcare) equilibrated with 50
37
mM Tris-HCl (pH 7.5), 100 mM KCl. The column was calibrated with a set of molecular weight
standards (GE Healthcare) including cytochrome c (12.4 kDa), chymotrypsin (25 kDa),
ovalbumin (44 kDa), and albumin (67 kDa) wherefrom a calibration curve was constructed. Pure
protein samples were passed through the same column and the molecular weight was determined
using their respective elution volumes.
(b) Electrospray Ionization Mass Spectrometry (ESI/MS)
Exact molecular mass of H32A-HasAp samples was determined by mass spectrometry
using a Waters capLCtm system equipped with an autoinjector coupled to ESI-MS-Q-TOF. Prior
to injection, ~ 5 M sample in 100 mM sodium phosphate buffer, pH 7.4, was diluted with H2O
in a 1:1 ratio. Separation was achieved by running acetonitrile/isopropyl alcohol (IPA)/water
linear gradient of 4 % acetonitrile/min at 10 L/min from 20 -60 % acetonitrile (buffer A- 99 %
water/ 1 % acetonitrile/ 0.08 % formic acid, buffer B- 80 % acetonitrile/ 10 % IPA/ 10 % water/
0.06 % formic acid) using a 0.5 mm ID C4 reverse phased column (MC-5-C4, 300Å pore size,
3.5 M particles; Micro-Tech).
ESI spectra were acquired on a Q-TOF-2 (Micromass Ltd, Manchester UK) hybrid mass
spectrometer operated in MS mode and acquiring data with the time of flight analyzer. The
instrument was operated for maximum resolution with all lenses optimized on the M2H2+ ion
from the cyclic peptide Gramicidin S. The cone voltage was 30 eV and Ar was admitted to the
collision cell at a pressure that attenuates the beam to about 20 %. The cell was operated at 5eV
(maximum transmission). Spectra were acquired at 11,346 Hz pusher frequency covering the

38
mass range of 100 to 3000 amu and accumulating data for 5 seconds per cycle. Time to mass
calibration was made with cesium iodide (CsI) cluster ions acquired under the same conditions.
Resonance Raman (RR) Spectroscopy
RR spectra were obtained using a custom McPherson 2061/207 spectrograph (0.67 m
with variable gratings) equipped with a Princeton Instruments liquid N2-cooled CCD detector
(LN-1100PB). Excitation at 413 nm was provided by a krypton laser (Innova 302, Coherent), and
a Kaiser Optical supernotch filter was used to attenuate Rayleigh scattering. Spectra at room
temperature were collected in a 90° scattering geometry on samples mounted on a reciprocating
translation stage. Frequencies were calibrated relative to indene and CCl4 and are accurate to ±1
cm-1. CCl4 was also used to check the polarization conditions. The integrity of the RR samples,
before and after laser illumination, was confirmed by direct monitoring of their UV-vis spectra in
the Raman capillaries. Low temperature spectra were obtained in a backscattering geometry on
samples maintained at ∼105 K in a liquid nitrogen coldfinger. Frequencies were calibrated
relative to aspirin and are accurate to ±1 cm-1.
EPR Spectroscopy
EPR spectra were obtained on a Bruker E500 X-band EPR spectrometer equipped with a
superX microwave bridge and a dual mode cavity with a helium-flow cryostat (ESR900, Oxford
Instruments, Inc.). The experimental conditions such as temperature, microwave power, and

39
modulation amplitude, were varied to optimize the detection of all potential EPR active species
and to ensure nonsaturating conditions.
X-Ray Crystallography
Protein Crystallization
Crystallization studies were carried out in the Protein Structure Laboratory at the Delbert
M. Shankel Structural Biology Center (University of Kansas, Lawrence, KS). Crystal growth
screening conditions were carried out using the sitting drop vapor diffusion method in Compact
Jr. Crystallization plates (Emerald BioSystems) at 20 °C. 0.5 L of pure proteinwere mixed with
an equal volume of reservoir solution and equilibrated against 100 μL of the latter.
Needle-like crystals of apo-HasAp (approximately 300 μm long) were obtained from 50
mg/mL protein in 100 mM sodium phosphate, pH 7.8, within 2 days from Wizard II (Emerald
BioSystems) condition #19 (1.6 M NaH2PO4/0.4 M K2HPO4, 100 mM phosphate-citrate pH 4.2).
Before freezing in liquid nitrogen for data collection, the samples were immersed in a
cryoprotant containing 80% crystallization solution and 20% glycerol for approximately 30 s.
Prismatic crystals of dimeric H32A holo-HasAp (approximately 700 μm long) were obtained
from 15 mg/mL protein in 100 mM sodium phosphate, pH 7.0, within 24 h from Wizard II
condition #15 (1.26 M (NH4)2SO4, 100 mM HEPES pH 7.5). Crystals were transferred and
equilibrated for 60 s in a solution containing 2 M (NH4)2SO4, 100 mM HEPES pH 7.5, 10% d-
sorbitol and then in the same solution containing 20% d-sorbitol before freezing in liquid
nitrogen. Prismatic crystals of imidazole bound H32A-holo-HasAp obtained after approximately
4 weeks from 9.3 mg/mL protein in 150 mM imidazole pH 7.0 grew from Wizard II condition

40
#34 (10% (w/v) PEG 8000, 100 mM imidazole pH 8.0). Samples were transferred to a
cryoprotectant containing 80% crystallization solution and 20% (v/v) PEG 400 before freezing in
liquid nitrogen for data collection. Wizard II random sparse matrix crystallization screen is
shown in Appendix 1.
X-ray Data Collection
Data for apo- and dimeric holo-HasAp were collected at 100 K at the Advanced Photon
Source (APS) IMCA-CAT, beamline 17BM using an ADSC Quantum 210r CCD detector.
Diffraction data for imidazole bound H32A-holo-HasAp were collected at 93 K in-house using a
Rigaku RU-H3R rotating anode generator equipped with Osmic Blue focusing mirrors and an R-
axis IV+2 image plate detector. Apo-HasAp and imidazole bound H32A-holo-HasAp diffraction
data were integrated and scaled with the HKL2000 package [24] while dimeric H32A-holo-
HasAp data were processed with the XDS [25] package. The Laue class for each data set was
checked using Pointless [26].
Structure Solution and Refinement
Structure solution of apo-HasAp was obtained by molecular replacement with Molrep [27]
using the holo-HasAp structure (PDB: 3ELL) [13] as the search model. Automated model
building was conducted with ARP/wARP [28]. The final model was used for subsequent
molecular replacement searches with the dimeric H32A-holo-HasAp and imidazole bound
H32A-holo-HasAp data sets. Structure refinement was performed with Refmac [29] for apo and
imidazole bound H32A-holo-HasAp and with Phenix [30] for dimeric H32A-holo-HasAp,
respectively. Manual model building was carried out with Coot [31]. The crystals of dimeric

41
H32A-holo-HasAp were indexed in a monoclinic C lattice with a = 110.34 Å, b = 52.70 Å, c=
71.74 Å, = 129.05°, and space group C2. However, the unit cell and space group were
transformed to the nonstandard setting I2 using the reindexing matrix (0 0 -1, 0 1 0, 1 0 1) to give
a = 71.74 Å, b = 52.70 Å, c = 85.71 Å, = 91.48°. For dimeric H32A-holo-HasAp, anisotropic
displacement parameters were modeled by TSL refinement [32] using 10 and 11 TLS groups for
subunits A and B respectively. Molecule B appeared to display increased thermal motion as
indicated by the larger overall B-factor (∼2-fold) relative to molecule A. For the imidazole bound
H32A-holo-HasAp, 7 TLS groups were refined for both molecules of the noncrystallographic
dimer in the asymmetric unit. Structure validation was performed using MOLPROBITY [33],
and figures were prepared using CCP4 mg [34]. A summary of crystallographic data is provided
in Table 1. For apo-HasAp, phosphate and sodium ions were identified from the difference
electron density and assigned based on the coordination and expected nonbonded distances [35].
NMR Spectroscopy
All experiments were conducted using a Varian Unity Inova 600 NMR spectrometer
equipped with a triple resonance probe. Sequential backbone resonance assignments were
obtained with the aid of 1H-15N-HSQC, HNCA, HN(CO)CA, HNCACB, CBCA(CO)NH,
HNCO, and HN(CA)CO experiments conducted with H32A-HasAp sample uniformly labeled
with 13C and 15N. The samples were contained in phosphate buffer (μ = 0.1, pH 7.0) with 5-10%
D2O and the concentrations ranged between 3.9 and 6.7 mM. After collecting the data that was
required to carry out resonance assignments of H32A- HasAp, the samples were exchanged to
150 mM imidazole buffer, pH 7.0 using 10 KDa MWCO Amicon Ultra-15 centrifugal filter

42
units. The protein samples in imidazole buffer (H32A-imidazole) were finally concentrated to the
same volume as the original H32A-HasAp sample to maintain the protein concentration constant.
Samples of 15N-Gly (4.6 mM), 15N-Ala (4.4 mM), and 15N-Val (5.2 mM) selectively labeled
proteins were used to collect two-dimensional 1H-15N-HSQC spectra using standard and rapid
repetition conditions. For rapid repetition HSQC experiments, the acquisition time and relaxation
delay were shortened to 35 and 50 ms, respectively from the standard 95 ms and 1 s, and the
number of scans was increased to at least 256 from the typical 16 scans per increment used in
standard experiments. All other acquisition parameters were identical. Unless otherwise stated,
the experiments were conducted at 32 °C. Other relevant acquisition and processing parameters
used to obtain specific spectra are included in the corresponding figure caption. The data were
processed using NMRPipe [36] and analyzed with the program Sparky [37]. 1H chemical shifts
were referenced directly to internal DSS using the methyl 1H resonance at 0.00 ppm, whereas
15N and 13C chemical shifts were referenced indirectly using the ratio of gyromagnetic ratios.
Targeted Molecular Dynamics (TMD) Simulations
All calculations were performed using the biomolecular simulation program CHARMM
[38] with the all-atom parameter set PARAM22 for proteins [39], including the dihedral cross-
term corrections (CMAP) [40] and a modified TIP3 water model [41]. The simulation system,
Figure 3, was built by using the Quick MD Simulator module in CHARMM-GUI [42] after the
hemin-iron was coordinated to the phenol group of Tyr 75 in the structure of apo-HasAp. Holo-
HasAp was solvated in a 80 Å × 80 Å × 80 Å water box with 0.15 M KCl, resulting in a total
of 48 292 atoms; the number of water molecules, K+ ions, and Cl- ions are 15 191, 50, and 37,
43
respectively; different numbers of K+ and Cl- ions were added to make the simulation system
neutral. After a 350 ps equilibration time, 25 independent 1.2 ns TMD simulations were
performed starting from the “open” (apo) and progressing to the “closed” (holo) structure. A time
step of 2 fs was used for the NVT (constant volume and temperature) dynamics with the SHAKE
algorithm [43]. The same options as those in the input scripts provided by CHARMM-GUI were
used for nonbonded interactions [42]. In total, 50 structures (“images”) were generated at equal
intervals of the root mean squared deviation (rmsd) between the open and closed structures for
each run, followed by clustering the images obtained at each of the rmsd intervals. Analysis of
the trajectories was also performed to identify important interactions during the transition from
“open” to “closed” structures starting from the “open” (apo) and progressing to the “closed”
(holo) structure. A time step of 2 fs was used for the NVT (constant volume and temperature)
dynamics with the SHAKE algorithm [44]. The same options as those in the input scripts
provided by CHARMM-GUI were used for nonbonded interactions [42]. In total, 50 structures
(“images”) were generated at equal intervals of the root mean squared deviation (rmsd) between
the open and closed structures for each run, followed by clustering the images obtained at each
of the rmsd intervals. Analysis of the trajectories was also performed to identify important
interactions during the transition from “open” to “closed” structures.

44
A B CA B C
Table 1. Crystallographic data of HasAp structures.
Apo-HasAp HasAp H32A Dimer HasAp H32A Imidazole
Data Collection
Unit-cell parameters (Å, o) a = 32.98, b = 65.25,
c = 38.34, = 110.5
a = 71.74 Å, b = 52.70 Å,
c = 85.71 Å, = 91.48
a = 41.37 Å, b = 46.38 Å,
c = 81.09 Å, = 97.01
Space group P21 I2 P2
Resolution (Å)i 50.0-1.55 (1.61 - 1.55)
50.0-1.20 (1.30-1.20) 30.0-2.25 (2.33-2.25)
Wavelength (Å) 1.0000 1.0000 1.5418
Observed reflections 78,274 443,848 47,076
Unique reflections 21,268 95,175 16,389
<I/(I)>1 22.9 (2.1) 17.0 (3.4) 15.6 (2.3)
Completeness (%)i 98.5 (72.4) 95.0 (91.9) 96.6 (91.8)
Figure 3. The simulation system of hemin bound apo-HasAp. (A) Hemin bound apo-HasAp. (B) Hemin
bound apo-HasAp with 0.15 M KCl. (C) Hemin bound apo-HasAp with 0.15 M KCl aqueous solution.
Apo-HasAp (yellow) is shown in cartoon representation with the His32 and Tyr75 loops highlighted in
magenta. Hemin is shown in red sticks, hemin iron as an orange sphere, K+ as magenta spheres, and Cl-
as green spheres. Waters molecules are represented by lines (marine).

45
Redundancyi 3.7 (2.1) 4.7 (3.5) 2.9 (2.6)
Rsymi,ii 7.6 (32.3) 4.1 (35.0) 411.6 (53.5)
Refinement
Resolution (Å) 35.92-1.55 19.25-1.20 24.65-2.25
Reflections (working/test) 20,125 / 1,095 87,374 / 4,379 15,450 / 821
Rfactor / Rfree (%)iii 15.3 / 17.8 17.7 / 19.7 21.4 / 26.7
No. of atoms protein (chain A, B)/heme/water)
1344 / - / 158 1353, 1273 / 86 / 305 1259, 1269 / 86 / 64
Model Quality
R.m.s deviations
Bond lengths (Å) 0.014 0.010 0.018
Bond angles (o) 1.434 1.421 1.617
Average B factor (Å2)
All Atoms 15.7 21.5 42.3
Protein 15.4 14.9 / 27.7 40.4 / 44.9
Water 25.8 25.7 36.8
Heme - 20.7 35.6
Phosphate or imidazole 26.0 - 41.9
Coordinate error based on maximum likelihood (Å)
0.05 0.16 0.21
Ramachandran Plot
Most favored (%) 97.3 97.2 95.9
Additionally allowed (%) 2.2 2.2 4.1
Disallowed (%) 0.5 0.4
i) Values in parenthesis are for the highest resolution shell.
ii) Rsym = hkli |Ii(hkl) - <I(hkl)>| / hkli Ii(hkl), where Ii(hkl) is the intensity
measured for the ith reflection and <I(hkl)> is the average intensity of all reflections with indices hkl.
iii) Rfactor = hkl ||Fobs (hkl) | - |Fcalc (hkl) || / hkl |Fobs (hkl)|; Rfree is calculated in an identical manner using 5% of randomly selected reflections that were not included in the refinement.

46
Results
Purification of the apo-proteins
In E.coli, HasAp is expressed as a mixture of apo (~ 80%) and holo (~ 20 %) protein.
Previously, isolation of the apo protein was achieved by reconstituting the entire sample with
hemin followed by extraction of the heme [13] using the cold acid-acetone method as reported
for the preparation of apo-HasAs [9]. Briefly, pure holo-protein is concentrated and added
dropwise with constant stirring into cold acid-acetone solution (0.2 % V/V of 12 M HCl). Under
these conditions, heme is extracted and remains in solution while the protein precipitates.
Following gentle centrifugation, the precipitate is dissolved in appropriate buffer containing 7.0
M urea followed by extensive dialysis to rid urea and refold the protein. When this method is
applied to HasAp, extraction is not complete. The final apo-protein obtained contains
approximately 3-10 % residual holo-protein [13]. Undoubtedly this method would not give
authentic results in the experiments designed for this study. Thus, a chromatographic method
which capitalizes on tenacious binding of the apo-protein to functional groups in hydrophobic
affinity interaction columns relative to the holo-protein was developed. This approach allows
complete separation of the holo-form and gentle isolation of pure apo-protein for subsequent
crystallographic and spectroscopic studies.
Structural Characterization of apo-HasAp
The crystal structure of apo-HasAp shows that except for the His 32 loop, the overall fold
of HasAp is very similar in the apo and holo forms (Figure 4). Structural alignment of both
proteins shows that the position of the “β-sheet wall” comprised of eight antiparallel β-strands
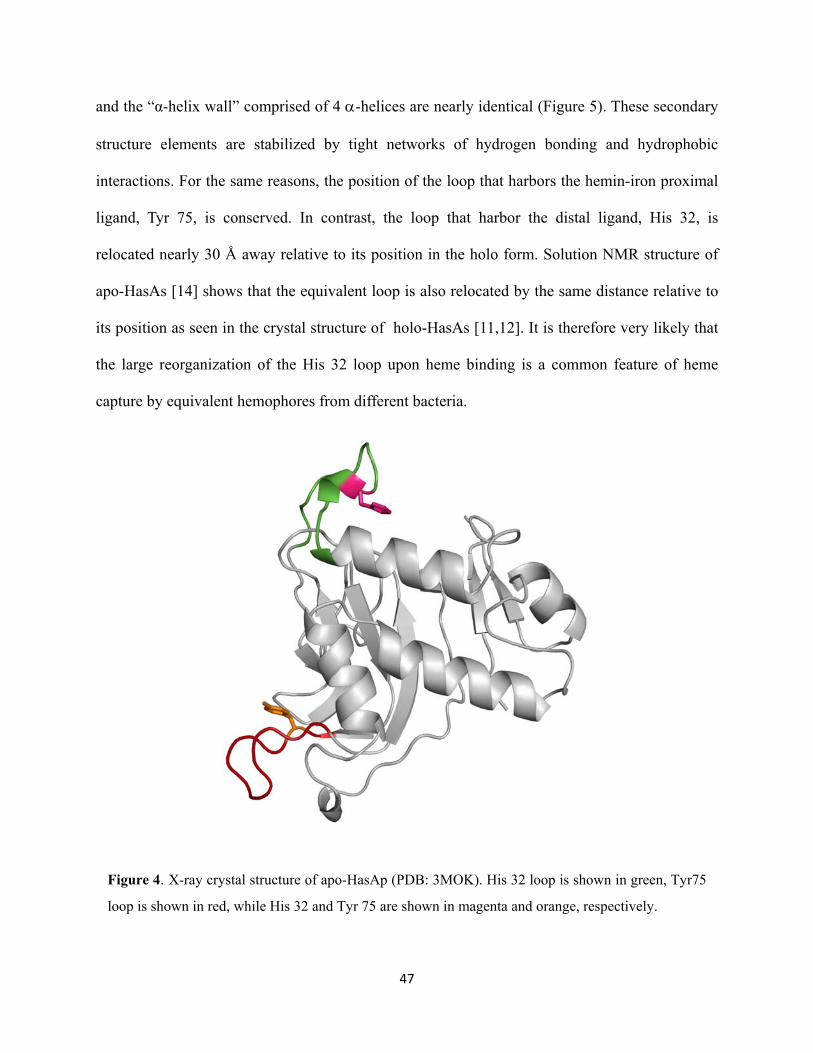
47
and the “α-helix wall” comprised of 4 -helices are nearly identical (Figure 5). These secondary
structure elements are stabilized by tight networks of hydrogen bonding and hydrophobic
interactions. For the same reasons, the position of the loop that harbors the hemin-iron proximal
ligand, Tyr 75, is conserved. In contrast, the loop that harbor the distal ligand, His 32, is
relocated nearly 30 Å away relative to its position in the holo form. Solution NMR structure of
apo-HasAs [14] shows that the equivalent loop is also relocated by the same distance relative to
its position as seen in the crystal structure of holo-HasAs [11,12]. It is therefore very likely that
the large reorganization of the His 32 loop upon heme binding is a common feature of heme
capture by equivalent hemophores from different bacteria.
Figure 4. X-ray crystal structure of apo-HasAp (PDB: 3MOK). His 32 loop is shown in green, Tyr75
loop is shown in red, while His 32 and Tyr 75 are shown in magenta and orange, respectively.

48
~ 90o
26.1 Å
31.2 Å
Comparison of the amino acid sequence to other hemophores (Figure 6) in the context of
the structural alignment of apo- and holo-HasAp shows that most of the conserved residues are
hydrophobic and majority of them are found around the beginning and the end of His32 loop
(Gly 28 to Gly 45), and Tyr 75 loop (His 74 to Leu 85). Small aliphatic residue Gly 28 (C`-end
of 1) and Gly 45 (beginning of 2) constitute the “hinges” about which His32 loop pivots
(Figure 7-A). In close proximity are conserved aromatic residues; Phe 27, near hinge residue
Gly 28, and Phe 46, near hinge residue Gly 45 (Figure 7-B & C). The side chain of Phe 27 is
located at the end of 1 and packs against the side chain of conserved Trp 23, which in turn is
stabilized by additional hydrophobic interactions with aromatic side chains upstream in 1
Figure 5: Overlaid x-ray crystal structures of HasAp showing the position of the loops in apo- (green)
and holo-(red) wild type protein. The heme is colored blue, axial ligands in holo-HasAp are shown in
orange.
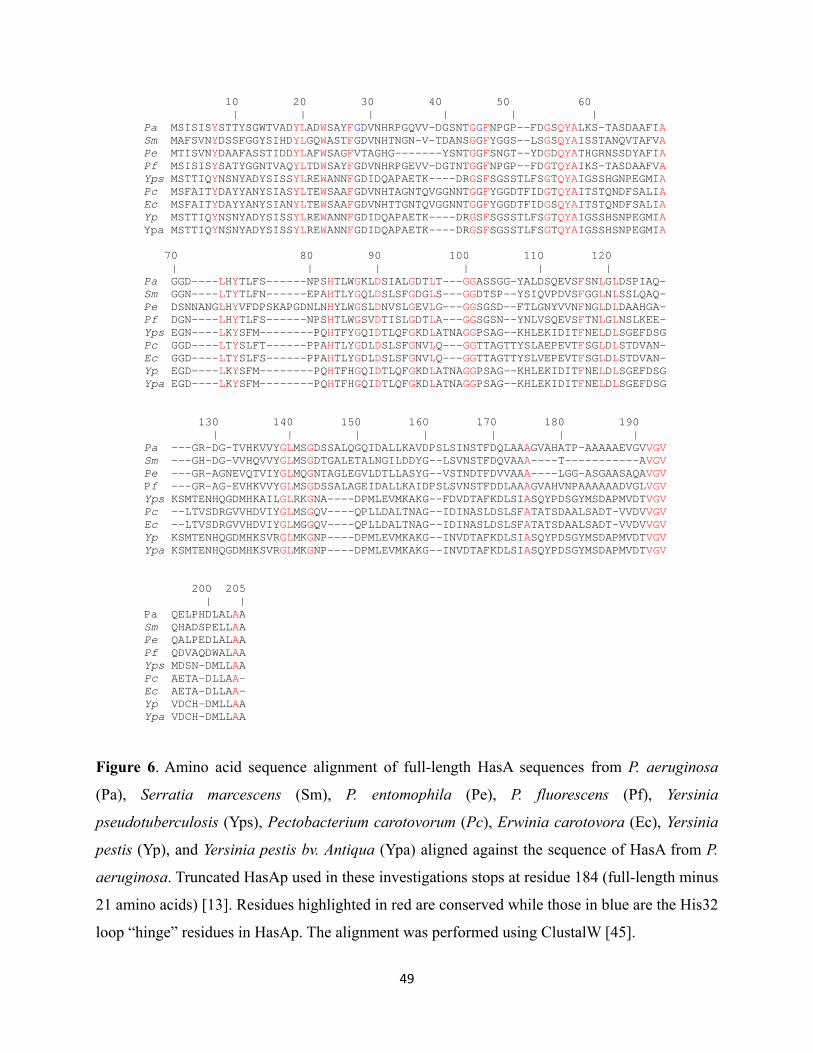
49
10 20 30 40 50 60 | | | | | | Pa MSISISYSTTYSGWTVADYLADWSAYFGDVNHRPGQVV-DGSNTGGFNPGP--FDGSQYALKS-TASDAAFIA Sm MAFSVNYDSSFGGYSIHDYLGQWASTFGDVNHTNGN-V-TDANSGGFYGGS--LSGSQYAISSTANQVTAFVA Pe MTISVNYDAAFASSTIDDYLAFWSAGFVTAGHG-------YSNTGGFSNGT--YDGDQYATHGRNSSDYAFIA Pf MSISISYSATYGGNTVAQYLTDWSAYFGDVNHRPGEVV-DGTNTGGFNPGP--FDGTQYAIKS-TASDAAFVA Yps MSTTIQYNSNYADYSISSYLREWANNFGDIDQAPAETK----DRGSFSGSSTLFSGTQYAIGSSHGNPEGMIA Pc MSFAITYDAYYANYSIASYLTEWSAAFGDVNHTAGNTQVGGNNTGGFYGGDTFIDGTQYAITSTQNDFSALIA Ec MSFAITYDAYYANYSIANYLTEWSAAFGDVNHTTGNTQVGGNNTGGFYGGDTFIDGSQYAITSTQNDFSALIA Yp MSTTIQYNSNYADYSISSYLREWANNFGDIDQAPAETK----DRGSFSGSSTLFSGTQYAIGSSHSNPEGMIA Ypa MSTTIQYNSNYADYSISSYLREWANNFGDIDQAPAETK----DRGSFSGSSTLFSGTQYAIGSSHSNPEGMIA 70 80 90 100 110 120 | | | | | | Pa GGD----LHYTLFS------NPSHTLWGKLDSIALGDTLT---GGASSGG-YALDSQEVSFSNLGLDSPIAQ- Sm GGN----LTYTLFN------EPAHTLYGQLDSLSFGDGLS---GGDTSP--YSIQVPDVSFGGLNLSSLQAQ- Pe DSNNANGLHYVFDPSKAPGDNLNHYLWGSLDNVSLGEVLG---GGSGSD--FTLGNYVVNFNGLDLDAAHGA- Pf DGN----LHYTLFS------NPSHTLWGSVDTISLGDTLA---GGSGSN--YNLVSQEVSFTNLGLNSLKEE- Yps EGN----LKYSFM--------PQHTFYGQIDTLQFGKDLATNAGGPSAG--KHLEKIDITFNELDLSGEFDSG Pc GGD----LTYSLFT------PPAHTLYGDLDSLSFGNVLQ---GGTTAGTTYSLAEPEVTFSGLDLSTDVAN- Ec GGD----LTYSLFS------PPAHTLYGDLDSLSFGNVLQ---GGTTAGTTYSLVEPEVTFSGLDLSTDVAN- Yp EGD----LKYSFM--------PQHTFHGQIDTLQFGKDLATNAGGPSAG--KHLEKIDITFNELDLSGEFDSG Ypa EGD----LKYSFM--------PQHTFHGQIDTLQFGKDLATNAGGPSAG--KHLEKIDITFNELDLSGEFDSG 130 140 150 160 170 180 190 | | | | | | | Pa ---GR-DG-TVHKVVYGLMSGDSSALQGQIDALLKAVDPSLSINSTFDQLAAAGVAHATP-AAAAAEVGVVGV Sm ---GH-DG-VVHQVVYGLMSGDTGALETALNGILDDYG--LSVNSTFDQVAAA----T-----------AVGV Pe ---GR-AGNEVQTVIYGLMQGNTAGLEGVLDTLLASYG--VSTNDTFDVVAAA----LGG-ASGAASAQAVGV Pf ---GR-AG-EVHKVVYGLMSGDSSALAGEIDALLKAIDPSLSVNSTFDDLAAAGVAHVNPAAAAAADVGLVGV Yps KSMTENHQGDMHKAILGLRKGNA----DPMLEVMKAKG--FDVDTAFKDLSIASQYPDSGYMSDAPMVDTVGV Pc --LTVSDRGVVHDVIYGLMSGQV----QPLLDALTNAG--IDINASLDSLSFATATSDAALSADT-VVDVVGV Ec --LTVSDRGVVHDVIYGLMGGQV----QPLLDALTNAG--IDINASLDSLSFATATSDAALSADT-VVDVVGV Yp KSMTENHQGDMHKSVRGLMKGNP----DPMLEVMKAKG--INVDTAFKDLSIASQYPDSGYMSDAPMVDTVGV Ypa KSMTENHQGDMHKSVRGLMKGNP----DPMLEVMKAKG--INVDTAFKDLSIASQYPDSGYMSDAPMVDTVGV 200 205 | | Pa QELPHDLALAA Sm QHADSPELLAA Pe QALPEDLALAA Pf QDVAQDWALAA Yps MDSN-DMLLAA Pc AETA-DLLAA- Ec AETA-DLLAA- Yp VDCH-DMLLAA Ypa VDCH-DMLLAA
Figure 6. Amino acid sequence alignment of full-length HasA sequences from P. aeruginosa
(Pa), Serratia marcescens (Sm), P. entomophila (Pe), P. fluorescens (Pf), Yersinia
pseudotuberculosis (Yps), Pectobacterium carotovorum (Pc), Erwinia carotovora (Ec), Yersinia
pestis (Yp), and Yersinia pestis bv. Antiqua (Ypa) aligned against the sequence of HasA from P.
aeruginosa. Truncated HasAp used in these investigations stops at residue 184 (full-length minus
21 amino acids) [13]. Residues highlighted in red are conserved while those in blue are the His32
loop “hinge” residues in HasAp. The alignment was performed using ClustalW [45].

50
Figure 7. (A) Overlay of apo (magenta) and holo (turquoise, PDB: 3ELL) HasAp showing a zoomed in view of the “hinge” region of the His32 bearing loop.(B) Apo-HasAp showing the
aromatic side chains (green) that stabilize the 1-loop near the Gly 28 hinge; the H32 loop is shown in magenta. (C) Apo-HasAp showing the aromatic side chains (green) that stabilize the structure near the Gly 44 hinge. The hemin molecule of holo-HasAp (PDB: 3ELL) is shown in red for reference
A
B
C

51
(Figure 7-B). Seemingly, Phe 27 is placed immediately before the “hinge” to act as a “hinge
anchor” to preserve the structural integrity of 1 while the loop pivots between conformations.
The side chain of Phe 46 located at the beginning of 2 near the hinge residue Gly 44 packs
against the side chain of conserved Tyr 56. As shown in Figure 7-C, the side chains of both
aromatic residues interact with the vinly group of the macrocycle suggesting that they could be
playing an important role in stabilizing the heme complex.
Conformational changes observed upon heme binding onto apo-HasAp
As shown in Figure 8, heme binding induces a few subtle changes in the side chains of
residues near the heme binding site. In the Tyr 75 loop, the orientation of the side chain of Tyr
75 is nearly identical in both apo and holo forms possibly because it is the ligand that coordinates
to the heme. On the other hand, the side chain of the heme binding partner, His 83, undergoes
minimal movement upon heme binding (Figure 7-A), which reduces the hydrogen bond length
between His 83 δN and ηO of Tyr 75 by approximately 0.7 Å. Reduction of this bond length
may be a necessity to enhance the tyrosinate character of the heme ligand Tyr 75, in turn
strengthening the Tyr- Fe bond. Previous studies have shown that this hydrogen bonding
interaction is conserved in heme-bound hemophores [11,13,46 ]. Another significant residue that
is affected by heme loading is Arg 129. In the apo-protein the side chain of Arg 129 forms a
hydrogen bond (3.6Å) with ηO of Tyr 138 located in 2 (Figure 8-A). Upon heme binding the
side chain of Arg 129 reorients such that the NH2 group initially hydrogen bonded to Tyr 138
moves away by ~4.7 Å to form a salt bridge with one of the heme propionates (3.4 Å). On the
other hand, the side chain of Tyr 138 moves away to accommodate the heme and in turn forms a

52
hydrogen bond (2.7 Å) with the carbonyl group of His 32. This new position likely provides
hydrophobic stabilization of the macrocycle and also may help stabilize the His 32-Fe
coordination. The side chain of Met 141, also located in 2, relocates upon heme binding. The
terminal methyl group moves toward the heme and engage in hydrophobic interaction, likely
stabilizing the complex. The only secondary structure element that is significantly affected when
the heme loads onto the hemophore is His 32 loop. Its movement, which also facilitates His 32
coordination to the heme, is accompanied by conformational change in the carbonyl oxygen of
the “hinge” residue Gly 28. The new conformation of the carbonyl oxygen of Gly 28 forces the
short loop comprised of Gly 143 and Asp 144 ( flanking 2 and 3) to move, causing
displacement in the C`-end of helix 2 (Figure 8-B). The opposite end of the loop (near Gly 45
hinge) is less obstructed, and thus heme loading does not bring about significant observable
changes on or around it.
A B
Characterization of H32A-HasAp mutant
Figure 8. Overlay of apo (magenta) and holo (turquoise, PDB: 3ELL) HasAp (A) Zoomed in
view of the heme binding pocket showing conformational differences between certain residues
upon hemin binding. (B) Displacement of helix 2 and the short loop comprised by G143 and
D144 relative to the apoprotein upon hemin binding; movement of the latter enables hinge
residue G28 in the holo structure to adopt its hemin bound conformation.

53
The molecular weight of pure H32A-apo-HasAp estimated by gel filtration revealed that
in the apo form, the mutant is monomeric (Figure 9-C). However, when the apo-protein is
reconstituted with hemin and passed through a gel filtration column (Sephadex G-75), two
chromatographically distinguishable peaks are observed (Figure 9-A). The electronic absorption
spectrum obtained from fractions corresponding to the fast-eluting peak exhibits a broad Soret
band with a maximum at 399 nm, Q bands at 504 and 536 nm, and a CT band at 630 nm (black
trace in Figure 9-B). On the other hand, fractions corresponding to the slow-eluting peak exhibit
spectra with a relatively narrower Soret band at 401 nm, Q bands at 502 and 534 nm, and a CT
band at 623 nm (red trace in Figure 9-B). The position of the soret and the presence of the CT
bands above 600 nm indicate that fractions in both peaks contain high spin (hs) species. The
presence of / bands near 530 and 500 nm are indicative of the presence of low spin (ls)
species. Thus, judging from UV-vis spectra, protein fractions in both peaks exist as a mixture of
hs and ls species. These observations are corroborated by resonance Raman and EPR
spectroscopies. The fast eluting peak was identified by low-temperature resonance Raman as
having predominantly five-coordinate high-spin (5c-hs) ferric heme species while a greater
contribution of 6-coordinate species exists in the second fraction (Figure 10-A). In the EPR
spectra (Figure 10-B), both fractions exhibit intense g ≈ 6 signatures consistent with axial S=5/2
high spin iron (III) configurations, with evidence of signal broadening in the first fraction.

54
Fraction number
0 5 10 15 20 25 30
Abs
orba
nce
0.0
0.2
0.4
0.6
0.8
1.0
A
dimer
monomer
Fraction number
0 5 10 15 20 25 30
Abs
orba
nce
0.0
0.2
0.4
0.6
0.8
1.0
A
Fraction number
0 5 10 15 20 25 30
Abs
orba
nce
0.0
0.2
0.4
0.6
0.8
1.0
A
dimerdimer
monomermonomer
Wavelength (nm)
300 400 500 600 700
Abs
orban
ce
0.00
0.05
0.10
0.15
0.20
0.25
0.30
401
5X
630623
534
504536
502
399
B monomerdimer
Wavelength (nm)
300 400 500 600 700
Abs
orban
ce
0.00
0.05
0.10
0.15
0.20
0.25
0.30
401
5X
630623
534
504536
502
399
B
Wavelength (nm)
300 400 500 600 700
Abs
orban
ce
0.00
0.05
0.10
0.15
0.20
0.25
0.30
401401
5X
630623
534
504536
502
5X5X
630630623623
534534
504504536536
502502
399399
B monomerdimermonomermonomerdimerdimer
Ve (mL)
12 14 16 18
log
MW
1.0
1.2
1.4
1.6
1.8
2.0
Albumin
Ovalbumin
Chymotrypsin
Cytochrome C
apo H32A
holo H32A monomer
holo H32A dimer
Ve (mL)
12 14 16 18
log
MW
1.0
1.2
1.4
1.6
1.8
2.0
Albumin
Ovalbumin
Chymotrypsin
Cytochrome C
apo H32Aapo H32A
holo H32A monomerholo H32A monomer
holo H32A dimerholo H32A dimer
C
Ve (mL)
12 14 16 18
log
MW
1.0
1.2
1.4
1.6
1.8
2.0
Albumin
Ovalbumin
Chymotrypsin
Cytochrome C
apo H32A
holo H32A monomer
holo H32A dimer
Ve (mL)
12 14 16 18
log
MW
1.0
1.2
1.4
1.6
1.8
2.0
Albumin
Ovalbumin
Chymotrypsin
Cytochrome C
apo H32Aapo H32A
holo H32A monomerholo H32A monomer
holo H32A dimerholo H32A dimer
C
Figure 9. (A) Elution profile of H32A
holo-HasAp from a Sephadex G-75
column; open circles track the Soret band
absorption (∼A400 nm) and black circles
track A280 nm.
(B) Electronic absorption spectra of
fractions in the fast eluting peak (black,
dimer) and in the slow eluting peak (red,
monomer). The ratio of dimer to
monomer obtained under these
(C) Elution volumes (Ve) from a
calibrated Superdex 75 column and
estimated molecular weights for monomer
holo H32A HasAp (red triangle), dimer
holo H32A HasAp (green diamond), and
apo H32A HasAp (blue triangle); the
average molecular weight was obtained
from two experiments. The Superdex 75
column was calibrated with albumin (67
kDa), ovalbumin (44 kDa), chymotrypsin
(25 kDa), and cytochrome c (12.4 kDa)
shown in black filled circles.

55
1000 2000 3000
First Fraction Second Fraction
Magnetic Field (G)
1400 1500 1600
F irs tF ra c tio n
S e co n dF ra c tio n
R am an S h ift (cm -1)
1 4 8 1 1 4 8 9
3
A B
Further analysis was done to determine whether formation of the species in either one of the two
peaks is equilibrium driven. Thus, immediately following the initial chromatographic separation,
fractions from each peak were pooled and loaded independently onto the same Superdex G-75
column. In each case there was no evidence of interconversion since fractions from each
independent run eluted in a single band. Clearly, the two species are stable and once they are
formed they do not interconvert. This observation is handy in a sense that the species in solution
can easily be identified by its electronic absorption signature. Denaturing polyacrylamide gel
electrophoresis indicated that the protein from both peaks migrates at the same rate as the apo-
protein (Figure 11) , implying that the observed difference in elution volumes from the Sephadex
Figure 10. (A) Resonance Raman spectra (obtained at 105 K) of the first and second fractions
of H32A-holo-HasAp (λexc = 413 nm, 20 mW; the spectra were normalized on the intensity of
the 4 observed at 1375 cm-1). (B) X-band EPR spectra of the first and second fractions of
H32A-holo-HasAp obtained at 10 K (0.03 mW microwave power, 9.66 GHz microwave
frequency; 10 G modulation amplitude). The two spectra were normalized based on their
hemin content determined by the pyridine hemochrome assay.

56
G-75 column are not due to degradation or covalent modification but likely an indication of
different stable oligomeric states. In pursuit of this notion, pooled fractions from each peak were
loaded independently onto a calibrated, high resolution Superdex 75 column. Protein obtained
from the fast-eluting peak exhibited an elution volume (Ve) of 13.2 ± 0.2 mL (red triangle in
Figure 9-C), which corresponds to an estimated molecular mass of ∼38.3 ± 2 kDa (dimer),
whereas protein from the slow-eluting peak exhibited a Ve of 14.6 ± 0.1 mL (green diamond),
which corresponds to ∼24.3 ± 0.8 kDa. The elution volume of the latter is close to that of H32A-
apo-HasAp (Ve = 14.3 ± 0.1 mL, blue triangle), corresponding to an estimated molecular mass of
∼26.7 ± 0.4 kDa (monomer). Thus based on the elution volume and the estimated molecular
mass, the fast eluting peak is a dimer and it is only formed when the apo-sample is loaded with
heme. On the contrary the slow eluting peak is a monomer. Analysis of heme content revealed a
1:1 heme to protein ratio in both the monomeric and dimeric species. The nature of this dimer
and the coordination of the heme were revealed by X-ray crystallography.
1 32
Figure 11. 15 % SDS-PAGE of HasAp
pure samples; M- protein ladder, 1- slow
eluting band (monomer), 2- fast eluting
band (dimer), and 3-apo-HasAp.

57
Structural Characterization of H32A-holo-HasAp by X-ray crystallography
Crystals of H32A-holo-HasAp were grown from the monomeric fraction of heme
reconstituted sample. Unexpectedly, the crystal structure obtained reveal a noncrystallographic
dimer linked by cofacial interaction of two heme molecules (Figure 12-A). The two heme planes,
defined by their corresponding pyrrole-nitrogen planes, intersect at an angle of 3.6° and are
separated by an average distance of ∼3.4 Å. Moreover, there is roughly 60% overlap in the
tetrapyrrole planes and the two central iron atoms are only 5.51 Å apart. Close inspection of the
heme molecules show that there is no electron density between the two heme planes that could
be attributed to a bridging ligand (Figure 12-C), as would be the case if the dimer was linked by
a μ-oxo ligand. Furthermore, the approximately 60% macrocycle overlap is in contrast to the
nearly complete overlap in a μ-oxo dimer analogue [47]. Another key feature in the two heme
molecules is that the central metal iron in subunits A and B are displaced by 0.21 and 0.17 Å,
respectively with respect to the mean plane defined by the coordinating pyrrole-nitrogen atoms,
toward the coordinating Tyr. This observation is consistent with a 5-coordinate iron, as observed
in catalase [48] and a H93Y mutant of myoglobin [49].

58
**
**
A
C
*
*
R129
Y138
B
Figure 12. (A) Structure of the H32A holo-HasAp dimer. Subunits A is colored light pink and
B is colored slate. Disordered residues in subunit B are located between the asterisks. Heme in
subunit A and B is colored pink and blue, respectively. (B) Proximal site of the heme in subunit
A showing Tyr 75 coordination, and H-bonding interactions involving the propionates and Arg
129 from the same subunit and Tyr 138 from subunit B. Tyr75 loop is colored wheat. (C) 2Fo –
Fc electron density maps of the hemin molecules in the dimer contoured at 1σ represented as a
green surface.

59
Heme coordination at the proximal site is very similar to that of wild type protein where
Tyr 75 coordinates the heme while His 83 side chain is poised to accept a hydrogen bond from
the coordinating ηO of Tyr 75. Similarly, the propionates engage in hydrogen bonding
interactions with Arg 129 and Tyr 138, the only difference being Tyr 138 is from the other
subunit in the dimer (Figure 12-B). Conservation of the propionate-Arg 129 hydrogen bond in
each of the subunits of the dimer may be attributed to in-plane orientation of the heme which
places one of the propionates in close proximity to Arg 129 located in the loop connecting 7 and
2 as seen in the wild type holo-HasAp.
Superimposed crystal structures of H32A-holo-HasAp (subunit A), wild type apo- and
holo-HasAp are shown in Figure 13-A. A striking observation is the fact that His 32 loop in the
crystal structure of heme loaded H32A assumes an open conformation nearly identical to that of
the apo-protein, exposing the distal face of the heme to the aqueous media. This directly suggests
A B
Figure 13. (A) Superimposed crystal structures showing H32 loops of apo wt (magenta), holo wt
(cyan), and holo H32A (red) HasAp. The heme molecules associated with holo wt and holo-H32A are
colored blue and gold, respectively (B) Spherical representation of subunit A and associated heme
(orange). The H32 loop is colored red, and hydrophobic residues Phe 51, Tyr 75, Leu 77, Phe 78, and
His 83 in the heme binding site are colored green.

60
that formation of dimers in holo H32A mutant (Figure 12-A) may be a consequence of the need
to satisfy the hydrophobic demand of exposed hydrophobic surface of the heme, which, in the
aqueous media can only be satisfied by favorable interactions between two heme molecules.
Intriguingly, this phenomenon is not observed in wild type protein in which both of the heme
axial ligands are present. This issue will be revisited in a moment.
Figure 13-B is a spherical representation of subunit A of H32A dimer; as shown,
underneath the heme (orange) is a cluster of hydrophobic residues Phe 51, Tyr 75, Leu 77, Phe
78, and His 83 (green) that interact hydrophobically with the macrocycle. Thus, besides the
stability imparted by propionate interactions with the protein, the heme is stabilized and
anchored in place by this hydrophobic table.
To establish why dimeric H32A-holo-HasAp crystals were obtained from solutions
containing monomeric protein, all the crystal growth screening conditions that yielded crystals
were checked to establish whether there was a common denominator. Certain enough,
ammonium sulfate was present in all solutions. Nonetheless, it was not clear whether ammonium
sulfate induced dimerization prior to, or during protein crystallization. As mentioned earlier, it is
possible to distinguish monomeric and dimeric species of H32A-holo-HasAp in solution with the
aid of UV-vis spectrophotometer. Thus to determine if ammonium sulfate promoted dimer
formation prior to protein crystallization, pure monomeric holo protein was added with constant
stirring to a buffer containing ammonium sulfate at a concentration similar to that in the
crystallization solution (1.26 M) and the changes in absorption spectrum were followed
spectrophotometrically. In a few seconds, the electronic absorption signature of the monomeric
species (red) changed to that corresponding to a dimer (black) (Figure 14). These observations

61
clearly demonstrated that ammonium sulfate in the crystallization solution indeed promoted
dimerization of the protein, prior to its crystallization.
High concentrations of antichaotrophic salts are known to favor hydrophobic interactions [50].
Cutler (1995) observed that Green Fluorescent Protein (GFP) monomers interact at hydrophobic
surfaces when they form dimers in aqueous solutions particularly in the presence of high
concentration of ammonium sulfate (1M) [50]. Thus in a similar manner, high concentration of
ammonium sulfate in the crystallization solution of H32A-holo-HasAp favors dimer formation
by promoting hydrophobic interactions between protein-bound heme molecules in the
monomers. Consistent with the relevance of this salt for H32A dimerization and subsequent
crystallization, additional experiments aimed at finding conditions to crystallize the monomer
using other salts were unsuccessful. However, since to this end it is not possible to
unequivocally tell the position of the His 32 loop from the crystal structure of the dimer, we
opted to introduce a ligand in solution (prior to crystallization) that would bind the heme at the
sixth position eliminatie cofacial interaction of the heme molecules by steric exclusion. Among
Figure 14. UV-Vis spectra of monomeric holo-H32A-HasAp (red) and induced dimer (black).
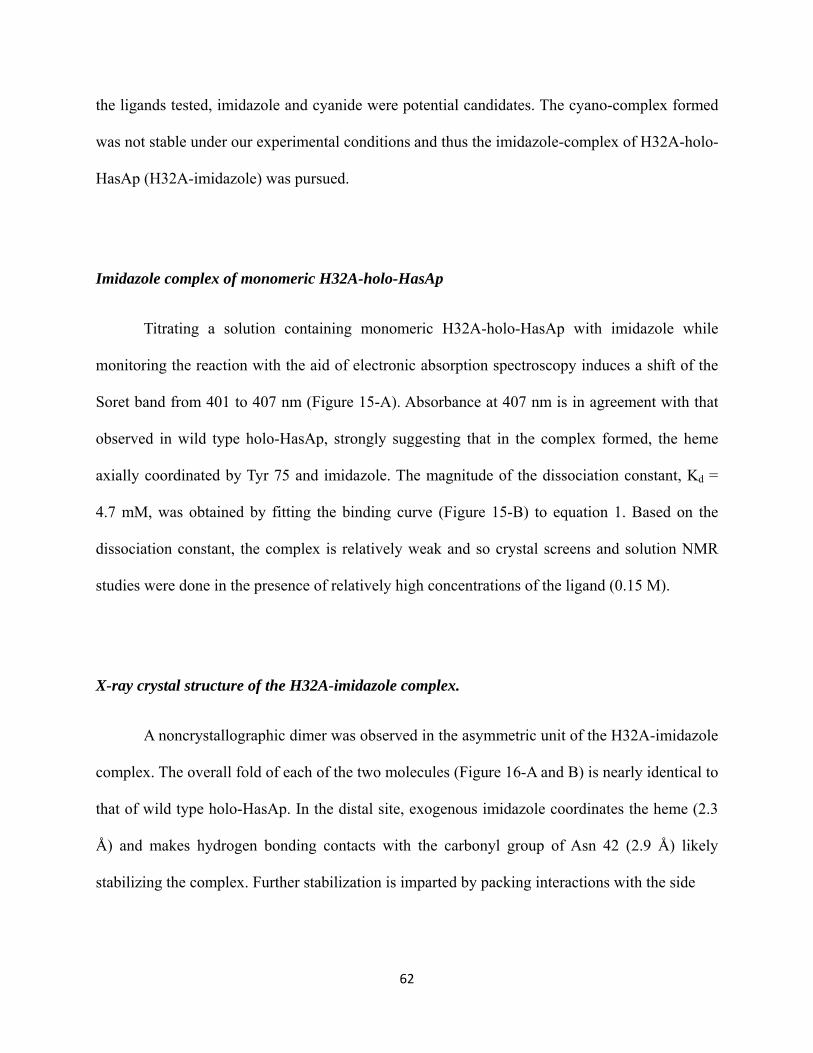
62
the ligands tested, imidazole and cyanide were potential candidates. The cyano-complex formed
was not stable under our experimental conditions and thus the imidazole-complex of H32A-holo-
HasAp (H32A-imidazole) was pursued.
Imidazole complex of monomeric H32A-holo-HasAp
Titrating a solution containing monomeric H32A-holo-HasAp with imidazole while
monitoring the reaction with the aid of electronic absorption spectroscopy induces a shift of the
Soret band from 401 to 407 nm (Figure 15-A). Absorbance at 407 nm is in agreement with that
observed in wild type holo-HasAp, strongly suggesting that in the complex formed, the heme
axially coordinated by Tyr 75 and imidazole. The magnitude of the dissociation constant, Kd =
4.7 mM, was obtained by fitting the binding curve (Figure 15-B) to equation 1. Based on the
dissociation constant, the complex is relatively weak and so crystal screens and solution NMR
studies were done in the presence of relatively high concentrations of the ligand (0.15 M).
X-ray crystal structure of the H32A-imidazole complex.
A noncrystallographic dimer was observed in the asymmetric unit of the H32A-imidazole
complex. The overall fold of each of the two molecules (Figure 16-A and B) is nearly identical to
that of wild type holo-HasAp. In the distal site, exogenous imidazole coordinates the heme (2.3
Å) and makes hydrogen bonding contacts with the carbonyl group of Asn 42 (2.9 Å) likely
stabilizing the complex. Further stabilization is imparted by packing interactions with the side

63
[Imidazole] mM
0 20 40 60 80
Fra
ctio
n bo
und
0.0
0.2
0.4
0.6
0.8
1.0
1.2B
Wavelength (nm)
360 380 400 420 440
Abs
orb
ance
0.0
0.1
0.2
0.3
0.4
0.5
0.6
401
407A
[Imidazole] mM
0 20 40 60 80
Fra
ctio
n bo
und
0.0
0.2
0.4
0.6
0.8
1.0
1.2B
[Imidazole] mM
0 20 40 60 80
Fra
ctio
n bo
und
0.0
0.2
0.4
0.6
0.8
1.0
1.2B
Wavelength (nm)
360 380 400 420 440
Abs
orb
ance
0.0
0.1
0.2
0.3
0.4
0.5
0.6
401
407A
Wavelength (nm)
360 380 400 420 440
Abs
orb
ance
0.0
0.1
0.2
0.3
0.4
0.5
0.6
401
407
401
407A
chains of Val 38 (located in the His32 loop) and Met 141 (located at the C`-end of 2) both of
which keep the imidazole plane in one specific orientation (Figure 16-D). That the coordinated
imidazole is certainly not assuming more than one orientation is corroborated by the well-
defined electron density as shown in the heme and heme-bound imidazole electron density maps
in Figure 16-C. At the proximal site heme coordination is also conserved; Tyr 75 coordinates the
heme-iron (2.2Å) and the distance between N of His 83 and the phenolate oxygen of Tyr 75
(2.6Å) is maintained. Zoomed in view of superimposed structures of the wild type (cyan) and
H32A-imidazole complex (magenta) (Figure 16-E) clearly reveal that overall, the His 32 loop
assumes a “closed” conformation similar to that of wild-type protein. In particular, the
conformation of the hinge residues (Gly 28, and Gly 45), and the topological position of the
residues exhibiting discernible electron densities are nearly identical. In addition, the plane of the
Figure 15. Family of electronic absorption spectra (A) and the binding curve (B) obtained upon
mixing imidazole and H32A holo-HasAp. The complex was formed by adding fresh protein (final
concentration 5 uM) to known concentrations of imidazole buffer (0-100 mM), pH 7.0. Each data point
was recorded after 2 min incubation.

64
A B
*
*
*
*
C D
E
bound imidazole and that of His 32 in wild type are nearly superimposable. Complementary
information in solution was obtained with the aid of NMR spectroscopy.
Figure 16. X-ray crystal structure of H32A-imidazole complex. (A) Molecule A; heme and imidazole are
colored magenta while His32 and Tyr75 loops are colored light pink. (B) Molecule B; heme and imidazole are
colored cyan while the His32 and Tyr75 loops are colored light cyan. Disordered residues are indicated
between the asterisks in both molecules. (C) 2Fo - Fc electron density maps of the heme and heme-bound
imidazole in molecule A (top) and molecule B (bottom) of the H32A-imidazole complex contoured at 1σ. (D)
Surface representation of the His 32 loop in the structure of the H32A-imidazole complex. The imidazole
molecule (magenta) is locked in place by Val 38 and Met 141 side chains, and a hydrogen bond formed with
the carbonyl oxygen of Asn 42. (E) Superposition of molecule A of the H32A-imidazole complex
(magenta) with molecule A of wt holo-HasAp (cyan). Residues in the H32 loop are colored darker.

65
Characterization of monomeric H32A-HasAp by NMR Spectroscopy
Three-dimensional structure and the details regarding the position of His 32 loop that
could not be explicitly obtained from the high-resolution X-ray crystal structures of H32A and
H32A-imidazole complex were studied in solution by NMR. Sequential backbone amide
resonance assignments were done on uniformly isotopic labeled samples using conventional
heteronuclear 2D and 3D NMR experiments and amino acid selective labeled proteins as
employed in backbone resonance assignments in wild type holo-HasAp [13]. This allowed
assignment of 125 (~70 %) and 154 (~80%) nonproline amide cross-peaks for H32A-HasAp and
H32A-imidazole, respectively. Representative HSQC spectra obtained with samples of H32A-
HasAp and H32A-imidazole are shown in Figure 17; respective assignments are summarized in
Table 2 and Table 3 in the Appendix. Since the assignments of wild type holo-HasAp had already
been obtained, assignments of most of the residues in the mutant were greatly simplified. A
comparison of resonances assigned in H32A- HasAp, H32A-imidazole and wild type holo-
HasAp mapped on the structures is shown in Figure 18. Clearly, most of the residues in the Tyr
75 loop that are located near hemin in all the three proteins could not be assigned. As expected,
they are influenced by hemin-iron paramagnetism which enhances relaxation and causes severe
line broadening and signal degradation [51]. Assignments in other sections of the protein in the
two proteins differ appreciably. In H32A-HasAp (Figure 18-A) resonances of a few residues
constituting the His 32 loop, all residues in 2 (Val 136-Met 141) and the loop connecting 2 to
3, the turn connecting 3 and 4, and the C′-end of 1 could not be obtained.

66
A BAA B
In H32A-imidazole most of the aforementioned residues are assigned, however a stretch of
residues (Arg 33- Asn 42) in the His 32 loop are not assigned (Figure 18-B). This differential
accessibility to resonance assignments are addressed below. Illustrations are made using HSQC
spectra collected from amino acid selective labeled samples (15N-Gly and 15N-Val).
Figure 17. 1H-15N-HSQC-TROSY spectra of H32A HasAp (A) and H32A-imidazole (B).
Spectra were taken at 32 oC using a Varian Inova spectrometer operating at 600 MHz 1H
frequency. Acquisition parameters are as follows: 1,710 (1H) x 400 (15N) complex points; 8.9
kHz (1H) and 2.3 kHz (15N) spectral widths; 8 scans per increment; d1=1s. Spectra were
processed using NMRPipe software as follows: data in the 15N dimension were linear predicted
to twice the number of points and zero-filled in each dimension to yield a data matrix of 4k x
4k points. Spectra were referenced to internal DSS using the methyl peak at 0 ppm for the 1H
dimension and indirectly using the ratio of gyromagnetic ratios for the 15N dimension.

67
A B C
(i) Conformational exchange affects the hinge regions of H32A-HasAp and H32A-Imidazole
differently.
As mentioned earlier, the large conformational change of the His32 loop that occurs
when wild type apo-HasAp binds heme is centered about hinge residues Gly 28 (∼157° about its
φ angle) and Gly 45 (∼36° about its ψ angle). Remarkably, dynamic processes affect these hinge
regions in H32A-HasAp and in H32A-imidazole differently: Near the Gly 28 hinge, cross-peaks
were not detected in the HSQC spectrum of H32A-HasAp for Tyr 26 and Phe 27. In contrast, the
corresponding cross-peaks in the spectrum of H32A-imidazole were readily identified because
they exhibit cross-peaks with intensities similar to those for corresponding cross-peaks in the
spectrum of wild type HasAp. At the other end of the loop (near Gly 45 hinge), neither Asn 42
nor Thr 43 had detectable cross-peaks in the HSQC spectrum of H32A-HasAp or in the spectrum
of H32A-imidazole. However, Gly 44 gave rise to a cross-peak in the spectrum of uniformly
labeled H32A-HasAp but was undetectable in the spectrum of uniformly labeled H32A-
Figure 18. Resonance assignments available for H32A-HasAp (A), H32A-imidazole (B), and wt
HasAp (C) are mapped in gray on the structure of wt holo-HasAp; residues for which resonances
could not be obtained are shown in green, prolines are in blue, and the hemin is in red.
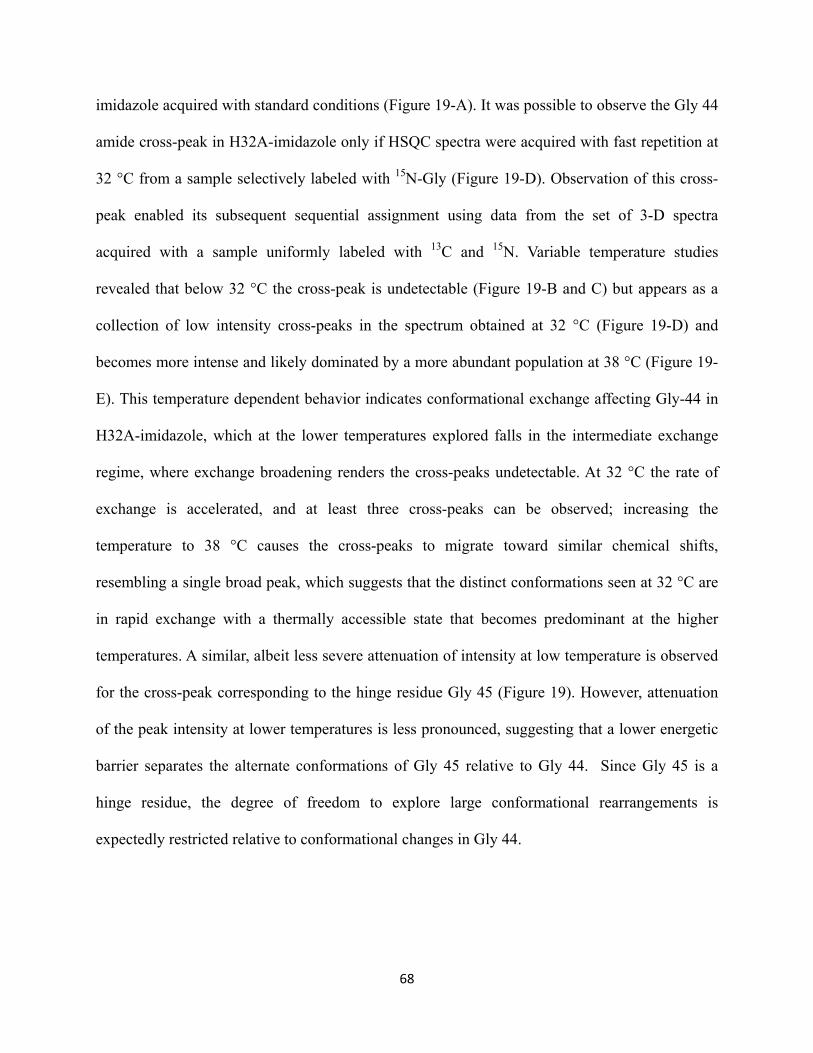
68
imidazole acquired with standard conditions (Figure 19-A). It was possible to observe the Gly 44
amide cross-peak in H32A-imidazole only if HSQC spectra were acquired with fast repetition at
32 °C from a sample selectively labeled with 15N-Gly (Figure 19-D). Observation of this cross-
peak enabled its subsequent sequential assignment using data from the set of 3-D spectra
acquired with a sample uniformly labeled with 13C and 15N. Variable temperature studies
revealed that below 32 °C the cross-peak is undetectable (Figure 19-B and C) but appears as a
collection of low intensity cross-peaks in the spectrum obtained at 32 °C (Figure 19-D) and
becomes more intense and likely dominated by a more abundant population at 38 °C (Figure 19-
E). This temperature dependent behavior indicates conformational exchange affecting Gly-44 in
H32A-imidazole, which at the lower temperatures explored falls in the intermediate exchange
regime, where exchange broadening renders the cross-peaks undetectable. At 32 °C the rate of
exchange is accelerated, and at least three cross-peaks can be observed; increasing the
temperature to 38 °C causes the cross-peaks to migrate toward similar chemical shifts,
resembling a single broad peak, which suggests that the distinct conformations seen at 32 °C are
in rapid exchange with a thermally accessible state that becomes predominant at the higher
temperatures. A similar, albeit less severe attenuation of intensity at low temperature is observed
for the cross-peak corresponding to the hinge residue Gly 45 (Figure 19). However, attenuation
of the peak intensity at lower temperatures is less pronounced, suggesting that a lower energetic
barrier separates the alternate conformations of Gly 45 relative to Gly 44. Since Gly 45 is a
hinge residue, the degree of freedom to explore large conformational rearrangements is
expectedly restricted relative to conformational changes in Gly 44.
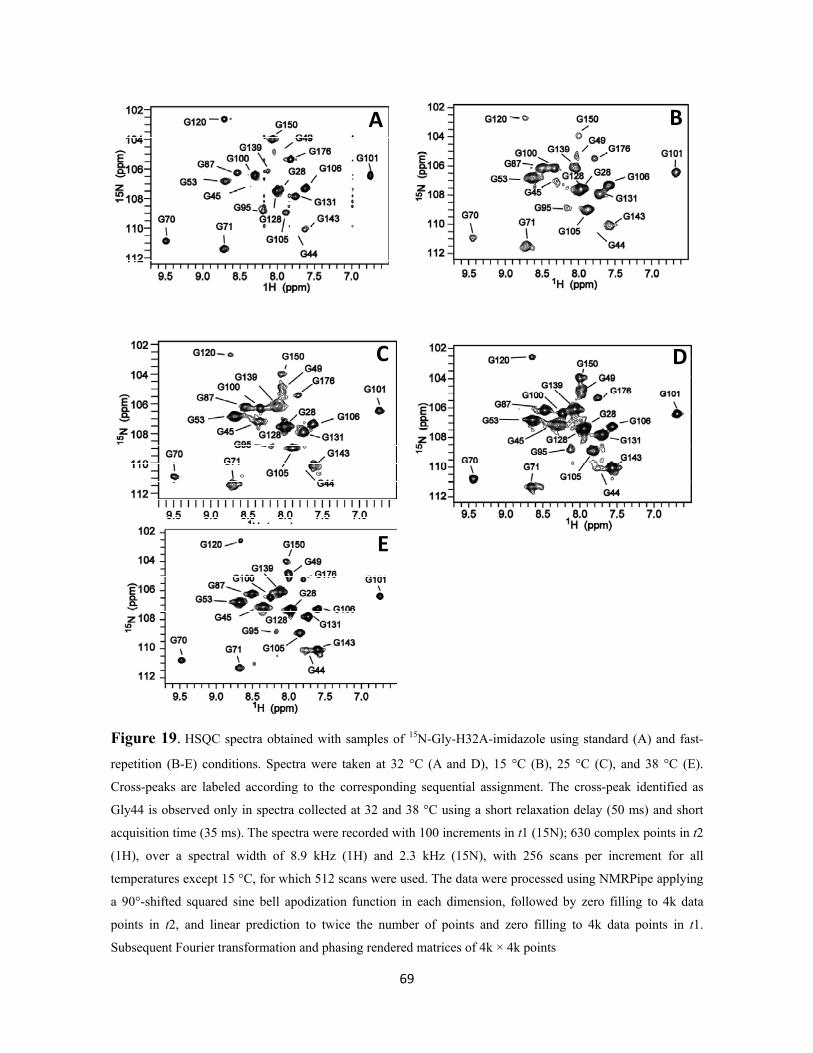
69
A B
C D
E
Figure 19. HSQC spectra obtained with samples of 15N-Gly-H32A-imidazole using standard (A) and fast-
repetition (B-E) conditions. Spectra were taken at 32 °C (A and D), 15 °C (B), 25 °C (C), and 38 °C (E).
Cross-peaks are labeled according to the corresponding sequential assignment. The cross-peak identified as
Gly44 is observed only in spectra collected at 32 and 38 °C using a short relaxation delay (50 ms) and short
acquisition time (35 ms). The spectra were recorded with 100 increments in t1 (15N); 630 complex points in t2
(1H), over a spectral width of 8.9 kHz (1H) and 2.3 kHz (15N), with 256 scans per increment for all
temperatures except 15 °C, for which 512 scans were used. The data were processed using NMRPipe applying
a 90°-shifted squared sine bell apodization function in each dimension, followed by zero filling to 4k data
points in t2, and linear prediction to twice the number of points and zero filling to 4k data points in t1.
Subsequent Fourier transformation and phasing rendered matrices of 4k × 4k points

70
(ii) Conformational exchange affects the internal regions of the His32 loop differently in H32A-
imidazole and in H32A-HasAp
The difference in effects of dynamic processes in the internal regions of His 32 loop in
H32A-HasAp and in H32A-imidazole is depicted in Figure 18; as shown, most residues in the
His32 loop of H32A-imidazole could not be assigned, whereas the similar stretch of sequence in
H32A-HasAp is nearly fully assigned. This implies that paramagnetic effect of hemin-iron
affects resonances from residues in the His32 loop in H32A-imidazole complex more than
equivalent resonances in H32A- HasAp. Key observations were made from HSQC spectra
acquired with standard and fast repetition rates from samples of H32A-HasAp and H32A-
imidazole labeled selectively with 15N-Val. In total there are 9 Val residues in the molecule three
of which are located in the His 32 loop (Val 30, Val 37, and Val 38). Val 37 and Val 38 are
located in the middle of the loop and in wild type holo HasAp they are ~8.1 and ~9.3 Å away
from hemin-iron, respectively. In H32A-HasAp all the valines were sequentially assigned from
conventional 2D and 3D NMR data and cross-peaks corresponding to Val 37 and Val 38, are
readily observed in HSQC spectra acquired with standard or with fast repetition conditions,
Figure 20-A and 20-B, respectively. In comparison, only one of two cross-peaks corresponding
to Val 37 and Val 38 in H32A-imidazole could be observed in the HSQC spectrum obtained with
standard conditions from a sample of 15N-Val H32A-imidazole (Figure 20-C). However, when
the HSQC spectrum is acquired with fast repetition conditions, two peaks are clearly observed in
spectra obtained from a sample of 15N-Val H32A-imidazole (Figure 20-D). These two cross-
peaks could not be sequentially assigned because correlations to neighboring carbon nuclei could
not be found in 3D spectra. Nonetheless, since they appear in the HSQC spectrum of the 15N-Val

71
sample, and all the other remaining valines had already been assigned, these peaks could be
attributed to Val 37 or Val 38.
Figure 20. HSQC spectra obtained with samples of 15N-Val-H32A-HasAp (A and B) and 15N-Val-H32A-
imidazole (C and D). Spectra in (A) and(C) were acquired with standard acquisition parameters, whereas spectra
in (B) and (D) were collected with fast-repetition conditions. Dashed lines in spectra (C) and (D) highlight one
of the cross-peaks attributed to Val 37 or Val 38, which is clearly visible only in the HSQC spectrum (and
corresponding 1D trace) acquired with fast repetition conditions. Cross-peaks are labeled according to their
sequential assignment. Cross-peaks originating from backbone amides of Ala residues are present because of
isotopic scrambling, and are clearly identified by comparison with the HSQC spectrum obtained with uniformly
labeled protein.

72
The fact that conformational exchange differentially affects identical portions of the His 32 loop
in the two proteins is also demonstrated by differences in the intensity exhibited by the cross-
peaks corresponding to Val 37 and Val 38. Although similar protein concentration was used to
collect the HSQC spectra of both proteins, Val 37 and Val 38 peaks in H32A-imidazole spectrum
are of low intensity relative to their counterparts in the spectrum of H32A HasAp. This strongly
suggests that these residues are in close proximity and likely interact with the distal face of
hemin, in good agreement with the packing interaction between Val 38 and the imidazole ring in
the crystal structure of H32A-imidazole complex (Figure 16-C). Hence, despite the missing
electron densities of some of the residues flanking the His32 loop in the crystal structure of
H32A-imidazole, the loop is likely in the closed conformation as inferred from analysis of
solution NMR studies.
Targeted Molecular Dynamics Simulations (TMD)
Molecular dynamics is a computational method that calculates the time dependent
behavior of a molecular system. MD simulations have been used to provide detailed information
on the fluctuations and conformational changes of proteins [52]. In this study, targeted
molecular dynamics simulations were used to visualize and trace a plausible path for closing of
the His32 loop in HasAp utilizing the available structures of apo and holo wild type protein.
Simulation runs are typically short: typically t ~ 103-106 MD steps, corresponding to a few
nanoseconds of real time [51]. In this study, 25 independent TMD simulations were run starting
with the open loop (apo-structure) and ending with the closed loop (holo-structure)
conformation. Each run lasted 1.2 ns. For each of the 25 independent simulations, 50 structures

73
(“images”) were generated at equal intervals of rmsd between the apo- and holo-structures (i.e. a
total of 1250 structures). The images obtained at each rmsd for all the 25 independent
simulations were then clustered and analyzed. Very similar structural features were observed
among the clustered images, suggesting that the path that His32 loop takes, while relocating from
the apo-conformation to the holo-conformation, may be well-defined. A summary of this
plausible path showing the most prominent features of loop closing is presented in six-frames
(Figure 21 A-F). In each frame, an overlay of the starting (gray) and intermediate (cyan)
structures are shown in cartoon representation. Residues that are involved in important
interactions are highlighted in stick or CPK representation, and when appropriate the same
residues in the starting structure are also shown in stick representation for comparison. The
His32 loop is highlighted in magenta. At the start of the simulation, the peptide backbone root
mean square deviation (rmsd) between apo- and holo-HasAp is 5.73 Å. Frame 21-A (rmsd 5.42
Å); when heme loads onto the Tyr 75 loop, helix 2 tilts relocating its C`-end from the original
position. As a result, the succeeding short loop (flanking 2 and 3) moves outward breaking the
hydrogen bonds between Gly 143 (short loop) and Ser 24 (1). On the side of the -sheet wall,
2, near the hinge residue Gly 45, moves away from hemin likely to avoid steric clashes between
the side chain of Phe 46 and macrocyle. Frame 21-B (rmsd 4.87 Å); further movements of 2
and the short loop connecting it to 3 in the directions described in frame A above creates space
which allows the side chain of Phe 27 (1) to move downward and interact adeptly with the side
chains of Leu 58 (3) and Met 141 (2). These attractive hydrophobic interactions and the
outward movement of the loop connecting 2 and 3 likely provide the force that causes helix
1 to bend. This effect is transmitted to the turn connecting 3 and 4 (yellow) via hydrogen
bonding interactions between the carbonyl groups of Tyr 26 and Phe 27 (1) and the
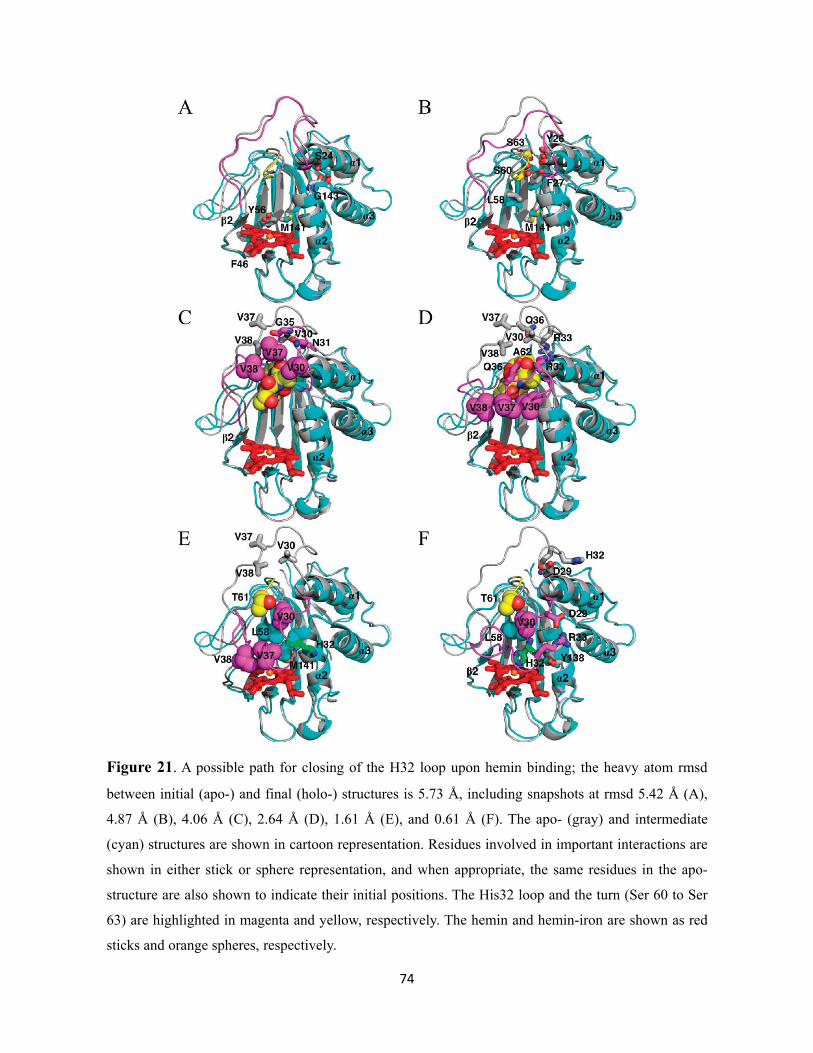
74
Figure 21. A possible path for closing of the H32 loop upon hemin binding; the heavy atom rmsd
between initial (apo-) and final (holo-) structures is 5.73 Å, including snapshots at rmsd 5.42 Å (A),
4.87 Å (B), 4.06 Å (C), 2.64 Å (D), 1.61 Å (E), and 0.61 Å (F). The apo- (gray) and intermediate
(cyan) structures are shown in cartoon representation. Residues involved in important interactions are
shown in either stick or sphere representation, and when appropriate, the same residues in the apo-
structure are also shown to indicate their initial positions. The His32 loop and the turn (Ser 60 to Ser
63) are highlighted in magenta and yellow, respectively. The hemin and hemin-iron are shown as red
sticks and orange spheres, respectively.

75
hydroxyl groups of Ser 60 and Ser 63 in the turn. Frame 21-C (rmsd 4.06 Å); stooping of 1
pulls down the portion of the His32 loop near the Gly 28 hinge but leaves the stretch toward the
Gly 45 hinge intact. In turn Val 30, Val 37, and Val 38, which in the apo structure interact
hydrophobically with one another, relocate near the yellow turn and instead interact with the
backbone of the turn (Ser 60 to Ser 63). These rearrangements bring Asn 31 and Gly 35 within
hydrogen bonding distance. Presumably, these interactions maintain the loop fairly organized as
it slides over the yellow turn. Frame 20-D (rmsd 2.64) shows that as the His32 loop slides over
the yellow turn, Val 30, Val 37, and Val 38 re-establish hydrophobic interactions and
concurrently Gln 36 and Arg 33 take their turn to interact with the yellow turn. As shown also, at
this point 1 and 2 (and the loop connecting it to 3) have relaxed back nearly to their initial
positions. This partial relaxation is necessary to provide space for Gly 28 carbonyl which to this
end has adopted its closed loop conformation. Frame 21-E (rmsd 1.61 Å) shows that as Val 37
and Val 38 approach the heme, the hydrogen bond between Arg 33 and Ala 62 breaks. It is also
clear that the side chain of the axial ligand His 32 (green) is still pointing away from the heme.
Analysis of motions between frame 21-E and frame 21-F (rmsd 0.61 Å) suggests that Arg 33
explores different conformations until its guanidinium group forms a salt bridge with the
carboxyl group of Asp 29 presumably forcing the side chain of His 32 to flip toward the heme
and subsequently coordinate hemin-iron as seen in frame 21-F.

76
Discussion
Structure of apo-HasAp and conformational changes that occur upon hemin loading
X-ray crystal structure of apo-HasAp is very similar to that of the holo form except for
the His 32 loop which relocates ~ 30 Å away relative to its position in the holo-protein (Figure
4). The original / fold and the position of the Tyr75 loop are conserved implying that the
conformation of these secondary structures is independent of the presence or absence of the
heme. Possibly, networks of hydrophobic and polar interactions between the Tyr 75 loop and
nearby residues are sufficient to constrain their conformations both in the heme-free and heme-
loaded protein. In the only other characterized hemophore HasA, similar observations were made
regarding the overall structure of apo and holo conformers. Dynamics studies revealed that in
apo-HasAs His 32 loop does not oscillate between the open and the closed conformation but
rather adopts a single and well defined conformation [14]. Solution NMR and X-ray crystal
structure of apo-HasAp does not show any evidence of the His 32 loop exploring different
conformations. Thus it is likely that repositioning and stability of this loop in the absence of the
ligand has a functional role in all the hemophores. Characterized proteins that are involved in
binding, transport and release of iron or heme, such as transferrins, hemopexin, FbpA, and HemS
consist of two domains connected by a flexible linker loop that acts as a hinge between the two
domains [53,54]. It was proposed and recently demonstrated for the heme transport
proteobacteria-protein HemS [55] that in these proteins, ligand binding induces the transition
from a flexible “open” form of the two domains to a “closed” form where the two domains
tightly associate. In comparison, HasA is a mono-domain protein and shares no structural

77
homology with other known iron or heme-binding proteins. In addition, in place of domain
movements as seen in other heme-binding proteins, it is the loop harboring one of the heme-iron
axial ligands (His 32) that undergoes a large conformational rearrangement. It is proposed that
heme binding to HasA involve a two-step mechanism where initially, the heme interacts with Tyr
75 loop and its flanking regions, followed by a large shift of the His 32 loop to close the binding
pocket [14]. Additional observations that have been interpreted as providing support for this
proposition arise from; (i) studies in HasAs-HasR complex which show that the His 32 ligand is
not coordinated and that the His 32 loop is disordered [15] and, (ii) studies in wild type HasAs
which showed that when the holo protein is reduced with dithionite in the presence of CO, His
32 rather than Tyr 75 heme ligand is displaced by CO [16]. Although these findings suggest
lability of His 32 ligand relative to Tyr 75, conclusive evidence demonstrating that the heme is
loaded first onto Tyr 75 followed by relocation of His 32 loop is lacking. In this work, kinetic,
structural, and spectroscopic studies were conducted to provide evidence of possible
intermediates formed in the process of hemin loading in HasAp. Thus HasAp mutant in which
the nonconserved His 32 heme iron ligand is replaced by a noncoordinative residue Ala (H32A)
was constructed, purified in the apo form and used in the heme loading experiments.
Characterization of H32A-HasAp mutant by UV-vis, EPR, and RR Spectroscopy.
The apo form of the H32A mutant was determined to be monomeric in solution but a
mixture of monomers and dimers after reconstitution with heme. Gel filtration chromatography
revealed that both the monomeric and the dimeric species are not in dynamic equilibrium; that it,
once formed there is no evidence of monomers associating or dimers dissociating. Furthermore,

78
although the heme-iron in both species is in the high-spin state, their electronic absorption
spectra are quite distinct. These observations are helpful in a sense that at any given time, the
species in solution can easily be identified from its electronic absorption spectrum. Resonance
Raman characterization also support a high-spin ferric heme configuration but the species in the
monomer and the dimer are predominantly pentacoordinate (5c) and hexacoordinate (6c),
respectively. The very intense g ≈ 6 signature exhibited by both species in EPR spectra is
consistent with S=5/2 high spin ferric heme configuration with coordination states in agreement
with that observed in RR.
Kinetic and spectroscopic studies reveal a two-step mechanism of hemin-loading by HasAp
Wild type and H32A-holo-HasAp have distinct spectroscopic signatures (Figure 22-A).
However, heme uptake is very rapid that any intermediate species could not be detected by UV-
vis spectrophotometer and requiried monitoring by rapid spectroscopic techniques. Stopped-
Flow Spectroscopy (SFS) experiments were therefore conducted in a collaborating laboratory,
supplied with purified apo samples of HasAp. SFS results reveal that heme binding to wild type
apo-HasAp proceeds in two distinct phases via formation of an intermediate species that exhibit
electronic absorption signature typical of a 5c-hs species; by contrast H32A-apo-HasAp binds
hemin in a single phase [56]. The initial phase, identical for both wild type and H32A-HasAp
(accompanied by growth of a peak at 618-619 nm) occurs within 20 ms (Figure 22-B and C).
Over time, the spectral signature of H32A-HasAp remains unchanged while that of the
intermediate species observed in wild type continues to evolve (a new peak appears at 570 nm)
until the spectrum characteristic of holo-HasAp is attained in approximately 1 s (Figure 22-B) .

79
Since the spectral signatures of the two proteins are very similar in the fast phase, it was
suggested that hemin-iron coordinates Tyr 75 as the initial step. The second (slow) phase
observed only in wild type HasAp is unambiguously attributed to closing of the His32 loop and
coordination of the heme-iron since this phase is only observed in wild type protein in which His
32 distal ligand is present. The spectral features of the final hemin loaded species are in
agreement with those observed by conventional UV-vis clearly spectroscopy demonstrating that,
as hypothesized, heme loads onto the protein in two phases, the initial step being loading of the
heme onto the Tyr 75 loop followed by the large conformational change of the His 32 loop to
close the binding site. It is therefore likely that the His 32 loop adopts an open conformation in
the apo protein by necessity to provide an accessible binding site for the heme to “latch” onto;
once the heme is bound it relocates to shield the hydrophobic surface from the aqueous media.
Similar conformational changes involving functional loops have also been observed in diverse
enzymes including β1, 4-galactosyltransferase-I (4Gal-T1), enolase, lipase and HIV protease
[57]. In the case of HIV protease, an intrinsically flexible flap region acts as a gate for ligand
entry and exit [58]; in fungal lipase, the movement of a helical loop (~ 8 Å) opens the solvent
[59] while in yeast enolase, one of three functional loops approach the active site located nearly
8 Å away bringing functional residues into position for catalysis [60,61]. The largest
conformational change reported is that of a 21 amino acid residue long loop in 4Gal-T1 which
undergoes approximately 20 Å rearrangement upon binding to UDP-galactose (UDP-gal) and a-
lactalbumin [62,63]. The loop relocation creates binding sites for the oligosaccharide and -
lactalbumin. Thus, it can be concluded that regardless of the protein function, sequence or
overall tertiary structure, loop movements serve to allow binding or release of substrates or
ligands. This however does not exclude other possibilities.
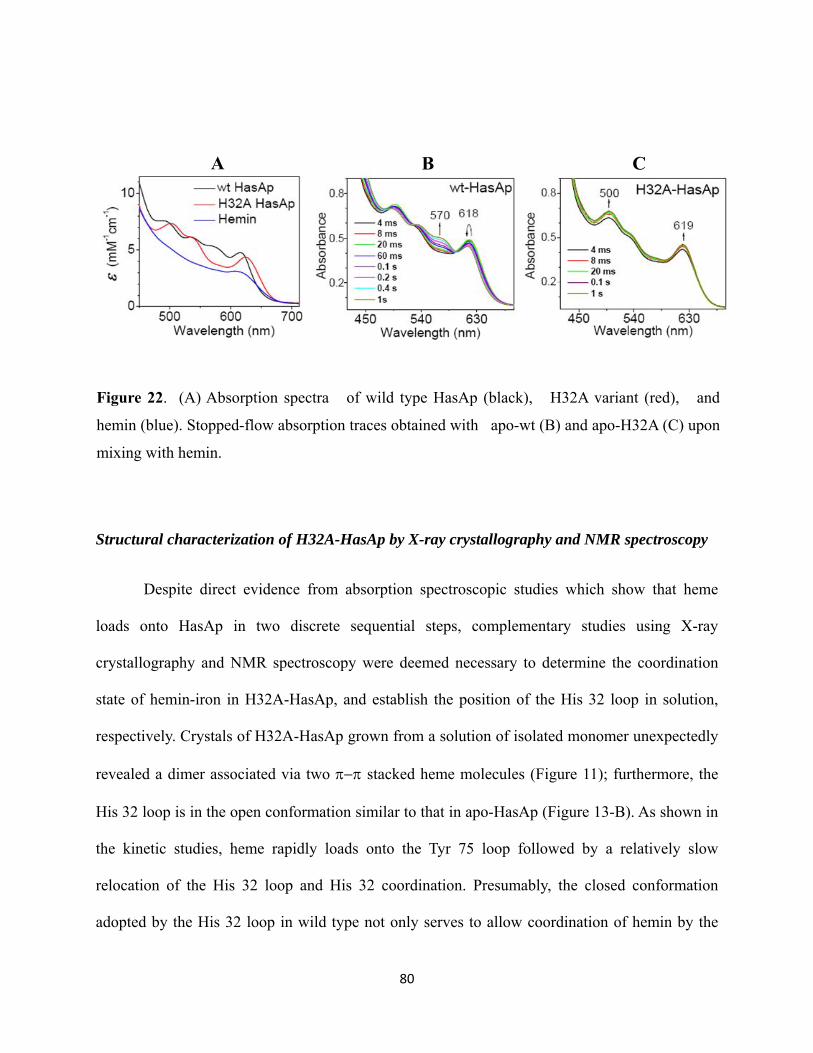
80
A CB
enzyme`s hydrophobic active site which is otherwise effectively shielded from the aqueous
Structural characterization of H32A-HasAp by X-ray crystallography and NMR spectroscopy
Despite direct evidence from absorption spectroscopic studies which show that heme
loads onto HasAp in two discrete sequential steps, complementary studies using X-ray
crystallography and NMR spectroscopy were deemed necessary to determine the coordination
state of hemin-iron in H32A-HasAp, and establish the position of the His 32 loop in solution,
respectively. Crystals of H32A-HasAp grown from a solution of isolated monomer unexpectedly
revealed a dimer associated via two stacked heme molecules (Figure 11); furthermore, the
His 32 loop is in the open conformation similar to that in apo-HasAp (Figure 13-B). As shown in
the kinetic studies, heme rapidly loads onto the Tyr 75 loop followed by a relatively slow
relocation of the His 32 loop and His 32 coordination. Presumably, the closed conformation
adopted by the His 32 loop in wild type not only serves to allow coordination of hemin by the
Figure 22. (A) Absorption spectra of wild type HasAp (black), H32A variant (red), and
hemin (blue). Stopped-flow absorption traces obtained with apo-wt (B) and apo-H32A (C) upon
mixing with hemin.

81
distal ligand but also shields the active site from the aqueous solvent. In this respect, it is likely
that in the absence of the distal site coordinating residue, either the His 32 loop movement is
slower compared to wild type or actually assumes an open conformation as revealed in the
crystal structure of dimeric H32A. In either case, the propensity of the protein to dimarize via
dihemin stacking is increased. The same argument may apply for the formation of dimeric
species observed during heme reconstitution in the mutant. Similar - stacking of hemin
molecules has been reported in the nitrate scavenger cytochrome c NapB, from Haemophilus
influenza [64], the heme transport protein chaN, in Campylobacter jejuni [65] and more recently
in the periplasmic heme-binding protein HmuT, from Yersinia pestis [66]. Since His 32 is not
conserved among HasA hemophores, it is likely that dimerization may be physiologically
relevant in other bacterial species.
To this end, the proximal ligand to heme-iron in the mutant is overtly discernible;
however, the conformation of the His 32 loop could be unequivocally ascertained based on the
nature of the H32A dimer. As pointed out earlier, crystals were obtained only from crystallization
conditions containing high concentration of ammonium sulfate. Extensive attempts to crystalize
the mutant in the absence of ammonium salt were unsuccessful. In order to determine the
topological position of the His 32 loop therefore, the imidazole complex was crystallized. Its
crystal structure reveals that the His 32 loop is in close proximity to the distal face of the heme
since discernible parts of the loop assume similar position as that of wild type holo-HasAp. It can
be deduced from this observation that (i) besides preventing diheme pi-pi stacking by steric
exclusion, bound imidazole imparts stability to the His32 loop albeit to a lesser extent through its
interactions with residues located in the same loop (Figure 16-C); (ii) in solution, the
conformation of the distal ligand bearing loop, once the heme loads onto the protein is

82
independent of the presence or absence of heme-iron distal ligand. Solution NMR studies
provide further convincing evidence that the His32 loop in the imidazole complex is in close
proximity to hemin. First, the extent of loop resonance assignments in the presence and absence
of imidazole differ significantly. Whereas most of the loop resonances in the imidazole complex
spectrum are broadened beyond detection, corresponding resonances can be detected and
sequentially assigned in the spectrum of H32A as was the case in the spectrum of wild type
protein [13]. Secondly, the protein bound imidazole alters the dynamic properties of residues in
the His 32 loop, notably those of Val 37 and Val 38. These observations indicate that in solution
the His 32 loop is close to the distal face of the heme and likely interacts with nearby residues
altering the time scale of the motions affecting the loop. Such a close proximity to the heme and
the implied interactions between hemin and the loop residues is also observed in the crystal
structure of the imidazole complex where the side chain of Val 38 packs against the imidazole
ring (Figure 16-C).
Relocation of His32 loop proceed via a well-defined path
The proximal ligand partners Tyr 75 and His 83 and a network of hydrophobic residues in
the Tyr 75 provide packing interactions that stabilize the macrocylcle irrespective of the presence
or absence of the distal heme iron ligand. It has been proposed [14] and implied by the
preceding discussion that heme loading onto the Tyr 75 loop triggers conformational
rearrangement of the loop harboring the distal heme-iron ligand. As observed in sequential
assignment coverage in H32A, imidazole complex and wild type (Figure 16-A), resonances of
certain portions of the protein (C′- terminal of 1 prior to the hinge residue Gly 28, the entirety

83
of 2, the short loop connecting 2 to 3, 2 at the end of Gly 45 hinge, and the turn connecting
3 and 4) were difficult to assign due to peak broadening caused by dynamic processes
affecting these sections of the structure. The same regions were independently implicated by
targeted molecular dynamics simulations as undergoing motions important to the closing of the
His 32 bearing loop in the wild type protein (Figure 21). Taken together, these observations
suggest that His 32 loop transitions from the “open” to the “closed” conformation via a well-
defined path. Assenting information provided by NMR and TMD simulations regarding
dynamic properties in common sections of the structure can be utilized in future investigations
aimed at elucidating the mechanism of His 32 loop closing.

84
Appendices
Appendix I: Protein crystallization conditions-Wizard II Random Sparse Matrix
Kit# crystallant buffer (0.1 M) salt (0.2 M)
1 10% (w/v) PEG-3000 acetate pH 4.5 Zn(OAc)2
2 35% (v/v) 2-methyl-2,4-pentanediol MES pH 6.0 Li2SO4
3 20% (w/v) PEG-8000 Tris pH 8.5 MgCl2
4 2.0 M (NH4)2SO4 cacodylate pH 6.5 NaCl
5 20% (v/v) 1,4-butanediol HEPES pH 7.5 NaCl
6 10% (v/v) 2-propanol phosphate-citrate pH 4.2 Li2SO4
7 30% (w/v) PEG-3000 Tris pH 7.0 NaCl
8 10% (w/v) PEG-8000 Na/K phosphate pH 6.2 NaCl
9 2.0 M (NH4)2SO4 phosphate-citrate pH 4.2 none
10 1.0 M (NH4)2HPO4 Tris pH 8.5 none
11 10% (v/v) 2-propanol cacodylate pH 6.5 Zn(OAc)2
12 30% (v/v) PEG-400 cacodylate pH 6.5 Li2SO4
13 15% (v/v) ethanol citrate pH 5.5 Li2SO4
14 20% (w/v) PEG-1000 Na/K phosphate pH 6.2 NaCl
15 1.26 M (NH4)2SO4 HEPES pH 7.5 none
16 1.0 M sodium citrate CHES pH 9.5 none
17 2.5 M NaCl Tris pH 7.0 MgCl2
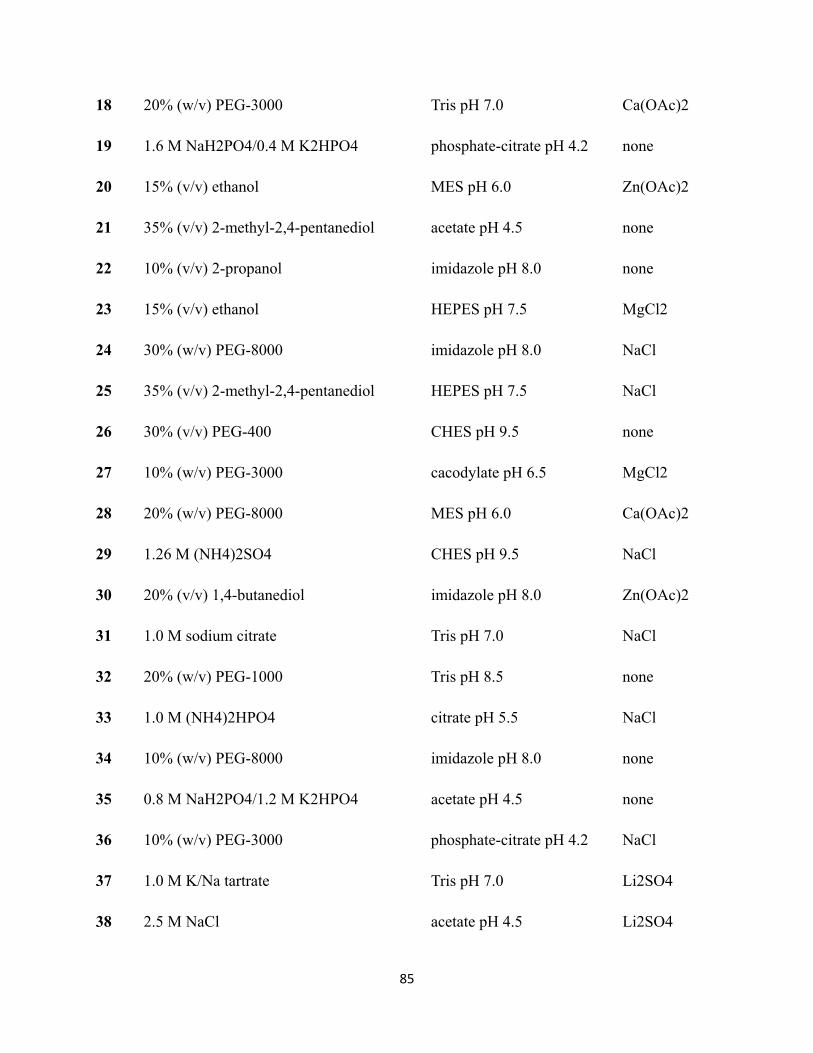
85
18 20% (w/v) PEG-3000 Tris pH 7.0 Ca(OAc)2
19 1.6 M NaH2PO4/0.4 M K2HPO4 phosphate-citrate pH 4.2 none
20 15% (v/v) ethanol MES pH 6.0 Zn(OAc)2
21 35% (v/v) 2-methyl-2,4-pentanediol acetate pH 4.5 none
22 10% (v/v) 2-propanol imidazole pH 8.0 none
23 15% (v/v) ethanol HEPES pH 7.5 MgCl2
24 30% (w/v) PEG-8000 imidazole pH 8.0 NaCl
25 35% (v/v) 2-methyl-2,4-pentanediol HEPES pH 7.5 NaCl
26 30% (v/v) PEG-400 CHES pH 9.5 none
27 10% (w/v) PEG-3000 cacodylate pH 6.5 MgCl2
28 20% (w/v) PEG-8000 MES pH 6.0 Ca(OAc)2
29 1.26 M (NH4)2SO4 CHES pH 9.5 NaCl
30 20% (v/v) 1,4-butanediol imidazole pH 8.0 Zn(OAc)2
31 1.0 M sodium citrate Tris pH 7.0 NaCl
32 20% (w/v) PEG-1000 Tris pH 8.5 none
33 1.0 M (NH4)2HPO4 citrate pH 5.5 NaCl
34 10% (w/v) PEG-8000 imidazole pH 8.0 none
35 0.8 M NaH2PO4/1.2 M K2HPO4 acetate pH 4.5 none
36 10% (w/v) PEG-3000 phosphate-citrate pH 4.2 NaCl
37 1.0 M K/Na tartrate Tris pH 7.0 Li2SO4
38 2.5 M NaCl acetate pH 4.5 Li2SO4

86
39 20% (w/v) PEG-8000 CAPS pH 10.5 NaCl
40 20% (w/v) PEG-3000 imidazole pH 8.0 Zn(OAc)2
41 2.0 M (NH4)2SO4 Tris pH 7.0 Li2SO4
42 30% (v/v) PEG-400 HEPES pH 7.5 NaCl
43 10% (w/v) PEG-8000 Tris pH 7.0 MgCl2
44 20% (w/v) PEG-1000 cacodylate pH 6.5 MgCl2
45 1.26 M (NH4)2SO4 MES pH 6.0 none
46 1.0 M (NH4)2HPO4 imidazole pH 8.0 NaCl
47 2.5 M NaCl imidazole pH 8.0 Zn(OAc)2
48 1.0 M K/Na tartrate MES pH 6.0 none
All formulations are made with ultrapure ASTM Type I water and sterile-filtered stock solutions.
Store at 4-25 ºC.

87
Appendix II
Table 2. Backbone resonance assignments for H32A HasAp.
Residue 1HN 15NH 13C 13C 13CO
M1 S2 I3 S4 I5 S6 Y7 S8 T9 T10 Y11 S12 G13 W14 T15 V16 A17 D18 Y19 L20 A21 D22 W23 S24 A25 Y26 F27 G28 D29 V30 N31 A32 R33 P34 G35 Q36 V37 V38 D39 G40 S41
8.77 8.92 7.98
8.74 8.80 7.33 8.55 8.44 8.83 8.82 8.18 7.81 8.80 8.90 8.42
7.23 7.40 7.34 7.93 8.06 7.30
8.56 7.92 8.34 8.31 10.58 9.30 8.18
127.30 124.40 120.40
122.98 109.13 120.12 119.85 119.81 122.61 119.40 119.96 122.57 120.34 114.55 131.27
102.32 119.34 127.85 115.53 121.62 115.87
112.23 118.77 117.07 124.95 131.55 112.58 116.97
56.44 60.06 56.38 54.73
57.10 60.10 66.53 55.48 57.45 63.36 58.40 55.29 58.29 63.72 63.63
45.68 54.36 63.71 54.66 54.34 53.34 63.74 45.38 55.04 60.09 61.80
45.01 58.27
65.04 42.62 65.10 41.21
29.21 70.98 30.92 18.63 39.60 38.76 40.89 18.28 44.79 28.44
38.16 18.83
31.83
29.77 32.67 30.59
64.09
174.29 175.08 172.76
174.97 176.23 175.69 178.62 180.24 180.24 176.43 179.23 180.26 177.61 178.10
177.00 172.94 174.82 174.57 175.54
178.17
176.86 174.91 174.88
174.15

88
N42 T43 G44 G45 F46 N47 P48 G49 P50 F51 D52 G53 S54 Q55 Y56 A57 L58 K59 S60 T61 A62 S63 D64 A65 A66 F67 I68 A69 G70 G71 D72 L73 H74 Y75 T76 L77 F78 S79 N80 P81 S82 H83 T84 L85 W86 G87
8.00 8.26
8.12
6.67 8.69 8.96
7.22
8.10 7.22
7.28 9.15
9.27 10.51 9.72 8.88 9.58 8.53
7.70 7.80
8.32
109.91 106.58
109.57
113.61 106.65 114.12
129.16
125.98 111.90
123.52 121.21
115.65 135.70 111.45 111.94 129.28 123.12
120.08 117.56
105.77
60.85 44.68 45.05
44.51
52.00 47.68 58.27
52.97 54.15
61.59 51.87 56.09 53.98 53.35 51.54 55.58 61.78 50.79 43.86 46.56 54.59 54.56
65.67 58.29
55.23 43.20
45.75
38.88 19.93
19.99 64.86 40.20 18.69 25.10 45.40 42.06 21.20
41.63 46.93
69.60 38.15
172.13 178.86
170.87 174.92 171.48 176.89
173.56 182.28
174.73 175.37 171.85 175.05 176.01
173.18 176.39 175.55 173.76 171.65 173.69 176.12
174.58 175.33
172.23 172.21
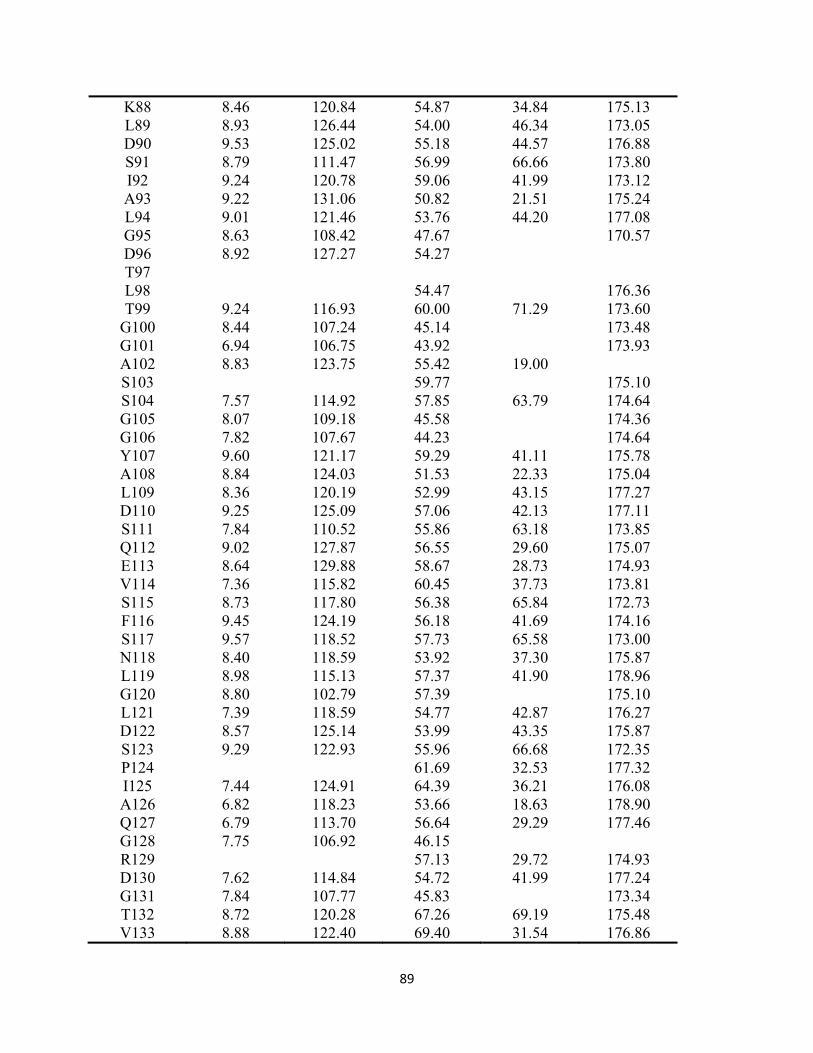
89
K88 L89 D90 S91 I92 A93 L94 G95 D96 T97 L98 T99
G100 G101 A102 S103 S104 G105 G106 Y107 A108 L109 D110 S111 Q112 E113 V114 S115 F116 S117 N118 L119 G120 L121 D122 S123 P124 I125 A126 Q127 G128 R129 D130 G131 T132 V133
8.46 8.93 9.53 8.79 9.24 9.22 9.01 8.63 8.92
9.24 8.44 6.94 8.83
7.57 8.07 7.82 9.60 8.84 8.36 9.25 7.84 9.02 8.64 7.36 8.73 9.45 9.57 8.40 8.98 8.80 7.39 8.57 9.29
7.44 6.82 6.79 7.75
7.62 7.84 8.72 8.88
120.84 126.44 125.02 111.47 120.78 131.06 121.46 108.42 127.27
116.93 107.24 106.75 123.75
114.92 109.18 107.67 121.17 124.03 120.19 125.09 110.52 127.87 129.88 115.82 117.80 124.19 118.52 118.59 115.13 102.79 118.59 125.14 122.93
124.91 118.23 113.70 106.92
114.84 107.77 120.28 122.40
54.87 54.00 55.18 56.99 59.06 50.82 53.76 47.67 54.27
54.47 60.00 45.14 43.92 55.42 59.77 57.85 45.58 44.23 59.29 51.53 52.99 57.06 55.86 56.55 58.67 60.45 56.38 56.18 57.73 53.92 57.37 57.39 54.77 53.99 55.96 61.69 64.39 53.66 56.64 46.15 57.13 54.72 45.83 67.26 69.40
34.84 46.34 44.57 66.66 41.99 21.51 44.20
71.29
19.00
63.79
41.11 22.33 43.15 42.13 63.18 29.60 28.73 37.73 65.84 41.69 65.58 37.30 41.90
42.87 43.35 66.68 32.53 36.21 18.63 29.29
29.72 41.99
69.19 31.54
175.13 173.05 176.88 173.80 173.12 175.24 177.08 170.57
176.36 173.60 173.48 173.93
175.10 174.64 174.36 174.64 175.78 175.04 177.27 177.11 173.85 175.07 174.93 173.81 172.73 174.16 173.00 175.87 178.96 175.10 176.27 175.87 172.35 177.32 176.08 178.90 177.46
174.93 177.24 173.34 175.48 176.86

90
H134 K135 V136 V137 Y138 G139 L140 M141 S142 G143 D144 S145 S146 A147 L148 Q149 G150 Q151 I152 D153 A154 L155 L156 K157 A158 V159 D160 P161 S162 L163 S164 I165 N166 S167 T168 F169 D170 Q171 L172 A173 A174 A175 G176 V177 A178 H179
7.59
8.64 8.90 9.05 8.32 9.21 8.00 7.67 8.58 8.33 7.26 8.17 8.59 7.96 7.34 7.56 7.77 8.95
8.23 8.29 9.01 8.49 7.96 8.42
8.12 8.40 9.01 8.10 7.43 7.88 7.68 6.96 8.71
112.89
118.67 121.56 127.37 120.05 118.56 103.72 119.50 118.63 118.50 117.31 119.58 120.65 118.63 118.33 120.17 118.82 115.04
124.49 109.75 113.52 116.55 119.47 111.36
121.77 120.76 126.49 124.03 117.28 105.44 113.98 119.68 116.32
52.97 57.86 63.31 55.67 58.51 60.80 47.50 57.59 63.98 59.10 55.34 57.98 58.10 58.52 53.70 65.58 52.43 64.53 59.90 53.97 58.29 62.41 53.65 60.24 59.99
59.19 57.50 54.92 54.91 52.35 45.70 62.16 49.07 55.26
40.96 63.97 62.85 17.69 40.87 29.10
27.72 36.33 42.63 18.39 42.76 41.39 32.78 18.51 31.79 44.00 32.13 63.99 43.30 67.54 38.66 39.07 64.24 71.34
28.07 41.39 18.61 17.69 20.19
33.08 24.47 32.29
176.00 175.13 177.45 181.35 177.48 177.65 177.11 178.05 177.43 177.28 181.24 180.24 178.52 178.43 179.48 176.70 174.02 176.92 174.57 174.85 175.27 174.36 174.90 173.37 176.96
180.18 180.27 179.44 182.20 179.02 177.67 174.55 173.70 175.35 172.54

91
A180 T181 P182 A183 A184
8.45 8.56
8.26 7.89
127.62 117.87
126.00 129.03
50.84 59.14 63.16 52.53 53.86
19.59 69.26 32.29 19.64 20.12
178.66 172.50 176.73 176.43 182.42

92
Table 3. Backbone resonance assignments for H32A-Imidazole.
Residue 1HN 15NH 13C 13C 13CO
M1 S2 I3 S4 I5 S6 Y7 S8 T9 T10 Y11 S12 G13 W14 T15 V16 A17 D18 Y19 L20 A21 D22 W23 S24 A25 Y26 F27 G28 D29 V30 N31 A32 R33 P34 G35 Q36 V37 V38 D39 G40 S41 N42 T43
8.59 8.04 8.55 8.80 7.92 8.17 8.44 7.68 7.82 7.60
8.57 8.81 7.33 8.50 8.22 8.89 8.81 8.38 8.01 9.10 8.51 7.45 7.31 8.25 7.94 7.48 7.85 7.89 6.91
122.15 118.68 127.14 124.41 119.97 115.59 118.63 120.10 117.44 115.66
122.90 109.47 120.79 119.99 118.35 121.57 119.24 122.04 120.69 120.63 114.21 124.39 120.21 123.60 107.18 116.56 120.20 119.79 128.51
57.46 61.53 56.51 59.98 56.39 54.88 56.88 65.47 65.74 58.71 63.08 44.96 57.35 60.07 66.59 55.62 57.41 63.51 58.23 55.35 58.08 63.31 63.28 54.62 58.16 61.20 44.75 52.37 62.35 52.81 53.97
61.48
64.26 38.90 65.19 43.00 65.37 41.49 64.09 68.87 69.54 38.28 64.12
29.23 70.88 31.02 19.04 39.93 39.17 41.65 18.58 44.36 28.84 63.46 18.24 38.71 38.90
42.03 31.41 39.24 19.97
170.61 171.98 174.24 175.01 172.69 172.50 177.65 176.29 174.69 175.02
175.06 176.26 175.62 178.51 179.61 180.24 176.63 179.70 180.26 178.54 177.95 176.52 178.84 177.87 176.83 171.46 177.68 175.66 173.57 182.08

93
G44 G45 F46 N47 P48 G49 P50 F51 D52 G53 S54 Q55 Y56 A57 L58 K59 S60 T61 A62 S63 D64 A65 A66 F67 I68 A69 G70 G71 D72 L73 H74 Y75 T76 L77 F78 S79 N80 P81 S82 H83 T84 L85 W86 G87 K88 L89
7.78 8.36 9.60 9.03
8.01
8.93 6.66 8.66 8.90 8.16 9.48 8.23 7.03 7.70 8.08 7.74 8.18 7.43 7.83 7.39 9.13 8.19 8.72 10.45 9.49 8.68 9.56 8.48 8.10
5.95 6.54 7.48
7.95
9.46 8.52 8.46 8.81
110.38 107.09 117.15 116.28
105.30
117.20 113.50 106.79 114.04 117.27 122.75 129.48 120.96 124.23 117.31 115.43 125.05 114.75 114.69 123.54 120.55 113.25 115.07 135.52 110.80 111.30 129.46 123.20 118.48
119.75 118.00 117.73
124.32
125.70 106.17 120.76 126.50
45.75 46.26 57.45 49.26 65.55 46.42 64.70 56.56 52.01 47.65 58.16 54.69 57.61 49.72 54.20 53.50 57.40 62.44 52.37 56.53 54.68 52.86 52.03 55.32 60.71 50.51 43.60 46.55 54.51 54.53 55.15
56.40 57.53 51.33 61.30 57.96
54.26 55.30 43.23 54.78 53.98
44.63 43.19 34.61
34.70 40.70 46.06
64.12 37.44 42.72 24.30 45.53 35.23 63.03 68.82 21.18 66.10 41.43 20.15 25.35 44.36 42.55 21.23
41.76 47.30 31.58
38.52 62.81 39.25 32.60 63.19
46.78 30.53
34.95 46.46
173.94 170.96 176.53 175.31 178.32 171.55 177.75 171.06 174.93 171.35 176.93 175.45 172.29 174.26 172.97 174.71 174.63 174.79 176.23 172.23 175.55 175.47 174.51 172.81 176.30 175.25 173.92 171.67 173.80 176.16 173.96
170.30 173.64 176.28 172.97
174.46 172.26 172.24 175.13 173.01

94
D90 S91 I92 A93 L94 G95 D96 T97 L98 T99
G100 G101 A102 S103 S104 G105 G106 Y107 A108 L109 D110 S111 Q112 E113 V114 S115 F116 S117 N118 L119 G120 L121 D122 S123 P124 I125 A126 Q127 G128 R129 D130 G131 T132 V133 H134 K135
9.51 8.66 9.00 8.98 8.77 8.20 8.89 8.32 8.30 9.26 8.30 6.75 8.70
7.38 7.89 7.64 9.31 8.75 8.26 9.26 7.72 8.77 8.83 7.36 8.58 9.20 9.41 8.25 8.92 8.70 7.39 8.50 9.29
7.58 7.00 6.75 7.98 8.64 7.58 7.75 8.60 8.76 8.57 8.73
125.09 111.75 120.16 130.97 120.37 108.85 123.84 111.14 128.30 120.53 106.35 106.31 123.68
114.71 108.91 107.31 121.48 123.78 119.71 124.70 111.69 126.84 128.25 116.39 117.56 122.80 117.84 117.94 115.34 102.56 118.51 124.61 122.45
124.65 118.71 113.31 107.42 122.75 114.79 107.81 120.00 122.39 120.03 116.30
55.08 56.90 59.52 50.87 53.74 47.33 53.73 64.77 55.19 60.11 45.00 43.59 55.25 59.83 57.77 45.46 44.26 58.69 51.71 52.81 56.69 55.74 56.67 58.42 60.21 56.34 56.16 57.69 53.82 57.24 47.42 54.67 54.00 56.07 61.76 64.61 53.91 56.62 46.30 57.08 54.61 45.68 67.25 69.27 62.65 61.29
45.06 66.82 42.53 21.72 43.61
45.61 65.35 43.42 72.11
19.42 63.31 63.94
41.33 22.49 43.41 41.82 63.19 30.11 30.89 37.92 66.08 42.11 65.70 37.35 42.15
43.22 43.94 66.94 32.79 36.42 19.17 29.60
29.83 42.09
69.16 31.83 31.63 33.29
176.78 173.63 172.97 175.00 176.88 171.07 174.29 172.64 176.43 173.65 173.33 173.88 180.04 174.96 174.53 174.24 174.43 175.81 174.75 177.05 177.48 173.37 175.23 175.26 173.71 172.58 174.21 172.97 175.74 178.80 175.04 176.37 175.91 172.41 177.54 176.41 179.03 177.48 175.20 174.89 177.12 173.30 175.39 176.62 178.49 181.54

95
V136 V137 Y138 G139 L140 M141 S142 G143 D144 S145 S146 A147 L148 Q149 G150 Q151 I152 D153 A154 L155 L156 K157 A158 V159 D160 P161 S162 L163 S164 I165 N166 S167 T168 F169 D170 Q171 L172 A173 A174 A175 G176 V177 A178 H179 A180 T181
9.04 8.30 10.33 8.12 7.17 7.84 7.11 7.61 8.37 8.86 8.72 9.03 8.26 8.97 8.06 7.56 8.42 8.40 7.17 7.93 8.55 7.94 7.25 7.47 7.76
8.88 8.11 8.15 9.02 8.39 7.87 8.38
8.05 8.28 8.85 8.01 7.32 7.81 7.57 6.88 8.61 8.43 8.52
118.54 119.46 122.80 106.09 122.86 115.15 110.53 110.10 119.18 119.43 121.21 126.97 120.17 117.62 103.95 119.31 118.55 118.78 117.19 119.46 120.56 118.55 118.33 119.88 118.74
114.90 124.23 109.71 114.51 116.68 119.26 111.24
121.58 120.43 126.55 123.96 117.06 105.31 113.89 119.54 116.29 127.81 117.64
66.76 67.69 62.49 48.38 58.30 59.26 57.17 46.58 52.58 58.63 63.46 55.61 58.35 60.86 47.49 57.51 64.38 59.16 55.28 57.92 58.02 58.49 53.70 65.45 52.35 64.47 59.87 53.96 58.13 62.20 53.65 60.19 59.98
57.56 59.18 57.39 54.85 54.86 52.28 45.62 62.16 48.98 55.12 50.82 59.06
31.93 32.46 40.75
41.41 33.83 63.70
42.22 64.15 62.45 17.68 41.17 29.29
27.81 36.80 42.95 18.42 43.01 41.56 33.08 18.54 32.04 44.19 32.32 64.11 43.70 67.70 39.25 39.27 64.40 71.52
41.21 28.30 41.51 18.84 17.81 20.59
33.38 24.58 32.01 19.69 69.24
178.41 177.11 179.86 176.45 179.02 175.73 173.82 173.39 175.61 175.11 177.16 181.10 177.83 177.78 177.06 178.12 177.35 177.26 181.18 180.23 178.53 178.38 179.43 176.67 174.04 176.85 174.60 174.84 175.14 174.26 174.86 173.35 176.91
180.15 180.26 179.48 182.17 178.98 177.67 174.50 173.69 175.40 172.35 178.61 172.52

96
P182 A183 A184
8.20 7.84
125.94 129.00
63.14 52.49 53.83
32.46 19.75 20.50
176.75 176.40 182.34

97
References
1. Ochsner, U. A., Johnson, Z., and Vasil, M. L., Genetics and regulation of two distinct
haem- uptake systems, phu and has, in Pseudomonas aeruginosa. Microbiology, 2000. 146: p. 185-198.
2. Vasil, M. L., and Ochsner, U. A., The response of pseudomonas Aeruginosa to iron:
Genetics, biochemistry and virulence. Molecular Microbiology, 1999. 34: p. 399-413. 3. Braun, V., and Killmann, H., Bacterial solutions to the iron-supply problem. Trends
Biochem Sci, 1999. 24: p. 104-109. 4. Bivelle, F., Cwerman, H., Le´toffe´, S., Rossi, M.-S., Drouet, V., Ghigo, J. M., and
Wandersman, C., Hemophore-Mediated Signalling in Serratia marcescens: A new mode of regulation for an Extra Cytoplasmic Function (ECF) Sigma Factor Involved in Haem Acquisition. Mol. Microbiol., 2004. 53: p. 1267-1277.
5. Letoffe,S., Ghigo,J.M., and Wandersman,C., Secretion of the Serratia marcescens HasA
protein by an ABC Transporter. J. Bacteriol., 1994b. 176: p. 5372-5377. 6. Le´toffe´, S., Redeker, V., and Wandersman, C., Isolation and characterization of an
extracellular haem-binding protein from Pseudomonas aeruginosa that shares function and sequence similarities with the Serratia marcescens HasA haemophore. Mol. Microbiol., 1998. 28: p. 1223-1224.
7. Létoffé, S., Ghigo, J. M., and Wandersman, C., Iron acquisition from heme and
hemoglobin by a Serratia marcescens extracellular protein. Proc. Natl. Acad. Sci. U S A., 1994. 91: p. 9876-9880.
8. Deniau, C., Gilli, R., Izadi-Pruneyre, N., Lettofe, S., Delepierre, M., Wandersman, C.,
Briand, C., and Lecroisey, A., Thermodynamics of hemin Binding to the HasAsm Hemophore: Effects of Mutations at Three Key Residues for Heme Uptake. Biochemistry, 2003. 42: p. 10627-10633.
9. Ghigo, J. M., Létoffé, S., Wandersman, C., A new type of hemophore-dependent heme acquisition system of Serratia marcescens reconstituted in Escherichia coli. J Bacteriol., 1997. 179: p. 3572-3779.
11. Arnoux, .P, Haser, R., Izadi, N., Lecroisey, A., Delepierre, M., Wandersman, C., and
Czjzek M., The crystal structure of HasAs, a hemophore cesreted by Serratia marcescens. Nat Struct Biol., 1999. 6: p. 516-520.

98
12. Arnoux, P.; Haser, R.; Izadi-Pruneyre, N.; Lecroisey, A.; Czjek, M. Functional aspects of
the heme bound hemophore HasA by structural analysis of various crystal forms. Proteins:Struct., Funct., Genet. 2000. 41: p. 202-210.
13. Alontaga, A. Y., Rodrı´guez, J. C., Scho¨nbrunn, E., Becker, A., Funke, T., Yukl, E. T., Hayashi, T., Stobaugh, J., Moe¨nne-Loccoz, P., and Rivera, M., Structural characterization of the hemophore HasAp from Pseudomonas aeruginosa: NMR spectroscopy reveals protein-protein interactions between Holo-HasAp and hemoglobin. Biochemistry, 2009. 48: p. 96-109.
14. Wolff, N., Izadi-Pruneyre, N., Couprie, J., Habeck, M., Linge, J., Rieping, W., Wandersman, C.; Nilges, M., Delepelairre, P., and Lecroisey, A., Comparative Analysis of Structural and Dynamic Properties of the Loaded and Unloaded Hemophore HasA: Functional Implications. J. Mol. Biol., 2008. 376: p. 517-525.
15. Lukat-Rodgers, G. S., Rodgers, K. R., Caillet-Saguy, C., Izadi-Pruneyre, N., Lecroisey, A., Novel heme ligand displacement by CO in the soluble hemophore HasA and its proximal ligand mutants: implications for heme uptake and release. Biochemistry, 2008. 47: p. 2087-2098.
16. Krieg, S., Huche´, F., Diederichs, K., Izadi-Pruneyre, N., Lecroisey, A., Wandersman, C., Delepelaire, P., and Welte, W., Heme uptake across the outer membrane as revealed by crystal structures of the receptor-hemophore complex. Proc. Natl. Acad. Sci. U.S.A. 2009, 106 : p. 1045-1050.
17. Lei, B., Smoot, L. M., Menning, H. M., Voyich, J. M., Kala, S. V., DeLeo, F. R., Reid, S. D., and Musser, J. M. Identification and Characterization of a Novel Heme-Associated Cell Surface Protein Made by Streptococcus pyogenes. Infect. Immun. 2002, 2002: p. 4494-4500.
18. Aranda, R., Worley, C. E., Liu, M., Bitto, E., Cates, M. S., Olson, J. S., Lei, B., and Phillips, G. N., Bis-methionyl coordination in the crystal structure of the heme-binding domain of the streptococcal cell surface protein Shp.. J. Mol. Biol., 2007. 374: p. 374-383.
19. Nygaard, T. K., Blouin, G. C., Liu, M., Fukumura, M., Olson, J. S., Fabian, M.; Dooley, D. M., Lei, B., The mechanism of direct heme transfer from the streptococcal cell surface protein Shp to HtsA of the HtsABC transporter. J. Biol. Chem., 2006. 28: p. 20761-20771.
20. Cheng, H., Westler, W. M., Xia, B., Oh, B. -H., and Markley, J. L., Protein Expression, Selective Isotope Labeling, and Analysis of Hyperfine-Shifted NMR Signals of Anabana 7120 Vegetative [2Fe-2S] Ferredoxin. Arch..Biochem. Biophys., 1995. 316: p. 619-634.

99
21. Rodriguez, J.C., Wilks, A., and Rivera, M., Backbone NMR Assignments and H/D
Exchange Studies on the Ferric Azide- and Cyanide-Inhibited Forms of Pseudomonas aeruginosa Heme Oxygenase. Biochemistry, 2006. 45: p. 4578-4592.
22. Cheng, H., and Markley, J. L., NMR Spectroscopic Studies of Paramagnetic Proteins:
Iron Sulfur Proteins. Annu. Rev. Biophys. Biomol. Struct., 1995. 24: p. 209-237. 23. Goodrich, J. A., and Kugel, J. F., Binding and Kinetics for Molecular Biologists; 2007:
Cold Spring Harbor, New York.
24. Otwinowski, Z., and Minor, W. In Methods in Enzymology, Macromolecular Crystallography, Part A; Carter, C. W., Sweet, R. M., Eds., 2007: Academic Press, New York.
25. Kabsch, W., Automatic indexing of rotation diffraction patterns J. Appl. Crystallogr.. 1988, 21: p. 67-72.
26. Evans, P. Scaling and assessment of data quality, Acta Crystallogr. 2006. D62: p. 72-82. 27. Vagin, A., Teplyakov, A., MOLREP: an Automated Program for Molecular
Replacement. J. Appl. Crystallogr., 1997. 30: p. 1022-1025. 28. Langer, G.; Cohen, S. X.; Lamzin, V. S.; Perrakis, A., Automated macromolecular model
building for X-ray crystallography using ARP/wARP version 7. Nat. Protoc., 2008, 3: p. 1171-1179.
29. Murshudov, G. N., Vagin, A. A., and Dodson, E. J., Refinement of Macromolecular Structures by the Maximum-Likelihood Method. Acta Crystallogr., 1997. D53: p. 240-255.
30. Adams, P. D., et al. PHENIX: a comprehensive Python-based system for macromolecular structure solution Acta Crystallogr., 2010. D66: p. 213-221.
31. Emsley, P.; Cowtan, K., Coot: model-building tools for molecular graphics. Acta
Crystallogr., 2004. D60: p. 2126-2132. 32. Painter, J., and Merritt, E. A., Optimal description of a protein structure in terms of
multiple groups undergoing TLS motion. Acta Crystallogr., 2006. D62: p. 439-450. 33. Lovell, S. C., Davis, I. W., Arendall, W. B., III, de Bakker, P. I., Word, J. M., Prisant, M.
G., Richardson, J. S., and Richardson, D. C., Structure validation by Calpha geometry: phi,psi and Cbeta deviation. Proteins, 2003. 50: p. 437-450.

100
34. Potterton, L.,McNicholas, S., Krissinel, E., Gruber, J., Cowtan, K., Emsley, P.,
Murshudov, G. N., Cohen, S., Perrakis, A., and Noble, M., Developments in the CCP4 molecular-graphics project. Acta Crystallogr., 2004. D60: p. 2288-2294.
35. Harding, M. M., Metal-ligand geometry relevant to proteins and in proteins: sodium and potassium. Acta Crystallogr., 2002. D58: p. 872-874.
36. Delaglio, F., Grzesiek, S., Vuister, G. W., Zhu, W., Pfeifer, J., and Bax, A., NMRPipe: a
multidimensional spectral processing system based on UNIX pipes. J. Biomol. NMR, 1995. 6: p. 277-293.
37. Goddard, T. D., and Kneller, D. G., SPARKY3; University of California, San Francisco: 2004.
38. Brooks, B. R., CHARMM: The biomolecular simulation program. J. Comput. Chem., 2009. 30: p. 1545-1614.
39. MacKerell, A. D., Jr., All-Atom Empirical Potential for Molecular Modeling and
Dynamics Studies of Proteins. J. Phys. Chem. B., 1998. 102: p. 3586-3616. 40. Mackerell, A. D., Feig, M., and Brooks, C. L., Extending the treatment of backbone
energetics in protein force fields: Limitations of gas-phase quantum mechanics in reproducing protein conformational distributions in molecular dynamics simulations. J. Comput. Chem., 2004. 25: p. 1400-1415.
41. Jorgensen, W. L., Chandrasekhar, J., Madura, J. D., Impey, R. W., and Klein, M. L., Comparison of simple potential functions for simulating liquid water . J. Chem. Phys. 1983. 79: p. 926-935.
42. Jo, S., Kim, T., Iyer, V. G., and Im, W., CHARMM-GUI: a web-based graphical user interface for CHARMM. J. Comput. Chem., 2008: 29: p. 1859-1865.
43. Ryckaert, J. P., Ciccotti, G., and Berendsen, H. J. C., Numerical integration of the Cartesian equations of motion of a system with constraints: molecular dynamics of n-alkanes. J. Comput. Phys., 1977. 23: p. 327-341.
44. Ryckaert, J. P., Ciccotti, G., and Berendsen, H. J. C., Numerical integration of the Cartesian equations of motion of a system with constraints: molecular dynamics of n-alkanes. J. Comput. Phys.,1977. 23: p. 327-341.
45. Larkin, M. A., Blackshields, G., Brown, N. P., Chenna, R., McGettigan, P. R., McWilliam, H., Valentin, F., Wallace, I. M., Wilm, A., Lopez, R., Thompson, J. D., Gibson, T. J., and Higgins, D. G., Clustal W and Clustal X version 20. Bioinformatics, 2007. 23. p. 2947-2948.

101
46. Caillet-Saguy, C., Turano, P., Piccioli, M., Lukat-Rodgers, G. S., Czjzek, M., Guigliarelli, B., Izadi-Pruneyre, N., Rodgers, K. R., Delepierre, M., and Lecroisey, A., Deciphering the Structural Role of Histidine 83 for Heme Binding in Hemophore HasA. J. Biol. Chem., 2008. 283: p. 5960-5970.
47. Cheng, L., Lee, J., Powell, D. R., and Richter-Addo, G. B., mu.-Oxo-bis[(protoporphyrin IX dimethyl ester)iron(III)]. Acta Crystallogr., 2004. E60: m1340-m1342.
48. Putnam, C. D., Arvai, A. S., Bourne, Y., and Tainer, J. A., Active and inhibited human catalase structures: Ligand and NADPH binding and catalytic mechanism. J. Mol. Biol., 2000. 296: p. 295-309.
49. Hildebrand, D. P., Burk, D. L., Maurus, R., Ferrer, J. C., Brayer, G. D., and Mauk, A. G., The proximal ligand variant His93Tyr of horse heart myoglobin. Biochemistry, 1995. 34: p. 1997-2005.
50. Chalfie, M., and kain, S. R., GFP Properties, Applications and Protocols 2nd edition, 2006. Wiley & Sons Inc, Hoboken New Jersey.
51. Scott, A. R., Applications of physical methods to inorganic and bioinorganic chemistry 52. Duan, Y., and Kollman, P. A., Pathways to a protein folding intermediate observed in a
1-microsecond simulation in aqueous solution. Science, 1998. 282: p. 740-744. 53. Wand, A. J., Dynamic activation of protein function: a view emerging from NMR
spectroscopy. Nature Struct. Biol., 2001. 8: p. 926-931.
54. Fontana, A., Polverino de Laureto, P., De Filippis, V., Scaramella, E. and Zambonin, M., Limited proteolysis in the study of protein conformation. In Proteolytic Enzymes: Tools and Targets. (Sterchi, E. E. & Stocker, W., eds), Springer, Heidelberg, 1999. P. 253-280.
55. Hao, M. H. and Scheraga, H. A., Analyzing the normal mode dynamics of macromolecules by the component synthesis method: residue clustering and multi component approach. Biopolymers, 1994. 34: p. 321-335.
56. Yukl, E. T., Jepkorir, G., Alontaga, A., Pautsch, L., Rodriguez, J. C., Rivera, M., and Moe¨nne-Loccoz, P., Kietic and spectroscopic Studies of Hemin Acquisition in the Hemophore HasAp from Pseudomonas Aeruginosa. Biochemistry, 2010. 49: p. 6646-6654.

102
57. Gunasekaran, K., Ma, B., and Nussinov, R., Triggering Loops and Enzyme Function:
Identification of Loops that Trigger and Modulate Movements. J. Mol. Biol., 2003. 332: p. 143-159.
58. Nicholson, L. K., Yamazaki, T., Torchia, D. A., Grzesiek, S., Bax, A., Stahl, S. J. et al.
Flexibility and function in HIV-1 protease. Nature Struct. Biol., 1995. 2: p. 274-280.
59. Derewenda, Z. S., Structure and function of lipases. Advan. Protein Chem., 1994. 45: p. 1-52.
60. Lebioda, L., Stec, B. and Brewer, J. M., The structure of yeast enolase at 2.25-A° resolution. An 8-fold beta þ alpha-barrel with a novel beta beta alpha alpha (beta alpha) 6 topology. J. Biol. Chem., 1989. 264: p. 3685-3693.
61. Lebioda, L., and Stec, B., Mechanism of enolase: the crystal structure of enolase-Mg2(þ)-2-phosphoglycerate/ phosphoenolpyruvate complex at 2.2-A° resolution. Biochemistry, 1991. 30: p. 2817-2822.
62. Ramakrishnan, B., and Qasba, P. K., Crystal structure of lactose synthase reveals a large conformational change in its catalytic component, the b1,4- galactosyltransferase-I. J. Mol. Biol., 2001. 310: p. 205-218.
63. Ramakrishnan, B., Balaji, P. V., and Qasba, P. K., Crystal structure of b1,4-galactosyltransferase complex with UDP-gal reveals an oligosaccharide acceptor binding site. J. Mol. Biol., 2002. 318: p. 491-502.
64. Sham, Y. Y., Ma, B., Tsai, C. J. & Nussinov, R., Thermal unfolding molecular dynamics
simulation of Escherichia coli dihydrofolate reductase: thermal stability of protein domains and unfolding pathway. Proteins: Struct. Funct. Genet., 2002. 46: p. 308-320.
65. Chan, A. C. K.; Lelj-Garolla, B.; Rosell, F. I.; Pedersen, K. A.; Mauk, A. G.; Murphy, M. E. P., Cofacial Heme Binding is Linked to Dimerization by a Bacterial Heme Transport Protein. J. Mol. Biol. 2006. 362: p. 1108-1119.
66. Mattle, D., Zeltina, A., Woo, J., Goetz, B., and Locher, K.P., Two Stacked Heme Molecules in the Binding Pocketof the Periplasmic Heme-Binding Protein HmuT from Yersinia pestis. J. Mol. Biol., 2010. 404: p. 220-231.

103
CHAPTER III
Effects of Proximal Ligand Substitutions on Heme Coordination and Structural Integrity of HasAp
Introduction
The heme in the crystal structure of the hemophore HasAp (heme acquisition system)
from Pseudomonas aeruginosa (P. aeruginosa) is coordinated by a rare pair of amino acid
residues; a histidine (His 32) and a tyrosine (Tyr 75) (Figure 1) [1,2]. Tyr 75 is also hydrogen
bonded to a nearby residue (His 83, 2.6 Å) via its Oη and this interaction is thought to modulate
the Fe3+-Tyr bond [3,4]. Residues Tyr 75 and His 83, which are conserved in all identified
hemophores [5], (see Figure 6, Chapter II) have been suggested to play a crucial role in heme
binding and /or release [6]. By contrast His 32 is not conserved.
His 32
His 83Tyr 75
Figure 1. Zoomed in view of the heme pocket in the hemophore HasAp . Heme coordination
ligands His 32 and Tyr 75 are colored blue. His 83 is colored orange.

104
Deniau et al. replaced His 32, Tyr 75 and His 83 for Ala in the hemophore HasAs from S.
marcescens and showed that one axial iron ligand is sufficient to ligate the heme [7]. It was
proposed that His 83 may act as an alternative iron ligand in the absence of Tyr 75 or both His 32
and Tyr 75 [8]. It is noteworthy, however, that there is no conclusive evidence to support the
proposed coordination state of the heme iron in His 83 to Ala mutant. Similarly, information
regarding the overall architecture of the mutant proteins is very limited and inconclusive.
The X-ray crystal structure of H83A-HasAs has been solved but the low resolution (2.6
Å) prevented definitive determination of the heme-iron ligands [9]. A combination of
spectroscopic techniques (RR, NMR and EPR) was used to investigate the coordination state of
the heme-iron in this mutant over a wide range of pH [9]. A summary is shown in Scheme 1
below. It was concluded that at acidic pH (pH 5.0), the major form of holo-H83A is a
pentacoordinate high spin species (5c Hs) where the heme is axially coordinated by His 32. At
neutral and basic pH values, a mixture of high spin and low spin six coordinate species (6c Hs
and 6c Ls) predominates. It was proposed that the 6c Hs species is a His32/H2O but as the pH is
increased the nearby residue (Tyr 75) is deprotonated and its phenolic oxygen atom forms a
hydrogen bond with the bound water stabilizing the low spin hydroxide form, His 32/OH- (6c
Ls). However, recent investigations contradict this model: (i), Lukat-Rodgers et al [10] reported
that when wild type holo-HasAs is reduced with dithionite in the presence of CO, a ferrous
hexacoordinate complex in which His 32 is replaced by CO at the distal site is formed. (ii), the
crystal structure of HasAs in complex with its receptor (HasR), recently reported by Krieg et al
[11], shows that the heme in the hemophore is coordinated only by Tyr 75 at the proximal site
while the His 32 loop is turned away from its heme-binding conformation. Together, these
observations suggest that His 32 is considerably more labile than Tyr 75. It is therefore likely that

105
the heme ligand that ionizes at high pH (scheme 1) is the distal His not the Tyr. Ionization of a
His residue close to the heme pocket has been reported in other ferric heme proteins [12].
Fe
His 32
(5c HS)
Fe
His 32
(6c HS)
Fe
His 32
(6c LS)
Tyr 75-O
H
H
O
H
Tyr 75-O
H
O
H
Acidic pH Basic pH
In this study, we carried out an investigation to elucidate the nature of the heme iron
coordination and the overall architecture of the Y75A and H83A HasAp mutants. Electronic
absorption spectroscopy revealed that both mutants bind heme and exist as a mixture of high spin
and low spin species in solution. A pH titration analysis shows that Y75A-HasAp possesses a
unique coordination as a function of pH whereas H83A-HasAp is pH sensitive. The crystal
structure of Y75A obtained at pH 7.5 reveals that the heme is coordinated by His 32 at the distal
site and a chance ion at the proximal position. The side chain of His 83 assumes a nearly
identical position with that of wild type, clearly indicating that in the absence of the Tyr 75 His
83 does not necessarily coordinate the heme. This result contradicts the long held speculation
that His 83 may serve as the heme iron ligand in the absence of Tyr 75.
Sheme 1. Proposed coordination state of the heme iron in H83A-HasAs at different pH.

106
Two crystal forms of H83A-HasAp were obtained. In the first form, obtained at pH 6.5,
the heme is axially coordinated by His 32 and Tyr 75, and the Tyr forms a hydrogen bond with a
chance ion (ethylene glycol) via its phenolic oxygen. In the second crystal form, also obtained at
pH 6.5, the heme is similarly coordinated by His 32 and Tyr 75 but ethylene glycol is replaced by
a water molecule. In either case neither His 32 nor Tyr is detached from the heme. We therefore
propose that the acid-base transition observed in H83A-HasAp is likely due to ionization of His
32. A crystal structure of H83A at low pH would help ascertain this argument.
Overall, the polypeptide fold of Y75A and H83A HasAp mutants is similar to that of the
wild type protein. The crystal structures reveal a few conformational changes in the loops that
harbor the heme iron ligands, and gain or loss in the secondary structure of the loop implicated to
interact with the receptor HasR during heme release. Loss of beta sheet character or shortening
of beta strands is also observed in the H83A mutant. Unless otherwise stated, the discussions
herein are based on H83A crystal form 1.
Experimental Procedures
Construction of Y75A and H83A HasAp mutants
Y75A and H83A HasAp mutants were constructed in the background of the gene coding
for the truncated form of HasAp missing the last 21 C′-terminal amino acids relative to the full-
length protein. Construction of the truncated form is described in reference 12. Mutagenic
primers were custom synthesized by Integrated DNA Technologies, Inc. and were used (without
further purification) in conjunction with polymerase chain reaction (PCR) and QuickChange TM

107
site-directed mutagenesis kit (Stratagene; La Jola, CA) to introduce the desired mutations.
Sequences corresponding to the Y75A complementary oligonucleotide primers are
5`-GGCGGCGATCTGCATGCGACCCTGTTT-3`and 5`-GCT AAACAGGGTCGCA TGCAG
ATCGCCGCC-3` while those corresponding to H83A oligonucleotide primers are 5`-CTGTTT
AGCAACCCGAGCGCGACCCTGTGGGGC-3` and 5`-GCCCCACAGGGT CGCGCTCGGG
TTGCTAAACAG-3`. The underlined codons represent target substitutions. Each gene construct
was transformed into XL1-Blue Competent cells (Stratagene) for amplification. DNA sequences
(Figure 2) were verified by SeqWrigh (Huston, Texas). Recombinant DNA plasmid with the
correct sequence was transformed into Escherichia coli BL21 (DE3) GOLD Competent cells for
protein expression.
Expression and purification of Y75A and H83A mutants
Recombinant proteins were expressed in the BL21 DE3 strain of E.coli following a
similar procedure that was used to express H32A and wild type protein. Briefly, a single colony
from the transformant E. coli BL21 (DE3) Gold Competent cells was cultured overnight at 37 °C
in 50 mL of LB medium containing 100 μg/mL ampicillin. 30 mL of the overnight innoculum
was sub-cultured in fresh 1 L M9 medium supplemented with 200 µg/mL ampicillin and the cells
were grown to an OD600 of ~ 1 at 37 o C, shaking at 235 rpm. The temperature was then lowered
to 30 °C before inducing polypeptide synthesis by addition of 1 mM isopropyl-D-
thiogalactopyranoside (IPTG). The cells were allowed to grow for an additional 5 h at 30 o C,
harvested by centrifugation at 4800 rpm and 4 0C for 12 min, and store overnight in -20 °C. Cells
were resuspended in 20 mM Tris-HCl pH 7.6 (3 mL/ wet gram cell) and disrupted by sonication

108
in ice in the presence of a pinch of DNase (Sigma-Aldrich, St. Louis, MO). The lysate was
pelleted by ultracentrifugation at 19500 rpm and 4 °C for 40 min. The resultant supernatant was
loaded onto an ion exchange column pre-equilibrated with 20 mM Tris-HCl pH 7.6. Following
column washing with at least three bed volumes of the same buffer, the protein was eluted with a
linear gradient of (0-0.6 M) NaCl. The apo fraction (~ 80 %) was gently separated from its holo
counterpart using hydrophobic affinity chromatography and following the same protocol
developed for isolation of apo-HasAp as detailed in the experimental section of chapter II. The
concentration of the pure samples was determined using Bovine Serum Albumin (BSA) protein
kit (Pierce).

109
S N T G G F N P
CCG TTT GAT GGC AGC CAG TAT GCG CTG AAC AGC ACC GCG AGC GAT GCG P F D G S Q F A L K S T A S D A
TTT ATT GCG GGC GGC GAT CTG CAT GCG ACC CTG TTT AGC AAC CCG AGC GCGF I A G G D L H A T L F S N P S
ACC CTG TGG GGC AAA CTG GAT AGC ATT GCG CTG GGC GAT ACC CTG ACC GGCT L W G K L D S G
GGC GCG AGC AGCGGC GGCTAT GCG CTG GAT AGC CAG GAA GTG AGC TTT AGCG A S S G G Y A L D S Q E V S F S
AAC CTG GGC CTG GAT AGC CCG ATT GCG CAG GGC CGT GAT GGC ACC GTG N L G L D S P I A Q G R D G T V
AAA GTG GTGTAT GGC CTG ATG AGC GGC GAT AGC AGC GCG CTG CAG GGC CAGK V V Y G L M S G D S S A L Q G
ATT GAT GCG CTG CTG AAA GCG GTT GAT CCG AGC CTG AGC ATT AAC AGC ACC I D A L L K A V D P S L S I N S
TTT GAT CAG CTG GCG GCG GCGGGC GTG GCG CAT GCG ACC CCG GCG GCGGCGF D Q L A A A G V A H A T P A A A
GCG GCGGAA GTG GGC GTG GTG GGC GTG CAG GAA CTG CCG CAT GAT CTG GCGA A E V G V V G V Q E L P H D L
Bam H ICTG GCG GCGTAA GGATCC GGG
L A A -
5' NdeIGGGCATATGAGC ATT AGC ATT AGC TAT AGC ACC ACC TAT AGC GGC TGG ACC
M S I S I S Y S T T Y S G W T
GTG GCG GAT TAT CTG GCG GAT TGG AGC GCG TAT TTT GGC GAT GTGAAC CATV A D Y L A D W S A Y F G D V N H
CGT CCG GGC CAG GTG GTG GAT GGC AGC AAC ACC GGC GGC TTT AAC CCG GGCR P G Q V V D G G
GCGP F D G S Q F A A
A
I A L G D T L T
CATH
Q
ATT GAT GCG CTG T
TTT GAT CAG CTG GCG
GCG GCGGAA GTG GGC GTG A
I
L A A -
3'
Figure 2. DNA and amino acid sequence of HasAp-TR. The Nde I and BamHI
restriction endonuclease sites were constructed at the 5' and 3' ends, respectively, for
subcloning. The underlined codons represent mutation of Tyr or His to Ala at positions
75 and 83, respectively.

110
Preparation of holo protein
Identical reconstitution methodologies were employed on Y75A and H83A. Fresh
solution of 1 mM hemin was prepared by dissolving 6.5 mg of hemin chloride in 10 mL DMSO.
250 µL aliquots of the resultant solution were used to titrate 2 µmoles (10-12 µM) of protein,
while monitoring hemin uptake spectrophotometrically. After every addition, 3 min mixing time
was allowed before absorbance measurement was taken. This was continued until the Rz value
(absorbance of soret/ absorbance at 280 nm) remained constant. The heme-complex mixture was
allowed to incubate overnight at 4 0C, before concentrating to 2 mL using 10 kDa MWCO
Amicon ultracentrifuge filter devices. During concentration, the retentate was constantly mixed
every 15 minutes to minimize or avoid the possible formation of dimers. The concentrated
sample was passed over a gel filtration column (Sephadex G-75; 2.6 cm i.d X 90 cm: GE
Healthcare) to remove excess heme. MW of pure holo samples was checked with electrospray
mass spectrometry following a similar procedure for determining the MW of H32A described in
chapter II. The oligomeric state was determined with the aid of a high resolution gel filtration
column (Superdex 75 prep grade, GE Healthcare) in 50 mM Tris-HCl (pH 7.5), 100 mM KCl
buffer. The column was calibrated with; cytochrome c (12.4 kDa), chymotrypsin (25 kDa),
ovalbumin (44 kDa), and albumin (67 kDa) standards.
Determination of the extinction coefficient for the Y75A- and H83A-heme complex.
The millimolar extinction coefficient at 406 nm (406 ) or at 405 nm (405 ) for Y75A and
H83A heme complexes, respectively, was determined by the pyridine-hemochrome method [13].
Briefly, the absorbance of the purified holo Y75A and H83A samples was measured at their

111
respective soret maximum. The solution was diluted with alkaline pyridine and a few grains of
dithionite were added. The spectrum of the reduced ferrous pyridine hemochrome was then
recorded. The mean concentration was calculated from the absorbance values at 418, 525, and
557 nm using reported epsilon values of 170 mm-1cm-1, 17.5 mm-1cm-1 and 34.5 mm-1cm-1 ,
respectively, for reduced hemochromes.
Protein crystallization
HasAp mutants in 100 mM sodium phosphate pH 7.8 (Y75A) or 100 mM Tris pH 7.6
(H83A) were concentrated to 15 mg/mL and screened for crystal growth using Compact Jr.
(Emerald biosystems) sitting drop vapor diffusion plates. The sitting drop was prepared by
mixing 0.5 µL of protein and 0.5 µL of crystallization solution then equilibrated against 100 µL
of the latter. Initial crystals of Y75A were obtained within 24 hours at 20 oC from the Hampton
Crystal Screen 2 (Hampton Research) condition #32 (1.6M (NH4)2SO4, 100 mM HEPES pH 7.5,
200 mM NaCl). Crystals were transferred to a solution containing 80% crystallization solution
and 20% glycerol before freezing in liquid nitrogen for data collection. In the case of H83A,
initial crystals were similarly obtained in 24 hours at 20 oC from Wizard II (Emerald
biosystems) condition #11 (10% isopropanol, 100 mM Na cacodylate pH 6.5, 200 mM zinc
acetate) ( Appendix 1). However, the original crystals of H83A grew as clusters of small needles
and did not diffract. Crystallization conditions refined using pHatTM Buffer Screen (Emerald
Biosystems) followed by Hampton Additive Screen resulted in plate shaped clusters that
diffracted to a high resolution from 10% isopropanol, 100 mM Sodium Cacodylate pH 6.5, 200
mM zinc acetate, 3% dioxane. Samples were transferred to a solution containing 75%

112
crystallization solution and 25% ethylene glycol before freezing in liquid nitrogen for data
collection.
Data collection, structure determination and refinement
Initial x-ray diffraction data were collect at the University of Kansas Protein Structure
Laboratory using a Rigaku R-Axis IV++, image plate detector equipped with an RU-H3R rotating
anode generator (Cu-Kα, 1.5418Å) and Osmic Blue focusing mirrors. High resolution
diffraction data were collected at the Advanced Photon Source IMCA-CAT beamline 17ID using
a Dectris Pilatus 6M pixel array detector.
Diffraction intensities were integrated and scaled using the XDS [14] and Scala [15]
packages, respectively. The Laue class was checked using Pointless [14] which indicated that
mmm and 2/m was the correct class for Y75A and H83A respectively. Coordinates from a
previously determined structure of HasAp (PDB: 3ELL) were used for molecular replacement
search with Molrep[3]. To determine the structure of Y75A, a single monomer of HasAp was
used and residue Y75 was omitted from the search model. Prominent difference (Fo-Fc) electron
density was observed near the heme on the side that would normally be occupied by Y75. Three
peaks were present in this region that were at an angle of approximately 120o and separated by
approximately 1.3Å. Refinement of an ethanol molecule at this site resulted in positive Fo-Fc
electron density at C2 atom of the ethanol indicating an underestimation of electrons whereas
placement of a formate ion did not yield any residual electron density. This electron density was
observed from four diffraction data sets, ranging from 0.95 Å to 1.3 Å resolution obtained from
four unique crystallization conditions. Since the electron density was not consistent with any of

113
the crystallization components, protein storage buffer or purification buffers, it is likely that this
ion was present in the heme used in the analysis.
To solve the structure of H83A, a single monomer of the previously determined structure
of HasAp (PDB: 3ELL) was used for molecular replacement search with Molrep [16] and
residue H83 was omitted from the search model. Molecular replacement searches in the space
groups P21 and P2 yielded correlation coefficients of 0.62 and 0.30 respectively. Therefore,
subsequent structure refinement was conducted in the space group P21. Initial structure solution
and refinement were conducted using in-house diffraction data collected with Cu-Kα radiation.
Large peaks greater than 10 were observed in the difference Fourier maps (Fo-Fc) that were
likely zinc ions from the crystallization solution. No anomalous signal was observed at these
sites using Cu-Kα data. An X-ray fluorescence scan indicated that zinc was indeed present in the
crystal (Figure 3). Data for structure refinement were collected at a wavelength of 1.0000 Å
which still yields an appreciable anomalous signal for Zn ~2.6e-, (Figure 4). In addition,
diffraction data were collected at a low energy remote wavelength (λ =1.28414 Å, 9,655 eV)
which resulted in the disappearance of the anomalous difference density at the Zn sites but an
increase at the hemin Fe site (Figure 5). This confirmed that the assignment of Zn at these sites
was correct.
Structure refinement of positional and anisotropic atomic displacement parameters and
manual model building for both mutants were performed with Phenix [17] and Coot [18]
respectively. Structure validation was carried out using Molprobity [19] and figures were
prepared using CCP4mg [20] and pyMol [21]. Data collection and refinement statistics are
summarized in Table 1.
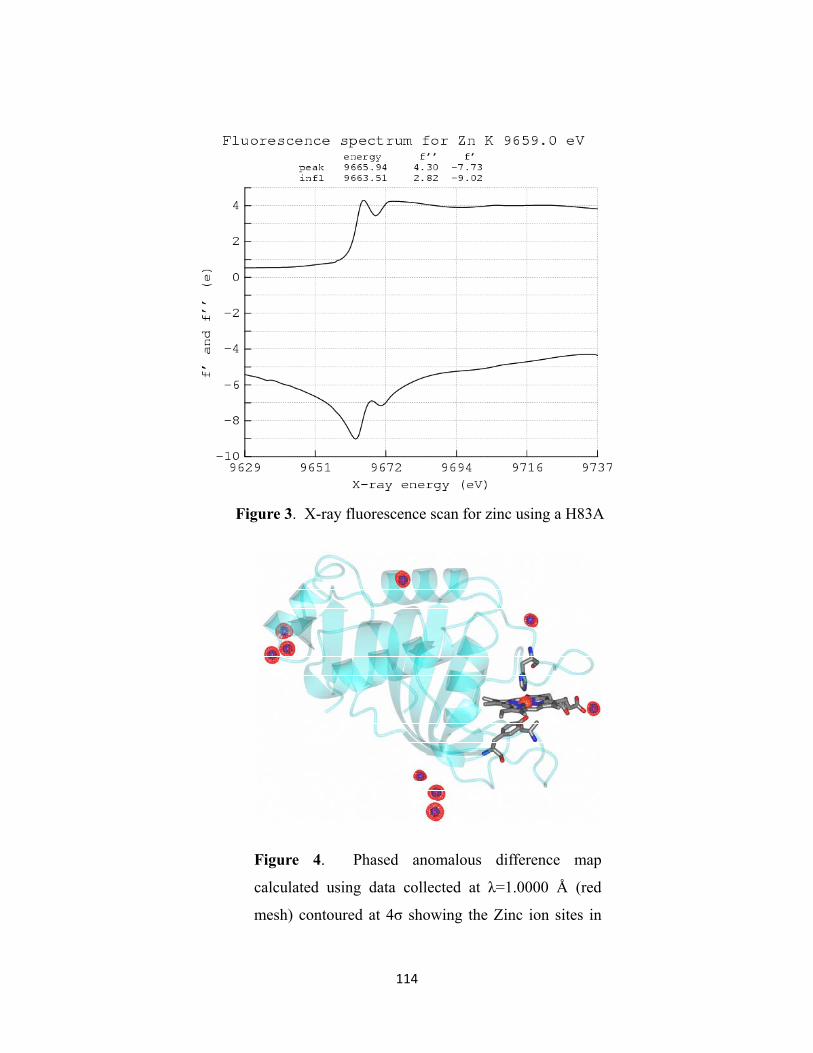
114
Figure 3. X-ray fluorescence scan for zinc using a H83A
Figure 4. Phased anomalous difference map
calculated using data collected at λ=1.0000 Å (red
mesh) contoured at 4σ showing the Zinc ion sites in

115
Figure 5. Phased anomalous difference map using data
collected at λ=1.0000 Å (red mesh) and 1.28414 Å (low
energy remote, green mesh) contoured at 4σ. The
anomalous difference density increases at the hemin Fe
atom and disappears at the Zinc ion site when using the
low energy remote wavelength data.
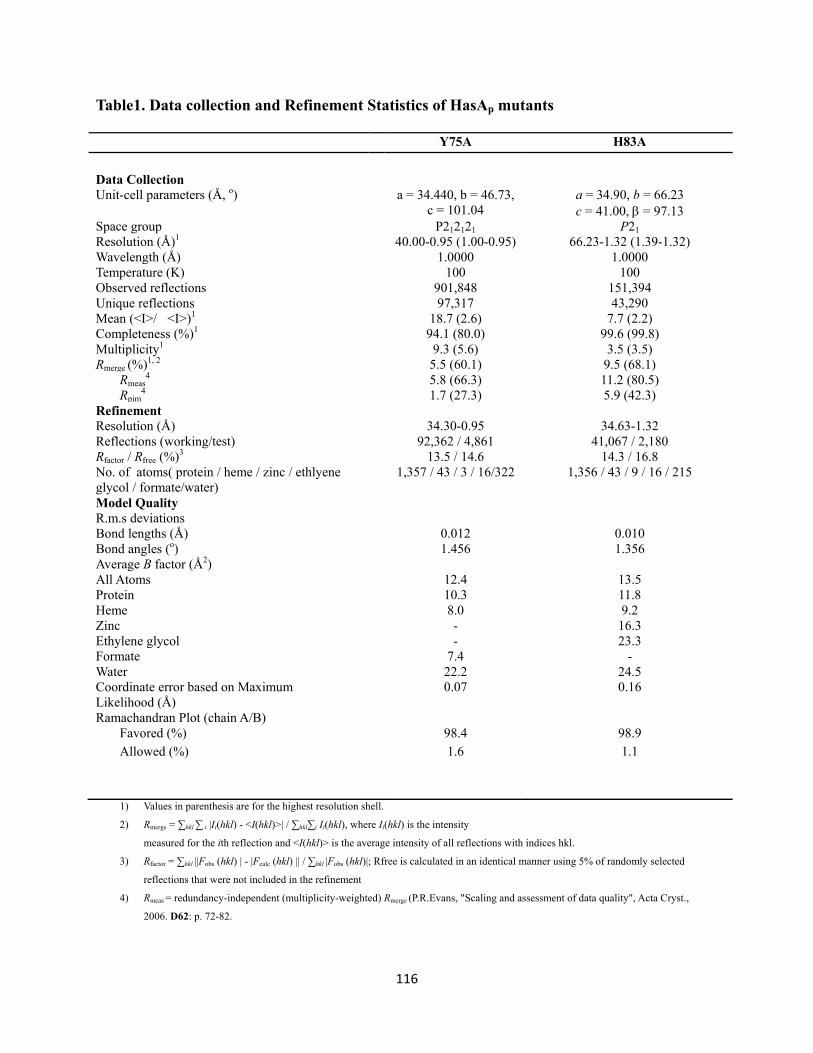
116
Table1. Data collection and Refinement Statistics of HasAp mutants
Y75A H83A
Data Collection Unit-cell parameters (Å, o) a = 34.440, b = 46.73,
c = 101.04 a = 34.90, b = 66.23 c = 41.00, = 97.13
Space group P212121 P21 Resolution (Å)1 40.00-0.95 (1.00-0.95) 66.23-1.32 (1.39-1.32) Wavelength (Å) 1.0000 1.0000 Temperature (K) 100 100 Observed reflections 901,848 151,394 Unique reflections 97,317 43,290 Mean (<I>/�<I>)1 18.7 (2.6) 7.7 (2.2) Completeness (%)1 94.1 (80.0) 99.6 (99.8) Multiplicity1 9.3 (5.6) 3.5 (3.5) Rmerge (%)1, 2 5.5 (60.1) 9.5 (68.1)
Rmeas4 5.8 (66.3) 11.2 (80.5)
Rpim4 1.7 (27.3) 5.9 (42.3)
Refinement Resolution (Å) 34.30-0.95 34.63-1.32 Reflections (working/test) 92,362 / 4,861 41,067 / 2,180 Rfactor / Rfree (%)3 13.5 / 14.6 14.3 / 16.8 No. of atoms( protein / heme / zinc / ethlyene glycol / formate/water)
1,357 / 43 / 3 / 16/322 1,356 / 43 / 9 / 16 / 215
Model Quality R.m.s deviations Bond lengths (Å) 0.012 0.010 Bond angles (o) 1.456 1.356 Average B factor (Å2) All Atoms 12.4 13.5 Protein 10.3 11.8 Heme 8.0 9.2 Zinc - 16.3 Ethylene glycol Formate
- 7.4
23.3 -
Water 22.2 24.5 Coordinate error based on Maximum Likelihood (Å)
0.07 0.16
Ramachandran Plot (chain A/B) Favored (%) 98.4 98.9 Allowed (%) 1.6 1.1
1) Values in parenthesis are for the highest resolution shell.
2) Rmerge = ∑hkl ∑ i |Ii(hkl) - <I(hkl)>| / ∑hkl∑i Ii(hkl), where Ii(hkl) is the intensity
measured for the ith reflection and <I(hkl)> is the average intensity of all reflections with indices hkl.
3) Rfactor = ∑hkl ||Fobs (hkl) | - |Fcalc (hkl) || / ∑hkl |Fobs (hkl)|; Rfree is calculated in an identical manner using 5% of randomly selected
reflections that were not included in the refinement
4) Rmeas = redundancy-independent (multiplicity-weighted) Rmerge (P.R.Evans, "Scaling and assessment of data quality", Acta Cryst.,
2006. D62: p. 72-82.

117
Results
Purification of Y75A and H83A mutants
Both Y75A and H83A accumulate in the E. coli host mostly as apo (~80 %) protein,
judged by hemin absorption features in the UV-vis spectra. Following ion exchange
chromatography, the apo fraction was separated from its holo counterpart using hydrophobic
affinity chromatography and then reconstituted with hemin. Both mutants eluted from a size
exclusion chromatography column in a single band (Figure 6) and run in a 15 % SDS gel with an
apparent mass of ~ 19 kDa. The molecular mass was estimated by size exclusion
chromatography as 16.9 kDa (Y75A) and 17.6 kDa (H83A) (Figure 7) which is very close to the
calculated molecular weight of a monomer.
wavelength (nm)
35 40 45 50 55 60
Abs
orba
nce
0.0
0.5
1.0
1.5
2.0
2.5
Figure 6. Elution profile of Y75A-HasAp from Sephadex G-75 column; open circles track the
soret band absorption (~406 nm) and the black circles track absorbance at 280 nm. A similar
profile was observed with the H83A-HasAp mutant.

118
Ve (mL)
12 14 16 18
log
MW
1.0
1.2
1.4
1.6
1.8
2.0
Ovalbumin
Albumin
Chymotrypsin
Cytochrome c
Y75AH83A
This is corroborated by mass values obtained with the aid of ESI-MS; 18,667 Da (Y75A) and
18,693 Da (H83A), in good agreement with the masses calculated from amino acid sequences
18,668 Da and 18,694 Da for Y75A and H83A (excluding initiator methionine), respectively
(Appendix 2 and Appendix 3).
Characterization by UV-vis spectroscopy
Figure 8 shows the electronic absorbance spectra of Y75A (black) and H83A (red)
recorded in sodium phosphate buffer (µ = 0.1, pH 7.8). Y75A exhibit absorbance peaks at 406
Figure 7. Elution volumes (Ve) from a calibrated Superdex 75 column and estimated molecular
weight of Y75A HasAp (red triangle) and H83A HasAp (green diamond). The Superdex 75
column was calibrated with albumin (67 kDa), ovalbumin (44 kDa), chymotrypsin (25 kDa), and
cytochrome c (12.4 kDa) shown in black filled circles.

119
nm (soret), 535, 574, and 624 nm. The Q bands at 535 and 574 nm indicate the presence of low
spin species in solution, while the soret maximum and the charge transfer band at 624 nm are
indicative of the presence of high spin species [22, 23]. Thus, like wild type HasAp, Y75A
mutant exists in solution as a mixture of high spin and low spin species. It is worth stressing that
the spectral properties did not change over a pH range of 5.0- 9.5.
The electronic absorption spectrum of H83A at pH 7.0 has a broad soret band at 405 nm,
weak Q bands at 495 and 555 nm, as well as very intense characteristic high-spin marker band at
610 nm (red trace in Figure 8). pH titration analysis show that at acidic pH, the soret band is at
404 nm and the species in solution is predominantly high spin as evidenced by soret maximum
and intense high spin marker bands at 500 and 618 nm (Figure 9). Upon increasing the pH, the
soret band decays and concomitantly red shifts by about a nm, while the 500 nm and 618 nm
high spin bands decay giving rise to a new set of species absorbing at 495, 555, 580, and 610 nm.
The 555 nm and 580 nm bands are characteristic of low spin species while the 495 and 610 nm
bands are characteristic of high spin species albeit different from the high spin species observed
at low pH. Thus, unlike wild type and Y75A, H83A exhibit three pH dependent forms; a high
spin species at acidic pH and a different high spin species and a low spin species at neutral and
alkaline pH.

120
Wavelength (nm)
300 400 500 600 700
Abs
orba
nce
0.0
0.2
0.4
0.6
0.8
1.0
1.2
405 406
495
624
535610
555
Y75AH83A
Wavelength (nm)
450 500 550 600 650 700
0.00
0.02
0.04
0.06
pH 5.0 pH 5.5 pH 6.0 pH 6.5 pH 7.3 pH 8.1 pH 9.5
300 400
Abs
orb
an
ce
0.0
0.2
0.4
0.6
0.8
1.0
pH 5.0
pH 9.5
Figure 8. Electronic absorbance spectra of Y75A (black) and H83A (red) recorded in sodium
phosphate buffer (µ = 0.1, pH 7.8).
Figure 9. pH titration spectra of H83A over a pH range of 5.0 to 9.5 in sodium
phosphate buffer , µ = 0.1.

121
X-ray Crystallography
Crystallography is a useful tool for determining three-dimensional protein structures at
molecular level. However, producing high-quality crystals that yield good diffraction data
remains a major bottleneck in structure determination [22]. Crystallization is thought to occur in
two steps: (i) nucleation and (ii) growth of nuclei to macroscopic crystals [23]. Nucleation,
which is a prerequisite, requires different conditions from growth but once a critical nucleus has
formed, growth follows spontaneously [24].
A common initial approach to protein crystallization is to set up screening trials using
random sparse-matrix screens [25]. In these screens, the protein sample is exposed to a variety of
formulations with the aim of finding ‘hits’ or ‘leads’ that may be conducive for crystal growth.
Once the leads are identified, the conditions are optimized by varying the concentration of the
protein, buffer composition, temperature, pH, type and concentration of precipitant, or by adding
additives to optimized lead conditions. Alternatively, the crystallization environment in the
sparse-matrix screen can be actively influenced and controlled as crystallization proceeds so as
to lead crystal growth in the direction that will give the best results [22].
Several methods are used to grow crystals of biological macromolecules but vapor
diffusion is the most commonly employed technique [25]. In this method, the protein solution
(containing pure protein and crystallization solution in a 1:1 ratio) is either a hanging drop or a
sitting drop that continuously equilibrates against a reservoir containing similar crystallizing
agents but at a higher concentration than in the drop [25]. The difference between the two
diffusion methods is the vertical orientation of the droplet within the system. In hanging drop,
the droplet is suspended on the cover slip over the reservoir like a hanging drop whereas in
sitting drop the wells are fitted with a support for the droplet to sit on. The sitting drop method

122
was used in this work. Initially, the droplet of protein solution contains an insufficient
concentration of precipitant to effect crystallization, but as water evaporates from the drop the
precipitant concentration increases to a level optimal for crystallization. The process of
equilibration continues and optimum conditions are maintained until the crystallization is
complete [25].
Crystallization of Y75A and H83A HasAp mutants
Crystals of Y75A mutant (Figure 10-C) were obtained from four unique crystallization
conditions. Since these crystals diffracted to a high resolution, further refinement was deemed
not necessary. In the case of H83A, initial crystals from a random screen (Wizard II #11) grew as
clusters of small needles that did not diffract (Figure 10-A). Crystallization conditions were fine-
tuned using (i) pHat™ buffer Screen to simultaneously explore the effects of pH and buffer
composition on crystal growth, and (ii) Hampton Additive Screen to improve the quality and/or
size of the crystals. From the former refinement screen, small low-quality crystals were observed
only in conditions buffered with sodium cacodylate. This showed that cacodylate buffer is
important in crystal growth and hence it was used in the latter optimization screens. Plate shaped
clusters (Figure 10-B) that diffracted to a high resolution were obtained from 10% isopropanol,
100 mM sodium cacodylate pH 6.5, 200 mM zinc acetate, 3% dioxane. Before the samples were
frozen for data collection, they were placed in a cryoprotectant solution containing 25 %
ethylene glycol

123
BA
C
A B
Crystal structures of Y75A and H83A HasAp mutants
The crystal structure of the Y75A HasAp mutant in the orthorhombic space group P212121
was solved at 0.95 Å resolution with Rfree of 14.6 %, using holo-HasAp (PDB: 3ELL) as the
search model. The H83A mutant crystallized in the monoclinic space group P21 and its structure
was refined to 1.3 Å resolution with Rfree of 16.8 % (crystal form 1). H83A crystal form 2 was
refined to 0.89 Å. Unlike the wild type protein which has two subunits in an asymmetric unit,
both mutants contain one molecule in the asymmetric unit. Since both molecules (A and B) in
wild type HasAp are similar, from here on, all comparisons are made using molecule B.
Figure 10. (A) Original crystals of
H83A obtained from 10% isopropanol,
100 mM sodium cacodylate pH 6.5,
200 mM zinc acetate; (B) Refined
crystals obtained from 10%
isopropanol, 100 mM sodium
cacodylate pH 6.5, 200 mM Zinc
acetate, 3% dioxane. (C) Single
crystals of Y75A obtained from

124
Heme iron coordination and conformational changes involving His 32 and Tyr 75 loops.
Heme interaction with the protein can be viewed in reference to the two important
structural elements, namely His 32 loop and Tyr 75 loop at the interface of the -helical and -
sheet wall. The His 32 loop harbors the distal ligand whereas the Tyr 75 loop provides the
proximal ligand to the heme-iron.
In Y75A HasAp mutant, a 2Fo-Fc electron density map contoured at 1 clearly show that
the heme adopts a single orientation (Figure 11-A). At the proximal site is an elongated well-
defined density assignable to a formate ion at a distance of 2.0 Å from the central metal iron
(Figure 11-B). This formate ion is directed toward the -meso carbon of hemin and is identically
superimposable with the CO group of Tyr 75 in the wild type protein. One of its O atoms forms a
hydrogen-bond with Nδ of His 83 (2.6 Å) whereas the other interacts with the backbone carbonyl
group of Thr 76 (3.8 Å) (Figure 11-C). It is noteworthy to mention here that the side chain of His
83 is positioned in a nearly identical position to that of the wild type protein and as such, it does
not coordinate the heme-iron. In the H83A HasAp mutant, 2Fo-Fc electron density map
contoured at 1 (Figure 12-A) show that the heme adopts a single orientation. In crystal form 2
of H83A though, the heme is coordinated by Tyr 75 which in turn forms a hydrogen bond with a
water molecule (Figure 12-B). The water molecule is replaced by a chance ion ethylene glycol
(EG) in H83A crystal form 1 (Figure 12-C). Together, these observations contradict the proposal
that in the absence of His 83, the Tyr 75 to iron coordination bond is severed. Secondly, the high
resolution crystal structure of Y75A mutant shows that in the absence of Tyr 75, His 83 does not
necessarily coordinate the heme.

125
A B
C D
Tyr75 loop
Hemin
His 32
Formate
Figure 11. 2Fo-Fc electron density map contoured at 1; (A) Electron density at the heme showing that it adopts a single orientation; (B) Electron density of the refined formate ion. (C) Zoomed in view of hemin binding pocket. (D) Sphere representation of Tyr 75 loop and coordinated formate ion.

126
His 32
Ala 83
Tyr 75EG
(C) H83A_1(B) H83A_2(A)
H2O
As shown in Figure 13, the heme propionates adopt identical hydrogen bonding
interactions with the protein as seen in the crystal structure of wild type HasAp; the polar end of
Arg 129 side chain (3.5 Å) and N atom of Gly 35 (3.0 Å) form hydrogen bonds with the first and
the second propionates, respectively. The H83A crystal form 1 deviates slightly from the wild
type protein in the sense that one of the propionates is coordinated to another chance ion, Zn2+.
Since the propionates in general have a high propensity to interact electrostatically with side
chains of positively charged residues or cations, by virtue of its proximity, Zn2+ ion (2.0 Å, 2.9
Å) was close enough to provide favorable interactions compared to Gly 35 N atom located 4.5Å
away. Additional interactions with a network of four to seven water molecules cap the front ends
of the solvent exposed propionates in both mutants. Lastly, the position of the coordinating
ligands His 32 and Tyr 75 are stabilized by hydrogen bonding interactions with Oη of Tyr 138
(2.7 Å) and carboxyl group of Phe 51 (2.9 Å), respectively. All these interactions seem to
preserve the architecture of the heme pocket and anchor the heme macrocyle tightly within the
binding site despite the disruption of the crucial Tyr 75-His 83 hydrogen bond. It is however
Figue 12. 2Fo-Fc electron density map at the heme contoured at 1 (A), and zoomed in view of heme
binding pocket in H83A crystal form 2 (B) and H83A crystal form 1(C).

127
notable that the subtle effects contributed by proximal heme coordinating ligands and the chance
ions are large enough to induce conformational changes in the His 32 and Tyr 75 loops.
Y75A
H83A_2
WT
H83A_1
ARG 129GLY 35
TYR 138
PHE 51
HIS 32TYR 75
ALA 83H2O
ARG 129GLY 35
TYR 138
PHE 51
HIS 32
ALA 75
HIS 83
FORMATE
ARG 129
TYR 75
EG
HIS 32
Zn2+
GLY 35
ALA 83
PHE 51
ARG 129
GLY 35
TYR 138
PHE 51
HIS 32TYR 75
HIS 83
Figure 13. Heme-iron ligands and residues that make direct contact with the propionates in WT,
Y75A, and H83A HasAp mutants.

128
Conformational changes in the His 32 and Tyr 75 loops.
An important feature that becomes apparent in the mutants is the movement of the His 32
and Tyr 75 loops away from the heme relative to their position in wild type HasAp (Figure 14).
In H83A crystal form 2, the movement further extents to the hairpin loop connecting 2 and 3
(Lys 59 - Asp 64). Conformational changes in the backbone of His 32 loop is accompanied by
spatial reorientation of side chains involving nearly all amino acid residues that constitute the
loop. Significant changes are observed in Arg 33, Gln 36, Val 37, Val 38, and Asn 39 (Figure 15)
near the hinge residue Gly 45. Although disruption of native heme-iron coordination may justify
these changes, it is interesting to note that the His 32 loop is more affected yet the mutations are
on the Tyr 75 loop. In addition, the bond lengths between the heme-iron and the axial ligands are
nearly maintained (Table 2). Nonetheless, the slight tilting motion of the heme plane away from
the Tyr 75 loop that accompany His 32 movement, and substitution of a small amino acid
Y75A H83A_1
H32 loop
Y75 loop
H83A_2
K59-D64
Y75 loop
H32 loop
Figure 14. Zoomed in view of His 32 and Tyr 75 loops of wild type HasAp (magenta), Y75A
(green), H83A crystal form 1(cyan), and H83A crystal form 2 (lemon).

129
residue (Ala) for the bulky proximal heme residues Tyr 75 and His 83 relief the heme pocket of
steric bulk of the amino acid side chains between the heme-iron and the locale of the Tyr 75 loop
and this may have precipitated sliding in and coordination of the formate ion in Y75A (Figure
11-D), and coordination of EG in H83A (Figure 12-C).
Table 2. Distances between key residues and hemin-iron
WT H83A_1 H83A_2 Y75A
Ligand Distance (Å)
His 32 Nε 2.0 2.0 2.0 2.0
Tyr 75 Oη 2.0 2.1 2.2 -
His 83 Nδ 3.9 - - 3.9
Ethylene glycol - 4.2 - -
Water - - 4.1 -
Formate - - - 2.0

130
ASP 29VAL 30GLN 36
VAL 37VAL 38-A
ASP 39-AVAL 38-B
ASP 39-BHIS 32
ARG 33-B
ARG 33-A
HEME
Y75A H83A
ASP 39-A
ASP 39-B
VAL 38-B
VAL 38-AVAL 37
HIS 32
ARG 33-A
ARG 33-B
ASN 31-A
ASN 31-BASP 29
GLN 36
HEME
ASN 80
PRO 81
SER 82
HIS 83
TRY 75
ALA 75
SER 79
PHE 78
LEU 77
THR 76
THR 84
LEU 85
TRP 86
LEU 85
THR 84
PHE 78SER 82
SER 79
ASN 80
PRO 81
TRP 86
LEU 77
TYR 75
HIS 83 ALA 83
THR 76
H32 Loops
Y75 Loops
Overall structure of HasAp mutants
The overall structure of both mutants is nearly identical to that of wild type with a few
exceptions. First, there is a gain of secondary structure elements in Y75A and in H83A crystal
form 2, in a section of the hairpin loop adjoining 6 and 7 (310-helix, colored purple in Figure
16-B and C). In contrast, electron density of residues constituting the same section of the hairpin
loop in H83A crystal form 1 is missing (marked with white asterisks in Figure 16-D). It is
Figure 15. Conformational changes in the backbone and side chains of amino acid residues that
constitute His 32 loop and Tyr 75 loop in Y75A (green) and H83A (cyan), compared to WT
(magenta).

131
interesting that a single mutation in the vicinity of hemin can induce structural gain or loss in
areas remote from the point of mutation. This suggests communication between the loop affected
(hairpin loop connecting 6 and 7) and the Tyr 75 loop, in agreement with reports involving
interaction between HasAs and its outer membrane receptor HasR [11].
The second difference which is only exhibited in the crystal structures of H83A is the loss
of beta sheet character in and/orlabeledorandcolored slate in Figure 16-C and
D). Intriguingly, the residues that constitute these regions of the protein are positioned in space to
mimic beta strands 7 and/or 5 as seen in the structure of the wild type protein (Figure 16-A). In
addition, the length of and 1 in H83A crystal form 2 is significantly reduced (Figure
16-C). These observations point to the crucial role of the hydrogen bonding interaction between
Oη of Tyr 75 and Nδ of His 83 in maintaining the overall structural integrity of the protein.

132
8
5
**
1
8
5
1
5
8
5
(A) WT (B) Y75A
(D) H83A_1(C) H83A_2
Studies with HasAs showed that the loop flanked by 6 and 7 is one of the two distinct
regions in HasAs that mediate its interactions with its cognate receptor HasR during heme
Figure 16. X-ray crystal structures of (A) WT HasAp monomer B (PDB: 3ELL), (B) Y75A, (C)
H83A crystal form 2, (D) H83A crystal form 1. Secondary structures are colored cyan (-helices),
magenta (-strands) and green (loops). 310-helices, reflecting a gain in secondary structure elements
are colored purple (Fig. B and C). 5* and 7* (Fig C and D) are new hairpin loops resulting from
loss of corresponding beta sheet character. Missing electron density is marked with white asterisks

133
delivery [8]. The other receptor binding region is a 10 amino acid stretch in 3, located behind
and directly opposite this loop. It was proposed that upon binding of the hemophore to the
receptor, the two regions move apart in a TobB-dependent manner and as a result, the heme
binding pocket might open up leading to destabilization around heme iron and iron ligands (e.g
hydrogen bond scission) and subsequent transfer of the heme to the receptor. Close inspection of
crystal structures of wild type HasAp and the Y75A and H83A mutants reveals conserved
hydrogen bonding interactions between Asn 47 (in 2), Ser 54 and Gln 55 (in 3), and Tyr 107
(in the loop adjoining 5 and 6) (Figure 17). These interactions may be important in
maintaining the loop in place and the overall structure of the protein and likely, the bonds are
broken when the hemophore is bound to the receptor to facilitate heme transfer. The gain in the
secondary structure elements in Y75A, and H83A crystal form 2 is reflected by additional
hydrogen bonding interactions between Tyr 107 (C`-end of the loop) / Asn 47 (2) pair, and Ala
102 (N`-end the loop).
Analysis of thermal factors in the structure of Y75A and H83A HasAp (summarized in
Figure 18) show that the B-factors of residues constituting the loop mentioned above (Gly 101-
Gly 106) significantly differ in the three proteins and correlate with observations made in the
crystal structures.

134
TRY 107
ALA 102GLN 55
SER 54 ASN 47
TYR 107
GLN 55
SER 54
ASN 47
TRY 107
ALA 102
GLN 55
SER 54
ASN 47
TYR 107
GLN 55
SER 54
ASN 47
WT Y75A
H83A_2 H83A_1
Figure 17. Conserved hydrogen bonding interactions involving residues in 2 (Asn 47) 3
(Ser 54, Gln 55) and the loop connecting 6 and 7 (Ala 102 and Tyr 107).

135
Residue
0 20 40 60 80 100 120 140 160 180
B-v
alu
e (A
2 )
0
10
20
30
40
Residue
0 20 40 60 80 100 120 140 160 180
B-v
alue
(A
2)
0
10
20
30
40
H83A_1
Residue
0 20 40 60 80 100 120 140 160 180
B-v
alue
(A
2 )
0
5
10
15
20
25
Y75A
G106 G101
59-64
38-40
102-105
38-40
59-64
38-4038-40
H83A_2
Figure 18. Putty representation of B-factors color traced on the structures increasing
from blue to red and corresponding per residue plots.

136
The fact that Y75A mutant has B-factors in the lower range in the above mentioned loop is
indeed surprising. Ideally, mutation of a heme coordination residue would be expected to have a
larger effect than that caused by the adjacent indirectly coordinating His 83. Two other regions of
the protein that exhibit high B factor values are Val 38-Gly 40 located toward the C-end of the
His 32 loop close to the hinge residue Gly 45 , and Lys 59-Asp 64 adjacent to 3. The regions
of the protein were shown by molecular simulations (see Figure 21 in Chapter II) to undergo
motions as the His 32 loop transitions from the open to the closed conformation. We suppose that
the thermal instability of the affected parts in the mutants originate from the heme pocket due to
disruption of the natural Tyr-His hydrogen bond.

137
Discussion
Y75A and H83A HasAp mutants were expressed and purified to homogeneity in the apo
form before reconstituting with heme to obtain the holo protein. The molecular weight estimated
by size exclusion chromatography and determined by ESI/MS revealed that both mutants are
monomeric. Assessment by UV-visible absorption spectroscopy showed that like wild type, both
mutants exist in solution as a mixture of ls and hs species. However, unlike wild type and Y75A,
H83A is pH sensitive and exhibit three pH dependent forms; a high spin species at acidic pH (pH
5.0) and a mixture of high spin and low spin species at neutral and alkaline pH. Coordination
number and spin states studies for the different forms of holo H83A in HasAs revealed that
pentacoordinate high spin species dominates at acidic pH, and as the pH is increased, the
concentration of this species decreases giving rise to hexacoordinate high-spin and low-spin
species [9]. Electronic absorption spectral features observed for H83A-HasAp are in agreement
with these spin states.
Single X-ray crystal structures of Y75A and H83A HasAp reveal a polypeptide fold
similar to that of the wild type protein. The structural integrity of the protein is maintained by
interactions within and between the secondary structure elements (-strands, -helices, turns),
and a network of water molecules surrounding the protein. Slight, yet significant, conformational
changes are observed in or close to regions of the beta sheet wall in which equivalent residues in
HasAs have been implicated to interact with the receptor HasR [8]. In particular, partial gain or
loss in the secondary structure of the hairpin loop connecting 6 and 7 (Gly 100-Tyr 107)
induced by mutation of residues proximal to the heme suggest that information is relayed
between this loop and the Tyr 75 loop.

138
Comparison of the heme binding motif between wild type and the mutant proteins shows
that substitution of Ala for the heme proximal residues induces drifting apart of the His 32 and
Tyr 72 loops and conformational rearrangement of residues constituting the His 32 loop. This
observation indicates that the conserved heme iron ligands (Tyr 75 and His 83) in wild type
protein are crucial in maintaining the architecture of the heme binding pocket. The fact that
residues in the His 32 loop are most affected relative to those in the Tyr 75 loop strongly suggests
that communication between the heme pocket and the rest of the polypeptide proceed via this
loop. Further characterization of HasAp (and its mutants) in complex with the cognate receptor
HasR is necessary to shed more light on this line of thought.
The high resolution x-ray crystal structures afforded unequivocal determination of
coordination state of the heme iron in both mutants. Under our experimental conditions, the
heme iron is hexa-coordinate. In Y75A, the sixth ligand is a formate ion while in H83A it is Tyr
75. These findings bring up two important points; i, substitution of a small amino acid residue for
any one of the heme ligands relief the binding cavity from steric cluster and in turn potential
heme ligands may bind the heme. This contradicts the argument attributing restricted
accessibility of heme to anionic ligands in wild type holo-HasAs and holo-H83A-HasAs to the
hydrophobic nature of the hemin pocket [7]. Sequence alignment of Tyr 75 loop residues of
HasAp and HasAs reveal that amino acid residues surrounding the heme pocket are pretty much
similar in both proteins. Besides, we earlier observed that holo H32A HasAp mutant also bind an
anionic ligand (cyanide) albeit weakly. ii, In the absence of Tyr 75, His 83 does not necessarily
serve as an alternate ligand but rather is coordinated to the heme iron via the intermediacy of a
ligand in the proximal site (in our case, a formate ion). This observation contradicts the proposal
that in the absence of Tyr 75, His 83 may coordinate the heme. Studies are underway to obtain

139
crystals of the Y75A mutant without the chance ion to determine if the coordination state of the
heme iron would be any different from the observations made in this study. In both crystal forms
of His 83, His 32 and Tyr 75 are not detached from the protein. Nonetheless, the nature of
molecule bound to the Oη of Tyr 75 appears to have a profound effect on the overall structure of
the protein, particularly on the beta sheet wall. There is a loss of beta sheet character in both
crystal forms; however, in the structure in which Tyr 75 is coordinated by a water molecule, the
lengths of three beta strands and a helix are significantly reduced. It is possible that the polar
interactions between Tyr and the fortuitous ions (EG) in crystal form 1 stabilizes the Tyr 75 Oη-
Fe3+ bond albeit to a lesser extent compared to the stability imparted by His 83 in the wild type
protein. Crystal structures obtained at low pH would be important to help identify the axial
ligand that ionizes during acid-base transition as depicted in the pH titration results.

140
Appendices
Appendix 1: Protein crystallization conditions-Wizard II Random Sparse Matrix
Kit# crystallant buffer (0.1 M) salt (0.2 M)
1 10% (w/v) PEG-3000 acetate pH 4.5 Zn(OAc)2
2 35% (v/v) 2-methyl-2,4-pentanediol MES pH 6.0 Li2SO4
3 20% (w/v) PEG-8000 Tris pH 8.5 MgCl2
4 2.0 M (NH4)2SO4 cacodylate pH 6.5 NaCl
5 20% (v/v) 1,4-butanediol HEPES pH 7.5 NaCl
6 10% (v/v) 2-propanol phosphate-citrate pH 4.2 Li2SO4
7 30% (w/v) PEG-3000 Tris pH 7.0 NaCl
8 10% (w/v) PEG-8000 Na/K phosphate pH 6.2 NaCl
9 2.0 M (NH4)2SO4 phosphate-citrate pH 4.2 none
10 1.0 M (NH4)2HPO4 Tris pH 8.5 none
11 10% (v/v) 2-propanol cacodylate pH 6.5 Zn(OAc)2
12 30% (v/v) PEG-400 cacodylate pH 6.5 Li2SO4
13 15% (v/v) ethanol citrate pH 5.5 Li2SO4
14 20% (w/v) PEG-1000 Na/K phosphate pH 6.2 NaCl
15 1.26 M (NH4)2SO4 HEPES pH 7.5 none
16 1.0 M sodium citrate CHES pH 9.5 none
17 2.5 M NaCl Tris pH 7.0 MgCl2
18 20% (w/v) PEG-3000 Tris pH 7.0 Ca(OAc)2
19 1.6 M NaH2PO4/0.4 M K2HPO4 phosphate-citrate pH 4.2 none
20 15% (v/v) ethanol MES pH 6.0 Zn(OAc)2

141
21 35% (v/v) 2-methyl-2,4-pentanediol acetate pH 4.5 none
22 10% (v/v) 2-propanol imidazole pH 8.0 none
23 15% (v/v) ethanol HEPES pH 7.5 MgCl2
24 30% (w/v) PEG-8000 imidazole pH 8.0 NaCl
25 35% (v/v) 2-methyl-2,4-pentanediol HEPES pH 7.5 NaCl
26 30% (v/v) PEG-400 CHES pH 9.5 none
27 10% (w/v) PEG-3000 cacodylate pH 6.5 MgCl2
28 20% (w/v) PEG-8000 MES pH 6.0 Ca(OAc)2
29 1.26 M (NH4)2SO4 CHES pH 9.5 NaCl
30 20% (v/v) 1,4-butanediol imidazole pH 8.0 Zn(OAc)2
31 1.0 M sodium citrate Tris pH 7.0 NaCl
32 20% (w/v) PEG-1000 Tris pH 8.5 none
33 1.0 M (NH4)2HPO4 citrate pH 5.5 NaCl
34 10% (w/v) PEG-8000 imidazole pH 8.0 none
35 0.8 M NaH2PO4/1.2 M K2HPO4 acetate pH 4.5 none
36 10% (w/v) PEG-3000 phosphate-citrate pH 4.2 NaCl
37 1.0 M K/Na tartrate Tris pH 7.0 Li2SO4
38 2.5 M NaCl acetate pH 4.5 Li2SO4
39 20% (w/v) PEG-8000 CAPS pH 10.5 NaCl
40 20% (w/v) PEG-3000 imidazole pH 8.0 Zn(OAc)2
41 2.0 M (NH4)2SO4 Tris pH 7.0 Li2SO4
42 30% (v/v) PEG-400 HEPES pH 7.5 NaCl
43 10% (w/v) PEG-8000 Tris pH 7.0 MgCl2

142
44 20% (w/v) PEG-1000 cacodylate pH 6.5 MgCl2
45 1.26 M (NH4)2SO4 MES pH 6.0 none
46 1.0 M (NH4)2HPO4 imidazole pH 8.0 NaCl
47 2.5 M NaCl imidazole pH 8.0 Zn(OAc)2
48 1.0 M K/Na tartrate MES pH 6.0 none
All formulations are made with ultrapure ASTM Type I water and sterile-filtered stock solutions.
Store at 4-25 ºC.
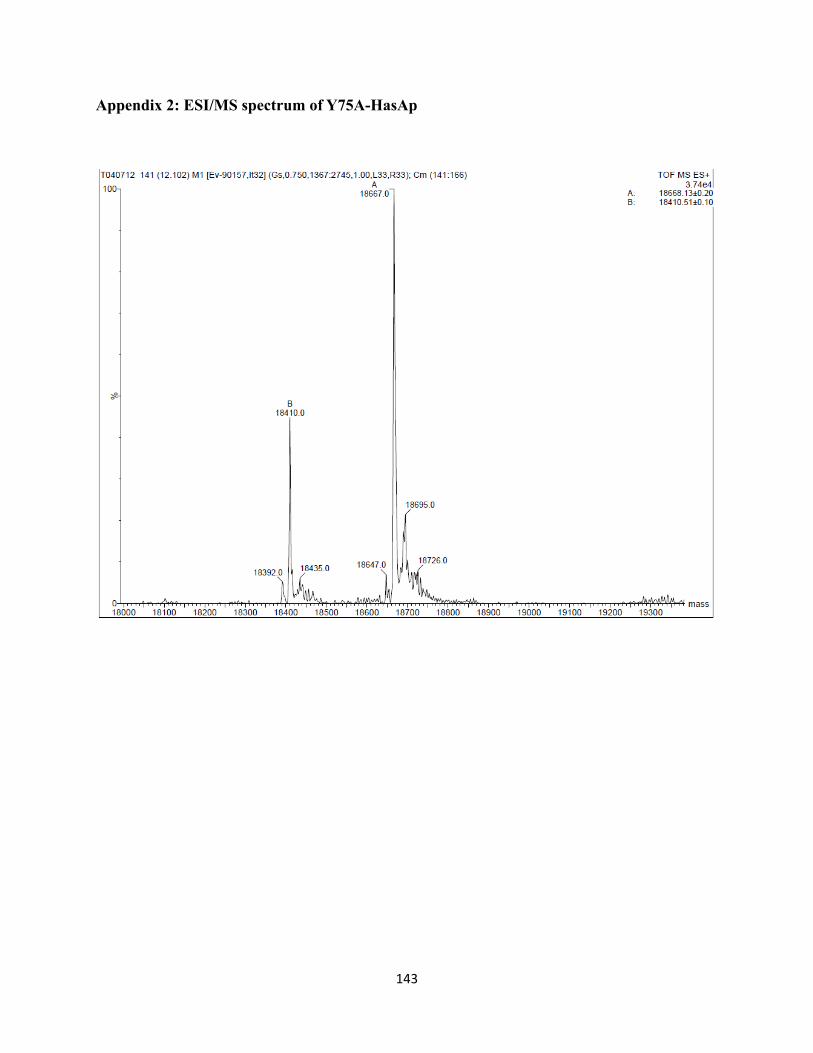
143
Appendix 2: ESI/MS spectrum of Y75A-HasAp

144
Appendix 4: ESI/MS spectrum of H83A-HasAp

145
References
1. Alontaga, A., Rodriguez, J., Schönbrunn, E., Becker, A., Funke, T., Yukl, E., Hayashi,
T., Stobaugh, J., Moënne-Loccoz, P., and Rivera, M., Structural Characterization of the Hemophore HasAp from Pseudomonas aeruginosa: NMR Spectroscopy Reveals Protein-Protein Interactions between Holo-HasAp and Hemoglobin. Biochemistry, 2009. 48: p. 96-109.
2. Arnoux, P., Haser, R., Izadi, N., Lecroisey, A., Delepierre, M., Wandersman, C., and
Czjzek, M. The Crystal structure of HasA, a hemophore secreted by Serratia marcescens. Nat. Struct. Biol., 1999. 6: p. 516-520.
3. Wolff, N., Deniau, C., Letoffe, S., Simenel, C., Kumar, V., Stojiljkovic, I., Wandersman,
C., Delepierre, M., and Lecroisey, A. Histidine pKa shifts changes of tautomeric states induced the binding of gallium-protoporphyrin IX in the hemophore HasAsm. Protein Sci., 2002. 11: p. 757-765.
4. Caillet-Saguy, C., Delepierre, M., Lecroisey, A., Bertini, I., Piccioli, M., and Turano, P.
Direct-Detected 13C NMR to Investigate the Iron(III) Hemophore HasA. J. Am. Chem. Soc., 2006. 128: p. 150-158.
5. Jepkorir, G., Rodríguez, J.C., Rui, H., Im, W., Lovell, S., Battaile, K.P., Alontaga, A.Y.,
Yukl, E.T., Moënne-Loccoz P., and Rivera, M., Structural, NMR Spectroscopic, and Computational Investigation of Hemin Loading in the Hemophore HasAp from Pseudomonas aeruginosa. J., Am Chem Soc., 2010. 132: p. 9857-9872.
6. Wolff, N., Izadi, N., Couprie, J., Habeck, M., Linge, J., Rieping, W., Wandersman, C.,
Nilges, M., Delepierre, M., and Lecroisey, A., Comparative analysis of structural and dynamic properties of the loaded and unloaded hemophore HasA: functional implications. J. Mol. Biol., 2008. 376: p. 517-525.
7. Deniau, C., Gilli. R., Izadi, N., Létoffé, S., Delepierre, M., Wandersman, C., Briand, C.,
Lecroisey, A., Thermodynamics of heme binding to the HasA(SM) hemophore: effect of mutations at three key residues for heme uptake. Biochemistry, 2003. 42: p. 10627-10633.
8. Letoffe, S., Deniau, C., Wolff, N., Dassa, E., Delepelaire, P., Lecroisey, A., and
Wandersman, C. Haemophore-mediated bacterial haem transport: evidence for a common or overlapping site for haem-free and haem-loaded haemophore on its specific outer membrane receptor. Mol. Microbiol., 2001. 41: p. 439-450.
9. Caillet-Saguy, C., Turano, P., Piccioli, M., Lukat-Rodgers, G. S., Czjzek, M.,
Guigliarelli, B., Izadi-Pruneyre, N., Rodgers, K. R., Delepierre, M., and Lecroisey, A.,

146
Deciphering the structural role of histidine 83 for heme binding in hemophore HasA. J Biol Chem., 2008. 283: p. 5960-5970.
10. Lukat-Rodgers, G. S., Rodgers, K. R., Caillet-Saguy, C., Izadi-Pruneyre, N., Lecroisey, A., Novel heme ligand displacement by CO in the soluble hemophore HasA and its proximal ligand mutants: implications for heme uptake and release. Biochemistry, 2008. 47: p. 2087-2098.
11. Krieg, S., Huche´, F., Diederichs, K., Izadi-Pruneyre, N., Lecroisey, A., Wandersman, C., Delepelaire, P., and Welte, W., Heme uptake across the outer membrane as revealed by crystal structures of the receptor-hemophore complex. Proc. Natl. Acad. Sci. U.S.A., 2009. 106: p. 1045-1050.
12. Ishikawa, K., Takeuchi, N., Takahashi, S., Matera, K. M., Sato, M., Shibahara, S., Rousseau, D. L., Ikeda-Saito, M., and Yoshida, T., Heme Oxygenase-2 properties of the heme complex of the purified tryptic fragment of recombinant human heme oxygenase-2. J. Biol. Chem., 1995. 270: p. 6345-6350.
13. Falk, J. E., 1963 Part A: pyrrole pigments: chemistry and biochemistry of porphyrins and metalloporphyrins, p. 3–33. In M. Florkin, and E. H. Stotz (ed.), Comprehensive biochemistry. 9. Elsevier Publishing Company, Amsterdam.
14. Kabsch, W., Automatic indexing of rotation diffraction patterns. Journal of Applied
Crystallography, 1988. 21: p. 67-72. 15. Evans, P., Scaling and assessment of data quality. Acta Crystallogr D Biol Crystallogr,
2006. 62: p. 72-82. 16. Vagin, A. A., and Teplyakov, A., MOLREP: an Automated Program for Molecular
Replacement J. Appl. Cryst., 1997. 30: p. 1022-1025. 17. Adams, P.D., et al., PHENIX: a comprehensive Python-based system for macromolecular
structure solution. Acta Crystallogr D Biol Crystallogr, 2010. 66: p. 213-221. 18. Emsley, P. and K. Cowtan, Coot: model-building tools for molecular graphics. Acta
Crystallogr D Biol Crystallogr, 2004. 60: p. 2126-2132. 19. Lovell, S.C., et al., Structure validation by Calpha geometry: phi,psi and Cbeta
deviation. Proteins, 2003. 50: p. 437-450. 20. Potterton, L., et al., Developments in the CCP4 molecular-graphics project. Acta
Crystallogr D Biol Crystallogr, 2004. 60: p. 2288-2294. 21. The PyMOL Molecular Graphics System, Version 1.3, Schrödinger, LLC.

147
22. Chayen, N. E., and Saridakis, E., Protein crystallization: from purified protein to
diffraction-quality crystal. Nature methods, 2008. 5: p. 147-153. 23. McPherson, A., Introduction to protein crystallization. Methods, 2004. 34: p. 254-265. 24. Chayen, N. E., Methods for separating nucleation and growth in protein crystallization.
2005. Protein Crystallisation, 2005. 88: p. 329-337. 25. Thaku, A. S., et al, Improved Success of Sparse Matrix Protein Crystallization Screening
with Heterogeneous Nucleating Agents. PLoS ONE, 2007. 2: e1091

148
CHAPTER IV
Methemalbumin is the potential target for the hemophore HasAp as a heme
source; inferences from heme transfer studies
Introduction
Requirement for iron by invading microbial organisms is a necessity for growth and for
successful colonization of mammalian host cells [1]. However, the human host presents a hostile,
iron restrictive environment to bacterial invaders [2]. Free iron is toxic to the cells and hence it is
often sequestered by iron-binding proteins, or globins, or is sequestered within the cytoplasm of
cells in the form of iron-sulfur clusters, cytochromes or as iron mineral in iron storage enzymes
[3,4]. The binding affinity of iron to these proteins is so high that the amount of free iron
available (< 10-18 M) is significantly below the minimum concentration required for bacterial
growth [5]. Accordingly, bacteria have evolved sophisticated mechanisms to sequester this
important element from these sources and thus fulfill their nutritional requirement.
One of the mechanisms employed by the opportunistic pathogen Pseudomonas
aeruginosa to acquire iron is secretion of a hemophore (HasAp) to the extracellular milieu which
binds hemin (free or globin-bound) and delivers it to the cognate outer membrane receptor
(HasR) for subsequent internalization [6]. Once in the cytosol, hemin is thought to be degraded
by heme oxygenase (pa-HO) to release iron, making the nutrient available to bacteria [7,8].
However, like free iron, heme and heme carrier proteins particularly hemoglobin (outside the
constraints of the red blood cells) are toxic substances and mammalian organisms have evolved
committed molecular pathways to ensure rapid removal once they appear in plasma [9, 10]. Two

149
major host defense systems that work hand in hand are (i) hemoglobin-binding haptoglobin (Hp)
and its cognate receptor CD163 [11], and (ii) hemin-binding hemopexin (HPX) and the low
density lipoprotein receptor-related protein/LRP1 [12, 13, 14]. Under normal circumstances, the
heterotetrameric glycoprotein Hp binds hemoglobin dimers in a 1:1 stoichiometry to form stable
nontoxic complexes [15] of very high affinity (Kd = 10-23 M) which are then cleared from
circulation via receptor mediated endocytosis [16,17,18]. In situations with pronounced
hemolysis, though (as is the case during bacterial infection), the amount of free hemoglobin in
plasma overwhelms the binding capacity of Hp, and thus the excess hemoglobin rapidly
autoxidizes and spontaneously liberates the heme. Kinetic analysis of time-dependent hemin
distribution in plasma proteins show that within the first seconds after hemin appears in plasma,
more than 80 % of total hemin binds initially to the oxidatively intolerant lipoproteins (low
density lipoprotein, LDL and high density lipoprotein, HDL), and only 20 % binds to the
antioxidants human serum albumin (HSA) and hemopexin (HPX) [19]. Over time, hemin
molecules bound to lipoproteins partially transfer to HSA and HPX. HSA is the most abundant
serum protein (35-55 mg/ mL) and only acts as a transient depot before hemin is transferred to
the carrier protein HPX (0.5-1.2 mg/mL) for subsequent removal from circulation [20,21]. Given
its abundance in plasma and the comparatively weak association of HSA with heme (HSA; Kd =
10-8 M, HPX; Kd = 10-12M) [22], it is probable that increase of hemin plasma levels under
pathological conditions could saturate the carrier hemoprotein HPX leaving substantial amount
of hemin in the reservoir HSA accessible to invading microbes. These, taken together, made us
postulate that methemalbumin (heme loaded serum albumin) is a probable target for HasAp as a
heme source when p. aeruginosa is faced with limiting iron conditions.

150
To date, hemin acquisition by hemophores has mainly focused on hemoglobin as a heme
source. The extensively characterized hemophore from S.marcescens HasAs is able to use
hemoglobin-heme as an iron source [23]. Similarly, HasAp from P.aeruginosa and HasAyp from
Y. pestis produced in E.coli are able to acquire heme from hemoglobin [24,25]. The hemophore
system described in H.influenzae Type b, HxuA, which does not share sequence similarity with
HasAs, is able to assimilate heme from the serum glycoprotein HPX and shuttle it to a specific
outer membrane receptor [26]. In this study, we demonstrate for the first time that the hemophore
HasAp from p.aeruginosa is able to acquire hemin from serum albumin. The mechanism of
hemin binding and/or transfer remains to be investigated.
Experimental Procedures
Expression and Purification of apo-HasAp
Expression and purification of apo-HasAp was carried out as described in the
experimental section of chapter 2. Briefly, a single colony of freshly transformed E.coli BL21
(DE3) cells were cultured overnight in 50 mL LB-medium containing 100 g/mL ampicillin. 30
mL of this starter culture was diluted in 1 L M9 medium supplemented with 100 g/mL
ampicillin and grown until OD600 reached approximately 1. Polypeptide synthesis was induced
by addition of isopropyl--D-thiogalactopyranoside (IPTG) to a final concentration of 1 mM
before the cells were grow for an additional 5 h, pelleted by centrifugation (4800 rpm, 12 min,
and 4 0C) and stored in -20 0C. Cell lysis and protein purification were carried out as detailed in
chapter II.

151
Preparation of Human Serum Albumin (HSA)
A lyophilized sample of “globin and fatty-acid” free human serum albumin (Sigma
Aldrich) was dissolved in 50 mM sodium phosphate buffer, pH 7.4. The concentration of the apo
protein was estimated spectrophotometrically using Ɛ280 = 36.5 mM-1cm-1 [27]. Immediately, the
sample was titrated with 1 mM stock solution of freshly prepared heme in DMSO to a final ratio
of 1:1.2 [28]; the total amount of heme in DMSO in the resultant solution was < 0.9 % (V/V).
After an overnight incubation at 4 0C, the HSA-hemin complex (methemalbumin) solution was
concentrated using 50 kDa MWCO Amicon ultracentrifuge filter units (Millipore) and passed
through a gel filtration column (Sephadex G-75 superfine, GEHealthcare) pre-equilibrated with
50 mM sodium phosphate buffer pH 7.0. The purity of the sample was assessed by sodium
dodecyl sulfate polyacrylamide gel electrophoresis (SDS-PAGE) and pure fractions were
concentrated and kept frozen in -20 0C until needed.
Quantitation of heme in methemalbumin
The amount of hemin incorporated into the protein was determined as pyridine
hemochromes using = 20.7 mM-1cm-1 [29]. Concisely, 200 L of neat pyridine was added to 6
M of methemalbumin dissolved in 800 L sodium phosphate buffer, pH 7.4, then the resultant
solution was divided into two half parts. A few grains of sodium dithionite was added to one of
the solutions and dissolved by gentle agitation of the cuvette to avoid aerating the solution.
Immediately, readings were taken at the expected -maximum (557 nm), then at the maximum a
little more dithionite was added. If the absorbance at the maximum increased, the process was
rapidly repeated until there was no further increase. The absorbance intensity of the reduced

152
hemochrome was then recorded at 557 nm. To the other half, 15 L of 1 mM K3Fe(CN)6 was
added, mixed gently, then the absorbance intensity at the minimum (541 nm) was recorded.
Concentration of hemin was determined using and the magnitude of the difference in
absorbance intensity between reduced and oxidized hemochrome.
Hemen transfer assays
To determine whether apo-HasAp can capture hemin from methemalbumin, hemin
transfer assay was done as follows: Methemalbumin (10 µM) was incubated with constant
stirring at 37 0C in 50 mM sodium phosphate buffer pH 7.0. After 5-10 minutes, equimolar
amount (or 4-8 fold excess) of apo-HasAp was added and the reaction was monitored as a
function of time. Changes in absorbance measurements were performed on UV-vis
spectrophotometer at various time intervals after mixing or alternatively the evolution or decay
of absorbance at fixed wavelengths was monitored. Rates of hemin transfer were measured by
fitting a double exponent curve to observed decay in absorbance at 500 nm and 535 nm or to the
observed growth of a peak at 618 nm (corresponding to evolution of a CT band of holo-HasAp).
Evaluation of heme transfer by polyacrylamide gel electrophoresis (PAGE)
The reaction mixture was analyzed by nondenaturing-PAGE to allow complete separation
and identification of the reaction products. In this case, aliquots were taken at certain time
intervals as the reaction progressed, immediately flash frozen in liquid nitrogen, and thawed just
before being loaded onto the gel. Two matching gels were run concurrently and assessed for the
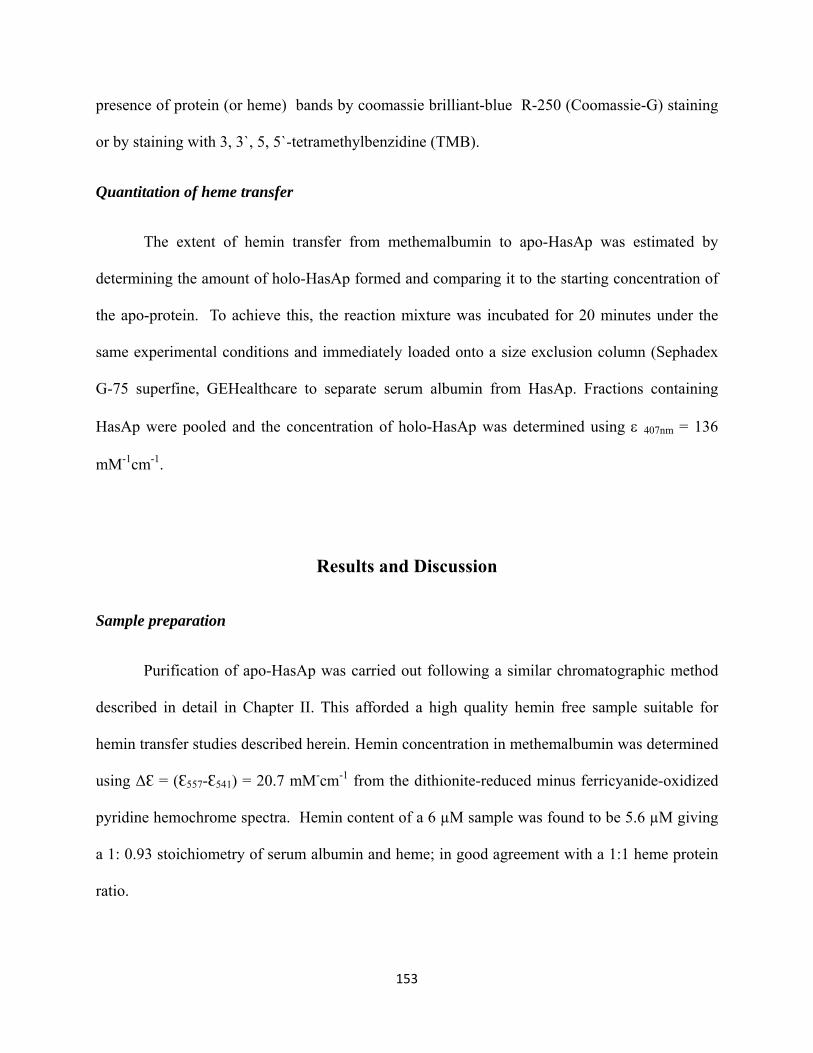
153
presence of protein (or heme) bands by coomassie brilliant-blue R-250 (Coomassie-G) staining
or by staining with 3, 3`, 5, 5`-tetramethylbenzidine (TMB).
Quantitation of heme transfer
The extent of hemin transfer from methemalbumin to apo-HasAp was estimated by
determining the amount of holo-HasAp formed and comparing it to the starting concentration of
the apo-protein. To achieve this, the reaction mixture was incubated for 20 minutes under the
same experimental conditions and immediately loaded onto a size exclusion column (Sephadex
G-75 superfine, GEHealthcare to separate serum albumin from HasAp. Fractions containing
HasAp were pooled and the concentration of holo-HasAp was determined using 407nm = 136
mM-1cm-1.
Results and Discussion
Sample preparation
Purification of apo-HasAp was carried out following a similar chromatographic method
described in detail in Chapter II. This afforded a high quality hemin free sample suitable for
hemin transfer studies described herein. Hemin concentration in methemalbumin was determined
using ΔƐ = (Ɛ557-Ɛ541) = 20.7 mM-cm-1 from the dithionite-reduced minus ferricyanide-oxidized
pyridine hemochrome spectra. Hemin content of a 6 µM sample was found to be 5.6 µM giving
a 1: 0.93 stoichiometry of serum albumin and heme; in good agreement with a 1:1 heme protein
ratio.

154
Spectroscopic changes observed upon incubation of apo-HasAp with methemalbumin
Electronic absorption spectra of methemalbumin and holo-HasAp recorded at pH 7.0 are
shown in Figure 1. The spectra are very distinct in the visible region; methemalbumin absorbs at
404, 500, 535, and 623 nm, while holo-HasAp absorbs at 407, 504, 537, 574 and 618 nm. The
differences in the electronic absorption signature of the two proteins are useful in tracking hemin
as it exchanges between the two proteins in solution.
When methemalbumin is incubated with four-fold excess apo-HasAp (Figure 2), absorbance at
500 and 535 nm dramatically decreases. The decay in these peaks corresponds to decrease in the
absorbance of methemalbumin-heme as the heme is transferred to apo-HasAp. Formation of
holo-HasAp is evidenced by concomitant blue shift of the charge transfer band at 623 nm leading
to accumulation of a species absorbing at 618 nm. The latter has been identified as an
intermediate holo-HasAp species whereby the heme is loaded onto the Tyr 75 loop before the
distal ligand coordinates (appearance of a peak at 574 nm) at the sixth position. In the soret
region, the absorbance band red shifts from 404 to 407 nm, and becomes narrower and more
intense as the reaction progresses. This is indicative of accumulation of hexacoordinate holo-
HasAp in solution. A clear isosbestic point at 393 nm reveal that only two species are present in
solution namely; unreacted methemalbumin and holo-HasAp. The fact that we do not see any
baseline drift as the reaction progresses indicates that heme released from methemalbumin is not
accumulating in solution to detectable levels but rather rapidly binds apo-HasAp.

155
Wavelength (nm)
500 550 600 650 700
Wavelength (nm)
250 300 350 400
Abs
orb
anc
e
0.0
0.2
0.4
0.6
0.8
1.0
1.2
500
404 > 407
535
618 < 623574
5X
Superposition of the reaction product (red trace) and HasAp reconstituted with free heme
(black trace) is shown in Figure 3. Clearly, the spectra are nearly identical except for the
difference in intensity of the soret band. Three different sets of experiments where temperature,
apo-HasAp concentration or incubation time were varied yielded similar results. This suggests
Figure 1. UV-vis spectra of methemalbumin (black), and holo-HasAp (red).
Figure 2. A family of electronic absorption spectra of methemalbumin (~10 M) incubated with apo-
HasAp (40 M) at 37 o
C recorded as a function of time. Arrows show the direction of spectral changes as
the reaction progress.
Wavelength
250 300 350 400
Ab
sorb
ance
0.0
0.2
0.4
0.6
0.8
1.0
Wavelength
500 550 600 650 700

156
that the significant attenuation of the Soret band is not dependent on these experimental
parameters but likely a reflection of changes in properties intrinsic to the protein. To pursue this
notion, the reaction mixture was passed through a gel filtration column to separate the reaction
products (Figure 4) then the molar absorptivity of holo-HasAp was determined by Beers law
using absorbance intensity of the isolated holo-HasAp fraction and the concentration of
corresponding reduced pyridine-hemochromes. Interestingly, absorption coefficient of holo-
HasAp separated from the reaction mixture is comparatively lower (407 = 136 mM-1cm-1) than
that of HasAp reconstituted with free heme in solution (407 = 169 mM-1cm-1); it follows then that
at similar concentrations, the two samples would exhibit different intensities at the soret region
as seen in Figure 3. Based on these observations, we conclude that the local environment of
hemin in HasAp is different when the protein acquires hemin from hemoproteins and when it is
reconstituted with free heme.
Wavelength
250 300 350 400
Abs
orba
nce
0.0
0.2
0.4
0.6
0.8
1.0
1.2
1.4
1.6
Wavelength
500 550 600 650 700
Holo-HasAp
Reaction product
Methemalbumin
Figure 3. UV-Vis spectra of the reaction product (red) and holo-HasAp (black) with similar
concentrations. The spectrum of methemalbumin (blue) is shown for reference.

157
Heme uptake by apo-HasAp correlates with heme loss from methemalbumin
The affinity of heme for HasA (Ka = 5.3 X 10¹⁰ M-1) [30], which shares 50 % similarity
with HasAp is relatively higher than that of serum albumin (Ka = 1.1 X 10⁷-8 M-1) [31,32]. When
equimolar mixture of apo-HasAp and serum albumin is titrated with free heme in solution, hemin
preferentially binds the former, in good agreement with the reported affinities. Figures 5 and
Figure 6 shows representative plots of changes in absorbance at the soret and at the visible region
recorded as a function of time when methemalbumin and apo-HasAp were incubated in a 1: 4
molar ratio, respectively. As shown, transfer occurs in a biphasic mode. The fast phase, depicted
by loss of hemin from methemalbumin (decay in absorbance at 500 and 535 nm peaks), occurs
concurrently with heme uptake by apo-HasAp and accumulation of species absorbing at 618 nm,
Fraction #
10 20 30 40 50
Abs
orb
anc
e
0.0
0.5
1.0
1.5
2.0
2.5
Figure 4. Elution profile of serum albumin and HasAp from a Sephadex G-75 column;
blue circles track A280nm while red circles track the soret.

158
(Figure 6) and rapid increase in absorbance at 407 nm, (Figure 5).The species absorbing at 618
Time (mins)
0 5 10 15 20 25 30 35
Abs
@ 5
00 n
m
0.185
0.190
0.195
0.200
0.205
0.210
0.215
0.220
0.225
Abs
@ 5
35 n
m
0.15
0.16
0.17
0.18
0.19
0.20
0.21
Abs
@ 5
74 n
m
0.120
0.122
0.124
0.126
0.128
0.130
0.132
0.134
Abs
@ 6
18 n
m
0.114
0.116
0.118
0.120
0.122
0.124
0.126
0.128
0.130
0.132
0.134
Time(min) vs abs @ 500 nm Time(min) vs abs @ 535 nm Time(min) vs abs @ 574 nmTime(min) vs abs @ 618 nm
Time (min)
0 5 10 15 20 25 30
ab
sorb
ance
at
407
nm
0.00
0.05
0.10
0.15
0.20
0.25
Figure 5. A plot showing changes in absorbance at 407 nm when methemalbumin is incubated
with 4-fold excess apo-HasAp with constant stirring at 37 oC.
Figure 6. A plot showing absorbance changes occurring in the visible region when
methemalbumin was incubated with four-fold apo-HasAp. The reaction was monitored as a
function of time at 500, 535, 574, and 618 nm.

159
which has been identified as an intermediate heme-HasAp complex whereby heme is loaded onto
the Tyr 75 loop [33].The slow phase which occurs around 10 min after the onset of the
experiment corresponds to coordination of hemin-iron at the sixth position by His 32. This is
corroborated by the near linear absorbance changes occurring at 574 nm (blue circles) which
gradually increases for about 20 min before it levels off when the HasAp species is
hexacoordinated. The fact that hemin loss from methemalbumin and up-take by apo-HasAp
occur concomitantly suggests two possibilities; (i) that the transfer involves protein-protein
interaction (PPI) whereby apo-HasAp favorably interacts with methemalbumin and “steals”
heme, in an activated complex, or (ii) PPI induces conformational changes in the secondary
structure of methemalbumin releasing the macrocycle, which in turn, is rapidly consumed by
apo-HasAp. A double exponential function fitted to experimental data (absorbance at 618 nm in
Figure 7) reveals that the rate of hemin uptake by apo-HasAp (k-1 = 0.1939 min-1) is comparable
to that of hemin dissociation from methemalbumin in aqueous media (K-1 = 0.198 min-1) [34].
Although low protein concentrations used in this experiment (at most 40 M) do not mimic that
in a host cell, these results do not favor hemin transfer in an activated complex; otherwise the
observed rate of hemin release from methemalbumin would be higher. It therefore appears that
hemin transfer is passive and the rapid up-take by apo-HasAp is affinity driven. More studies
need to be done to elucidate the mechanism of transfer under conditions that closely mimic the
host cell.
From the UV-Vis data, it can be concluded that HasAp can capture hemin from
methemalbumin and that the latter is the potential target for the homophore when bacteria is
faced with limiting iron conditions in the host cell. Complementary data were obtained by gel
electrophoresis.

160
Evaluation of heme transfer by PAGE.
Electrophoresis was used as an alternative method to separate the reaction products. The
advantage of this method lies in the possibility to tweak the composition of the gel in order to
improve resolution of components in the reaction mixture, as well as do multiple sample analysis
using much smaller sample quantities. In a nondenaturing polyacrylamide gel, samples are
separated based on both size and charge. Besides, hemophores migrate without dissociating from
heme and thus the apo and holo form of the protein can be resolved.
Figure 7 shows results obtained from a reaction mixture of apo-HasAp and
methemalbumin incubated for 2, 5, 10, 20, 30, 60 min and run in 13 % native polyacrylamide
gel. Figure 8-A is a picture of the gel taken immediately following the run before staining. Only
two sets of bands corresponding to serum albumin and HasAp are seen. Whereas the intensity of
HSA band decreases across the gel, that of HasAp increases. This implies that these bands
correspond to the hemin-bound proteins whereby the concentration of methemalbumin decreases
over time as hemin is being transferred to HasAp. The approximate time around which the
reaction is complete was best estimated from the stained gels.
Heme staining using tetramethylbenzidine (TMB) (Figure 7-B), reveals high molecular
weight bands corresponding to hemin-bound HSA. The intensity of these bands decreases
drastically after 10 minutes and completely disappears between 10 and 20 minutes; in agreement
with the UV-vis data where heme loss from the hemoprotein and subsequent binding to the Tyr
75 loop in HasAp occurs within the first 10 minutes. TMB is specific for peroxidases and so
even if substantial amount of nascent holo-HasAp accumulates during the reaction, heme in

161
HasAp could not be stained to any detectable extent at these concentrations. Saturating amounts
of holo-HasAp reconstituted with free heme (lane C` in Figure 7-B) was used as a control.
The most interesting result is depicted in Figure 7-C where three intense and well
resolved sets of proteins bands are observed in Coomassie brilliant blue R-250 (Coomassie G)
stained gel. Both heme-loaded and heme-free serum albumin could not be resolved and thus
travel the same distance in the gel. In the case of HasAp, the presence of hemin caused a
significant increase in the electrophoretic mobility of heme-bound fraction allowing complete
separation of the apo and holo forms. The intensity of the holo-HasAp band reaches the
maximum in about 10 minutes and does not change thereafter; in contrast, that of the apo-form
seem to be consistent throughout the reaction time. This is because an excess of apo-HasAp was
used with the intent of pushing the equilibrium toward formation of the products. To present
these results more clearly, the same experiment was repeated under similar conditions but using
equimolar amounts of proteins. Apo-HasAp protein bands (Figure 8-A) diminish drastically after
7 min and almost disappears completely in 12 min. A matching SDS gel (Figure 8-B), shows that
intact serum albumin and HasAp subunits are present in solution and there is no indication of
protein degradation or aggregation. The more intense HSA bands, albeit of the same
concentration as HasAp was due to the difference in the proportion of basic amino acids (lysines,
arginines and histidines) in the two proteins that bind Coomassie G dye molecules [35]; HSA has
five times the number of these amino acid residues relative to HasAp and therefore stains better.
Figure 9 shows an elution profile of the reaction mixture passed over a gel filtration column
following 10 min incubation. Taking into account any protein loss, nearly 80 % heme transfers to
HasAp.

162
holo-HSA
4 fold holo-HasAp
A
B
HSA
HasAp
Dye-front
C 2 5 10 20 30 60 C` Incubation time (min)
C
HSA
apo-HasAp
holo-HasAp
Figure 7. 13 % native polyacrylamide gel showing the reaction products obtained from a
mixture of apo-HasAp and methemalbumin incubated for 2, 5, 10, 20, 30, 60 min at 37 oC.
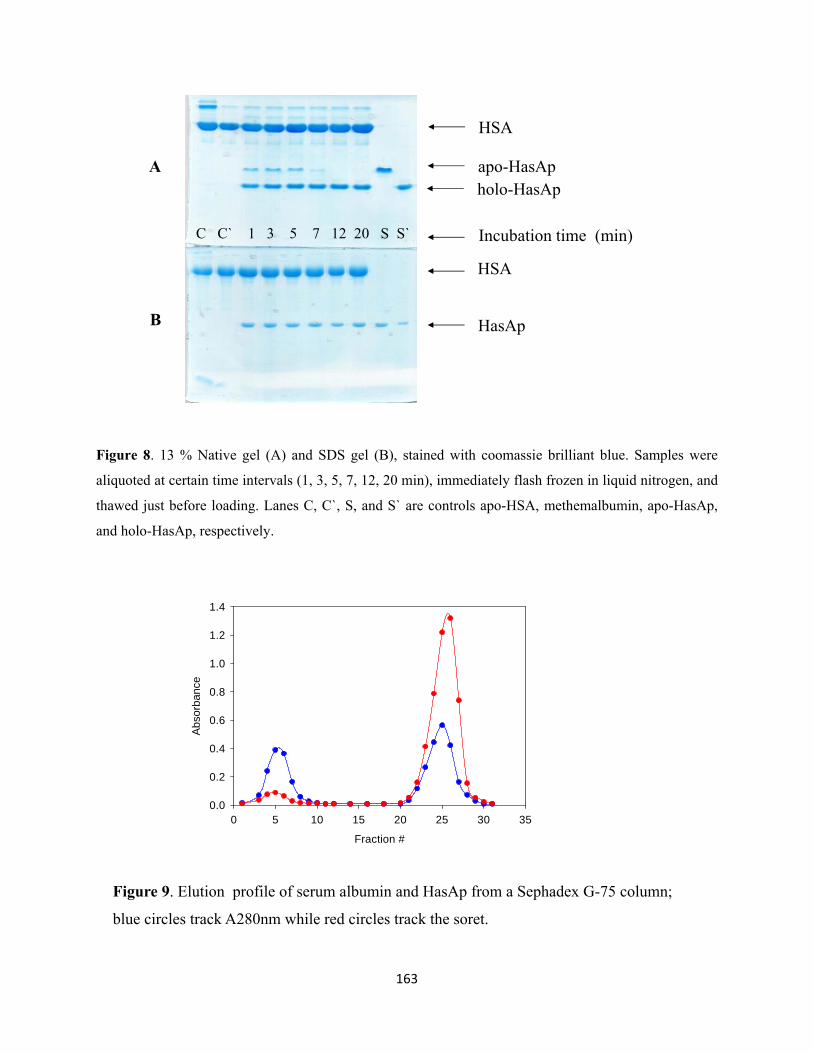
163
A
B HasAp
C C` 1 3 5 7 12 20 S S`
HSA
apo-HasApholo-HasAp
HSA
Incubation time (min)
Figure 8. 13 % Native gel (A) and SDS gel (B), stained with coomassie brilliant blue. Samples were
aliquoted at certain time intervals (1, 3, 5, 7, 12, 20 min), immediately flash frozen in liquid nitrogen, and
thawed just before loading. Lanes C, C`, S, and S` are controls apo-HSA, methemalbumin, apo-HasAp,
and holo-HasAp, respectively.
Figure 9. Elution profile of serum albumin and HasAp from a Sephadex G-75 column;
blue circles track A280nm while red circles track the soret.
Fraction #
0 5 10 15 20 25 30 35
Ab
sorb
ance
0.0
0.2
0.4
0.6
0.8
1.0
1.2
1.4

164
Heme transfer from methemalbumin to H32A-HasAp mutant.
A similar experiment but using H32A variant in place of wild type protein was conducted
to determine whether the mutant can sequester heme from methemalbumin. UV-vis data (Figure
10) reveal conceivable changes in absorbance spectra when the two proteins are incubated with
constant stirring. However, it is not possible to explicitly track hemin exchange between the two
proteins because the holo-forms absorb around the same wavelengths. What is clear is that the
soret band blue shifts from 404 nm (lamda max of methemalbumin) to 402 nm (lamda max of
H32A-HasAp monomer), while the charge transfer band shifts to a higher wavelength (630 nm).
As described in chapter II, monomeric H32A-HasAp, soret and charge transfer bands are at 402
and 621 nm, while those of the dimer absorb at 400 and 623 nm, respectively. In the nascent
holo-H32A-HasAp species observed in the reaction mixture, the soret band matches that of the
monomer while the charge transfer band does not match any of the two species. Thus, unlike the
protein reconstituted with free heme, it is not possible to simply identify the species in solution
by UV-vis spectroscopy when heme is acquired from methemalbumin. To further characterize
this specie, the reaction mixture was passed over a high resolution gel filtration column
(Superdex G-75 Superfine) calibrated with conalbumin, ovalbumin, carbonic anhydrase, and
ribonuclease A protein standards. Using elution volume of isolated holo-H32A-HasAp (Ve = 98
mL) and the calibration curve, the molecular weight of holo-H32A-HasAp was determined to be
21.7 kDa, thus it is a monomeric species (Figure 11). UV-vis spectra of pooled holo-H32A-
HasAp fractions and holo-H32A-HasAp monomeric sample reconstituted with free heme in
solution match, in good agreement with the gel filtration data.

165
Wavelength (nm)
250 300 350 400
Ab
sorb
ance
0.0
0.2
0.4
0.6
0.8
1.0
1.2
Wavelength (nm)
0 500 550 600 650 700
623 > 630
402 < 404
Ve (mL)
60 80 100 120
log
MW
0.8
1.0
1.2
1.4
1.6
1.8
2.0
2.2
Ribonuclease A
HSA Carbonic anhydrase
Ovalbumin
H32A-HasAp
Conalbumin
Figure 10. UV-Vis spectra of the reaction product (red) and holo-HasAp (black) with similar
concentrations. The initial spectrum spectrum of methemalbumin (blue) is shown for reference.
Figure 11. Elution volumes (Ve) from a calibrated Superdex 75 column and estimated molecular
weights for the reaction products obtained from a reaction mixture of methemalbumin and apo-
H32A-HasAp: holo-H32A-HasAp (21 kDa, green diamond), and serum albumin ( 63 kDa, red
triangle). The Superdex 75 column was calibrated with ribonuclease A (75 kDa), Carbonic
anhydrase (44 kDa), ovalbumin (29 kDa), and conalbumin (13 kDa) shown in black filled circles.

166
It therefore appears that before the reaction products are isolated, coordination of heme in the
mutant is different from that of the established monomer or dimer when this mutant binds free
heme in solution. It is possible that since the distal heme iron ligand (His 32) is missing in the
mutant, heme coordination ligands in nascent holo-H32A in the reaction mixture are contributed
by both proteins. Time dependent crystallographic studies would be useful to establish possible
interaction sites between HasAp and methemalbumin and to elucidate the coordination state of
the heme iron.

167
References
1. Bullen, J. J., The significance of iron in infection. Rev Infect Dis, 1981. 3: p. 1127-1138. 2. Weinberg, E. D., Iron withholding: a defence against infection and neoplasia. Physiol
Rev, 1984. 64: p. 65-102. 3. Wagener, F. A., Volk, H. D., Willis, D., Abraham, N. G., Soares, M. P., Adema, G.J., and
Figdor, C.G., Different faces of the hemeheme oxygenase system in inflammation. Pharmacol Rev, 2003. 55: p. 551-571.
4. Arosio, P., and Levi. S., Ferritin, iron homeostasis, and oxidative damage. Free Radic
Biol Med, 2002. 33: p. 457-463. 5. Braun, V., and Killmann, H., Bacterial solutions to the iron-supply problem. Trends
Biochem Sci, 1999. 24: p. 104-109. 6. Ghigo, J. M., Letoffe, S. and Wandersman, C. A new type of hemophore-dependent heme
acquisition system of Serratia marcescens reconstituted in Eschericia coli. J. Bacteriol. 1997. 179: p. 3572-3579.
7. Tenhunen, R., Marver, H., Pimstone, N. R., Trager, W. F., Cooper, D. Y., and Schmid,
R., Enzymatic Degradation of Heme. Oxygenative Cleavage Requiring Cytochrome P-450. Biochemistry, 1972. 11: p. 1716-1720.
8. Ortiz de Montellano, P.R., and Wilks, A., Heme Oxygenase Structure and Mechanism.
Adv. Inorg. Chem., 2000. 51: p. 359-402.
9. Grinberg, L. N., O'Brien, P. J., and Hrkal, Z., The effects of heme-binding proteins on the peroxidative and catalytic activities of heroin. Free Radic Biol Med, 1999. 27: p. 214-219.
10. Gutteridge, J. M., and Smith, A., Antioxidant protection by haemopexin of haem-
sumulated lipid peroxidation. Biochem J, 1988. 256: p. 861-865.
11. Kristiansen, M., Graversen, J. H., Jacobsen, C., Sonase, O., Hoffman, H. J., Law, S. K., and Moestrup, S. K., Identification of the haemoglobin scavenger receptor. Nature, 2001. 409: p. 198-201.
12. Boucher, P., Gotthard, M., Li, W. P., Anderson, R. G., and Herz, J., LRP: role in vascular wall integrity and protection from atherosclerosis. Science, 2003. 300: p. 329-032.

168
13. Hvidberg, V., Maniecki, M. B., Jacobsen, C., Hojrup, P., Moller, H.J., and Moestrup,
S.K., Identification of the receptor scavenging hemopexin-heme complexes. Blood, 2005. 106: p. 2572-2579.
14. Lillis, A. P., Mikhailenko, I., and Strickland, D. K., Beyond endocytosis: LRP function in
cell migration, proliferation and vascular permeability. J Thromb Haemost, 2005. 3: p. 1884-1893.
15. Ascenzi, .P, Bocedi, A., Visca, P., Altruda, F., Tolosano, E., Beringhelli, T., and Fasano,
M., Hemoglobin and heme scavenging. IUBMB Life, 2005. 57: p. 749-759. 16. Higa, Y., Oshiro, S., Kino, K., Tsunoo, H., and Nakajima, H., Catabolism of globin-
haptoglobin in liver cells after intravenous administration of hemoglobin-haptoglobin to rats. J Biol Chem, 1981. 256: p. 12322-12328.
17. Kino, K., Mizumoto, K., Watanabe, J., and Tsunoo, H., Immunohistochemical studies on
hemoglobin-haptoglobin and hemoglobin catabolism sites. J Histochem Cytochem, 1987. 35: p. 381-386.
18. Weinstein, M. B., and Segal, H. L., Uptake of free hemoglobin by rat liver parenchymal
cells. Biochem Biophys Res Commun, 1984. 123: p. 489-496. 19. Miller, Y. I., and Shaklai, N., Kinetics of hemin distribution in plasma reveals its role in
lipoprotein oxidation. Biochimica et Biophysica Acta, 1999. 1454: p. 153-164. 20. Morgan, W. T., The binding and transport of heme by hemopexin. Ann Clin Res., 1976.
8: p. 223-232. 21. Morgan, W. T., Liem, H. H., Sutor. R. P., and Muller-Ebergard, U., Transfer of heme
from heme-albumin to hemopexin. Biochim Biophys Acta, 1976. 444: p 4351145, 1976.
22. Adams, P. A., and Berman, M. C., Kinetics and mechanism of the interaction between human serum albumin and monomeric haemin. Biochem. J. 1980. 191: p. 95-102.
23. Letoffe, S., Ghigo, J. M., and Wandersman, C. Iron acquisition from heam and
haemoglobin by Serratia marcescens extracellular protein. Proc. Natl Acad Sci USA, 1994a. 91: p. 9876-9880.
24. Letoffe, S., Redeker, V. and Wandersman, C., Isolation and characterization of an
extracellular haem-binding protein from Pseudomonas aeruginosa that shares function and sequence similarities with the Serratia marcescens HasA haemophore. Molecular Microbiology, 1998. 28: p. 1223-1234.
25. Rossi, M., et al, Identification and Characterization of the Hemophore-Dependent Heme
Acquisition System of Yersinia pestis. Infection and Immunity, 2001. 11: p. 6707-6717.

169
26. Cope, L., Thomas, S., Hrkal, Z., and Hansen, E., Binding of heme-hemopexin complexes
by soluble HxuA protein allows utilization of this complexed heme by Haemophilus influenzae. Infect. Immun., 1998. 66: p. 4511-4516.
27. Painter, L., Harding, M. M., and Beeby, P. j., Synthesis and interaction with human
serum albumin of the first 3,18-disubstituted derivative of bilirubin. J. Chem. Soc., Perkin Trans. 1, 1998. 18: p. 3041-3044.
28. Harkal, Z., Kalousek, I., and Vodrazka, Z., Heme binding to albumin and equilibria in
the albumin-ferrihaemoglobin and albumin-haemopexin systems. Int. J. Biochem. 1980. 12: p. 619-624.
29. Fuhrhop, J. M., and Smith, K. M., (1995) In: Smith, K. M., (ed) Porphyrins and
Metalloporphyrins. Elsevier, Amsterdam, p. 757-869. 30. Deniau, C., et al. Thermodynamics of hemin binding to the HasA (SM) hemophore:
effects of mutations at three key residues for heme uptake. Biochemistry, 2003. 42: p. 10627-10633.
31. Adams, P. A., and Berman, M. C., Kinetics and mechanisms of the interaction between
human serum albumin and monomeric hemin . Biochem. J., 1980. 95: p. 95-102. 32. Beaven, G. H., Gen, S., D`Albis, A. and Gratzer W. B., Physical studies on the
ribosomal protein S2 from the Escherichia coli 30S subunit European J. Biochem., 1974. 41: p. 539-546.
33. Yukl, E. T, Jepkorir, G., Alontaga, A. Y., Pautsch, L., Rodriguez, J. C., Rivera, M., and
Moënne-Loccoz, P., Kinetic and Spectroscopic Studies of Hemin Acquisition in the Hemophore HasAp from Pseudomonas aeruginosa. Biochemistry, 2010. 9: p. 6646-6654.
34. Kuzelova, K., Mrhalova, M., and Hrkal, Z., Kinetics of heme interaction with heme-
binding proteins: The effects of heme aggregation states. Biochimica et Biophysica Acta, 1997. 1336: p. 497-501.
35. Tal, M., Silberstein, A., and Nusser, E., Why Does Coomassie Brilliant Blue R Interact
Differently with Different Proteins? J. Biol. Chem., 1980. 260: p. 9976-9980.

170
CHAPTER V
Summary
The opportunistic pathogen Pseudomonas aeruginosa requires iron for growth and
successful colonization of mammalian hosts cells [1]. However, the host provides a hostile
environment to microbial invaders by tightly sequestering free iron in iron binding and storage
proteins thereby limiting the amount of free iron available. Accordingly, bacteria have developed
committed sophisticated mechanisms to overcome iron limitation and circumvent the host
sequestration mechanisms.
One of the ways through which Pseudomonas aeruginosa acquires iron is by deploying
the has (heme acquisition system) system which constitutes a heme binding protein HasAp and a
cell surface receptor HasR [1]. Under iron limiting conditions, Pseudomonas aeruginosa
secretes HasAp to the extracellular media where it binds heme (free or bound) and shuttles it to
the specific outer membrane HasR for subsequent internalization [2]. Once in the cytosol, the
heme is thought to be degraded by heme oxygenase to release iron which is then available to the
bacteria as an essential nutrient [3]. Since it is well established that Pseudomonas aeruginosa
requires iron to be pathogenic [4], infections caused by this bacterium can be minimized or
stopped at an early stage by depriving or limiting the amount of iron available for growth and
subsequent infections. Molecular level understanding of the mechanisms of iron or heme-iron
uptake and the protein-structure functional relationship is therefore essential. This will pave way
for development of molecules that would inhibit heme acquisition by HasAp from the host heme
binding proteins thereby curbing pseudomonas infections.

171
To date, the mechanism of heme uptake by HasAp and heme release to its cognate
receptor HasR is not well understood. Moreover, the target host heme protein is not known. In
this study we used a combination of biochemical and spectroscopic techniques to investigate the
heme binding mechanism of HasAp. We also carried out in vitro heme transfer using human
serum albumin as the heme source. The results and conclusions drawn from experimental data
are summarized below.
1. Heme binding to apo-HasAp proceeds in two discrete sequential steps.
The X-ray crystal structure of apo-HasAp reveal that the overall polypeptide fold is
similar to that of holo HasAp except for the His 32 loop that is relocated nearly 30 Å away
relative to its position in the holo protein. Binding of free heme to form the holo conformer
proceed in two discrete sequential steps; a fast kinetic phase corresponding to loading of the
heme to the Tyr 75 loop followed by a slow phase where the His 32 loop undergoes a large
conformational rearrangement and coordinates the heme. The slow movement of the His 32 loop
is corroborated by the single x-ray crystal structure of H32A-HasAp mutant which shows a non-
crystallographic dimer (Figure 12, Chapter 2) associated via cofacial stacking of two heme
molecules.
Upon heme loading, subtle yet significant changes occur at and near the hinge residues
(Gly 28 and Gly 45) of the His 32 loop. Assenting NMR and TMD simulations results suggest
that these changes are necessary to allow a smooth transition of the His 32 loop as it relocates
from the “open” to the “closed” conformation.

172
2. The presence of the heme in the Tyr 75 loop triggers conformational rearrangement of the
His 32 loop
Loading of the heme onto the Tyr 75 loop triggers conformational rearrangement of the
His 32 loop regardless of the presence or absence of the heme iron distal ligand. This is clearly
demonstrated in the crystal structure of H32A-imidazole where the residues whose electron
densities could be traced (i.e in this His 32 loop) are located in similar positions as those seen in
the crystal structure of wild type holo HasAp. Complementary information was obtained from
solution NMR studies of H32A and H32A-imidazole complex which showed that resonances of
some of the residues located in the His 32 loop are broadened beyond detection due to the
paramagnetic effect of the heme, implying that these residues are in close proximitiy to the face
of the heme. We conclude that the role of the His 32 loop is to protect the heme macrocycle from
exposure to the aqueous media.
3. Hydrogen bonding interaction between the heme proximal residues Tyr 75 and His 83 is
important in maintaining the structural integrity of the protein.
Breaking and formation of the hydrogen bond between Oη of Tyr 75 and Nδ of His 83 is
proposed to modulate the Tyr-Fe3+ bond [5]. X-ray crystal structures of Y75A and H83A show
that scission of this bond brought about by the alanine mutations induces subtle yet conceivable
conformational changes in the protein (Figures 12, 17, 18 and 19 in chapter 3). These changes
involve conformational changes in the backbone and spatial rearrangement of the amino acid
side chains of residues constituting the His 32 loop, and loss or gain in secondary structure
elements on or near the regions of the protein implicated to associate with the receptor HasR

173
during heme release. Our results are in good agreement with the proposal that conformational
changes that occur upon interaction of HasA with the receptor are remotely communicated to the
Tyr 75 loop though in our case communication is in the reverse direction. We propose that
information is relayed via the His 32 loop since this loop experiences more conformational
changes compared to the Tyr 75 loop. We also propose that besides modulating the Tyr-Fe3+ bond
and hence heme binding or release, the Oη Tyr 75- N His 83 hydrogen bond is important in
maintaining the overall architecture of the protein. In addition, the nature of the molecule
associating with the proximal heme-iron ligand (Tyr 75) in the absence of the auxiliary partner
(His 83) contributes to the stability of the secondary structure elements of the protein. This is
clearly demonstrated by the two crystal forms of H83A (Figure 11-C and D, in chapter 3).
The high resolution x-ray crystal structures of the mutants unequivocally determined the
coordination state of the heme iron. As shown in Figure 14 in chapter 3, the heme in the Y75A
HasAp mutant is hexacoodinate and the axial ligands are His 32 and a chance ion (formate). The
side chain of His 83 is in a position nearly identical to that seen in the crystal structure of wild
type HasAp and it is not coordinating the heme. This observation contradicts Deniau and
coworker`s proposal that in the absence of Tyr 75, His 83 may serve as the proximal ligand to the
heme [6]. Caillet-Saguy and coworkers proposed that in the H83A mutant of HasAs, Tyr 75 is
detached from the heme at acidic pH forming a pentacoordinate high spin species and, upon
increasing the pH, Tyr 75 ionizes and its phenolic oxygen forms a hydrogen bond with the bound
water ligand thereby stabilizing the hydroxide complex [7]. Our results do not concur with this
proposal. In the structure of H83A refined to the highest resolution possible (0.89 Å), Tyr 75 is
not detached from the heme.

174
3. Methemalbumin is the potential target for the hemophore HasAp as a heme source.
Studies involving heme transfer from host heme proteins to HasA have focused primarily
on hemoglobin as the heme source. However, we propose that methehemalbumin is the potential
target for the secreted hemophores based on two reasons; first, the association between heme and
serum albumin (Kd= 10-8 M) [8] is relatively weak; the weakest among the host heme proteins,
and secondly, the amount of methhemalbumin is blood plasma is very high compared with the
other heme or hemoglobin scavenging proteins hemopexin and haptoglobin, respectively.
Furthermore it is probable that the heme transport protein hemopexin is saturated during
hemolytic conditions leaving substantial amount of heme in serum albumin accessible to
invading microbes. On this basis, investigations were carried out to determine if HasAp can
acquire heme from methemalbumin. Results from UV-vis spectroscopic analysis revealed that
heme transfer from methemalbumin to apo HasAp is very rapid. In addition, the rate of heme
release from methemlbumin correlates with the rate of heme uptake by HasAp. These rates
however are comparable to the rate of dissociation of heme from methemalbumin in the absence
of the hemophore. Complementary information was obtained by polyacrylamide gel
electrophoresis. The high resolution afforded by polyacrylamide gels allowed complete
separation of the reaction products and confirmed that heme is indeed completely transferred
from methemalbumin to HasAp within a short time ( <10 min). We conclude that methemalumin
is the potential target for HasAp and that heme transfer is driven by passive diffusion and
affinity.

175
References
1. Vasil, M. L., and Ochsner, U. A., The response of pseudomonas Aeruginosa to iron:
Genetics, biochemistry and virulence. Molecular Microbiology, 1999. 34: p. 399-413. 2. Letoffe,S., Ghigo,J.M., and Wandersman,C., Secretion of the Serratia marcescens HasA
protein by an ABC Transporter. J. Bacteriol., 1994b. 176: p. 5372-5377. 3. Yoshida, T., Noguchi, M., Kikuchi, G., and Sano, S., Degradation of mesoheme and
hydroxymesoheme catalyzed by the heme oxygenase system: involvement of hydroxyheme in the sequence of heme catabolism. J Biochem., 1981. 90: p.125-131.
4. Weinberg, E. D., Iron and infection. Microbiol. Rev., 1978. 42: p. 45-66. 5. Wolff, N., Izadi, N., Couprie, J., Habeck, M., Linge, J., Rieping, W., Wandersman, C.,
Nilges, M., Delepierre, M., and Lecroisey, A., Comparative analysis of structural and dynamic properties of the loaded and unloaded hemophore HasA: functional implications. J. Mol. Biol., 2008. 376: p. 517-525.
6. Deniau, C., Gilli. R., Izadi, N., Létoffé, S., Delepierre, M., Wandersman, C., Briand, C.,
Lecroisey, A., Thermodynamics of heme binding to the HasA(SM) hemophore: effect of mutations at three key residues for heme uptake. Biochemistry, 2003. 42: p. 10627-10633.
7. Caillet-Saguy, C., Delepierre, M., Lecroisey, A., Bertini, I., Piccioli, M., and Turano, P.
Direct-Detected 13C NMR to Investigate the Iron(III) Hemophore HasA. J. Am. Chem. Soc., 2006. 128: p. 150-158.
8. Adams, P. A., and Berman, M. C., Kinetics and mechanism of the interaction between
human serum albumin and monomeric haemin. Biochem. J. 1980. 191: p 95-102.