structural analysis for gold mineralization using … · p1: gkw/sph p2: gkw natural ......
TRANSCRIPT

P1: GKW/SPH P2: GKW
Natural Resources Research (NRR) PP113-300036 March 26, 2001 12:28 Style file version Nov. 07, 2000
Natural Resources Research, Vol. 9, No. 4, 2000
Structural Analysis for Gold Mineralization Using RemoteSensing and Geochemical Techniques in a GISEnvironment: Island of Lesvos, Hellas
D. Rokos,1 D. Argialas,1 R. Mavrantza,1 K. St.-Seymour,2 C. Vamvoukakis,2
M. Kouli,2 S. Lamera,2 H. Paraskevas,2 I. Karfakis,3 and G. Denes4
Received and accepted 10 September 2000
Exploration for epithermal Au has been active lately in the Aegean Sea of the eastern Mediter-ranean Basin, both in the islands of the Quaternary arc and in those of the back-arc region.The purpose of this study was the structural mapping and analysis for a preliminary investiga-tion of possible epithermal gold mineralization, using remotely sensed data and techniques,structural and field data, and geochemical information, for a specific area on the Island ofLesvos. Therefore, Landsat-TM and SPOT-Pan satellite images and the Digital ElevationModel (DEM) of the study area were processed digitally using spatial filtering techniquesfor the enhancement and recognition of the geologically significant lineaments, as well asalgebraic operations with band ratios and Principal Component Analysis (PCA), for the iden-tification of alteration zones. Statistical rose diagrams and a SCHMIDT projection Stereo Netwere generated from the lineament maps and the collected field data (dip and strike mea-surements of faults, joints, and veins), respectively. The derived lineament map and the bandratio images were manipulated in a GIS environment, in order to study the relation of thetectonic pattern to both the alteration zoning and the geomorphology of the volcanic field ofthe study area. Target areas of high interest for possible mineralization also were specifiedusing geochemical techniques, such as X-Ray Diffraction (XRD) analysis, trace-element, andfluid-inclusion analysis. Finally, preliminary conclusions were derived about possible mineral-ization, the type (high or low sulfidation), and the extent of mineralization, by combining thestructural information with geochemical information.
KEY WORDS: Mineral exploration; geochemistry; satellite images; spatial filtering; alteration zones.
INTRODUCTION
Generally, the most widespread Au deposits arethose of epithermal origin and alluvial gold. Epither-
1 Laboratory of Remote Sensing—Department of Surveying andRural Engineering, National Technical University of Athens—Heroon Polytechniou 9, Zografos, 157-80, Athens, Hellas;e-mail: [email protected]
2 Laboratory of Ore Deposits and Volcanology, Department of Ge-ology, University of Patras, Rion Patras, Hellas.
3 Remote Sensing Applications Agency, Institute of Geology andMineral Exploration, Athens, Hellas.
4 Department of Chemistry, Concordia University, Montreal,Canada.
mal gold deposits are low-temperature hydrother-mal deposits (100◦C–300◦C). They display charac-teristic zonation of alteration assemblages of pre-dominantly clay minerals. The extent of alterationis two or three times greater than the actual de-posit. Therefore, alteration zones are used exten-sively as tracers to the mineralization. Gold in allu-vial deposits is in the form of nuggets, which can beharvested easily from the sand. This is mainly sec-ondary gold, derived from the weathering of aurifer-ous primary deposits. Up to now, a number of geo-logical and geophysical methods have been used toprospect for Au. Processing and analysis of digitalremote-sensing images permit efficient localization
2771520-7439/00/1200-0277$18.00/1 C© 2000 International Association for Mathematical Geology

P1: GKW/SPH P2: GKW
Natural Resources Research (NRR) PP113-300036 March 26, 2001 12:28 Style file version Nov. 07, 2000
278 Rokos et al.
of target areas. This reduces the effective cost ofgeophysical and geochemical prospecting and fieldwork, because it results in more localized target areas(Karfakis, 1991; Karfakis and Doutsos, 1995; Woldai,1995).
Gold transport in hydrothermal solutions isfacilitated mostly by sulfide or chloride complex-ing. Lindgren (1993) defined epithermal deposits asshallow deposits formed at depths not exceeding2 km. Their temperature of formation ranges from100◦C to 300◦C (Berger and Eimon, 1982). Epither-mal gold mineralization forms two distinct typesof deposits: (a) high sulfidation or acidsulfate and(b) low sulfidation or adulariasericite type (Whiteand Hedenquist, 1995). Both types occur exten-sively in subduction-related petrotectonic domains.The age of these deposits does not exceed 20 Ma(Sillitoe, 1993). The petrotectonic environment ofthese deposits is related to zones of collision,and especially, subduction, although low sulfidationtypes are related to zones of distension. Geolog-ical discontinuities tend to localize the mineral-ization (Clarke and others, 1974; Sillitoe, 1974).Epithermal gold deposits are hosted within fel-sic to intermediate volcanic rocks (rhyolites, rhyo-dacites, dacites, trachyandesites, and andesites) inthe forms of lavas, lava domes, volcanic brec-cias, ignimbrites, and other lithified or not lithi-fied pyroclastic deposits of similar compositions.Volcanic host structures are breccia pipes, veins,stockworks, disseminations, replaced zones, faults,joints, and open-space fillings. Megascopic structures,such as faults, breccia pipes, etc., can be detectedon Landsat-TM and SPOT remote-sensed images(Gupta, 1991).
VOLCANOLOGY OF THE ISLAND OF LESVOS
Lesvos (Fig. 1) is the third largest island (70 ×40 km) in Hellas. It is situated in the east–centralAegean Sea, close to Asia Minor. Miocene vol-canic rocks of great thickness overlie a metamor-phic Paleozoic basement. The mid-Miocene magma-tism in Lesvos was shoshonitic and was precededand succeeded by calc–alkaline volcanic activity. Theshoshonitic volcanic activity lasted approximately 1million years (18.4–17.3 Ma). The calc–alkaline vol-canic activity is dated 21.5 Ma and was repeated 16.5Ma ago. A chain of andesitic stratovolcanoes lies onthe SW–NE direction across central Lesvos, with thick
acid pyroclastic deposits and secondary volcanic cen-ters in its eastern and western flanks (Pe-Piper, 1980).
METHODOLOGY
Data Acquisition
For the detection and mapping of probable ar-eas of gold deposits, geological and geochemicaldata were combined with appropriate remote-sensinganalysis to process the results. The relevant outputimages were generated from the analysis and pro-cessing of a Landsat-TM digital image of the islandof Lesvos, acquired on 20 August 1999, a 10-m reso-lution SPOT panchromatic (SPOT-Pan) image of thesame area, acquired on 12 July 1999, and from a Dig-ital Elevation Model (DEM) of a limited study areaof the island, with a spacing of 30 m. Probable areasof gold deposits included volcanic features (calderas,domes), tectonic structures (faults, shear zones),and areas of hydrothermal discharge and alterationzones.
Data Preprocessing
The aforementioned digital images and the DEMwere geocoded, using the correspondent topographicmap of the study area, using the following parameters:The Universal Traverse Mercator Projection on NorthHemisphere (NUTM—Zone 35) and the HGRS’87Geodetic Reference System (that is, the HellenicGeodetic Reference System). Thirty-six ground con-trol points were taken on the Landsat-TM image,whereas 110 ground control points were used forthe SPOT-Pan image. The geodetic correction had anRMS error of approximately 0.4 pixels, for both im-ages. For the resampling of both images, the nearest-neighbor method was applied.
Geocoding, the vector (lineament maps), andraster layers (satellite images and DEM) wereimplemented in the GIS environment of ER Mapperby Earth Resource Mapping Inc. (1997). ER Mapperis an earth-resource mapping software, which in-cludes digital image processing and GIS algorithms,similar to geocoding, raster-to-vector converters,layer overlaying, creating mosaics, and creating andmanipulating vector layers in compatible formats, etc.For geocoding, input data had to be preprocessed,for example, adjacent map sheets had to be scannedand joined.

P1: GKW/SPH P2: GKW
Natural Resources Research (NRR) PP113-300036 March 26, 2001 12:28 Style file version Nov. 07, 2000
Structural Analysis for Au Mineralization Using Remote Sensing 279
Figure 1. A, Topographic map of Hellas. Island of Lesvos is illustrated with dark gray tone; B, Index map of study area, which isdelineated with textured rectangle (Novak and Soulakellis, 2000).

P1: GKW/SPH P2: GKW
Natural Resources Research (NRR) PP113-300036 March 26, 2001 12:28 Style file version Nov. 07, 2000
280 Rokos et al.
Lineament maps were created using the vectorediting modules of ER Mapper. The appropriateraster layers (satellite data, DEM, and vector lay-ers) were overlaid and manipulated, in order toderive useful preliminary conclusions concerning thelocalization of alteration zoning for possible goldmineralization.
Digital Processing of Landsat-TM Imagery,SPOT-Pan Imagery, and DEM
Because lineaments are indicators of possiblefaulting or existence of other tectonic features, linea-ment-enhancement techniques (Rigol and Chica-Olmo, 1998) were applied both on the Landsat-TMimage and the DEM, in order to investigate the basictectonic pattern of the study area.
By applying spatial filtering techniques on theLandsat-TM band 4 image, 60 experimental enhancedimages were generated, which were grouped into thefollowing classes:
(a) Linear and nonlinear convolution filters foredge enhancement (directional masks, lineargradient filters, edge-enhancement sun-anglefilters, high-pass filters (Argialas, Sterns, andShahrokhi, 1988; Biedny and Monroe, 1991;Russ, 1992; Jensen, 1996); and
(b) Edge-detection filters (Haralick, 1984; Jain,1989; Pratt, 1991; Jensen, 1996).
The enhanced images contributed to the inter-pretation of major tectonic features (faults, fracturezones), volcanic structures (calderas, domes, volcanicnecks), and certain drainage network segments. Inthis work, an example of an enhanced image result-ing from the FORD high-pass filter, is illustrated inFigure 2. It should be noted that the spectral attributesof this image were well preserved (Ford, Algazi, andMeyer, 1983), and thus, it contributed significantly tothe interpretation of lineaments.
In the second data-processing phase, four sun-angle filters were applied on the DEM of the researcharea, with a certain sun azimuth and a sun-elevationangle of 50◦. The output images were shaded reliefmaps, which were used as the background coveragefor the overlay of each vector layer of lineaments. TheDEM was used for the following reasons:
(a) It provided a view capability of variable sunelevation angle (Gupta, 1991). The low sun-elevation angle of 50◦ was used because of theintroduction of better shadowing;
(b) On satellite images (SPOT and Landsat-TM),lineaments with orientation parallel to the sunazimuth direction have a weak appearance,compared to their appearance on a shadedrelief map.
On the four shaded relief maps (illuminated fromthe N–S, E–W, NW–SE, and NE–SW direction), fourindividual vector layers of lineaments were createdby screen digitizing, and appended into a single vec-tor layer (Fig. 3). These four particular shaded reliefmaps were constructed, in order to detect lineaments,which were identifiable because of their topographicappearance.
In the last data-processing phase, a vector layer oflineaments was created similarly by screen digitizingon the 10-m resolution SPOT-Pan image (Fig. 4). Thisimage provided a significant amount of informationfor the tectonic structure of the research area, becausethe high spatial resolution of the image contributedto the enhancement of the weaker lineaments on theE–W direction, which was not apparent on the DEM.Besides the topographic lineaments, lineaments re-sulting from vegetation alignment also were de-tected on this high spatial resolution image. Further-more, the SPOT-Pan image provided more segments(branches) of the existing drainage network in com-parison to the shaded relief maps and the Landsat-TMimage, and all expected tectonic trends (major and mi-nor) of the study area were delineated.
Statistical Analysis of Structural Data
The derived lineament vector layers (Figs. 3A–4A) were analyzed statistically, using the lineamentdensity (length-weighted) as the primal parameter,and rose diagrams were generated for the extractionof the study of lineament orientation (Figs. 3B–4B).From the first rose diagram (Fig. 3B), it was concludedthat the linear segments of Figure 3A follow mostlytwo major directions: the NNE to NE (N10◦–N35◦)and the NW–SE direction. Likewise, from the sec-ond rose diagram (Fig. 4B), it is implied that the twotrends that were mentioned are dominant. One addi-tional trend also could be identified—the E–W trend.A greater dispersion of orientations is observed inFigure 4B, because of the higher spatial resolution ofthe SPOT Pan image.
A SCHMIDT Stereo Net was generated usingfield data, such as dip and strike measurements ofjoints, veins, and shear zones. From the statistical

P1: GKW/SPH P2: GKW
Natural Resources Research (NRR) PP113-300036 March 26, 2001 12:28 Style file version Nov. 07, 2000
Structural Analysis for Au Mineralization Using Remote Sensing 281
Figure 2. Landsat-TM band 4 image, after applying FORD high-pass filter. Sufficient amount of drainage network segments is accen-tuated in all directions, and spectral response of image is well-preserved. Location of some drainage linear segments is pointed to witharrows.
analysis and interpretation of the SCHMIDT StereoNet, it is concluded that the geological and the tec-tonic elements of the study area mainly follow a NNEto NE, a NW, and the N–S direction. A secondarytectonic direction is toward E–W (Fig. 5). This in-terpretation is in agreement with that of other re-searchers from the literature (Mercier and others,1988; Simeakis and others, 1989).
Integration of Remote Sensing, Geological, andGeochemical Methods and Techniques
For the investigation of the volcanic structures(domes, calderas), the DEM of the study area wasoverlaid by the Landsat-TM band 4 image. This re-sulted in the addition of the third dimension to theremotely sensed data, which contributed significantly

P1: GKW/SPH P2: GKW
Natural Resources Research (NRR) PP113-300036 March 26, 2001 12:28 Style file version Nov. 07, 2000
Fig
ure
3.A
,Sh
aded
relie
fm
apof
stud
yar
ea,
afte
rap
plyi
ngco
nvol
utio
nsu
n-an
gle
filte
rw
ith
illum
inat
ion
dire
ctio
nfr
omN
orth
.O
verl
aid
vect
orla
yer,
whi
chap
pear
sw
ith
med
ium
gray
tone
,co
nsis
tsof
linea
men
tsin
four
maj
ordi
rect
ions
(N–S
,E–W
,NE
–SW
,and
NW
–SE
);B
,Ros
edi
agra
mof
linea
men
tden
sity
ofA
.
282

P1: GKW/SPH P2: GKW
Natural Resources Research (NRR) PP113-300036 March 26, 2001 12:28 Style file version Nov. 07, 2000
Structural Analysis for Au Mineralization Using Remote Sensing 283
Fig
ure
4.A
,10-
mre
solu
tion
SPO
T-P
anim
age
ofst
udy
area
.Vec
tor
laye
rof
linea
men
ts,w
hich
deri
ved
byon
-scr
een
digi
tizi
ngof
init
ialS
PO
T-P
anim
age,
isill
ustr
ated
wit
hlig
htgr
ayto
ne.A
mou
ntof
linea
men
tsw
asin
crea
sed
sign
ifica
ntly
,com
pare
dto
num
ber
oflin
eam
ents
ofFi
gure
3Abe
caus
eof
rela
tive
lyhi
gher
spat
ialr
esol
utio
nof
SPO
T-P
anim
ages
;B,R
ose
diag
ram
oflin
eam
entd
ensi
ty(l
engt
h).

P1: GKW/SPH P2: GKW
Natural Resources Research (NRR) PP113-300036 March 26, 2001 12:28 Style file version Nov. 07, 2000
284 Rokos et al.
Figure 5. Lower hemisphere SCHMIDT Stereo Net. Projection of poles of discontinuities planes (faults, joints, and veins).

P1: GKW/SPH P2: GKW
Natural Resources Research (NRR) PP113-300036 March 26, 2001 12:28 Style file version Nov. 07, 2000
Structural Analysis for Au Mineralization Using Remote Sensing 285
Figure 6. Image overlay of Landsat-TM band 4 on DEM of study area. Major (NNE to NE and NW) and minor (N–S and E–W) tectonic zonesare shown with thick light gray and bold arrows and thin light gray and bold arrows, respectively.

P1: GKW/SPH P2: GKW
Natural Resources Research (NRR) PP113-300036 March 26, 2001 12:28 Style file version Nov. 07, 2000
286 Rokos et al.
to the identification (and “qualitative delineation”) ofthe volcanic structures (Fig. 6).
On this overlay, the volcanic structures, such asthe major caldera and other minor ones, volcanicdomes, and ring structures were detected. These struc-tures were important for the detection of alterationzones. Rhyolitic domes occur inside the major caldera.These domes are oriented in the same NNE to NE di-rection, as the main lineaments, which occur on theenhanced images. The tectonic structure displays twodominant orientations: NNE to NE and NW. Two mi-nor directions, the E–W and the N–S also played animportant role in the detection of alteration zones, be-cause intensively altered volcanic rocks are localizedat the intersection of major and minor tectonic trends.
The major caldera is deformed on its easternflank by a major NE tectonic zone, which interceptsit. The same tectonic direction also seems to inter-cept the central part of the caldera as well. An im-age addition of the 5/7 and 3/1 spectral ratio images(Fig. 7) was applied on the Landsat-TM digital imagefor the detection of hydrothermal alteration zones.The aforementioned spectral ratios have been shownin the literature to localize hydrothermal alterationzones in epithermal gold deposits and porphyry Cudeposits (Sabins, 1997). The areas that seemed tohave a white and light gray tone in the image werethe ones of more intense alteration, such as silicifi-cation, advanced argillic, and argillic alteration. Thedark gray areas defined low-intensity alteration, suchas sericitic and propylitic alteration. The black or darkgray areas represented unaltered lavas. By using thisparticular algebraic operation (addition) of the pre-viously mentioned spectral ratios, a great emphasiswas placed on the spectral differences between thehydrothermally altered clay minerals—illite, kaolin-ite, and montmorillonite. On the other hand, the ap-plication of the spectral ratio 3/1 provided images inwhich the iron oxides and the metal sulfides were dis-criminated. These oxides form the second largest min-eral group, which characterizes the hydrothermallyaltered rocks. In our situation, after addition of thesespecific spectral ratios (5/7 and 3/1), a new syntheticimage was created, which emphasized successfully thedistinction between alteration zones of different in-tensity, in the active hydrothermal field of Lesvos(Rokos and others, 2000).
In the next stage, Principal Component Analy-sis (PCA) was applied to reduce the extensive inter-band correlation of the Landsat-TM multispectral im-age data, as a preprocessing procedure prior to visual
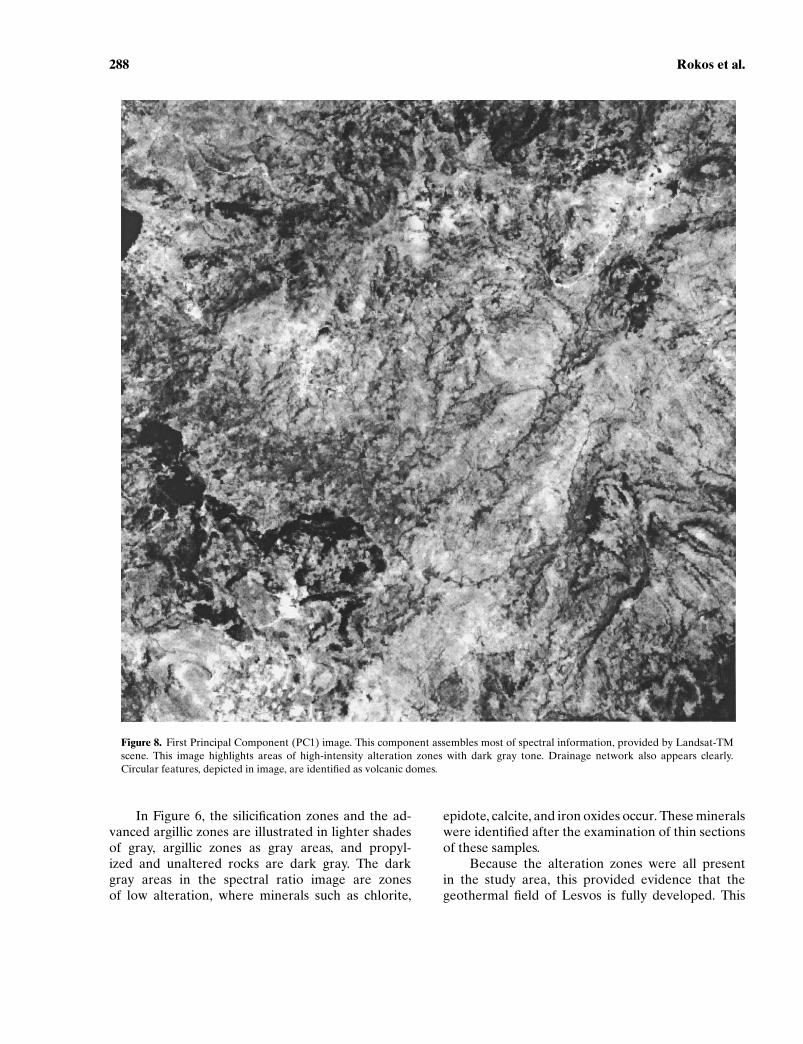
interpretation of the digital imagery. From the inter-pretation of the first principal component image (PC1image), it was concluded that the zones of intense al-teration, such as silicification, occurred with a darkgray tone, whereas argillic alteration zones occurredwith a medium gray tone (Rokos and others, 2000)(Fig. 8).
For the visualization of the interrelation betweenthe tectonics of the research area, the volcanic geo-morphology (dome alignments on a tectonic trend)and the alteration zoning, a new image was generated.This image consisted of the following information lay-ers: the shaded relief map with illumination from theN–S direction as the background layer, the overlaylayer of low- and high-intensity alteration zoning, andthe vector layer of the lineaments of the describedtectonic trends (Fig. 9). Figure 9 presents a syntheticthematic map, which was generated by the overlayGIS technique by using the appropriate ER MapperGIS modules. Until now, preliminary maps have beencreated and manipulated, in order to initially derivepreliminary conclusions on possible gold mineraliza-tion in the research area. One of the future tasks willbe GIS spatial modeling, by bringing all the data intoa compatible form (making use of data attributes andtopology), and creating final thematic maps for min-eral exploration purposes.
From this image, it was concluded that (a) theareas of alteration assemblages are controlled by theextracted tectonic trends, and (b) volcanic dome align-ment is present along the major NNE–SSW trend.
Geochemical Analyses and Interpretation of Results
From this analysis, it is concluded that the west-ern part of the study area includes domains of intensealteration. Detailed sampling of these domains wasperformed for collection of data for XRD, INAA (In-strumental Neutron Activation Analysis), and fluid-inclusion analyses.
Definition of Mineral Assemblages in the Zonesof Hydrothermal Alteration
The mineral assemblages (Table 1) were definedby XRD and analyzed to constitute the following al-teration zones, delineated in the study area.
(a) Silicification zone: This zone is characterizedby quartz and muscovite. Galena, sphalerite,

P1: GKW/SPH P2: GKW
Natural Resources Research (NRR) PP113-300036 March 26, 2001 12:28 Style file version Nov. 07, 2000
Structural Analysis for Au Mineralization Using Remote Sensing 287
Figure 7. Image derived from addition of ratios 5/7 and 3/1. Low-intensity alteration zone is delineated with thick, white, dashed line andalteration zones of high intensity are delineated with light gray, continuous line.
and copperoxides were identified in one ofthe samples.
(b) Advanced argillic alteration zone: This zoneis characterized by kaolinite and alunite. Thepresence of alunite and the absense of adu-laria depict a high sulfidation alteration sys-tem.
(c) Argillic zone: The argillic zone assemblage ischaracterized by the presence of illite, mont-morillonite, and kaolinite. There are transi-tion zones between the argillic and the ad-vanced argillic alteration zones.
(d) Propylitic zone: Propylitic zones are charac-terized by epidote, chlorite, and iron oxides.
P1: GKW/SPH P2: GKW
Natural Resources Research (NRR) PP113-300036 March 26, 2001 12:28 Style file version Nov. 07, 2000
288 Rokos et al.
Figure 8. First Principal Component (PC1) image. This component assembles most of spectral information, provided by Landsat-TMscene. This image highlights areas of high-intensity alteration zones with dark gray tone. Drainage network also appears clearly.Circular features, depicted in image, are identified as volcanic domes.
In Figure 6, the silicification zones and the ad-vanced argillic zones are illustrated in lighter shadesof gray, argillic zones as gray areas, and propyl-ized and unaltered rocks are dark gray. The darkgray areas in the spectral ratio image are zonesof low alteration, where minerals such as chlorite,
epidote, calcite, and iron oxides occur. These mineralswere identified after the examination of thin sectionsof these samples.
Because the alteration zones were all presentin the study area, this provided evidence that thegeothermal field of Lesvos is fully developed. This

P1: GKW/SPH P2: GKW
Natural Resources Research (NRR) PP113-300036 March 26, 2001 12:28 Style file version Nov. 07, 2000
Structural Analysis for Au Mineralization Using Remote Sensing 289
Figure 9. Synthetic overlay of Landsat-TM ratio image, vector layerof main geological lineaments, and vector layer with alteration poly-gons. This synthetic image shows relation between mapped tectoniczones with alteration zones.
resulted in the necessity of detailed examination ofthe advanced argillic alteration and silicification zonesfor gold mineralization.
Trace-Element Analyses for the Detection of PossibleOre Deposits
Trace-element analyses with the INAA methodwas carried out on samples, which were analyzed byXRD. The former method was used for the analysisof Au in samples with a high content of tracers (Hg,Sb, As, Ti, and Ba). Trace amounts of Au, down to1 ppb, could be detected by this method. Analyses of37 trace elements in whole, including the tracers ofgold As, Sb, and Ba, were performed.
As shown in Figure 10, which depicts the relation-ship between As and Au, the content of Au increases,in response to the content of As to values of As, whichexceed 35 ppm (Fig. 10). In contrast to As, Ba doesnot show a similar behavior. The values of Au seem tobe high in the samples that have a Ba content close to500 ppm (Fig. 11). Finally, Sb seems to have no specialrelationship with Au (Fig. 12).
Fluid-Inclusion Analyses for the Definitionof Physiochemical Conditions of the Depositof Hydrothermal Liquid
Fluid-inclusion studies on hydrothermal veinquartz provide information on the temperature andsalinity of the hydrothermal liquid. Six samples of
vein quartz were analyzed in double-polished thin sec-tions, 20 µm–100 µm thick. A total of a 105 measure-ments were obtained. These measurements led to theconclusion that the average temperature of deposi-tion from the hydrothermal liquid is between 245◦C–250◦C, with extreme values of 236◦C and 275◦C.These temperatures lie within the limits of deposi-tion for epithermal gold deposits (Fig. 13). Sixty-twosalinity measurements of fluid inclusions also werecarried out. The average salinity value was on theorder of 1.98 wt.%-2.00 wt.% NaCl, with a rangingof 0.331 to 4.934 wt.% NaCl, respectively. Thus thegreatest proportion of water, which participates in thehydrothermal system, is meteoric and gold probablyhas been transported in the hydrothermal solution assulfide. These values agree with those in the literaturefor epithermal gold deposits.
DISCUSSION AND CONCLUSION
By using remote-sensing analysis and process-ing methods (spatial filtering on satellite imagery andDEM), and field data (dip/strike ground measure-ments of certain discontinuity planes, such as faults,joints, and veins), tectonic structures of the two ma-jor trends (NNE to NE and NW–SE) were identifiedon the flanks and in the interior of a caldera structure.This fact enhances initial volcanic permeability and in-creases the probability of hydrothermal deposition ofore and gangue minerals. This is expected because ofthe formation of a hydraulic system of diaclases; whichin turn, enhance initial permeability and permit sur-face discharge of hydrothermal water. Preliminarily,the domes in the caldera seem to be aligned accord-ing to the NNE axis of the caldera, which axis alsohas a NNE direction. In addition, by using remote-sensing techniques (spectral ratioing and PCA), al-teration zones were delineated, by considering theirspectral response as the primary parameter. These al-teration zones are candidate target areas for furthergeochemical exploration.
The intersection of the major (NNE to NE andNW) and minor (E–W, N–S) tectonic trends localizesthe area of the most intense silicification, which isprobably related to gold mineralization. This was con-cluded by manipulating the remote-sensing analysisand processing results in a GIS environment.
The presence of alunite and the absence of adu-laria suggest that the probable Au mineralizationbelongs to the “high sulfidation” type. The coppercontent is expected to be higher, because the base

P1: GKW/SPH P2: GKW
Natural Resources Research (NRR) PP113-300036 March 26, 2001 12:28 Style file version Nov. 07, 2000
290 Rokos et al.
Table 1. Results from XRD Analyses from Selected Samples of the Geothermal Field of Lesvos
Sample Assemblage (alteration zones)
LV 10 Z Epidote, chlorite, kaoline, alunite, pyrophyllite (boundaries between argillic–propylitic zone)LV 9 C Kaolinite, alunite, pyrophyllite, Fe oxides, albite, calcite, muscovite, quartz (argilic–advanced
argillic zone)LV 24 Kaolinite, quartz, alunite, zeolites (advanced argillic zone)LV 9 D Kaolinite, alunite, pyrophyllite, Fe oxides, albite, calcite, muscovite, quartz (argilic–advanced
argillic zone)LV 10 H Kaolinite, quartz, alunite (advanced argillic zone)LV 10 X Kaolinite, pyrophyllite, albite, illite, calcite, Fe oxides (argillic zone)LV 10 E Kaolinite, quartz, alunite, pyrophyllite, albite, sericite, montmorillonite, illite, Fe oxides
(argillic-sericitic zone)LV 23 B Kaolinite, quartz, montmorillonite, alunite zeolites (boundaries between argillic–advanced
argillic zone)LV 9 A Kaolinite, alunite, pyrophyllite, Fe oxides, albite, calcite, muscovite, quartz (boundaries between
argillic–advanced argillic zone)LV 45 B Cu oxides, galena, sphalerite (silicification, ore zone)LV 10 L Kaolinite, pyrophyllite, albite, illite, calcite, Fe oxides, alunite (boundaries between argillic–advanced
argillic zone)LV 9 F Kaolinite, alunite, pyrophyllite, Fe oxides, albite, calcite, muscovite, quartz (boundaries between
argillic–advanced argillic zone)LV 10 H Kaolinite, quartz, alunite, albite, pyrophyllite, calcite, illit (boundaries between argillic–advanced
argillic zone)LV 10 I Alunite, quartz, kaolinite, illite, albite, calcite, pyrophyllite (boundaries between argillic–advanced
argillic zone)LV 10 M Kaolinite, pyrophyllite, albite, illite, calcite, Fe oxides, alunite (boundaries between argillic–advanced
argillic zone)LV 23 A Kaolinite, quartz, montmorillonite, alunite, zeolites, Fe-Ti oxides, heulandite (boundaries between
argillic–advanced argillic zone)LV 10 N Kaolinite, pyrophyllite, albite, illite, calcite, Fe oxides, alunite
(boundaries between argillic–advanced argillic zone)LV 10 A Idenified the presence of kaolinite (argillic zone)LV 10 K Kaolinite, chlorite, epidote, quartz (external argillic–propylitic zone)LV 4 A Quartz, kaolinite, illite, montmorillonite (argillic zone)LV 17 Montmorillonite, christobalite, sanidine, muscovite (argillic zone)LV 66 B Quartz, muscovite (silicification zone)LV 68 Quartz, illite, muscovite, kaolinite, montmorillonite (argillic zone)LV 69 B Quartz, muscovite (silicification zone)LV 71 A Quartz, muscovite, kaolinite (argillic zone)LV 72 A Quartz, muscovite, kaolinite (argillic zone)LV 76 B Quartz, muscovite (silicification zone)LV 77 Quartz, muscovite (silicification zone)LV 79 A Quartz, kaolinite (argillic zone)LV 79 B Quartz, sanidine, kaolinite (argillic zone)LV 90 Quartz, montmorillonite, albite, muscovite (argillic zone)LV 95 Quartz, albite, kaolinite, muscovite, montmorillonite (argillic zone)LV 99 Quartz, pyrophyllite, illite (argillic zone)LV 99 B Quartz, muscovite (silicification zone)LV 99 D Quartz, muscovite (silicification zone)
metal assemblages include two copper sulfides, thatis, enargite—covellite (+pyrite); this was concludedfrom XRD analysis.
From trace-element analysis, it was concludedthat the higher Au contents are observed in specimens,where alunite is present, As contents are higher, andBa is in the order of 500 ppm. These specimens are
obtained from quartz veins or domains of silicifica-tion and advanced argillic alteration where they arederived from areas of the most intense alteration.
Fluid inclusion data in hydrothermal vein quartzrange between temperatures of 245◦C to 250◦C,and salinities of 2.0 wt.% NaCl. Therefore, theseare epithermal veins precipitated from hydrothermal

P1: GKW/SPH P2: GKW
Natural Resources Research (NRR) PP113-300036 March 26, 2001 12:28 Style file version Nov. 07, 2000
Structural Analysis for Au Mineralization Using Remote Sensing 291
Figure 10. Au concentration (in ppb) versus As concentration (in ppm).
Figure 11. Au concentration (in ppb) versus Ba concentration (in ppm).
Figure 12. Au concentration (in ppb) versus Sb concentration (in ppm).
Figure 13. Temperature versus number-of-measurements diagram derived from fluid-inclusionanalysis.

P1: GKW/SPH P2: GKW
Natural Resources Research (NRR) PP113-300036 March 26, 2001 12:28 Style file version Nov. 07, 2000
292 Rokos et al.
solutions of low salinities of probable meteoric ori-gin. In such low-salinity hydrothermal solutions, goldprobably was transported as chloride complexes.
Remote-sensing and photointerpretation meth-ods and techniques provided the capability of creat-ing a new lineament map (Fig. 2A) of the study areaof Lesvos. This lineament map will result in a final tec-tonic map of the research area on Lesvos as soon as allrelevant lineaments are verified on the ground. Fromour lineament map, which was created with remote-sensing techniques, three additional tectonic trends,the major NNE trend and the minor ones (E–W andN–S), have been established, in addition to the exist-ing map of Hecht (Hecht, 1971). Hecht mapped onlytwo major tectonic trends (NE–SW and NW–SE).Furthermore, the major caldera structure ( 7× 5 km)was recognized for the first time, by using remote-sensing methods and techniques. This caldera struc-ture is intercepted by a NNE tectonic zone, as noted byour data analysis. The integration of these particularremote-sensing, geological, and geochemical methodsand techniques was applied for the first time in a Hel-lenic back-arc, active geothermal field. In addition, athematic map with alteration zones was created usingremote-sensing analysis and processing methods.
In future work, it is planned to examine thor-oughly the lineament information, derived fromthe interpretation of color composites of selectedLandsat-TM bands and other processed Landsat-TMoutput images. The Landsat-TM outputs will be com-pared to SPOT-Pan processed images, and the DEM,in order to assess the information content, whichcan be extracted from multiscale and multiresolu-tion data. The aim is to delineate the caldera by us-ing the drainage network and to generate the geo-tectonic model of the research area by combiningremote-sensing, geological, geophysical, and ancillarydata (topographic maps). Spatial modeling in the GISenvironment will be implemented, for integration ofremote-sensing, geochemical, ancillary, and field data,as well as additional attribute data, in order to refinefurther the derived preliminary results and to providea new approach for (a) localizing alteration zoning forAu mineralization, and (b) examining the contribu-tion of remote-sensing methodology and techniquesin mineral exploration.
ACKNOWLEDGMENTS
This research is funded by the General Secre-tariat for Research Technology, Ministry of Develop-
ment, Hellenic Republic. The authors wish to thankSandra Perry, James Russell, Dan Merriam and DougPeters for their constructive review comments.
REFERENCES
Argialas, D., Stearns, R., and Shahrokhi, F., 1988, Mapping and sig-nificance of Landsat and gravity lineaments in west Tennessee:Jour. Aerospace Engineering, Am. Soc. Civil Engineers, v. 1,no. 2, p. 74–87.
Berger, B. R., and Eimon, P. I., 1982, Comparative models ofepithermal silver—gold deposits: Soc. Mining Engineers ofAIME (Littleton, Colorado), preprint., p. 82–113.
Biedny, D., and Monroy, B., 1991, Official photoshop handbook:Bantam, New York, p. 423.
Clark, A. L., Berg, H. C., Cobb, E. N., Eberlein, G. D., MacKevett,Jr., E. M., and Miller, T. P., 1974, Metal provinces of Alaska:U. S. Geol. Survey Misc. Inventory Map I-384, scale:1:5,000,000.
Earth Resource Mapping Inc, 1997, ER Mapper 5.5–ApplicationsManual.
Ford, G. E., Algazi, V. R., and Meyer, D. I., 1983, A non-interactiveprocedure for land use determination: Remote Sensing of En-vironment, v. 13, no. 1, p. 1–16.
Gupta, R., 1991, Remote sensing geology: Springer–Verlag, Berlin,233 p.
Haralick, R. M., 1984, Digital step edges from zero crossing ofsecond directional filters: IEEE Trans. Pattern Analysis andMachine Intelligence, PAMI-6, p. 58–68.
Hecht, 1971, Geological map of Hellas, Lesvos Island: Inst. Ge-ological and Mining Research, Hellas, map sheets Mithymnaand Agia Paraskevi, scale 1:50.000.
Jain, A. K., 1989, Fundamentals of image processing: Prentice Hall,Englewood Cliffs, New Jersey, p. 342–357.
Jensen, J., 1996, Introductory digital image processing: PrenticeHall Series in Geographic Information Science, EnglewoodCliffs, New Jersey, p. 159–165.
Karfakis, I., 1991, Applications of remote sensing techniques ingeology and mineral exploration of the Eastern RhodopeRegion, Greece: unpubl. doctoral dissertation, Univ. Patras,Greece, 185 p.
Karfakis, I., and Doutsos, T., 1995, Late orogenic evolution of theCircum–Rhodope Belt, Greece: N. Jb. Geol. Palaont. Mh., H.5, Stuttgart, p. 305–319.
Lindgren, W., 1933, Mineral deposits: McGraw-Hill Book Co. Inc,New York–London, 930 p.
Mercier, J. L., Simeakis, K., Sorel, D., and Vergely, P., 1988, Ex-tentional tectonic regimes in the Aegean basins during theCenozoic, in The structural and sedimentary evolution of theNeotectonic Aegean Basins: Basin Research, submitted.
Novak, I. D., and Soulakallis, N., 2000, Identifying geomorphicfeatures using Landsat-5 TM data processing techniques onLesvos, Greece: Geomorphology, v. 34, no. 1–2, p. 101–109.
Pe-Piper, G., 1980, The Cenozoic volcanic sequence of Lesbos,Greece: Z. dt. geol. Ges., v. 131, p. 889–901.
Pratt, W. K., 1991, Digital image processing: John Wiley & Sons,New York, 698 p.
Rigol, J. P., and Chica-Olmo, M., 1998, Merging remote sensingimages for geological—environmental mapping: application to

P1: GKW/SPH P2: GKW
Natural Resources Research (NRR) PP113-300036 March 26, 2001 12:28 Style file version Nov. 07, 2000
Structural Analysis for Au Mineralization Using Remote Sensing 293
the Cabo de Gata—Nijar Natural Park, Spain: EnvironmentalGeology, v. 34, no. 2–3, p. 194–202.
Rokos, D., Mavrantza, R., Vamvoukakis, C., St.-Seymour, K., Kar-fakis, I., Kouli, M., and Lamera, S., 2000, Integration of remotesensing, geological and geochemical techniques into a GIS en-vironment for the identification of tectonic and volcanic struc-tures: Lesvos Island, Aegean Sea, Hellas: Fourteenth Intern.Conf. Applied Geologic Remote Sensing (Las Vegas, Nevada),p. 161–168.
Russ, J. C., 1992, The image processing handbook: CRC Press, BocaRaton, Florida, 445 p.
Sabins, F. F., 1997, Remote sensing: principles and interpretation:W. H. Freeman & Company, New York, p. 366–371.
Sillitoe, R. H., 1974, Tectonic segmentation of the Andes: implica-tions for magnetism and metallogeny: Nature, v. 250, no. 5467,p. 542–545.
Sillitoe, R. H., 1993, Gold-rich porphyry copper deposits: geolog-ical model and exploration implications, in Kirkham, R. V.,Sinclair, W. D., Thorpe, R. I., and Duke J. M., eds, MineralDeposits Modelling: Geol. Assoc. Canada, Spec. Paper 40,p. 456–478.
Simeakis, K., Mercier, J. L., Vergely, P., and Kissel, C., 1989, LateCenozoic rotations along the North Aegean trough fault zone(Greece). Structural constraints, in Kissel, C., and Laj, C.,eds, Paleomagnetic Rotations and Continental Deformation,Kluwer Acad. Publ., Dordrecht, p. 131–143.
White, N. C., and Hedenquist, J. W., 1995, Epithermal gold deposits:Soc. Economic Geology Newsletter, v. 23, no 1, p. 9–13.
Woldai, T., 1995, Lithologic and structural mapping in a vegetatedlow-relief terrain using multiple-source remotely sensed data:a case study of the Calanas area in southwest Spain: ITC Jour-nal, v. 2, p. 95–114.