stresses in umbilicals 246812
DESCRIPTION
umbilicalsTRANSCRIPT

Hindawi Publishing CorporationJournal of Applied MathematicsVolume 2012, Article ID 246812, 22 pagesdoi:10.1155/2012/246812
Research ArticleEfficient Fatigue Analysis of Helix Elements inUmbilicals and Flexible Risers: Theory andApplications
Geir Skeie, Nils Sødahl, and Oddrun Steinkjer
Det Norske Veritas AS Riser Technology, Høvik, 1363 Oslo, Norway
Correspondence should be addressed to Geir Skeie, [email protected]
Received 19 January 2012; Revised 30 March 2012; Accepted 11 April 2012
Academic Editor: Carl M. Larsen
Copyright q 2012 Geir Skeie et al. This is an open access article distributed under the CreativeCommons Attribution License, which permits unrestricted use, distribution, and reproduction inany medium, provided the original work is properly cited.
Fatigue analysis of structural components such as helix tensile armors and steel tubes is a criticaldesign issue for dynamic umbilicals and flexible pipes. The basis for assessment of fatigue damageof such elements is the long-term stress cycle distribution at critical locations on the helix elementscaused by long-term environmental loading on the system. The long-term stress cycle distributionwill hence require global dynamic time domain analysis followed by a detailed cross-sectionalanalysis in a large number of irregular sea states. An overall computational consistent and efficientfatigue analysis scheme is outlined with due regard of the cross-sectional analysis techniquerequired for fatigue stress calculation with particular attention to the helix elements. The globalcross-section is exposed to pure bending, tensile, torsion, and pressure loading. The state of thedifferent cross-section elements is based on the global response. Special emphasis is placed onassessment of friction stresses caused by the stick-slip behavior of helix elements in bendingthat are of special importance for fatigue life assessments. The described cross-sectional analysistechniques are based on an extensive literature survey and are hence considered to representindustry consensus. The performance of the described calculation scheme is illustrated by casestudies.
1. Introduction
The required bending flexibility of risers and umbilicals is achieved by arranging strengthand functional elements in a helix geometry. The helix geometry allows the elements toslip in order to release axial stresses built up by cross-sectional bending. This mechanismis essential for arranging flexible risers and umbilicals in compliant configurations that arecapable of absorbing loads due to floater motions in harsh environmental conditions. Thepenalty is, however, that assessment of fatigue stresses in helix elements becomes complex

2 Journal of Applied Mathematics
Slip
Tension
Compression
Figure 1: Slip of helix elements in bending.
z
y
Hotspots
Helix positionsθs
X3
X2
Figure 2: Hotspots and helix positions for fatigue analysis.
due to the stick-slip behavior of helix elements in bending, as in Figure 1. The purpose offatigue analysis is assessment of fatigue damage in all relevant elements in the cross-sectionfor a long-term dynamic loading environment. Fatigue analysis of helix elements such astensile armors and steel tubes is a critical design issue for umbilicals and flexible pipes.Critical areas are normally at the floater interface where bend limiting devices, that is, a bendstiffener or a bellmouth, are applied to avoid overbending in extreme load situations andreduce long-term fatigue loading, see, for example, [1, 2] for further details.
ISO 13628-5 Subsea umbilicals [3] is the main reference for design and load-effectanalysis of umbilicals. This standard requires that fatigue life will be calculated consideringall relevant cyclic loading imposed on the umbilical over its design life. The most onerousfatigue loading for umbilicals in dynamic service is normally as follows:
(1) Wave-induced fatigue loading due to direct wave loading and associated floatermotions;
(2) Vortex-induced vibration (VIV) in steady current conditions.
Both loading scenarios will require fatigue damage calculations in numerous short-term conditions to represent the long-term fatigue loading environment. As an example,wave-induced fatigue analyses will typically require stress calculation in about 100–300stationary irregular sea states each with duration of 1 hour. In addition, an iterative analysisscheme is in general required for consistent assessment of fatigue damage caused by VIV dueto the highly nonlinear stick-slip damping mechanism in bending, see [4] for details.
The basis for assessment of fatigue damage in helix elements is the long-term cycledistribution in several hot-spots, that is, critical positions on the helix cross-section, for arepresentative number of helix positions, that is, positions along the helix in one pitch, asshown in Figure 2.

Journal of Applied Mathematics 3
The main challenge is hence to establish an overall manageable computational schemeto establish fatigue life estimates with sufficient confidence. A computational efficient cross-sectional analysis strategy is hence a vital part of the overall fatigue analysis approach. DNVhas developed a dedicated computer program named Helica to address these design andanalysis challenges [5, 6]. The main capabilities are as follows:
(i) applicable to umbilicals, power cables, flexible risers, and similar unbondedstructures;
(ii) load sharing analysis for combined loading;
(iii) calculation of cross-sectional stiffness properties: axial, bending, and torsion;
(iv) fatigue stress analysis of helix elements considering stick-slip behavior in bending;
(v) Calculation of consistent fatigue stresses by direct application of global responsetime series as external loading.
(vi) calculation of capacity curves for the entire cross-section in compliance withapplicable design codes;
(vii) short-term fatigue life and long-term fatigue analysis capabilities;
(viii) efficient and robust analysis scheme;
(ix) well-documented transparent theoretical formulation representing industry con-sensus;
One of the main drivers behind this development has been to establish an efficient andconsistent fatigue analysis scheme. The main focus of this paper is to give a detaileddescription of the cross-sectional response models applied to achieve an efficient and robustanalysis scheme.
2. Numerical Model
2.1. Introduction
The computational model is based on an essential 2D formulation allowing for cross-sectionalmodeling of composite tubes containing helix elements in an unbonded structure. 2D is hereto be understood as an average description where the averaging is applied in longitudinalpipe direction. The consequence of this is that possible 3D effects close to terminations cannot be handled.
The helix elements are assumed to be arranged in well-defined layers allowing fortreating each helix layer by means of an equivalent tube model with stiffness propertiesassembled from the individual helix elements. Different types of helix elements may beapplied in the same layer to model, for example, umbilicals. Different distance from the cross-sectional centerline may also be specified for the individual elements in the same layer. Allelements are assumed to have linear elastic material properties.
2.2. Response Models
The main purpose of the cross-sectional analysis is to predict the stresses in all interiorelements for an applied external loading. In order to establish efficient response models for

4 Journal of Applied Mathematics
Total modelmodel
Bending model
+
Axis-symmetrical
=
pi and po
MB
MB
T MT T MT
Figure 3: Response models for cross-sectional analysis.
cross-sectional analysis, it is convenient to distinguish between the following load models,see Figure 3:
(i) axis-symmetric loads due to effective tension, torsion moment, and internal andexternal pressure;
(ii) pure bending, that is, constant global cross-section curvature.
Separate response models are established for the different load conditions in order to obtainan overall robust, flexible, and computational efficient numerical solution scheme. Themain purpose and underlying assumptions for these response models are discussed in thefollowing. The purpose of the axis-symmetric response model is to establish the load sharingbetween the individual components of the cross-section as well as contact forces between thelayers under axis-symmetric loading: effective tension, torsion, and hydrostatic pressure loads.This analysis requires a full model of the cross-section and needs to solve the overall staticequilibrium with due regard to interlayer contact. Frictional effects are disregarded in theaxis-symmetrical response model.
Effective tension is used to comply with other software used in this industry segment,like Riflex [7]. The use of effective tension is outlined in Sparks [8].
The bending response model is an analytical model for the calculation of stresses inhelix elements due to cross-sectional bending. The stick-slip model is based on contactforces established by the axis-symmetrical analysis. A major advantage by the analyticalbending model is that bending analysis of the helix elements can be carried out one by onewithout considering a complete model of the cross-section. This ensures a very flexible andefficient computation scheme. The main assumptions of the analytical bending model can besummarized as follows:
(i) constant interlayer contact pressure found by axis-symmetrical analysis. Additionalcontact pressure induced by bending itself is neglected;
(ii) friction/contact between helical elements in the same layer is neglected, forexample, possible blocking/locking interlayer behavior can not be modeledexplicitly;
Journal of Applied Mathematics 5
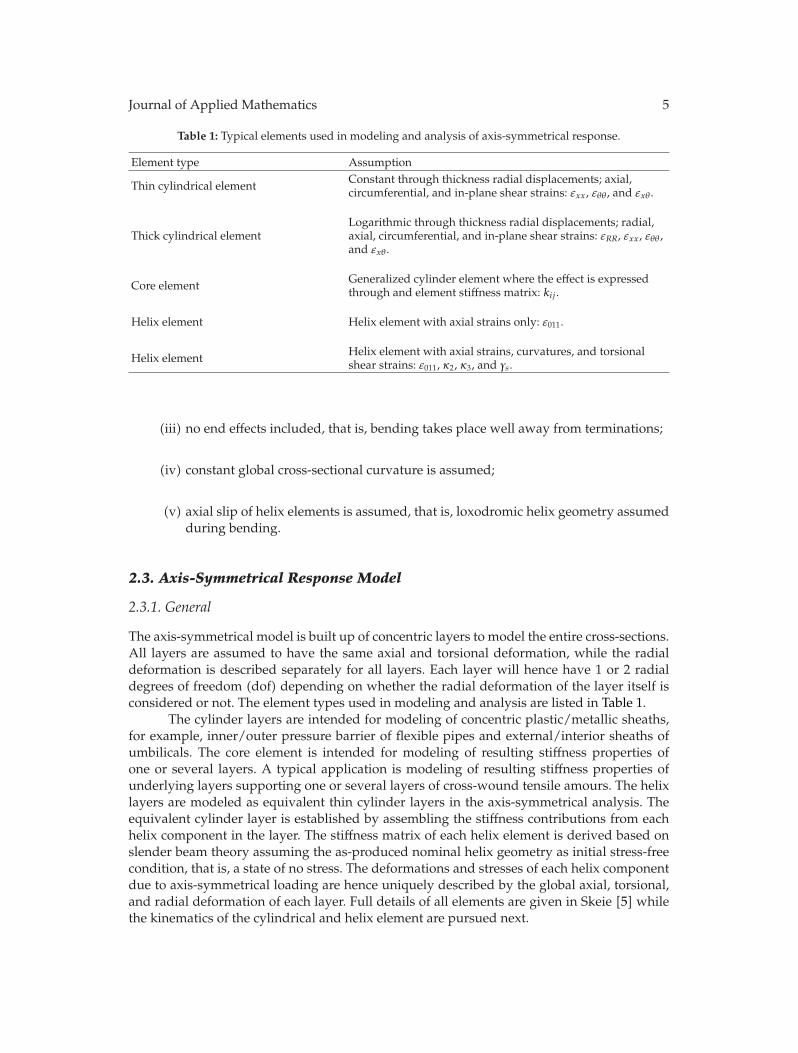
Table 1: Typical elements used in modeling and analysis of axis-symmetrical response.
Element type Assumption
Thin cylindrical element Constant through thickness radial displacements; axial,circumferential, and in-plane shear strains: εxx, εθθ , and εxθ .
Thick cylindrical elementLogarithmic through thickness radial displacements; radial,axial, circumferential, and in-plane shear strains: εRR, εxx, εθθ ,and εxθ .
Core element Generalized cylinder element where the effect is expressedthrough and element stiffness matrix: kij .
Helix element Helix element with axial strains only: ε011.
Helix element Helix element with axial strains, curvatures, and torsionalshear strains: ε011, κ2, κ3, and γs.
(iii) no end effects included, that is, bending takes place well away from terminations;
(iv) constant global cross-sectional curvature is assumed;
(v) axial slip of helix elements is assumed, that is, loxodromic helix geometry assumedduring bending.
2.3. Axis-Symmetrical Response Model
2.3.1. General
The axis-symmetrical model is built up of concentric layers to model the entire cross-sections.All layers are assumed to have the same axial and torsional deformation, while the radialdeformation is described separately for all layers. Each layer will hence have 1 or 2 radialdegrees of freedom (dof) depending on whether the radial deformation of the layer itself isconsidered or not. The element types used in modeling and analysis are listed in Table 1.
The cylinder layers are intended for modeling of concentric plastic/metallic sheaths,for example, inner/outer pressure barrier of flexible pipes and external/interior sheaths ofumbilicals. The core element is intended for modeling of resulting stiffness properties ofone or several layers. A typical application is modeling of resulting stiffness properties ofunderlying layers supporting one or several layers of cross-wound tensile amours. The helixlayers are modeled as equivalent thin cylinder layers in the axis-symmetrical analysis. Theequivalent cylinder layer is established by assembling the stiffness contributions from eachhelix component in the layer. The stiffness matrix of each helix element is derived based onslender beam theory assuming the as-produced nominal helix geometry as initial stress-freecondition, that is, a state of no stress. The deformations and stresses of each helix componentdue to axis-symmetrical loading are hence uniquely described by the global axial, torsional,and radial deformation of each layer. Full details of all elements are given in Skeie [5] whilethe kinematics of the cylindrical and helix element are pursued next.

6 Journal of Applied Mathematics
2.3.2. Kinematics
The kinematic description of the cylindrical and helical layers is essential for the responseof the composite cross-section. The configuration may be described in parametric form. Thecylinder is given by
xc(x, θ) = xix + R cos θiy + R sin θiz. (2.1)
ij denotes the global coordinate system. A helix is a curve on the cylindrical surface followinga fixed trajectory defined by the inclination angle, α. This yields also a relation between thehelical axis denoted s and the polar angle θ. The helix geometry is thus a one-parameterspecialization of the cylinder
xh(s) = xc(s cosα,
s sinαR
)where we have used
θ =s sinαR
= θs, x = s cosα = xs.
(2.2)
It is noted that the relations hold both for the initial and deformed configuration of thegeometry. An orthogonal local triad for the helix is expressed through
g1 =∂xh∂s
= cosαix − sinα sin θsiy + sinα cos θsiz,
g2 =g3 × g1‖g3 × g1‖ = sinαix + cosα sin θsiy − cosα cos θsiz,
g3 =∂xc∂R
= cos θsiy + sin θsiz.
(2.3)
Depending on the length parameter, s, the triad forms an orthonormal set of base vectors asseen in the formulas in (2.3). The deformation of the cylinder consists of three independentcomponents constant change of radius, linear change of angle, and linear extension of theoverall cross-section. The undeformed and deformed geometries are related by
x′ = x +x
Lux, R′ = R + uR, θ′ = θ +
x
Luθ, (2.4)
where we have used primed superscripts to denote the deformed configuration. The globaldisplacement pattern yields a relation between the initial and deformed helix angles
tanα′ =R′θ′
L′ =(R + uR)(θ + uθ)
L + ux= tanα
(1 + uR/R)(1 + Ruθ/L tanα)1 + ux/L
. (2.5)
There exists a relation between the initial curvilinear quantity s and the deformed measure s′
given by
s′ =x′
cosα′ =x(1 + ux/L)
cosα′ =s cosα(1 + ux/L)
cosα′ . (2.6)

Journal of Applied Mathematics 7
The trigonometric quantities are related by
cosα =1√
1 + tan2α, sinα =
tanα√1 + tan2α
. (2.7)
Appropriate strain expressions may be derived from the kinematic relations. The Green-Lagrange strain measure is used in the following, and the linearized expressions are derivedconsistently. The general strain state in the helix elements is expressed in the form
ε11 = ε011 +X2κ2 +X3κ3, 2ε12 = X3γs, 2ε13 = −X2γs, (2.8)
where ε011 is the beam axial strain, κα is the local beam curvature about the two local cross-section axes, and γs denotes the torsional shear strain. The different expression is derivedfrom geometry and is linearized to yield
ε011 =12(g′1 · g′1 − g1 · g1
)=
12
((s cosα(1 + ux/L)
cosα′
)2
− 1
)
= cos2αux
L+ sin2α
uR
R+ R cosα sinα
uθ
L,
(2.9)
where = denotes linearization. The curvatures and shear strain terms are defined accordingly
κα = g′1 · g′α,1 − g1 · gα,1 γs = g′3,1 · g′2 − g3,1 · g2, (2.10)
where the subscript ,1 is used to denote differentiation with respect to the arc-lengthparameter s or direction 1. It is noted that the relation in (2.10) includes stretching of the helixcenterline. Under the assumption that the extension of the centerline is small, it is customaryto use the approximation
∂g′i∂s
≈ ∂g′i∂s
∂s
∂s′=
∂g′i∂s′
. (2.11)
The detailed expressions are then given by
κ2 = 0,
κ3 =sin2α′
R′ − sin2α
R
= 2 sin(α)cos3(α)uθ
L− 2Rsin2(α)cos2(α)
ux
L+
1Rcos(2α)sin2(α)
uR
R,
γs = −cosα′ sinα′
R′ +cosα sinα
R
= − cos2(α) cos(2α)uθ
L+
14R
sin(4α)ux
L− 2Rcos(α)sin3(α)
uR
R
(2.12)

8 Journal of Applied Mathematics
and are consistent with the equations given by Love [9] and also used in Witz and Tan [10].The expressions may be used in the constitutive relations to derive stresses, cross-sectionalproperties, and global stiffness relations through the use of virtual work.
The strains, εRR, εxx, εθθ, and εxθ, in the cylindrical sheets may be found usingequivalent expressions. The convective base vectors are defined by
g1 = gx =∂xc∂x
, g2 = gθ =∂xc∂θ
, g3 = gθ =∂xc∂R
. (2.13)
The covariant linearized strain terms for a thin cylinder are expressed by
εxx = ε11 =12(g′1 · g′1 − g1 · g1
)=ux
L(2.14)
and similar for the other components such that
εθθ =RuR, εxθ =R
Luθ. (2.15)
Physical relevant strain expressions appear when expressing them in an orthonormalcylindrical coordinate frame where g2 = g2/R.
A thick cylinder is also considered where the radial deformation is assumed to varyaccording to
uR(θ, R) = uR(R) =Ri
R2o − R2
i
(−R +
R2o
R
)uRi +
Ro
R2o − R2
i
(R − R2
i
R
)uRo, (2.16)
which then gives rise to radial strains
εRR = ε33 =12(g′3 · g′3 − g3 · g3
)=∂uR
∂R. (2.17)
Ri and Ro denote the inner and outer cylinder radii, respectively.
2.3.3. Governing Equations
The global assembled system of equations for the axis-symmetrical analysis can hence beexpressed as
Kr = R, gi(r) = r inneri+1 − routeri ≥ 0 i ∈ {1, m}. (2.18)
The first equation expresses global equilibrium of the cross-section, while the latter states theimpenetrability condition of them interface layers, see Figure 4.K denotes the stiffnessmatrixassembled from all layers, R is the external load vector, while r is the displacement vectorfor all the unknown degrees of freedom (dof) in the system. Physically, the impenetrability

Journal of Applied Mathematics 9
Layer i + 1
Layer i
Interface
r inneri + 1
routeri
Figure 4: Constraints at layer interfaces.
equations allow for gaps to open between the layers, but they are not allowed to deforminto each other. In order to support an efficient solution of the linear system of equationssubjected to constraints, it is convenient to reformulate the problem as an associated quadraticprogramming (QP) problem. This is a special type ofmathematical optimization problem thatin our case reduces to
minΠ(r) =12rTKr − rTR subjected to Cr < 0. (2.19)
C is a matrix that expresses the interlayer impenetrability constraints discussed above. It isnoted that the two formulations are equivalent and thus yield identical results. The advantageof the latter formulation is that it is widely studied in the literature, and a number of wellestablished and robust solution schemes exists including the interior point method, activeset methods, augmented Lagrangian methods, conjugate gradient methods, and gradientprojections. The basis for solution of our quadratic programming problem is minimizationof the augmented potential energy function which can be expressed as
Πa(r,λ) = Π(r) −m∑i=1
λigi(r), (2.20)
where λi are denoted Lagrange multipliers. Karush-Kuhn-Tucker (KKH) conditions forimpenetrability constraints are
gi ≤ 0, λi ≥ 0, giλi = 0. (2.21)
It can be shown that the Lagrange multipliers are the contact forces between the layers. TheQP solution scheme will hence yield both contact forces and layer displacements as directoutput from the analysis. Layer displacements yield the stresses and strains in all interiorelements of the cross-section, while the layer interface contact forces are crucial input tosubsequent bending analysis of the helix elements. A concentric layer model, depicted inFigure 5, for solving the axis-symmetrical problem has been applied by several authors.However, the solution strategy proposed in this paper has proved to yield a very versatilean efficient axis-symmetrical solver. Extensive validation of the axis symmetrical response

10 Journal of Applied Mathematics
Layer i + 1
Layer i
Interface
Figure 5: Concentric layer model.
Table 2: Axis-symmetrical analysis results—comparison, Vaz et al. [11], Sævik and Bruaseth [12], andSkeie [5].
Feature Test [11] Vaz et al. [11] Sævik and Bruaseth[12] Skeie [5]
EA under tension, (MN) 70–101 82.9 100 79.5Coupling—tension/torsion (m) 0.19 0.21 0.19GJ clockwise, T = 0 kN(kNm2) 14.5–56.0 44.7 44.3 45.4Coupling clockwise—torsion/tension,(rad/m) 182 188 180
GJ anticlockwise, T = 0 kN(kNm2) 15.9–17.2 19.1 19.5 18.7Couplinganticlockwise—torsion/tension,(rad/m)
−406 −330 −343
model has been conducted. Comparison to other published results [10–12] shows very goodcorrelation, Table 2.
2.4. Bending Model
2.4.1. General
The additional stresses due to bending can be derived by assuming that the helix followsa loxodromic curve during cross-sectional bending. This means that the helix remains inits original position on the supporting cylinder surface during bending, and that it slips inaxial direction. This geometrical assumption has gained consensus in the literature, see, forexample, [13–15]. Experiments have also been conducted to validate this assumption, see, forexample, [16]. Based on this geometrical assumption, it is fairly straightforward to establishthe stress components during bending, see, for example, [13, 14]. Full details are given in [5].
The main stress components in a helix element during bending are the following:
(i) local bending stress due to bending about local weak/strong axes of the helix,
(ii) friction stress due to the stick/slip behavior in bending.
It is noted that other models for bending exist and especially the path followed by thehelix when it slips, a loxodromic or the geodesic path. The subject is pursued in a number ofpublications, and discussionsmay be found in Feret and Bournazel [17], Out and vonMorgan[18], Kraincanic and Kebadze [14], and Østergaard et al. [19] among others.

Journal of Applied Mathematics 11
u
iβ ρ
(ρβ−R
R
cos θ) sin u
(ρβ-
ρβ-
Rco
sθ)
cosu
ix
IX
Iβ
Figure 6: Torus parametric coordinates.
2.4.2. Kinematics
The undeformed configuration of the helical element is described in Section 2.3.2. The modelnow considers a pure bending behavior, and the deformed configuration is thus a torus. Theparametric representation of the torus may be written as
xtc(u, θ) =(ρβ − R cos θ
)sinuix +
(ρβ −
(ρβ − R cos θ
)cosu
)iβ + R sin θiβ′ , (2.22)
where ρβ is the radius of curvature in the β direction, and the global coordinate is located atthe center of the bent cylinder. ij denotes the global coordinate frame, while iβ is the axis ofcurvature, while iβ′ is the axis that is not bent. This is shown in Figure 6. The formulas holdfor iβ = iy and a careful use of the right sign should be exercised when iβ = iz. The helixelement lay on the loxodromic curve which, again, is a specialization of the torus
xth(s) = xch(us, θs) = xch(sκβ cosα,
s sinαR
)=(ρβ − R cos θs
)sinusix +
(ρβ −
(ρβ − R cos θs
)cosus
)iβ + R sin θsiβ′ ,
(2.23)
where we have used
θs =s sinαR
, us = sκβ cosα. (2.24)

12 Journal of Applied Mathematics
Figure 7: Forces on infinitesimal helix element ds.
The axial strains may be derived in the same way as in Section 2.3.2,
ε011 =12(g′1 · g′1 − g1 · g1
)= − Rκβ cos2α sin θs, (2.25)
and the same for the curvatures and shear strain
κ2 = cosα(1 + sin2α
)sin θsκ, κ3 = cos4α cos θsκ, γs = −cos3α sinα cos θsκ, (2.26)
where again we have used the approximation that g′1 is a unit vector.
2.4.3. Stick-Slip Behavior
The local bending stresses can be expressed as
σb = E[X2 cosα
(1 + sinα2 cos θs
)]κβ + E
[X3 cosα4 sin θs
]κβ, (2.27)
where E is the Young’s modulus, α is the helix lay angle, and κβ denotes the cross-sectional curvature with the radius in β-axis direction. X2 and X3 are the local coordinatesfor calculation of bending stresses, see Figure 2. It should be noted that the local bendingstress only depends on the cross-sectional curvature and is hence not linked to the stick-slip behavior of the helix element in bending. These stress components may thereforebe computed separately. A response model for the stick-slip behavior can be establishedby considering the equilibrium between axial force built up in the helix element due tobending and the friction forces restraining axial displacement, see Figure 7. Equilibriumconsiderations in axial direction of an infinitesimal helix element give the following slipcriterion:
dN
ds> f, (2.28)
whereN denotes the axial force in helix element, and f is the available friction force per unitlength.
Thus, slip will start when the tension gradient exceeds the available friction. Thiscriterion governs onset of slip, but it gives no information on the behavior of the helix afterslip initiation. Equilibrium considerations between slip/stick parts of the helix are required

Journal of Applied Mathematics 13
Stick Slip
S
F = N
Figure 8: Slip progression from neutral axis.
to study the slip progression after onset. Assuming that the helix element is completely fixedon the supporting cylinder, the axial force due to cross-sectional bending is given by
N = −EAR cosα2 sin θsκβ, (2.29)
where R is the helix radius, A is the helix cross-sectional area, and θs is helix position angle.This stick force is valid for the situation where the friction force between the helix element andsupporting cylinder prevents axial slip of the helix element. The corresponding axial forcegradient can hence be expressed as
dN
ds= −EA cosα2 sinα cos θsκβ. (2.30)
This expression shows that a significant force gradient will develop along a helix fixed toa supporting cylinder bent to a constant curvature. It is seen that the axial force gradient islargest at the neutral axis, θs = 0. Slip will hence start at the neutral axis. The critical curvaturefor onset of slip at the neutral axis is given by
κ0cr =
f
−EA cosα2 sinα. (2.31)
The available friction can be determined from the axis-symmetric analysis by the followingexpression:
f = qiμi + qoμo. (2.32)
μi and μo are the inner- and outer-side friction coefficient, respectively, and qi and qo denotesthe associated inner and outer contact force per unit length along the helix. After onset, theslip will progress along the helix away from the neutral axis for increasing curvature asillustrated in Figure 8. To find an expression for the slip progression after onset, it is required
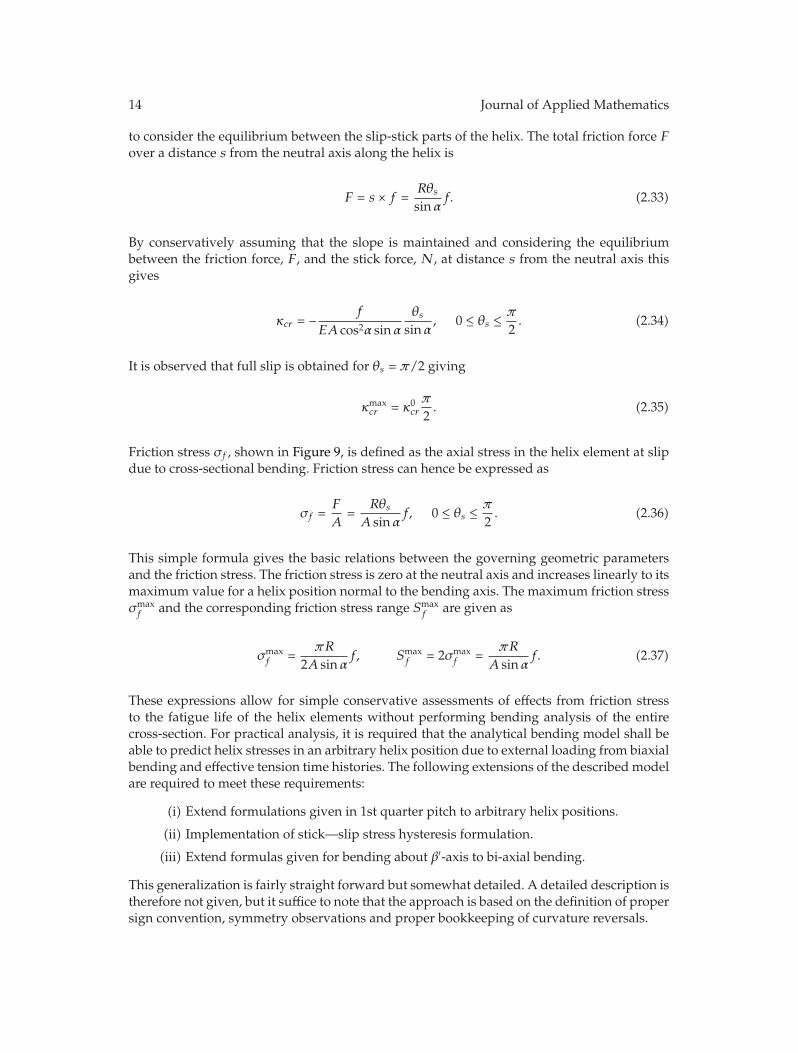
14 Journal of Applied Mathematics
to consider the equilibrium between the slip-stick parts of the helix. The total friction force Fover a distance s from the neutral axis along the helix is
F = s × f =Rθssinα
f. (2.33)
By conservatively assuming that the slope is maintained and considering the equilibriumbetween the friction force, F, and the stick force, N, at distance s from the neutral axis thisgives
κcr = − f
EA cos2α sinαθs
sinα, 0 ≤ θs ≤ π
2. (2.34)
It is observed that full slip is obtained for θs = π/2 giving
κmaxcr = κ0
cr
π
2. (2.35)
Friction stress σf , shown in Figure 9, is defined as the axial stress in the helix element at slipdue to cross-sectional bending. Friction stress can hence be expressed as
σf =F
A=
RθsA sinα
f, 0 ≤ θs ≤ π
2. (2.36)
This simple formula gives the basic relations between the governing geometric parametersand the friction stress. The friction stress is zero at the neutral axis and increases linearly to itsmaximum value for a helix position normal to the bending axis. The maximum friction stressσmaxf and the corresponding friction stress range Smax
f are given as
σmaxf =
πR
2A sinαf, Smax
f = 2σmaxf =
πR
A sinαf. (2.37)
These expressions allow for simple conservative assessments of effects from friction stressto the fatigue life of the helix elements without performing bending analysis of the entirecross-section. For practical analysis, it is required that the analytical bending model shall beable to predict helix stresses in an arbitrary helix position due to external loading from biaxialbending and effective tension time histories. The following extensions of the described modelare required to meet these requirements:
(i) Extend formulations given in 1st quarter pitch to arbitrary helix positions.
(ii) Implementation of stick—slip stress hysteresis formulation.
(iii) Extend formulas given for bending about β′-axis to bi-axial bending.
This generalization is fairly straight forward but somewhat detailed. A detailed description istherefore not given, but it suffice to note that the approach is based on the definition of propersign convention, symmetry observations and proper bookkeeping of curvature reversals.

Journal of Applied Mathematics 15
Stick Slip
k kcr
σ
σf
Figure 9: Definition of friction stress.
An example of the performance of the bending hysteresis model for tensile armorstresses is displayed in the Figure 10 for a harmonic curvature loading history. A significantvariation in the effect from friction stress for different helix positions is observed. Thisunderlines the importance of consistent treatment of friction stresses due to bi-axial bendingin fatigue analysis of helix elements.
3. Case Studies
3.1. Capacity Curves
The extreme stress capacity is most conveniently determined in terms of a cross-sectionalcapacity curve. ISO 13628-5 Subsea umbilicals [3] describes allowable combinations ofcurvature and effective tension that can be applied to the cross-sectionwithout compromisingthe structural integrity of the interior strength and functional elements. Examples of umbilicalcapacity curves are shown in Figure 11 for different utilization levels reflecting differentmodes of operation, for example, installation and in-place operation. The utilization levelis defined according to allowable stress levels, σa, related to the yield stress, σa = kuσy, whereσy denotes the yield stress, and ku is a utilization factor. Similar considerations also holdfor strains that are typically used for plastic sheaths. The methodology as outlined in theprevious section is applied to determine stresses in all interior elements for combined tensionand curvature loading. The utilization in each component is evaluated against acceptancecriteria given in, for example, [3] or other relevant design codes. The capacity curve is finallyestablished as the allowable effective tension and curvature combinations that ensure that thestresses in all interior elements fulfill the defined acceptance criteria. A recursive calculationscheme is applied for consistent calculation of capacity curves of cross-sections with higher-order composite helix elements, for example, cables applied in helix geometry in the cross-section [5, 6]. The procedure is as follows:
(1) establish capacity curve and resulting stiffness properties of the composite helixcomponent. This is done by a separate straightforward cross-sectional analysisusing a cross-sectional model of the composite helix component only;

16 Journal of Applied Mathematics
Bending axis
MPa
Central core R = 76.2 mm
Rectangular armor 5 × 10 mm
− 38 in inner layer, α = 35◦
− 42 in outer layer, α = 36.6◦
E = 2.1 × 10⁵ MPa
Friction μ = 0.2
Axial force 1000 kN
Curvature κ = ± 0.3 m−1
600
700
800
500
400
300
200
100
0
600
500
400
300
200
100
0
π
2
π
2
π
4
π
4
−100
Tot
al h
elix
str
ess
Tot
al h
elix
str
ess
Curvature
−0.0
004
−0.0
003
−0.0
002
−0.0
001 0
0.00
01
0.00
02
0.00
03
0.00
04
Curvature
−0.0
004
−0.0
003
−0.0
002
−0.0
001 0
0.00
01
0.00
02
0.00
03
0.00
04
mm−1
Figure 10: Performance of the bending hysteresis model.
(2) include composite helix component in the total cross-sectional model in terms ofequivalent stiffness—geometrical parameters established from (1). Load sharinganalysis yields tension as well as local curvature acting on the composite helixcomponent. Utilization in the composite helix component is then based on thecapacity curve from (1).

Journal of Applied Mathematics 17
0 200 400 600 8000
0.05
0.1
0.15
0.2
0.25
0.3
80% utilization90% utilization100% utilization
Effective tension ( )Tc
Cur
vatu
re,κ
Figure 11: Example of umbilical capacity curves.
Several levels of recursive calculation can be applied to establish consistent capacitycurves of complex cross-sectional layouts. The main benefit of the recursive calculationscheme is that very complex cross-sections can be subdivided into simpler components thatcan be solved by standard cross-section analysis without having to build a comprehensiveoverall cross-sectional model.
3.2. Fatigue Analysis
3.2.1. System Description
Fatigue analysis of rectangular cross-wound tensile armors of an umbilical operated froma turret-moored FPSO in typical Norwegian environmental conditions is considered [20].The umbilical is arranged in a classic wave configuration with bend stiffener interface to thefloater, see Figure 12. The fatigue loading environment is described by the omnidirectionalwave scatter diagram.
3.2.2. Analysis Methodology
The main steps in the fatigue analysis are the following:
(i) discretization of the wave scatter diagram into representative number of blocks.Each block covers several sea states in the wave scatter diagram. 30 blocks are usedin the present study to represent the long-term fatigue loading;
(ii) perform global response analyses for all blocks in the wave scatter diagramconsidering all heading and direction combinations as defined in Table 3. A totalof 270 short-term global response analyses is hence required to describe the long-term fatigue loading on the system;

18 Journal of Applied Mathematics
Far positionNear position
Windsea
Windsea
WindseaWindseaWindsea
5%5%
15%
60%
15%
15◦
15◦
15◦
15◦
Figure 12: Umbilical operated from a turret-moored FPSO.
Table 3: Fatigue load case description.
Vessel heading (deg) Direction Probability of vessel heading per direction0 Near 60%15 Near 30%30 Near 10%0 Far 60%15 Far 30%30 Far 10%0 Cross 60%15 Cross 30%30 Cross 10%
(iii) perform helix fatigue analysis for all fatigue loading conditions using simultaneoustime histories of biaxial curvature and effective tension from the global analysis asinput.
The methodology as outlined in [21] is used as basis for the wave scatter diagramdiscretization to achieve fatigue life estimates with adequate statistical confidence.
Global nonlinear time domain dynamic analysis is conducted by means of the Riflexfinite element analysis (FEA), [7], computer program for static and dynamic analysis of

Journal of Applied Mathematics 19
Te(t)
Kx(t)
Ky(t)
σ(t)-fatigue stress time seriesFa
tigu
e st
ress
Time
Num
ber
of c
ycle
s
Stress cycles
Cycle histogram
Figure 13: Short-term fatigue analysis for one hotspot/helix location.
slender marine structures. Dynamic simulations with duration of 1 hour are conductedin each block of the wave scatter diagram considering random wave loading. Responsetime histories are stored for subsequent fatigue analysis at 76 locations along the umbilicalcovering potential critical areas including bend stiffener area, buoyancy section, and touch-down area. The main steps in the subsequent short-term helix fatigue analysis conducted foreach fatigue load case are the following:
(i) establish fatigue stress time histories at all locations/hotspots. This analysis isperformed by combined axis-symmetrical analysis and bending analysis at eachtime step. In this way, the interlayer contact forces governing the stick-slip bendingresponse are updated according to the instantaneous effective tension loading;
(ii) establish cycle histogram by rain flow counting of the generated fatigue stress time.
This procedure is outlined in Figure 13. The long-term helix fatigue analysis consists of thefollowing steps:
(i) accumulate long-term cycle histograms at all locations/hotspots with due consider-ation of the probability of occurrence of the short-term fatigue loading conditions;
(ii) establish fatigue life from the long-term cycle histograms.
Key figures for the helix fatigue analysis are summarized in Table 4. The key figuresfor the global analyses and subsequent fatigue analyses show that the computational efforts

20 Journal of Applied Mathematics
Table 4: Key figures for the helix fatigue analysis.
Number of hot-spots (corner points) 4Number of helix locations 12Total number of fatigue stress time series calculations of 1-hour duration (270 × 76 × 4 × 12) 984960
0 20 40 60 80 100 120
0 20 40 60 80 100 120
Cycle histogram
Fatigue damage histogram
Num
ber
of c
ycle
sFa
tigu
e d
amag
e
Stress range
Stress range
With frictionNo friction
Mpa
Figure 14: Long-term cycle histogram and fatigue damage at most critical hot-spot location.
required are substantial. It should be emphasized that this example is of representative sizefor this type of analysis.
3.2.3. Evaluation of Results and Numerical Performance
Analyses have been conducted with two different models for stress calculation:
(i) helix model with stick-slip modeling included;
(ii) helix model with no friction.
The latter model is included as a reference case only. This approach produce quite similarresults as the so-called straight tube analogy (STA) widely used in the industry for fatigue lifeassessment of helix structures. The long-term cycle distribution and corresponding fatiguedamage is shown in Figure 14 for the most critical hot-spot location. The following can beconcluded:
(i) a pronounced peak in the cycle histogram is observed at 15MPa. This correspondsto the maximum friction stress range;
(ii) the effect from frictional stresses is decisive for fatigue life prediction. Consistenttreatment of the stick-slip behavior in bending is hence essential;

Journal of Applied Mathematics 21
(iii) a substantial part of the fatigue damage can be attributed to the upper part of thestress cycle histogram, that is, to relatively few large stress cycles. It is thereforeessential that the duration of the short-term simulations is sufficient to give arepresentative frequency of large stress cycles.
The total computation time for the helix fatigue analysis on a standard single core lap top isabout 5 hours. The computation time is highly acceptable considering the size of the problem.Parallel computing functionality is included in the software; thus, the computation time maybe reduced proportional to the number of available processors. No numerical instabilities oranomalies were detected.
4. Conclusions
An overall computational consistent and highly efficient helix fatigue analysis scheme hasbeen established. This has been achieved by combined use of a versatile and efficientaxis-symmetrical solver with an analytical helix bending model. This model ensures fullconsistency with the global response model as the computational efficiency allows forapplication of global response time histories as direct loading on the cross-sectional responsemodel. The effect from frictional stresses is decisive for fatigue life prediction. Consistenttreatment of the stick-slip behavior in bending is hence essential for fatigue life prediction onnonbonded cross-sections containing helix elements.
References
[1] N. Sødahl and T. Ottesen, “Bend stiffener design for umbilicals,” in Proceedings of the 30th InternationalConference on Ocean, Offshore and Arctic Engineering (OMAE ’11), Rotterdam, The Netherlands, 2011.
[2] A. M. Rustadand, N. Sødahl, A. J. Kalleklev et al., “Use of weight elements to improve the dynamicperformance of umbilicals,” in Proceedings of the International Conference on Ocean, Offshore and ArcticEngineering (OMAE ’10), vol. 5, pp. 171–175, Shanghai, China, 2010.
[3] “Petroleum and natural gas industries design and operation of subsea production systems,” part 5,Subsea umbilicals, 2009.
[4] N. Sødahl, O. Steinkjer, E. Gjølmesli, and K. Hansen-Zahl, “Consistent VIV analysis methodology forumbilicals,” in Proceedings of the 30th International Conference on Ocean, Offshore and Arctic Engineering(OMAE ’11), Rotterdam, The Netherlands, 2011.
[5] G. Skeie, “Cross sectional analysis of flexible pipes and umbilicals,” Tech. Rep. 2122, DNV Research& Innovation, 2006.
[6] N. Sødahl, O. Steinkjer, and R. Bahiense, Helica Users Manual, DNV, 2009.[7] Marinetek, Riflex User Manual, 2009.[8] C. P. Sparks, “Influence of tension, pressure and weight on pipe and riser deformations and stresses,”
Journal of Energy Resources Technology, Transactions of the ASME, vol. 106, no. 1, pp. 46–54, 1984.[9] A. E. H. Love,ATreatise on theMathematical Theory of Elasticity, Dover, NewYork, NY, USA, 4th edition,
1944.[10] J. A. Witz and Z. Tan, “On the axial-torsional structural behavior of flexible pipes, umbilicals and
marine cables,” Marine Structures, vol. 5, pp. 205–227, 1992.[11] M.A. Vaz, L. A. D. Aguiar, S. F. Estefen, andM. Brack, “Experimental determination of axial, torsional
and bending stiffiness of umbilical cables,” in Proceedings of the 17th International Offshore & ArcticEngineering Conference (OMAE ’98), p. 7, Fairfield, NJ, USA, 1998.
[12] S. Sævik and S. Bruaseth, “Theoretical and experimental studies of the axisymmetric behaviour ofcomplex umbilical cross-sections,” Applied Ocean Research, vol. 27, no. 2, pp. 97–106, 2005.
[13] J. A. Witz and Z. Tan, “On the exural structural behavior of flexible pipes, umbilicals and marinecables,”Marine Structures, vol. 5, pp. 229–249, 1992.
[14] I. Kraincanic and E. Kebadze, “Slip initiation and progression in helical armouring layers ofunbonded flexible pipes and its effect on pipe bending behaviour,” The Journal of Strain Analysis forEngineering Design, vol. 36, no. 3, pp. 265–275, 2001.

22 Journal of Applied Mathematics
[15] S. Sævik and K. I. Ekeberg, “Non-linear stress analysis of complex umbilical cross-sections,” inProceedings of the 21st International Conference on Offshore Mechanics and Arctic Engineering (OMAE ’02),vol. 1 of ASME Conference Proceedings, pp. 211–217, June 2002.
[16] A. Dobson and D. Fogg, “Fatigue testing and analysis of a deep water steel tube umbilical,” inProceedings of the 27th International Conference on Offshore Mechanics and Arctic Engineering (OMAE ’08),vol. 3 of ASME Conference Proceedings, pp. 133–140, June 2008.
[17] J. J. Feret and C. L. Bournazel, “Calculation of stresses and slip in structural layers of unbondedflexible pipes,” Journal of Offshore Mechanics and Arctic Engineering, vol. 109, no. 3, pp. 263–269, 1987.
[18] J. M. M. Out and B. J. von Morgen, “Slippage of helical reinforcing on a bent cylinder,” EngineeringStructures, vol. 19, no. 6, pp. 507–515, 1997.
[19] N. H. Østergaard, A. Lyckegaard, and J. H. Andreasen, “A method for prediction of the equilibriumstate of a long and slender wire on a frictionless toroid applied for analysis of flexible pipe structures,”Engineering Structures, vol. 34, no. 1, pp. 391–399, 2012.
[20] N. Sødahl, G. Skeie, O. Steinkjer, and A. J. Kalleklev, “Effcient fatigue analysis of helix elements inumbilicals and flexible risers,” in Proceedings of the 29th International Conference on Ocean, Offshore andArctic Engineering (OMAE ’10), vol. 5 ofASME Conference Proceedings, pp. 1029–1037, Shanghai, China,June 2010.
[21] O. Steinkjer, N. Sødahl, and G. Grytøyr, “Methodology for time domain fatigue life assessment ofrisers and umbilicals,” in Proceedings of the 29th International Conference on Ocean, Offshore and ArcticEngineering (OMAE ’10), ASME Conference Proceedings, pp. 177–184, Shanghai, China, June 2010.

Submit your manuscripts athttp://www.hindawi.com
Hindawi Publishing Corporationhttp://www.hindawi.com Volume 2014
MathematicsJournal of
Hindawi Publishing Corporationhttp://www.hindawi.com Volume 2014
Mathematical Problems in Engineering
Hindawi Publishing Corporationhttp://www.hindawi.com
Differential EquationsInternational Journal of
Volume 2014
Applied MathematicsJournal of
Hindawi Publishing Corporationhttp://www.hindawi.com Volume 2014
Probability and StatisticsHindawi Publishing Corporationhttp://www.hindawi.com Volume 2014
Journal of
Hindawi Publishing Corporationhttp://www.hindawi.com Volume 2014
Mathematical PhysicsAdvances in
Complex AnalysisJournal of
Hindawi Publishing Corporationhttp://www.hindawi.com Volume 2014
OptimizationJournal of
Hindawi Publishing Corporationhttp://www.hindawi.com Volume 2014
CombinatoricsHindawi Publishing Corporationhttp://www.hindawi.com Volume 2014
International Journal of
Hindawi Publishing Corporationhttp://www.hindawi.com Volume 2014
Operations ResearchAdvances in
Journal of
Hindawi Publishing Corporationhttp://www.hindawi.com Volume 2014
Function Spaces
Abstract and Applied AnalysisHindawi Publishing Corporationhttp://www.hindawi.com Volume 2014
International Journal of Mathematics and Mathematical Sciences
Hindawi Publishing Corporationhttp://www.hindawi.com Volume 2014
The Scientific World JournalHindawi Publishing Corporation http://www.hindawi.com Volume 2014
Hindawi Publishing Corporationhttp://www.hindawi.com Volume 2014
Algebra
Discrete Dynamics in Nature and Society
Hindawi Publishing Corporationhttp://www.hindawi.com Volume 2014
Hindawi Publishing Corporationhttp://www.hindawi.com Volume 2014
Decision SciencesAdvances in
Discrete MathematicsJournal of
Hindawi Publishing Corporationhttp://www.hindawi.com
Volume 2014
Hindawi Publishing Corporationhttp://www.hindawi.com Volume 2014
Stochastic AnalysisInternational Journal of