stress var and systemic risk indicators - imf · pdf filestress var and systemic risk...
TRANSCRIPT
Stress VaR and Systemic Risk Indicators Private Sector Applications of How to Measure Systemic Interconnectedness
IMF Conference On Operationalizing Systemic
Risk Monitoring
Richard Berner
Chief U.S. Economist
Co-Head, Global Economics May 28, 2010
Courtesy Morgan Stanley; © 2010 Morgan Stanley. All references to this presentation and the author’s comments should be properly attributed orally or in writing to Morgan Stanley

prototype template (5428278)\print library_new_final.ppt 7/16/2010
2
• Stress VaR at Morgan Stanley
• Indicators of systemic risk
Plan of Talk
prototype template (5428278)\print library_new_final.ppt 7/16/2010
3
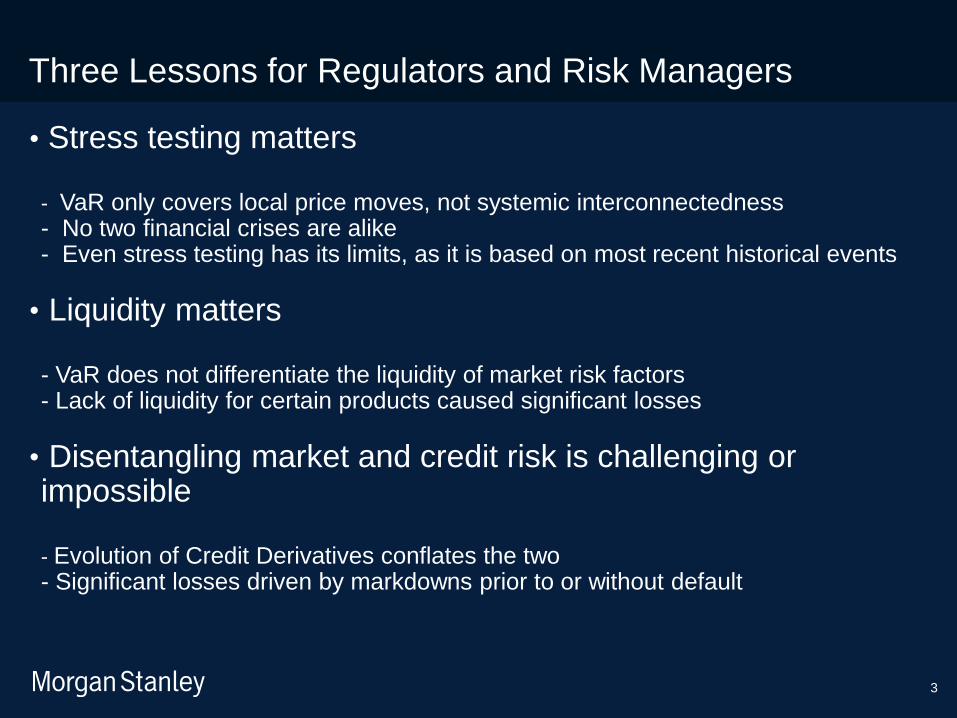
• Stress testing matters - VaR only covers local price moves, not systemic interconnectedness - No two financial crises are alike - Even stress testing has its limits, as it is based on most recent historical events
• Liquidity matters - VaR does not differentiate the liquidity of market risk factors - Lack of liquidity for certain products caused significant losses
• Disentangling market and credit risk is challenging or impossible
- Evolution of Credit Derivatives conflates the two - Significant losses driven by markdowns prior to or without default
Three Lessons for Regulators and Risk Managers

prototype template (5428278)\print library_new_final.ppt 7/16/2010
4
What is Stress-VaR?
Stress VaR (S-VaR) is a forward-looking measure of portfolio risk that attempts to
quantify extreme tail risk calculated over a long time horizon (1 year).
Step 1: Perform Monte Carlo simulations of systematic risk factors and add specific
risks, including jumps, gaps and severe discontinuities.
Step 2: Pick the 99% confidence level expected tail loss from the resulting total P&L
distribution.
The result: A VaR-like, reverse stress test measure. Instead of specifying the
stress scenarios, the process selects the most adverse outcomes and then
identifies the scenarios that produce them.
S-VaR aims to provide a comprehensive perspective of risks: Market, credit, and gap
risks, illiquidity horizons and jumps-to-default.
prototype template (5428278)\print library_new_final.ppt 7/16/2010
5
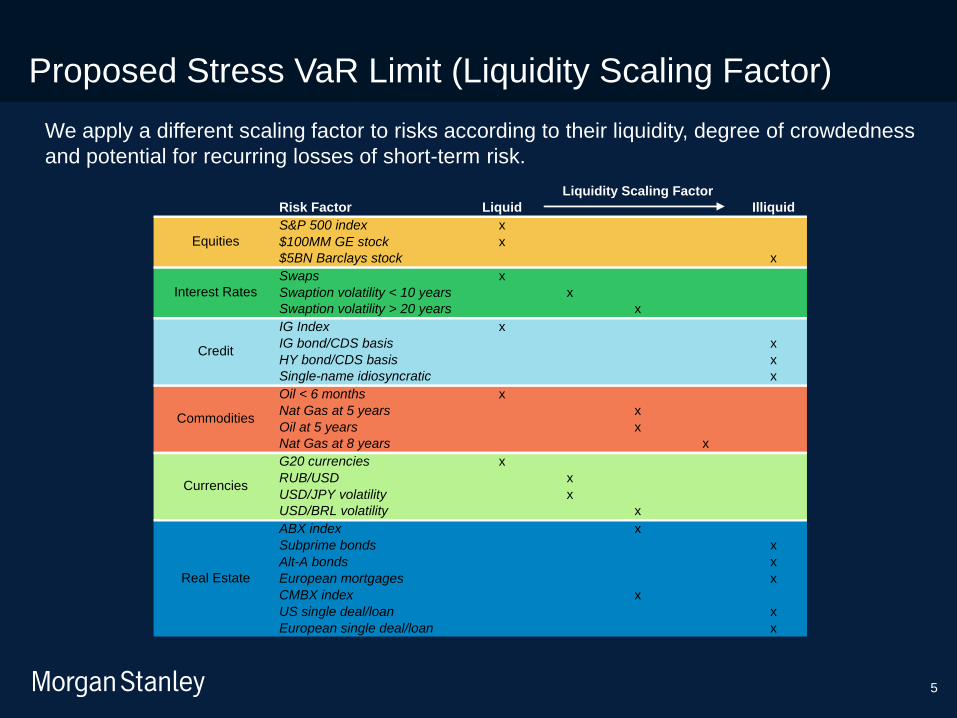
We apply a different scaling factor to risks according to their liquidity, degree of crowdedness
and potential for recurring losses of short-term risk.
Proposed Stress VaR Limit (Liquidity Scaling Factor)
Risk Factor Liquid Illiquid
S&P 500 index x
$100MM GE stock x
$5BN Barclays stock x
Swaps x
Swaption volatility < 10 years x
Swaption volatility > 20 years x
IG Index x
IG bond/CDS basis x
HY bond/CDS basis x
Single-name idiosyncratic x
Oil < 6 months x
Nat Gas at 5 years x
Oil at 5 years x
Nat Gas at 8 years x
G20 currencies x
RUB/USD x
USD/JPY volatility x
USD/BRL volatility x
ABX index x
Subprime bonds x
Alt-A bonds x
European mortgages x
CMBX index x
US single deal/loan x
European single deal/loan x
Liquidity Scaling Factor
Credit
Commodities
Currencies
Real Estate
Equities
Interest Rates

prototype template (5428278)\print library_new_final.ppt 7/16/2010
6
Key Differences Between VaR and S-VaR
Feature VaR Stress VaR
Time horizon 1 day / 10 day 1 year
Liquidity Consideration
N / A Included
Time Series Recent 25 years
Volatility Correlation
Static Stochastic
JTD Risk
Not included Included

prototype template (5428278)\print library_new_final.ppt 7/16/2010
7
-30%
-25%
-20%
-15%
-10%
-5%
0%
97.0% 97.5% 98.0% 98.5% 99.0% 99.5% 100.0%
Percentiles
Lo
ss
Average Tail Loss
Example of S&P 500 Price Move (Weekly)
Average tail loss captures the distribution of tail events beyond a certain confidence level.

prototype template (5428278)\print library_new_final.ppt 7/16/2010
8
• During crisis period, correlation between Equity and Interest Rates tends to increase.
• S-VaR tries to capture systematic pattern of correlation changes and volatilities.
Example: Time-varying correlation between US Equities and US Interest Rates
-1.0
-0.8
-0.6
-0.4
-0.2
0.0
0.2
0.4
0.6
0.8
1.0
80 81 83 85 87 89 91 93 95 97 99 01 03 05 07
Co
rrela
tio
n (
6m
o r
oll
ing
)
Crash of
1987
S&L Crisis
1989
Asian
Crisis 1997
Russia
LTCM 1998
Credit
Crisis 2007
Internet
Bubble &
9/11
25 Year History and the Correlation Pattern in Crisis

prototype template (5428278)\print library_new_final.ppt 7/16/2010
9
• Unsecured interbank lending rates: LIBOR/OIS
• Bid-ask spreads and haircuts across asset classes
• Tail-risk indicators across asset classes: Volatility and Skew
Indicators of Systemic Risk

prototype template (5428278)\print library_new_final.ppt 7/16/2010
10
LIBOR Spread Re-Widening: Euro Stress and Regulation
Source: Bloomberg
0
50
100
150
200
250
300
350
400
Jun-07 Nov-07 Apr-08 Sep-08 Feb-09 Jul-09 Dec-09 May-10
Spread of 3-Month LIBOR over expected average fed funds rate over the next three months (based on 3-month OIS)
TAF (Dec. 12, 2007)
TSLF (Mar. 11, 2008)
PDCF (Mar. 17, 2008)
SLS (Apr. 19, 2008)
CPFF (Oct. 7, 2008)
TALF & LSAPs (Nov. 25, 2008)
LSAPs II (Mar. 18, 2009)

prototype template (5428278)\print library_new_final.ppt 7/16/2010
11
Stress Indicators: Agency CMOs
5
6
7
8
9
10
11
12
Aug-07 Apr-08 Dec-08 Aug-09 Apr-10
Open & O/N
1 Week
1 Month
2 Month
3 Month
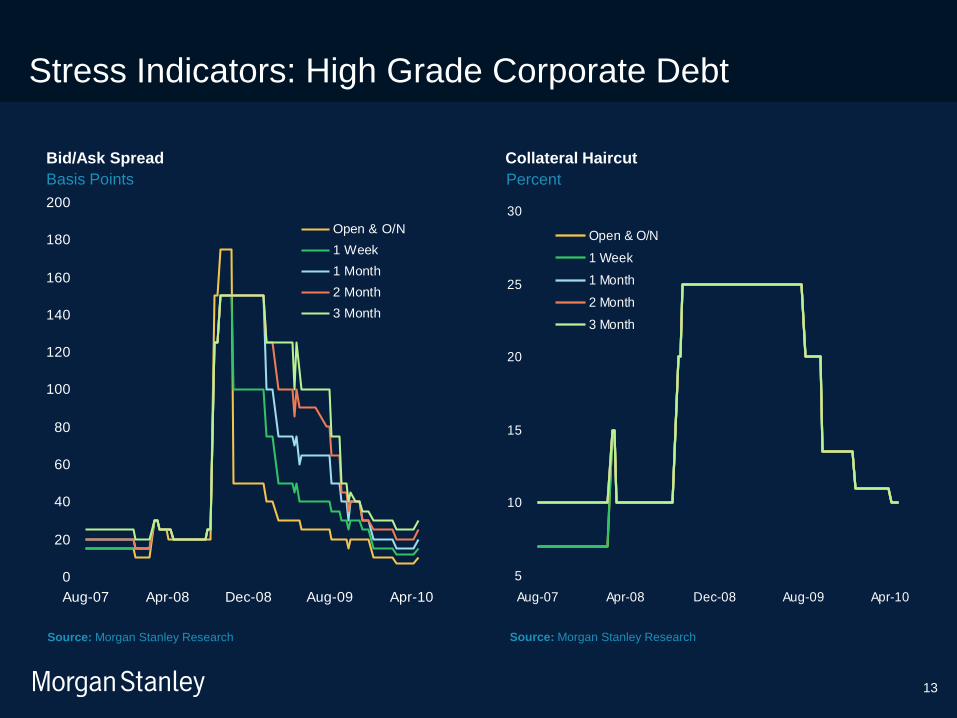
Collateral Haircut
0
20
40
60
80
100
120
Aug-07 Apr-08 Dec-08 Aug-09 Apr-10
Open & O/N
1 Week
1 Month
2 Month
3 Month
Basis Points
Bid/Ask Spread
Source: Morgan Stanley Research Source: Morgan Stanley Research
Percent

prototype template (5428278)\print library_new_final.ppt 7/16/2010
12
Stress Indicators: Alt-A MBS
0
10
20
30
40
50
60
Aug-07 Apr-08 Dec-08 Aug-09 Apr-10
Open & O/N
1 Week
1 Month
2 Month
3 Month
Collateral Haircut
0
50
100
150
200
250
Aug-07 Apr-08 Dec-08 Aug-09 Apr-10
Open & O/N
1 Week
1 Month
2 Month
3 Month
Basis Points
Bid/Ask Spread
Source: Morgan Stanley Research Source: Morgan Stanley Research
Percent
prototype template (5428278)\print library_new_final.ppt 7/16/2010
13
Stress Indicators: High Grade Corporate Debt
5
10
15
20
25
30
Aug-07 Apr-08 Dec-08 Aug-09 Apr-10
Open & O/N
1 Week
1 Month
2 Month
3 Month
Collateral Haircut
0
20
40
60
80
100
120
140
160
180
200
Aug-07 Apr-08 Dec-08 Aug-09 Apr-10
Open & O/N
1 Week
1 Month
2 Month
3 Month
Basis Points
Bid/Ask Spread
Source: Morgan Stanley Research Source: Morgan Stanley Research
Percent

prototype template (5428278)\print library_new_final.ppt 7/16/2010
14
Stress Indicators: High Yield Corporate Debt
10
15
20
25
30
35
40
Aug-07 Apr-08 Dec-08 Aug-09 Apr-10
Open & O/N
1 Week
1 Month
2 Month
3 Month
Collateral Haircut
0
50
100
150
200
250
Aug-07 Apr-08 Dec-08 Aug-09 Apr-10
Open & O/N
1 Week
1 Month
2 Month
3 Month
Basis Points
Bid/Ask Spread
Source: Morgan Stanley Research Source: Morgan Stanley Research
Percent

prototype template (5428278)\print library_new_final.ppt 7/16/2010
15
Vol and Yield Curves: Systemic Risk Indicators?
0
10
20
30
40
50
60
70
80
86 88 90 92 94 96 98 00 02 04 06 08 10
VIX (20-Day Moving Average) Median
Ave+1SD Ave-1SD
(150)
(100)
(50)
0
50
100
150
200
250
300
350
90 92 94 96 98 00 02 04 06 08 10
10-Year / 2-Year Treasury Spread
2-Year Treasury / Fed Funds Spread
Basis Points
Source: CBOE Note: May 2010 – December 2011 values represent Morgan Stanley Research estimates.
Source: Federal Reserve, Morgan Stanley Research
Higher Volatility Here to Stay Curve Will Flatten Bearishly Next Year

prototype template (5428278)\print library_new_final.ppt 7/16/2010
16
Beyond Volatility: Look to Skew For Tail Risks; Highest In Equities and Credit, Lowest in Rates
* Pre-Crisis Average is the average level from 7/1/06 through 6/30/07
Note: Rate volatility is in normalized basis points, credit volatility is volatility of spreads, and all others are price return volatility
Source: Morgan Stanley Research, Morgan Stanley Quantitative and Derivative Strategies, Bloomberg
Asset Class Asset
Current
Vol Level
2006-
2007
Average*
Change in 3m
Implied Vol
since Apr 9
6m
Percentile
Change in
Skew since
Apr 9
6m
Percentile
Change in
Spread / Price
since Apr 9
Rates US 10y Swap Rates 120 bps 67 bps 18 bps 72% -13 bps 3% -56 bps
FX EUR/USD 16.5% 7% 5.7% 99% 1.7% 100% -7.5%
AUD/USD 20.7% 8% 9.4% 100% 4.2% 100% -12.4%
Equities SPX 34.2% 13% 18.2% 99% 5.2% 99% -10.3%
SX5E 37.3% 15% 18.3% 99% 7.2% 100% -14.2%
KOSPI 25.6% 19% 8.2% 99% 4.5% 100% -7.9%
Credit CDX IG 85% NA 37.5% 98% 4.1% 96% 36.6 bps
iTraxx Main 107% NA 41.8% 99% 3.4% 96% 49.5 bps
Commodities Oil 39.6% 29% 10.1% 77% 0.9% 97% -16.2%
Gold 24.5% 19% 1.6% 70% 1.7% 44% 1.7%
• Complete market reset: European sovereign stresses, fears of a potential global economic slowdown and an unwind of “risk
on” trades has completely repriced most asset classes.
• Volatility relationships experience a complete reversal: Volatility has risen the most in equities, credit and EUR/USD today.
Volatility is slightly cheaper in oil and gold, and it is cheapest now in USD rates markets.
• Tail risks jump: Skew, or the relative pricing of OTM options indicates much downside fear in equities, credit and EUR/USD.
Skew is more muted in oil and gold, but in USD rates, there is little incremental tail risk priced in.
• How to hedge today? Extreme skew can serve to balance high levels of volatility, providing an opportunity to sell large tail
scenarios to fund smaller ones. We favor selling tail risks in equities, commodities and currencies. In credit, we prefer to sell
OTM calls to fund hedges, and we look to buy tail risks in USD rates.
prototype template (5428278)\print library_new_final.ppt 7/16/2010
17
Disclosures The information and opinions in Morgan Stanley Research were prepared by Morgan Stanley & Co. Incorporated, and/or Morgan Stanley C.T.V.M. S.A. and their affiliates (collectively, "Morgan Stanley").
For important disclosures, stock price charts and rating histories regarding companies that are the subject of this report, please see the Morgan Stanley Research Disclosure Website at www.morganstanley.com/researchdisclosures, or contact your investment representative or Morgan Stanley Research at 1585 Broadway, (Attention: Equity Research Management), New York, NY, 10036 USA.
Global Research Conflict Management Policy
Morgan Stanley Research observes our conflict management policy, available at www.morganstanley.com/institutional/research/conflictpolicies.
Important Disclosure for Morgan Stanley Smith Barney LLC Customers
The subject matter in this Morgan Stanley report may also be covered in a similar report from Citigroup Global Markets Inc. Ask your Financial Advisor or use Research Center to view any reports in addition to this report.
Important Disclosures
Morgan Stanley Research does not provide individually tailored investment advice. It has been prepared without regard to the circumstances and objectives of those who receive it. Morgan Stanley recommends that investors independently evaluate particular investments and strategies, and encourages them to seek a financial adviser's advice. The appropriateness of an investment or strategy will depend on an investor's circumstances and objectives. Morgan Stanley Research is not an offer to buy or sell any security or to participate in any trading strategy. The value of and income from your investments may vary because of changes in interest rates or foreign exchange rates, securities prices or market indexes, operational or financial conditions of companies or other factors. Past performance is not necessarily a guide to future performance. Estimates of future performance are based on assumptions that may not be realized.
With the exception of information regarding Morgan Stanley, research prepared by Morgan Stanley Research personnel is based on public information. Morgan Stanley makes every effort to use reliable, comprehensive information, but we do not represent that it is accurate or complete. We have no obligation to tell you when opinions or information in Morgan Stanley Research change apart from when we intend to discontinue research coverage of a company. Facts and views in Morgan Stanley Research have not been reviewed by, and may not reflect information known to, professionals in other Morgan Stanley business areas, including investment banking personnel.
To our readers in Taiwan: Morgan Stanley Research is distributed by Morgan Stanley Taiwan Limited; it may not be distributed to or quoted or used by the public media without the express written consent of Morgan Stanley. To our readers in Hong Kong: Information is distributed in Hong Kong by and on behalf of, and is attributable to, Morgan Stanley Asia Limited as part of its regulated activities in Hong Kong; if you have any queries concerning it, contact our Hong Kong sales representatives.
Morgan Stanley Research is disseminated in Japan by Morgan Stanley Japan Securities Co., Ltd.; in Canada by Morgan Stanley Canada Limited, which has approved of and takes responsibility for its contents in Canada; in Germany by Morgan Stanley Bank AG, Frankfurt am Main, regulated by Bundesanstalt fuer Finanzdienstleistungsaufsicht (BaFin);in Spain by Morgan Stanley, S.V., S.A., a Morgan Stanley group company, supervised by the Spanish Securities Markets Commission(CNMV), which states that it is written and distributed in accordance with rules of conduct for financial research under Spanish regulations; in the US by Morgan Stanley & Co. Incorporated, which accepts responsibility for its contents. Morgan Stanley & Co. International plc, authorized and regulated by Financial Services Authority, disseminates in the UK research it has prepared, and approves solely for purposes of section 21 of the Financial Services and Markets Act 2000, research prepared by any affiliates. Private UK investors should obtain the advice of their Morgan Stanley & Co. International plc representative about the investments concerned. RMB Morgan Stanley (Proprietary) Limited is a member of the JSE Limited and regulated by the Financial Services Board in South Africa. RMB Morgan Stanley (Proprietary) Limited is a joint venture owned equally by Morgan Stanley International Holdings Inc. and RMB Investment Advisory (Proprietary) Limited, which is wholly owned by FirstRand Limited.

prototype template (5428278)\print library_new_final.ppt 7/16/2010
18
Disclosures (continued) Trademarks and service marks in Morgan Stanley Research are their owners' property. Third-party data providers make no warranties or representations of the accuracy, completeness, or timeliness of their data and shall not have liability for any damages relating to such data. The Global Industry Classification Standard (GICS) was developed by and is the exclusive property of MSCI and S&P. Morgan Stanley bases projections, opinions, forecasts and trading strategies regarding the MSCI Country Index Series solely on public information. MSCI has not reviewed, approved or endorsed these projections, opinions, forecasts and trading strategies. Morgan Stanley has no influence on or control over MSCI's index compilation decisions. Morgan Stanley Research or portions of it may not be reprinted, sold or redistributed without the written consent of Morgan Stanley. Morgan Stanley research is disseminated and available primarily electronically, and, in some cases, in printed form. Additional information on recommended securities/instruments is available on request. The information in Morgan Stanley Research is being communicated by Morgan Stanley & Co. International plc (DIFC Branch), regulated by the Dubai Financial Services Authority (the DFSA), and is directed at wholesale customers only, as defined by the DFSA. This research will only be made available to a wholesale customer who we are satisfied meets the regulatory criteria to be a client.
The information in Morgan Stanley Research is being communicated by Morgan Stanley & Co. International plc (QFC Branch), regulated by the Qatar Financial Centre Regulatory Authority (the QFCRA), and is directed at business customers and market counterparties only and is not intended for Retail Customers as defined by the QFCRA.
As required by the Capital Markets Board of Turkey, investment information, comments and recommendations stated here, are not within the scope of investment advisory activity. Investment advisory service is provided in accordance with a contract of engagement on investment advisory concluded between brokerage houses, portfolio management companies, non-deposit banks and clients. Comments and recommendations stated here rely on the individual opinions of the ones providing these comments and recommendations. These opinions may not fit to your financial status, risk and return preferences. For this reason, to make an investment decision by relying solely to this information stated here may not bring about outcomes that fit your expectations.

prototype template (5428278)\print library_new_final.ppt 7/16/2010
19
The Americas
1585 Broadway
New York, NY 10036-8293
United States
Tel: +1 (1) 212 761 4000
Europe
20 Bank Street, Canary Wharf
London E14 4AD
United Kingdom
Tel: +44 (0)20 7 425 8000
Japan
4-20-3 Ebisu, Shibuya-ku
Tokyo 150-6008
Japan
Tel: +81 (0)3 5424 5000
Asia/Pacific
1 Austin Road West
Kowloon
Hong Kong
Tel: +852 2848 5200
© 2010 Morgan Stanley