stress response, behavior, and development are shaped by...
TRANSCRIPT

RESEARCH ARTICLE
Stress response, behavior, and development
are shaped by transposable element-induced
mutations in Drosophila
Gabriel E. RechID1, Marıa Bogaerts-MarquezID
1, Maite G. Barron1, Miriam MerencianoID1,
Jose Luis Villanueva-Cañas1, Vivien HorvathID1, Anna-Sophie Fiston-LavierID
2,
Isabelle Luyten3, Sandeep VenkataramID4, Hadi QuesnevilleID
3, Dmitri A. Petrov4☯,
Josefa GonzalezID1☯*
1 Institute of Evolutionary Biology (IBE), CSIC-Universitat Pompeu Fabra, Barcelona, Spain, 2 Institut des
Sciences de l’Evolution de Montpellier (UMR 5554, CNRS-UM-IRD-EPHE), Universite de Montpellier, Place
Eugène Bataillon, Montpellier, France, 3 URGI, INRA, Universite Paris-Saclay, Versailles, France,
4 Department of Biology, Stanford University, Stanford, CA, United States of America
☯ These authors contributed equally to this work.
Abstract
Most of the current knowledge on the genetic basis of adaptive evolution is based on the
analysis of single nucleotide polymorphisms (SNPs). Despite increasing evidence for their
causal role, the contribution of structural variants to adaptive evolution remains largely unex-
plored. In this work, we analyzed the population frequencies of 1,615 Transposable Element
(TE) insertions annotated in the reference genome of Drosophila melanogaster, in 91 sam-
ples from 60 worldwide natural populations. We identified a set of 300 polymorphic TEs that
are present at high population frequencies, and located in genomic regions with high recom-
bination rate, where the efficiency of natural selection is high. The age and the length of
these 300 TEs are consistent with relatively young and long insertions reaching high fre-
quencies due to the action of positive selection. Besides, we identified a set of 21 fixed TEs
also likely to be adaptive. Indeed, we, and others, found evidence of selection for 84 of
these reference TE insertions. The analysis of the genes located nearby these 84 candidate
adaptive insertions suggested that the functional response to selection is related with the
GO categories of response to stimulus, behavior, and development. We further showed that
a subset of the candidate adaptive TEs affects expression of nearby genes, and five of them
have already been linked to an ecologically relevant phenotypic effect. Our results provide a
more complete understanding of the genetic variation and the fitness-related traits relevant
for adaptive evolution. Similar studies should help uncover the importance of TE-induced
adaptive mutations in other species as well.
Author summary
Transposable elements are fragments of genomic DNA that have the ability to move
around the genome by creating new copies of themselves. Although there is evidence
PLOS Genetics | https://doi.org/10.1371/journal.pgen.1007900 February 12, 2019 1 / 33
a1111111111
a1111111111
a1111111111
a1111111111
a1111111111
OPEN ACCESS
Citation: Rech GE, Bogaerts-Marquez M, Barron
MG, Merenciano M, Villanueva-Cañas JL, Horvath
V, et al. (2019) Stress response, behavior, and
development are shaped by transposable element-
induced mutations in Drosophila. PLoS Genet 15
(2): e1007900. https://doi.org/10.1371/journal.
pgen.1007900
Editor: Sarah Schaack, Reed College, UNITED
STATES
Received: August 2, 2018
Accepted: December 16, 2018
Published: February 12, 2019
Copyright: © 2019 Rech et al. This is an open
access article distributed under the terms of the
Creative Commons Attribution License, which
permits unrestricted use, distribution, and
reproduction in any medium, provided the original
author and source are credited.
Funding: JG is funded by the European
Commission (https://erc.europa.eu/) grant number
H2020-ERC-2014-CoG-647900. DAP is funded by
the National Institutes of Health (https://www.nih.
gov/) grant numbers R01-GM089926 and R35-
GM118165. The funders had no role in study
design, data collection, and analysis, decision to
publish or preparation of the manuscript.
Competing interests: The authors have declared
that no competing interests exist.

suggesting that transposable elements play important roles in genome function and
genome evolution, our current understanding is based on the analysis of a subset of all
transposable element insertions present in the genome, in only a few natural populations.
Advances in genome sequencing and bioinformatics tools allow us now to investigate all
transposable element insertions in genomes across continents. In this work, we analyzed
the age, size, and frequency of 1,615 transposable elements in 91 samples from 60 world-
wide natural populations of the model species Drosophila melanogaster. The genomic
regions surrounding 84 transposable elements indicate that they could have an adaptive
effect for the flies that carry them. These insertions are located nearby genes involved in
stress response, behavior and development suggesting that these biological processes are
affected by transposable element insertions.
Introduction
Understanding how organisms adapt to local environmental conditions requires identifying
the loci and the phenotypic traits potentially targeted by natural selection, which should also
provide critical knowledge for how organisms will respond to environmental change [1–3].
Organisms from plants to humans harbor genetic variation within and among populations
that allows them to adapt to diverse local environments [4–6]. Genome scans for selection
have almost exclusively focused on identifying single nucleotide polymorphisms (SNPs). How-
ever, while the role of other types of genetic variants, such as transposable element (TE) inser-
tions and segmental duplications, in local adaptation has been suggested, these variants are
often poorly characterized [7–10]. This is mainly due to technical limitations: short-read
sequencing technologies make TE discovery and accurate genotyping difficult. However, deci-
phering the genetic basis of adaptation requires comprehensive knowledge of these other types
of genetic variants, as there is evidence that they are important contributors to adaptive varia-
tion [9, 11, 12].
TEs are mobile DNA fragments that constitute a substantial albeit variable proportion of
virtually all the genomes analyzed to date [13, 14]. TEs can create a variety of mutations from
gene disruption to changes in gene expression and chromosome rearrangements [14, 15].
Although the majority of TE-induced mutations are deleterious or neutral, there are multiple
instances in which individual TE insertions have been shown to play a role in adaptive evolu-
tion [10–12, 16]. In humans, MER41 insertions, a family of endogenous retroviruses, have dis-
persed interferon-inducible enhancers that promote the transcription of innate immunity
factors [17]. In Drosophila melanogaster, the insertion of an Accord retrotransposon in the
upstream region of Cyp6g1 gene leads to transcript up-regulation and increased resistance to
several insecticides [18, 19].
However, only a few genome-wide screens have tried to systematically assess the role of TEs
in adaptive evolution. In humans, the only screen so far focused on the analysis of a particular
TE family, LINE-1 elements, and found that a fraction of these elements showed signatures of
positive selection [20]. In D. melanogaster, genome-wide screens were initially performed
based on a PCR-approach that only allowed studying a subset of all the euchromatic TEs pres-
ent in the reference genome [7, 8, 21]. Later on, a genome-wide screening using bioinformatics
approaches was also performed in this species [22]. In Arabidopsis thaliana, genome-wide
analysis of TE insertions revealed that TEs affect nearby gene expression and local patterns of
DNA methylation, with some of these insertions likely to be involved in adaptation [23, 24].
Thus, while at the moment limited to species with good TE sequence annotations and genome
Adaptive insertions in Drosophila
PLOS Genetics | https://doi.org/10.1371/journal.pgen.1007900 February 12, 2019 2 / 33

datasets, genome-wide screens for putatively adaptive insertions are a promising strategy to
identify genetic variants underlying adaptive evolution [25].
D. melanogaster is to date one of the best model systems to identify the genetic and func-
tional basis of adaptive evolution. Originally from sub-tropical Africa, D. melanogaster has
adapted in recent evolutionary time to a wide-range of environmental conditions [26, 27].
Indeed, there are hundreds of genome sequences available from worldwide populations [28,
29]. This species has one of the best functionally annotated genomes, which facilitates the iden-
tification of traits under selection [30]. In addition, TE annotations in the D. melanogaster ref-
erence genome continue to be updated by the research community [31–33].
In this work, we screened 303 individual genomes, and 83 pooled samples (containing from
30 to 702 genomes each) from 60 worldwide natural D. melanogaster populations to identify
the TE insertions most likely involved in adaptive evolution (Fig 1). We focused on TE inser-
tions annotated in the reference genome because for these insertions we can analyze their age
and length, which are informative about their population dynamics [21, 34, 35]. In addition to
the age and the size of the 1,615 TEs analyzed, we calculated five different statistics to detect
potentially adaptive TE insertions. The GO enrichment analysis of the genes located nearby
our set of candidate adaptive insertions pinpoint response to stimulus, behavior, and develop-
ment as the traits more likely to be shaped by TE-induced mutations. Consistent with these
results, genes located nearby our set of candidate adaptive TEs are significantly enriched for
previously identified loci underlying stress- and behavior-related traits. Overall, our results
suggest a widespread contribution of TEs to adaptive evolution in D. melanogaster and pin-
point relevant traits for adaptation.
Results
Natural populations of D. melanogaster contain hundreds of polymorphic
TEs at high population frequencies
To identify TEs likely to be involved in adaptation, we looked for TEs present at high popula-
tion frequencies, and located in genomic regions with high recombination rates (see Material
and Methods). We expect TEs that increase the fitness of their carriers to be present at high
frequency in the population(s) where adaptation took place [36–39]. In addition, among all
the TEs present at high frequencies, TEs located in regions with high recombination rates are
less likely to have increased in frequency neutrally compared with TEs located in low recombi-
nation regions. This is so because the efficiency of selection in genomic regions with low
recombination rates tends to be lower due to the increase in noise generated by linked selec-
tion such as background selection and recurrent selective sweeps [35, 40]. Moreover, TEs
located in low recombination regions are more likely to be linked to an adaptive mutation
rather than being the causal mutation [36–38].
We first estimated population frequencies, using T-lex2 [33], for 1,615 reference TE inser-
tions in 91 samples from 60 worldwide natural populations: 39 European, 14 North American,
five Australian, one Asian, and one African population collected in the ancestral range of the
species (Fig 1 and S1 Table) (see Material and Methods). T-lex2 estimates both the presence
and the absence of insertions [33]. Thus, for individual genomes, T-lex2 can distinguish
between homozygous and heterozygous insertions. To estimate TE frequencies from pooled
samples, T-lex2 takes into account the number of reads supporting the presence and the num-
ber of reads supporting the absence of that particular insertion. We classified the 1,615 TEs
based on their population frequencies obtained with Tlex2 [33], and on their genomic location
in high or low recombination regions (Fig 2, S2 Table, see Material and Methods). 808 of the
1,615 TEs were present in regions with low recombination rate. Most of these TEs (79%, 640
Adaptive insertions in Drosophila
PLOS Genetics | https://doi.org/10.1371/journal.pgen.1007900 February 12, 2019 3 / 33

out of 808 TEs) were fixed, defined here as being present at> 95% frequency in all samples, in
all the populations analyzed. Among the 807 TEs located in regions with high recombination
rates, 215 were fixed and 177 were present at low frequencies (LowFreq), defined here as being
present at� 10% frequency in each of the analyzed samples (Fig 2). Note that the percentage
of fixed TEs in high recombination regions is significantly lower than the percentage in low
recombination regions (27% vs 79% respectively, Chi-squared p-value = 2.2e-16), as expected
if the efficiency of selection is lower in low recombination regions, and slightly deleterious TEs
reached fixation neutrally [35, 40]. Finally, 300 of the 807 TEs located in high recombination
regions were present at high frequencies (HighFreq), defined here as being present at< 95%
frequency overall and at>10% frequency in at least three samples (Fig 2, S1 Fig).
We further classified these 300 TEs according to their frequency in African (AF) and/or
out-of-Africa (OOA) populations: seven TEs were only present at high frequencies in the Afri-
can population analyzed (AF), 111 were present at high frequencies both in African and in the
out-of-Africa populations (AF-OOA), and 174 were present at high frequencies only in the
out-of-Africa populations (OOA, Fig 2). TEs present at high frequencies both in African and
out-of-Africa populations are more likely to be involved in global (shared) adaptations, while
TEs present only in African or only in out-of-Africa populations could be involved in local
adaptation. Overall, we identified 300 polymorphic TEs present at high frequencies and
located in high recombination regions of the genome, which could have increased in frequency
due to positive selection. However, it is also possible that some or many of these 300 TEs have
increased in frequency neutrally.
Fig 1. Worldwide distribution of D. melanogaster populations used in this study. Location of the 39 European, 14 North American, five Australian, one Asian, and
one African population analyzed in this work. Note that the location of some populations overlap in the map. For more details, see S1 Table. Colors indicate the five
major Koppen climate zones [114].
https://doi.org/10.1371/journal.pgen.1007900.g001
Adaptive insertions in Drosophila
PLOS Genetics | https://doi.org/10.1371/journal.pgen.1007900 February 12, 2019 4 / 33

Age and length of TEs present at high frequencies in regions with high
recombination are consistent with a putatively adaptive role of these
insertions
In addition to the population frequency, the age of a TE insertion can be informative about
whether a TE is more likely to be adaptive, neutral, or deleterious. A young TE present at high
population frequencies is more likely to have increased in frequency due to recent positive
selection, while old TEs present at high population frequencies might have slowly drifted to
high frequency [21, 25]. Note that it is entirely possible that such old TEs did increase in fre-
quency due to positive selection and have been maintained by balancing selection since then
[41]. Nonetheless, in this paper we primarily focus on the identification of the subset of TEs
that are most likely to be adaptive and are willing to tolerate potentially high false negative
rates.
We estimated the age of all the TEs annotated in the reference genome using a phylogenetic
approach (5,416 TEs, see Material and Methods). Briefly, we estimated the unique number of
substitutions shared between the two closest TEs assuming that they all derived from a com-
mon ancestral TE within each family. We compared our TE age estimates with previously
available data for 437 TEs [21, 42]. Among the 417 TEs present in the two datasets, there are
Fig 2. Workflow showing the main steps applied for identifying TEs present at high frequencies in high
recombination regions in the D. melanogaster genome. LRR: TEs located at low recombination rate regions. HRR:
TEs located at high recombination rate regions. Fixed: HRR TEs at frequencies> 95% in all populations. LowFreq: low
frequency HRR TEs (frequencies< 10% in all samples). HighFreq: high frequency HRR TEs (frequencies< 95% in all
samples and at>10% frequency in at least three samples). HighFreq TEs were further classified according to their
frequency in African (AF) and/or out-of-Africa (OOA) populations: AF: TEs at high frequency only in the African
population; AF-OOA: TEs at high frequency in Africa and out-of-Africa populations; OOA: TEs at high frequency in
out-of-Africa populations and low frequency in the African population and NA-AF: TEs present at high frequency in
out-of-Africa populations but for which we have no data for the African population.
https://doi.org/10.1371/journal.pgen.1007900.g002
Adaptive insertions in Drosophila
PLOS Genetics | https://doi.org/10.1371/journal.pgen.1007900 February 12, 2019 5 / 33

10 TE insertions in our dataset that according to the TE age distributions were outliers
(showed much higher age values estimates, S2A Fig). When we removed these 10 data points
the correlation between the age estimates from the two studies was high (r2: 0.71, p-value <
2.20e-16, S2B Fig). Note that the TE age estimates obtained by these methods depend on the
dataset used for generating the phylogenies, which differ between the two studies (437 TEs vs
5,416 TEs, S2 Fig).
We compared the TE age distributions between the different frequency groups, and we fur-
ther classified TEs as “young” or “old” insertions according to whether the estimated terminal
branch length was < 0.01 or� 0.01, respectively (see Material and Methods). As mentioned
above, most of the TEs in low recombination regions are fixed. Accordingly, we found that
TEs present in low recombination regions and Fixed TEs in high recombination regions
showed similar age distributions (Wilcoxon test, p-value = 0.321, Fig 3A) and contained a
large proportion of old TEs, 71% and 75% respectively, as expected if these two datasets con-
tain mostly neutral TEs (Fig 3B, Table 1). The age distribution of these two groups was differ-
ent from the LowFreq and the HighFreq groups overall (Wilcoxon test, p-value < 2.20e-16,
Fig 3A).
Fig 3. TE age of the different frequency groups. A) Top: Boxplots showing the distribution of TE age (terminal branch length) values for each of the categories.
Bottom: Zoomed-in version of the boxed area showing the lowest values of the TE age distribution. B) Proportion of young (age< 0.01) and old (age� 0.01) TEs in
each category. � p-value< 0.05, ��� p-value< 0.001 from Chi-square test.
https://doi.org/10.1371/journal.pgen.1007900.g003
Adaptive insertions in Drosophila
PLOS Genetics | https://doi.org/10.1371/journal.pgen.1007900 February 12, 2019 6 / 33

We found that all LowFreq TEs were young TEs (Fig 3B, Table 1). This result is consistent
with LowFreq TEs being slightly deleterious mutations that have not been yet removed from
populations by purifying selection. Finally, the three subgroups of HighFreq TEs contained
mostly young TEs (Fig 3B, Table 1).
The length of a TE can also be informative about whether a TE is more likely to be adaptive,
neutral, or deleterious. Because longer TEs are more likely to act as substrates for ectopic
recombination leading to deleterious rearrangements, if a TE is long but it is present at high
population frequencies, it is more likely to be adaptive [16, 34, 43]. In contrast, shorter TEs are
both more likely to be nearly neutral in their selective effect due to lower rate of ectopic recom-
bination among shorter homologous sequences, and in addition more likely to be older and
thus shorter because of the high rate of DNA loss in Drosophila [44]. We used the TE length
ratio, calculated as the proportion of the length of the TE insertion regarding the length of the
canonical family sequence, as a proxy for measuring the relative length of the TEs in each
group. We found statistically significant differences between the HighFreq and the other three
TE groups: LowFreq, Fixed, and TEs in low recombination regions (S3A Table). In particular,
HighFreq and LowFreq TEs showed distributions of TE Length Ratio shifted upwards
(median: 59.3 and 80.4, respectively), while the distributions of Fixed TEs and TEs in low
recombination regions are shifted downwards, showing a predominance of shorter TEs
(mean: 16.2 and 30.7, respectively) (Fig 4 and S3A Table). No differences in the TE length ratio
among the HighFreq TEs subgroups were found (Kruskal Wallis test, p = 0.062) (S3A Table).
Similar results were obtained when we controlled for the age of the insertions (S3A Fig and
S3B and S3C Table), and the class identity of the insertions (S3B Fig and S3D, S3E and S3F
Table) in each frequency category.
When considering both age and length of the TEs across different categories, we found that
Fixed TEs and TEs in low recombination regions show a predominance of older and truncated
TEs (Fig 4), which is consistent with old TE insertions that have reached fixation through pro-
cesses other than positive selection. On the other hand, the HighFreq and LowFreq groups
contain mostly large and young TEs (Fig 4). In the case of LowFreq TEs, these results are con-
sistent with the hypothesis that low frequency TEs could be recent insertions that purifying
selection still did not have time to eliminate. Finally, young and large HighFreq TEs support
the hypothesis of the presence in this group of a large number of recent putatively functional
insertions that have rapidly increase in frequency due to the action of positive selection.
Table 1. Age distribution of TEs belonging to the different population frequency categories.
TE category Old Young P-value� Enrichment
All 608 (48%) 661 (52%) - -
LRR 480 (71%) 198 (29%) 2.20e-16 Old TEs
HRR All 128 (22%) 463 (78%) - -
Fixed 100 (76%) 31 (24%) 2.33e-14 Old TEs
LowFreq 0 (0%) 177 (100%) 2.20e-16 Young TEs
HighFreq All 28 (10%) 255 (90%) 2.20e-16 Young TEs
NA-AF 0 (0%) 8 (100%) 6.22e-03 Young TEs
AF 0 (0%) 7 (100%) 6.22e-03 Young TEs
AF-OOA 19 (19%) 82 (81%) 4.63e-12 Young TEs
OOA 9 (5%) 158 (95%) 2.20e-16 Young TEs
�P-values are from Chi-square tests comparing TEs at each category with the expectations based on “All TEs”. Note that TEs without age or category classification were
excluded from this analysis.
https://doi.org/10.1371/journal.pgen.1007900.t001
Adaptive insertions in Drosophila
PLOS Genetics | https://doi.org/10.1371/journal.pgen.1007900 February 12, 2019 7 / 33

TEs present at high frequencies in high recombination regions showed
different signatures of positive selection
To test whether HighFreq TEs showed signatures of positive selection, we used two different
approaches: we looked for signatures of selective sweeps in the regions flanking the candidate
adaptive TEs, and we looked for evidence of population differentiation between populations
located at the extremes of latitudinal clines in three continents: Europe (EU), North America
(NA), and Australia.
To look for signatures of selective sweeps in the vicinity of the candidate TE insertions, we
used three different haplotype-based methods in order to identify different signals of selection:
(i) the iHS test mainly detects events of hard sweeps [45], (ii) the H12 test detects both hard
and soft sweeps [46], and (iii) the nSL test detects sweeps under different scenarios, and it is
more robust to recombination rate variation [47]. We independently applied these tests to two
datasets: one dataset containing 141 strains from the Raleigh population in NA, and a second
dataset containing 158 strains from four different populations in EU. Note that EU popula-
tions do not show latitudinal population structure, and thus we analyzed them together [48]
(see Material and Methods). Overall, we were able to calculate at least one test, in at least one
Fig 4. Number of TEs at different TE length ratios (%). Bars indicate number of TEs (vertical axis) per bin of TE Length Ratio (%) (horizontal axis) and color shade
indicates the proportion of young and old TEs in each bin.
https://doi.org/10.1371/journal.pgen.1007900.g004
Adaptive insertions in Drosophila
PLOS Genetics | https://doi.org/10.1371/journal.pgen.1007900 February 12, 2019 8 / 33

of the two continents, for 202 of the 300 HighFreq TE insertions (S4 Table). To determine the
significance of iHS and nSL values, we compared them with the distribution of values obtained
from neutral SNPs, while for H12 we selected the top 15% values (see Material and Methods).
Overall, 36 TEs showed evidence of selection (Fig 5 and S5 Table). The three tests identified
similar numbers of significant TEs (Chi-square test, p-value = 0.350, S4 Table), however the
overlap between the TEs identified by the different tests was low (S4A Fig). These results sug-
gest that these 36 TEs could be evolving under different selective scenarios, including both
hard and soft sweeps.
Fig 5. HighFreq TEs with signals of selection. 41 HighFreq TEs showing at least one signal of selection either or both
in the selective sweep tests (iHS, H12 or nSL, 36 TEs) or the population differentiation test (FST, 9 TEs). Red and grey
circles indicate statistical significance for each TE at each test and population (Significant and No significant,
respectively). Empty circles (ND) indicates that the test could not be calculated.
https://doi.org/10.1371/journal.pgen.1007900.g005
Adaptive insertions in Drosophila
PLOS Genetics | https://doi.org/10.1371/journal.pgen.1007900 February 12, 2019 9 / 33

We also tested whether the signals of selection differ among continents. For 31 out of the 36
TEs that showed signatures of selection, we had data from NA and EU populations. Only six of
these 31 TEs showed evidence of selection in both continents while the other 25 TEs were sig-
nificant only in NA or only in EU, suggesting that the signatures of selection could be conti-
nent specific (S4B Fig). However, these results could also be due to differences in the ability to
detect selection in the two continents due to the differences in the two datasets used. Finally,
while iHS and nSL identified similar numbers of TEs in the two continents, H12 identified
more significant TEs in NA (Chi-square test, p-value = 0.032, S4 Table).
Besides selective sweeps, we also looked for evidence of population differentiation using the
pairwise FST estimator of Weir & Cockerham (1984) [49]. We performed six pairwise compari-
sons among latitudinal distant populations: two populations in EU, two in NA, and two in
Australia (see Materials and Methods). We could estimate FST for 254 of the 300 HighFreq TE
insertions (S6 Table). To determine the significance of FST values, we compared them with the
distribution of values obtained from neutral SNPs in each pair of populations (see Material
and Methods). 78 TEs showed significant FST values, and we further filtered them by keeping
only those that were significant in more than one pairwise comparison and consistently pres-
ent at high frequencies in populations located in high latitudes or in low latitudes (concordant
FST) (see Material and Methods). After this filtering step, nine TEs were significant (S5 Fig).
Four of these nine TEs were also identified as being under positive selection by at least one
haplotype-based test (Fig 5).
Overall, we could calculate at least one statistic for 273 HighFreq TEs, and 41 of them
showed evidence of positive selection (Fig 5, S4 Table). TEs present at high frequencies both in
African and in the out-of-Africa populations (AF-OOA), and TEs present at high frequencies
only in the out-of-Africa populations (OOA) showed similar percentage of TEs with evidence
of selection, 18/103 (17.5%) and 22/154 (14.2%) respectively (Chi-square, p-value = 0.488, S4
Table), suggesting that both datasets could be enriched for adaptive TEs. Note that, nine of
these 41 TEs were previously found to show evidence of positive selection (Table 2).
A subset of the Fixed TEs in high recombination regions are also candidate
adaptive insertions
Besides polymorphic insertions, we also analyzed whether any of the Fixed TE insertions could
be also considered as candidate adaptive insertions. To do this, we first identified Fixed TEs
that were (i) young, and thus likely to have reached fixation rapidly, and (ii) long insertions
(>50% of the canonical length), and thus not likely to have reached fixation neutrally. 12 of
the 215 Fixed insertions were both young and long TEs and we considered them as candidate
adaptive insertions (Table 2). Second, we estimated Tajima´s D genome-wide [50] and also
considered as candidate adaptive Fixed TEs those that are nearby windows with significantly
negative Tajima´s D values, suggesting that they have increased in frequency due to positive
selection [22] (S7 Table) (see Material and Methods). Thus, overall we identified 21 out of the
215 Fixed TEs in high recombination regions as candidate adaptive insertions (Table 2).
Candidate adaptive TEs are associated with genes involved in stress
response, behavior, and development
We used the GO terms of genes nearby candidate adaptive TEs to test whether they were
enriched for any biological processes. Besides, the 62 TEs identified in this work, we also con-
sider 22 TEs that have been previously identified as candidate adaptive TEs based on different
approaches such as Tajima’s D, and the age of allele neutrality test (Table 2). In total, we ana-
lyzed 111 genes nearby 84 TEs (Table 2, S8A Table). We found four significant clusters
Adaptive insertions in Drosophila
PLOS Genetics | https://doi.org/10.1371/journal.pgen.1007900 February 12, 2019 10 / 33

Table 2. 84 reference TE insertions showed evidence of selection. The 62 TEs identified in this work are listed at the top of each frequency category, followed by TEs
identified in other studies. Note that for 11 of the 62 TEs there was previous evidence suggesting that they were evolving under positive selection.
TE
category
Flybase ID Evidence of selection Reference GO enrichment/ Gene association
OOA FBti0018916 iHS This work -
FBti0018937 iHS This work RtS/ olfactory
FBti0019056 FST / CSTV This work/ [51] RtS
FBti0019065 FST, nSL / fTE / CSTV This work / [7]/ [51] RtS/ xenobiotic
FBti0019079 H12 This work RtS
FBti0019081 nSL This work RtS
FBti0019279 H12 This work RtS/ alcohol, olfactory
FBti0019354 iHS / Allele age This work/ [21] - /alcohol
FBti0019453 H12, nSL This work RtS/circadian
FBti0019457 FST/nSL This work -
FBti0019601 H12 This work -/ xenobiotic
FBti0019604 H12 This work RtS/ alcohol, heavy metal, olfactory
FBti0019627 FST, iHS, H12/ iHS / Phenotypic This work/ [7]/ [52] RtS/ xenobiotic, diapause
FBti0019632 H12 This work RtS
FBti0019657 iHS This work RtS
FBti0020036 iHS This work RtS/ agressiveness, hypoxia, olfactory
FBti0020057 H12 / nSL This work - / immunity, xenobiotic, diapause
FBti0020091 iHS This work -
FBti0020096 iHS/ nSL This work -
FBti0020116 H12 This work RtS/ olfactory
FBti0020149 H12, nSL / Allele age This work/ [21] - / olfactory
FBti0020393 iHS This work RtS/heavy metal
FBti0019360 FST [53] -
FBti0020125 Allele age [21] RtS/olfactory
FBti0019386 CL test, TajimaD, Phenotypic [54] RtS
FBti0019985 TajimaD, iHS, H12, Phenotypic [55] RtS/ diapause
FBti0020155 Phenotypic [56] RtS/ immunity, starvation, alcohol
FBti0020046 Allele age [21] -/ immunity
AF-OOA FBti0018880 H12, nSL / iHS / Phenotypic This work / [7] [57]/ [58] - /immunity, xenobiotics, alcohol, circadian, starvation, heat-shock
FBti0019010 iHS / FST This work/ [53] RtS
FBti0019071 FST This work -
FBti0019112 iHS, H12, nSL This work RtS/ alcohol, olfactory, starvation
FBti0019133 H12 This work RtS/ agressiveness
FBti0019372 H12 This work RtS/ olfactory, pigmentation
FBti0019378 FST This work RtS
FBti0019613 H12 This work RtS
FBti0019617 iHS This work RtS/ alcohol, diapause
FBti0019677 H12 This work -/starvation, agressiveness
FBti0019771 FST This work -
FBti0019975 iHS This work -
FBti0020086 FST, iHS / Allele age This work/ [21] RtS/ circadian, xenobiotic
FBti0020114 iHS, nSL This work -
FBti0020146 FST This work RtS
FBti0060715 iHS This work RtS
FBti0061417 H12 This work RtS/ heavy metal
FBti0061506 iHS This work RtS/ hypoxia, immunity, olfactory, xenobiotics
FBti0019276 CSTV [51] RtS
FBti0019344 FST [53] RtS
FBti0019564 TajimaD [22] RtS
FBti0019611 CSTV [51] Nsd, locomotion, chemotaxis / olfactory, pigmentation, alcohol, diapause
FBti0019082 TajimaD [22] RtS/ starvation
(Continued)
Adaptive insertions in Drosophila
PLOS Genetics | https://doi.org/10.1371/journal.pgen.1007900 February 12, 2019 11 / 33

(enrichment score > 1.3) according to DAVID [62, 63] functional annotation tool related with
nervous system development, response to stimulus, and pigmentation (Fig 6A, S8A Table).
We then analyzed whether the 363 genes nearby the 300 HighFreq TEs were enriched for simi-
lar biological processes (see Material and Methods). We identified 20 significant clusters (S8B
Table). Among clusters showing the highest enrichment scores we also found GO terms
related with response to stimulus and development, and with behavior and learning (Fig 6A).
Finally, genes nearby OOA and AF-OOA TEs were also enriched for similar biological func-
tions (S6 Fig, S8C and S8D Table). Note that the behavior-related clusters slightly differed
among the datasets: genes nearby HighFreq TEs and AF-OOA TEs were enriched for olfactory
genes, and genes nearby OOA TEs for circadian and locomotor behavior genes (Fig 6 and S6
Table 2. (Continued)
TE
category
Flybase ID Evidence of selection Reference GO enrichment/ Gene association
FBti0060443 CSTV [51] RtS/ alcohol
FBti0019170 fTE / Phenotypic [7]/ [59] RtS/ olfactory
NA-AF FBti0019430 H12 / TajimaD / iHS, fTE / Alllele age /
Phenotypic
This work/ [22]/ [7]/ [21]/
[60] [61]
-/ immunity, hypoxia
FBti0019200 Allele age [21] RtS/ starvation
LowFreq FBti0020082 Allele age [21] RtS
FBti0061742 TajimaD [22] -
Fixed FBti0059674 Young&Long This work -/ alcohol, cold, heavy-metal, olfactory, pigmentation, xenobiotics
FBti0019153 Young&Long This work -
FBti0019149 Young&Long This work -
FBti0059794 Young&Long This work -/ heavy-metal, olfactory
FBti0019355 Young&Long This work -/ xenobiotic
FBti0019590 Young&Long This work RtS, Development / pigmentation
FBti0019191 Young&Long This work -/ alcohol, olfactory
FBti0020098 Young&Long This work -/ alcohol
FBti0020101 Young&Long This work -/ alcohol
FBti0020015 Young&Long This work -/ pigmentation, diapause, hypoxia, oxidative, starvation, xenobiotic, alcohol,
oxidative, xenobiotics
FBti0020013 Young&Long This work -/ alcohol, olfactory, heavy-metal, pigmentation
FBti0019199 Young&Long / Allele age This work/ [21] RtS/ alcohol, pigmentation
FBti0018940 TajimaD This work -
FBti0020147 TajimaD This work -
FBti0060295 TajimaD This work -
FBti0061024 TajimaD This work -
FBti0062854 TajimaD This work -
FBti0062980 TajimaD This work -
FBti0063022 TajimaD This work -
FBti0063801 TajimaD This work -/ alcohol, diseccation, pigmentation
FBti0060388 TajimaD This work/ [22] RtS
FBti0060479 TajimaD [22] RtS
FBti0062283 TajimaD [22] RtS/ immunity, alcohol
FBti0063191 TajimaD [22] RtS/ alcohol, diapause, immunity, oxidative, starvation, xenobiotic
FBti0019655 TajimaD [22] -
FBti0020329 TajimaD [22] RtS/ hypoxia
FBti0059793 TajimaD [22] - /immunity, oxidative, starvation, alcohol, hypoxia
CSTV: Correlation with spatio-temporal variables. RtS: response to stimulus, Nsd: Nervous system development.
https://doi.org/10.1371/journal.pgen.1007900.t002
Adaptive insertions in Drosophila
PLOS Genetics | https://doi.org/10.1371/journal.pgen.1007900 February 12, 2019 12 / 33

Fig). Note that we discarded that these GO enrichments were due to insertion biases of families
enriched in our dataset (S8E and S8F Table, see Material and Methods).
To gain more insight into the function of genes nearby the candidate adaptive TEs, we
looked whether they were previously described as candidate genes for several fitness-related
traits (S9 Table, see Material and Methods). Among the 111 genes nearby the 84 candidate
adaptive TEs, 41 have previously been identified as candidates for stress-related phenotypes,
including 21 genes associated with alcohol exposure, six with heavy-metal, and 11 with immu-
nity (Fig 6B, S10A Table). In addition, we also found enrichment of genes related with behav-
ioral phenotypes such as olfaction and aggressiveness, and with pigmentation (Fig 6B, S10A
Table). Similar enrichments were found for genes located nearby the 300 High Freq TEs (Fig
6B, S10B Table) and for the genes located nearby the OOA and the AF-OOA datasets (S6 Fig,
S10C and S10D Table). Note that among the 363 genes nearby HighFreq TEs, 171 genes
(hypergeometic test p-value = 1.00e-05) have previously been identified as candidates for
stress-, behavior- and other fitness-related traits (Fig 6B, S9 Table). Indeed, 148 of the 363
Fig 6. Functional enrichment analysis of genes nearby TEs showing evidence of selection (in this or previous works) and HighFreq TEs. Bar colors indicates similar
biological functions of the DAVID clusters (A) and the fitness-related traits (B): Green: stress response, Red: behavior, Blue: development Yellow: pigmentation. A)
Significant gene ontology clusters according to DAVID functional annotation tool (enrichment score> 1.3). For genes nearby HighFreq TEs, only top five clusters are
showed. The horizontal axis represent DAVID enrichment score (see S8A and S8B Table for details). B) Significantly overrepresented fitness-related genes according to
previous genome association studies. All FDR corrected p-values< 0.05, Chi-square (χ2) test (see S10A and S10B Table for details). The horizontal axis represents the
log10(χ2). In both, A) and B), numbers nearby each bar indicate total number of genes in that cluster/category.
https://doi.org/10.1371/journal.pgen.1007900.g006
Adaptive insertions in Drosophila
PLOS Genetics | https://doi.org/10.1371/journal.pgen.1007900 February 12, 2019 13 / 33
genes (hypergeometic test p-value = 6.00e-03) have previously been identified as candidates, if
we only consider stress-related phenotypes (Fig 6B, S9 Table).
Overall, we found that genes nearby the 300 HighFreq TEs are enriched for similar biologi-
cal processes as genes nearby a dataset of 84 TEs with evidence of positive selection: response
to stimulus and development (Fig 6A, S8 Table). Moreover, 47% of the genes nearby the 300
HighFreq TE dataset have previously been identified as candidate genes for several stress-,
behavior- and/or fitness-related traits (Fig 6B, S10 Table).
Candidate adaptive TEs correlate with the expression of nearby genes
We tested whether there was a correlation between the presence of the candidate adaptive TEs
and the expression of nearby genes using the Matrix eQTL package [64]. We used gene expres-
sion data from Huang et al. [65] and T-lex2 annotations for 140 DGRP lines in order to deter-
mine whether the presence of a TE was correlated with the expression level of the nearby genes
(< 1kb). We calculated correlations for 638 TEs located at high recombination regions and we
found that 19 of them showed significant eQTL associations (S11 Table). TEs present at high
frequencies contained more significant eQTLs than expected (38% vs 11%, Chi-Square test, p-
value < 0.0001) (Table 3). We observed the same significant tendency when considering only
positive correlations (the presence of the TE correlates with increased expression of the nearby
gene) or only negative correlations (the presence of the TE correlates with reduced expression
of the nearby gene) (Table 3). These results remained significant after FDR correction (50% vs
11% expected, Chi-Square test, p-value < 0.0001, Table 3). Of the 19 TEs showing significant
eQTL associations, 11 also showed signatures of selection (S11 Table).
We finally checked whether private TEs (those present in only one DGRP strain according
to T-lex2) were also present among the significant eQTL as expected by the “rare alleles of
large effect” hypothesis [66]. We found a small, but still significant set of private TEs with sig-
nificant correlation with the expression of nearby genes (10% and 9% vs 4% expected, Chi-
Square test, p-value < 0.050) (Table 3), which is in agreement with previous reports [67].
Genomic location, order, and family enrichment of TEs present at high
frequencies in high recombination regions
We tested whether the genomic location of HighFreq TEs differed from the location of all TEs
in the genome. We classified the TEs as present in intergenic, promoter, or genic regions (see
Material and Methods). We found no differences between the distributions of HighFreq vs all
TEs in the genome (Chi-square test, p-values > 0.05, Fig 7A, S12A Table). Similar results were
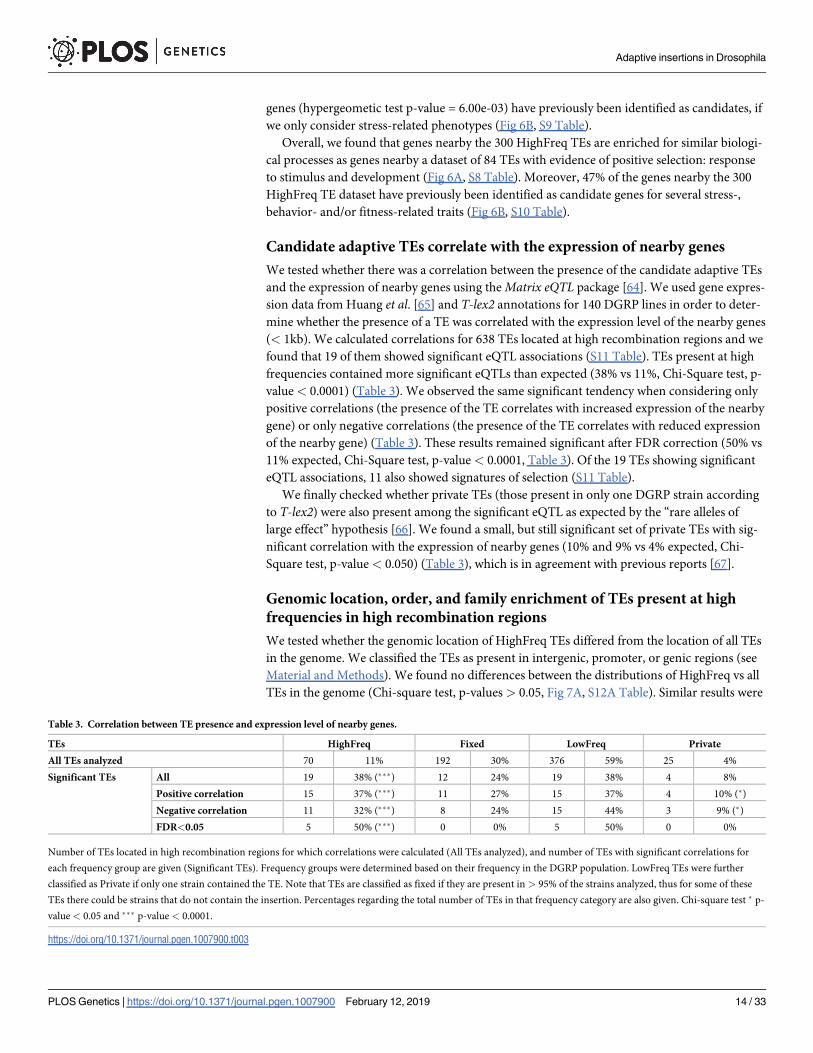
Table 3. Correlation between TE presence and expression level of nearby genes.
TEs HighFreq Fixed LowFreq Private
All TEs analyzed 70 11% 192 30% 376 59% 25 4%
Significant TEs All 19 38% (���) 12 24% 19 38% 4 8%
Positive correlation 15 37% (���) 11 27% 15 37% 4 10% (�)
Negative correlation 11 32% (���) 8 24% 15 44% 3 9% (�)
FDR<0.05 5 50% (���) 0 0% 5 50% 0 0%
Number of TEs located in high recombination regions for which correlations were calculated (All TEs analyzed), and number of TEs with significant correlations for
each frequency group are given (Significant TEs). Frequency groups were determined based on their frequency in the DGRP population. LowFreq TEs were further
classified as Private if only one strain contained the TE. Note that TEs are classified as fixed if they are present in > 95% of the strains analyzed, thus for some of these
TEs there could be strains that do not contain the insertion. Percentages regarding the total number of TEs in that frequency category are also given. Chi-square test � p-
value < 0.05 and ��� p-value < 0.0001.
https://doi.org/10.1371/journal.pgen.1007900.t003
Adaptive insertions in Drosophila
PLOS Genetics | https://doi.org/10.1371/journal.pgen.1007900 February 12, 2019 14 / 33

obtained when we considered the three HighFreq TEs subgroups (S12A Table). We further
classified intragenic TEs in exonic, UTRs, 1st intron, and other introns. Only HighFreq TEs
were enriched in UTR regions (Chi-square test, p-value < 0.043) (Fig 7B, S12B Table).
We also checked whether the proportion of DNA, LTR, and non-LTR TE orders differed
between HighFreq TEs and all TEs in the genome. We found that the HighFreq group contains
a larger proportion of non-LTR TEs (42% vs 31%, Chi-square test, p-value = 5.73e-06, Fig 7C,
S13 Table). Moreover, when considering HighFreq subgroups we found that OOA TEs also
contain a large proportion of non-LTR elements (53% vs 31%, Chi-square test, p-
value = 1.79e-11) while the AF-OOA TEs contain more LTR elements (50% vs 39%, Chi-
square test, p-value = 1.08e-02) (Fig 7C, S13 Table). Regarding TE families, we found that the
HighFreq TEs contain a larger proportion of several families including jockey, 297, BS and
pogo families (S14 Table). When considering only OOA TEs, we found a larger proportion of
several families including jockey, F, and BS, while in the AF-OOA there was a larger proportion
of 297, Quasimodo, and opus (Chi-square test, Bonferroni corrected p-values < 0.05) (S14
Table).
Discussion
In this work, we identified 300 polymorphic reference TEs present at high frequencies in natu-
ral populations, and located in genomic regions with high recombination, where the efficiency
of selection is high [35, 40]. Most of these TEs are young insertions suggesting that they have
increased in frequency relatively fast (Fig 3). In addition, these insertions are longer compared
with other TEs in the genome, also suggesting an adaptive role because long insertions are
more likely to act as substrates for ectopic recombination leading to chromosome rearrange-
ments that are often deleterious [16, 34, 43] (Fig 4). Our dataset of 300 putatively adaptive TEs
contains all the insertions present at high population frequencies that have previously been
identified as putatively adaptive [7, 21, 22, 51–58, 60, 61]. Note that we, and others, have found
signatures of positive selection and/or functional evidence for the adaptive role of 55 of the 300
polymorphic adaptive TEs identified in this work, further suggesting that this dataset is
enriched for adaptive insertions (Table 2). Besides these 300 polymorphic TEs, we identified
21 fixed reference TEs that are also likely to be adaptive (Table 2). The other 8 TEs that have
been previously identifed as candidate adaptive TEs were fixed insertions that did not show
Fig 7. Caracteristics of the HighFreq TEs. A) TE location regarding the nearest gene. B) Location of intragenic TEs. C) TE order. �: p-value< 0.05. ���: p-
value< 0.001 (Chi-square test).
https://doi.org/10.1371/journal.pgen.1007900.g007
Adaptive insertions in Drosophila
PLOS Genetics | https://doi.org/10.1371/journal.pgen.1007900 February 12, 2019 15 / 33

signatures of selection or were present at low frequencies in the populations analyzed in this
study (Table 2).
Although we looked for evidence of hard and soft sweeps, and for evidence of population
differentiation using the FST statistic, adaptive mutations could show other signatures of selec-
tion as well [1, 2, 68]. Polygenic adaptation, which should lead to modest changes in allele fre-
quency at many loci, would be overlooked by the more conventional methods for detecting
selection used in this study [69]. A recent work used FST and gene set enrichment analysis to
find evidence of polygenic adaptation in European D. melanogaster populations [53]. In addi-
tion, analysis of environmental correlations between allele frequencies and ecological variables
could also lead to the identification of additional TE insertions under positive selection [70–
73]. Thus, further analysis could lead to the identification of signatures of selection in other
insertions in our dataset besides the 55 polymorphic insertions that showed signatures of selec-
tion identified in this work (Table 2).
Our dataset of 300 putatively adaptive polymorphic TEs allowed us investigating global pat-
terns in the biological functions that might be affected by TE-induced adaptive mutations in
the D. melanogaster genome. Previous genome-wide screenings looking for adaptive TE inser-
tions identified a small number of candidates that preclude the identification of the putative
traits under selection [7, 8, 21, 22]. In this work, we found that genes nearby putatively adap-
tive TEs are enriched for response to stimulus, development, and behavioral and learning
functions (Fig 6). Through literature searches, we found that 41% (148 out of 363) of these
genes have previously been identified as candidate stress-related genes including xenobiotic
stress, desiccation, and cold stress (Fig 6). If we focus on the subset of TEs that are likely to be
involved in out-of-Africa adaptations, we found similar gene functional enrichments (S6 Fig).
Interestingly, circadian behavior gene functions are enriched in this dataset of TEs, consistent
with adaptation to seasonal changes in daylight experienced by flies in their out-of-Africa
expansion [74]. Thus, our results showed that TE-induced adaptive mutations are mainly
likely to contribute to stress-response, developmental, and behavioral traits. Although these
traits have previously been identified as targets of natural selection, our results point to the
most likely causal variant rather than to a group of linked SNPs [75–77]. Thus, although chal-
lenging and time-consuming, follow-up functional analysis of these adaptive mutations should
confirm their causal role, as we, and others, have already demonstrated in the past [52, 54–56,
58, 60, 61].
Most of the signatures of positive selection found in the regions flanking the putatively
adaptive insertions were continent specific (S3B Fig). These results suggest that a significant
proportion of the 300 putatively adaptive TEs could be involved in local adaptation. Thus, it is
likely that by exploring more natural populations we could identify additional adaptive inser-
tions. We are also missing TEs that could be playing a role in seasonal and altitudinal adapta-
tion, as both dimensions have been shown to be relevant for D. melanogaster [78–80]. Finally,
our study is also limited to those insertions present in the reference genome. Although there
are several packages that infer the presence of de novo TE insertions in genome sequencing
data, they have a high rate of false positives and none of them provides the precise genomic
coordinates of the insertions, which result in inaccurate TE frequency estimations [10, 81]. In
addition, the size and the age of the de novo insertions cannot be estimated hindering the char-
acterization of putatively adaptive insertions [81, 82]. Long-read sequencing techniques
should, in the near future, help overcome this limitation and allow the community to investi-
gate the contribution of non-reference TE insertions to adaptive evolution [83].
We also found that the presence of 19 of the candidate adaptive TEs correlated with changes
in expression, both up-regulation and down-regulation, of nearby genes (Table 3 and S11
Table). For four of these TEs, FBti0018880, FBti0019627, FBti0019386, and FBti0019985,
Adaptive insertions in Drosophila
PLOS Genetics | https://doi.org/10.1371/journal.pgen.1007900 February 12, 2019 16 / 33

changes in expression of the nearby genes have also been reported based on allele-specific
expression and/or qRT-PCR experiments, and further shown to be associated with changes in
fitness-related traits [52, 54, 55, 58, 84]. In addition to these 19 insertions, another four TEs
FBti0020119, FBti0020057, FBti0018883, and FBti0020137 were associated with allele-specific
expression changes [84]. Thus, overall, 23 insertions are associated with changes of expression
of nearby genes, which at least in four cases lead to changes in fitness-related traits. Note that
because 41% of the genes nearby candidate adaptive TEs are candidates for stress-related phe-
notypes, it could be that changes in expression are only induced by the TEs in response to
stress.
Overall, we identified 300 polymorphic and 21 fixed reference TE insertions likely to be
involved in adaptive evolution as suggested by their population frequencies, age, size, and pres-
ence of signatures of selection in a subset of them. These TEs substantially add to the list of
genetic variants likely to play a role in adaptation in D. melanogaster. Functional profiling of
these candidates should help elucidate the molecular mechanisms underlying these mutations,
and confirm their adaptive effect on the traits identified.
Materials and methods
Dataset
We analyzed available D. melanogaster genome sequencing datasets from 91 samples collected
in 60 natural populations distributed worldwide (Fig 1 and S1 Table). Most samples (83) were
generated using pool-sequencing, while the remaining eight samples came from individually
sequenced strains. The distribution of populations across continents was: one from Asia, 39
from Europe, 14 from North America, five from Oceania, and one from Africa. The African
population was collected in Zambia, the ancestral range of the species [85]. For this work, we
only used the 67 Zambian strains without any European admixture [85]. All data was down-
loaded from the NCBI Sequence Read Archive (SRA) from published projects as of April 2016,
and from data available in our laboratory (S1 Table). Note that we attempted to include five
more samples in our dataset, but we were unable to estimate TE frequencies in these samples.
These samples were from Queensland and Tasmania [75], Winters [86], Vienna [87], and
Povoa de Varzim [22].
Transposable element frequency estimation
To estimate TE population frequencies, we used T-lex2, a computational tool that works both
with individual genomes and with pooled samples. T-lex2 combines the genotyping informa-
tion obtained for each individual genome to calculate the population frequency, while for
pooled samples the frequency is directly estimated from the number of reads providing evi-
dence for the presence and for the absence of each insertion [33]. Population frequencies for
34 European populations estimated using Tlex-2 were obtained from Mateo et al.[53] and
Kapun et al.[48]. We used T-lex2 [33] to estimate the population frequency in the other 26
available populations (six populations sequenced as individual genomes, and 20 populations
sequenced as pooled samples).We first downloaded genomic coordinates of all the annotated
TEs (5,416 TEs) from FlyBase r6.04 [88, 89]. 2,234 of the 5,416 TEs belong to the INE family
that has been inactive for the past 3–4.6 Myr [90–92], and were discarded. From the 3,182
non-INE TEs, we excluded nested TEs, TEs flanked by other non-INE TEs (100bp on each
side of the TE), and TEs that are part of segmental duplications, because T-lex2 does not pro-
vide accurate frequency estimates for these TEs [33]. After these filtering steps we ended up
with 1,630 TEs. For 108 of the 1,630 TEs we used the corrected genomic coordinates as
Adaptive insertions in Drosophila
PLOS Genetics | https://doi.org/10.1371/journal.pgen.1007900 February 12, 2019 17 / 33

described by Fiston-Lavier et al. [33]. T-lex2 parameters were set to default except for read
length and the use of paired reads that were specific for each dataset.
For the eight individually-sequenced populations, T-lex2 was able to calculate frequencies
for the 1,630 TEs in most of the strains (S7 Fig). Indeed, we only considered a TE frequency if
we had data from at least 9 strains in a given population, as this is the smallest number of
strains in a sample (S1 Table). For the 83 samples that were pool-sequenced, we only consid-
ered frequencies calculated with 3 to 90 reads. These minimum and maximum thresholds
were selected after comparing the distribution of reads in the 48 DrosEU samples to avoid
false positives (very low number of reads) or an excess of coverage due to non-unique mapping
or spurious reads [48] (S8 Fig). For one population, we have both individually sequenced
genomes, and pooled-sequenced genomes. Using data of the individually sequenced popula-
tion of Stockholm [53] we found a high correlation with the pool-sequenced data of the same
population (Pearson correlation coefficient r = 0.98, p-value< 2.2e-16, S9 Fig), which indi-
cates that there is no bias due to the sequencing strategy when calculating the frequencies
using T-lex2. For most TEs we could estimate frequency in most of the samples (S10 Fig). We
only discarded 15 TEs where T-lex2 estimated frequencies for less than 10 out of the 91 sam-
ples, ending up with a dataset of 1,615 TEs.
We considered a TE to be located in high recombination regions when the two available
recombination estimations for D. melanogaster [93, 94] were greater than 0 in the region
where the TE is inserted (S2 Table).
Detecting inversions and correcting TE frequencies
We analyzed the effect of inversions in TE frequency estimations. We focused on the cosmo-
politan inversions: In(2L)t, In(2R)Ns, In(3L)P, In(3R)K, In(3R)Mo, In(3R)Payne, and In(3R)
C (S15 Table) [79]. 358 TEs are located inside or overlapping with one of these inversions and
36 TEs are located less than 500kb from an inversion breakpoint. For five samples, there is
data available on the presence/absence data of inversions: Zambia [85], France [95], North
Carolina (DGRP, USA) [96, 97], Italy and Sweden [53]. For all these datasets, we re-estimated
TE frequencies for individual samples by removing the strains containing an inversion. We
also removed strains where a TE was located 500 kb upstream or downstream of an inversion
present in that strain [79]. Removal of strains was done at the TE level using an in housepython script. As a result, each TE had a different number of supporting strains. The frequen-
cies calculated removing strains with inversions were equivalent to the original ones (Pearson
correlation coefficient r = 0.99, p< 2.2e-16, S11 Fig), indicating that the effect of inversions on
TE frequency is rather small in our dataset.
TE age and TE length ratio
We used a phylogeny-based approach to estimate the age of each TE within each family for the
5,416 TEs annotated in the reference genome. The age was estimated as the unique number of
substitutions shared between the two closest TEs assuming that they all derived from a com-
mon ancestral TE, i.e. the divergence between closest TEs. Hence, this approach estimates the
time since last activity for each TE. Note that activity includes not only transposition but also
other genomic TE movements such as the ones caused by duplications.
When the age estimates were calculated, TE annotations were only available for the release
4. Thus, we started by detecting and annotating the TE families and subfamilies in the release 5
of the reference D. melanogaster genome. We used the de novo homology based approach
developed in the REPET suite to build a library of TE consensus [98] (https://urgi.versailles.
inra.fr/Tools/REPET/). The consensus are proxies of the TE family and subfamily canonical
Adaptive insertions in Drosophila
PLOS Genetics | https://doi.org/10.1371/journal.pgen.1007900 February 12, 2019 18 / 33
sequences. We then annotated each consensus by blasting them against the TE canonical
sequences from the Berkeley Drosophila Genome Project (www.fruitfly.org/). Each TE
sequence was then aligned to its set of annotated TE consensus using a global alignment tool
from the REPET suite, called RefAlign. The RefAlign launches pairwise alignments avoiding
spurious alignments induced by internally deleted TE sequences [32, 99]. All pairwise align-
ments from the same TE family were re-aligned to generate profiles using ClustalW v2.0.10
[100]. We manually curated each profile: we removed shared substitutions and indels using
another tool in the REPET suite called cleanMultipleAlign.py [32, 99]. A limitation of align-
ment-based methods is that short TEs could generate misalignments. Hence, to reduce the
impact of misalignments 25 TEs shorter than 100bp were removed. For eight TE families
(aurora, BS4, frogger, R1-2, Stalker3, TART-B, TART-C, and Xanthias) composed by less than
three copies, we failed to estimate the divergence of the copies and thus were not further con-
sidered in this study (11 copies in total). Some profiles were re-aligned using MAFFT v.7 in
order to refine conserved regions between TE sequences [101]. For each TE profile, a phyloge-
netic tree was inferred using the phyML program with the Hasegawa–Kishono–Yano (HKY)
model, with different base frequencies. We used the BIONJ technique to build the starting tree
and optimized the topology and branch lengths [102]. Finally, the terminal branch lengths
were extracted using the Newick Utilities v.1.6 and were used as a proxy for the age of the
insertions [103]. We ended up with the age estimates for 5,389 TE sequences from 116 TE fam-
ilies belonging to all TE orders.
We analyzed the length of the TEs by calculating the “TE length ratio (%)” defined as the
length of each TE divided by the family canonical length and expressed in percentage. Then,
we applied the Wilcoxon rank sum test for determining whether the distribution of the TE
Length Ratio values was different between different TE classes.
Signatures of selective sweeps
In order to detect signatures of positive selection we applied three different methods for identi-
fying selective sweeps: iHS [45], H12 [46], and nSL [47]. We separately analyzed two datasets
of individually sequenced populations from Europe and North America. For the EU popula-
tions we used sequences from 158 strains belonging to four different populations: 16 strains
from Castellana Grotte (Bari, South Italy) [53], 27 strains from Stockholm (Sweden) [53], 96
strains from Lyon (France) [95, 104] and 19 strains from Houten (The Netherlands) [105]. We
pooled the sequences from the four European populations as it has been described that there is
no evidence of latitudinal population structure in European populations [48]. This allowed us
to analyse a similar number of strains in the two continents. For the Sweden and Italian popu-
lations, we first obtained the vcf and bam files from [53], we filtered out all non-SNP variants
and then we used Shapeit v2.r837 [106] for estimating haplotypes (phasing). For the French
and Dutch populations we first downloaded consensus sequences from the Drosophila
Genome Nexus (DGN) 1.1 [104], and we then created a SNP-vfc file using a custom python
script. We then merged all EU populations in a single SNP-vcf file using vcftools v.0.1.15 [107].
For the NA population we used the SNP-vcf file as provided by the Genetic Reference Panel
(DGRP) for 141 strains collected in Raleigh, North Carolina [96, 97].
iHS was calculated using the iHSComputer software (https://github.com/sunthedeep/
iHSComputer). We created iHSComputer input files (SNPs-TEs files) by adding the T-lex2information to the SNP-vcf file. For each TE and each strain we codified the presence/absence
of the TE in a biallelic way and place them in the midpoint coordinate of the TE. Note that
only presence/absence results from T-lex2 were taken into account, leaving “polymorphic”
and “no data” as missing data positions [33]. The presence of the TE was considered as the
Adaptive insertions in Drosophila
PLOS Genetics | https://doi.org/10.1371/journal.pgen.1007900 February 12, 2019 19 / 33

´derived´ state and the absence as the ´ancestral´ state. Since iHSComputer runs for each chro-
mosome separately, we created 100 kb-windows recombination files for each chromosome
based on the recombination map from [93]. We standardized iHS values according to Voight
et al. [45] and determined its significance by comparing iHS value for the TEs against the
empirical distribution of iHS values for SNPs falling within the first 8–30 base pairs of small
introns (< = 65 bp) which are considered to be neutrally evolving [108]. Two empirical distri-
butions were generated: one for the SNPs present at high frequency in the out-of-Africa and in
the African populations, and another one for SNPs present at high frequency in out-of-Africa
populations but present at low frequency in the African population (S12 Fig). TEs with iHSvalues falling outside the 5th percentile of the corresponding empirical distribution of neutral
SNPs were considered significant.
The H12 statistic was calculated using the SelectionHapStats software (https://github.com/
ngarud/SelectionHapStats/, [46]. We formatted the SNPs-TEs files previously used in the iHScalculation and run the H12_H2H1.py script for each TE in the singleWindow mode using 100
SNPs as the window size. We first selected windows in the top 15% most extreme H12 values.
We then checked whether haplotypes in these windows contained the TE in at least 50% of the
strains for at least one of the three most frequent haplotypes. Only TEs that fulfil this condition
were considered significant. Note that 17 out of the 18 significant TEs are present in the first
or second most frequent haplotype.
The nSL statistic was calculated using selscan v1.1 [109]. Input files were generated based on
the SNPs-TEs files from the iHS calculation. We created one tped file for each TE and removed
all strains and positions containing missing data. Extreme nSL values were determined using
the norm program for the analysis of selscan output. Unstandardized nSL values were normal-
ized in 10 frequency bins across the entire chromosome and significant nSL values were deter-
mined using the—crit-percent 0.05 parameter.
Population differentiation using FST for latitudinal distant populations
We calculate the Fixation index (FST) between pairs of latitudinal distant populations for
each of the three continents. We created vcf files for the TEs based on T-lex2 results and
used vcftools v.0.1.15 [107] for calculating the pairwise FST estimator [49]. The pairwise cal-
culations performed for each continent were: Europe: Italy vs Sweden [53] and Vesanto vs
Nicosia [48]; Oceania: Innisfail vs Yering [110] and Queensland vs Tasmania [77] and
North America: Maine vs Florida [77], and Maine vs Florida [78]. For each pair, we calcu-
lated FST values for all TEs and tested them against the empirical distribution of FST values
of neutral SNPs while controlling for TE frequency in the African population [85]. Innisfail,
Yering, Maine and Florida SNP callings were obtained from the Dryad Digital Repository
(http://datadryad.org/resource/doi:10.5061/dryad.7440s, [78, 110]. Queensland, Tasmania,
Florida and Maine SNP callings from Reinhardt et al. [77] were provided by Dr. Andrew
Kern. Italy and Sweden SNP callings were obtained from Mateo et al. [53]. Vesanto and Nic-
osia SNP callings were obtained from Kapun et al. [48]. FST values for neutral SNPs were
also calculated using vcftools v.0.1.15 [107]. Then, for each pairwise comparison we created
two empirical distributions of FST values of neutral SNPs: one for SNPs that were at low fre-
quency in Zambia and other for SNPs that were at high frequency in Zambia. FST values of
TEs at high frequency in Zambia were compared with the distribution of neutral SNPs FST
at high frequency in Zambia and FST values of TEs at low frequency in Zambia were com-
pared with the low frequency SNPs distribution. We considered a TE to be significantly dif-
ferentiated when its FST value was greater than the percentile 95th of the corresponding
empirical distribution.
Adaptive insertions in Drosophila
PLOS Genetics | https://doi.org/10.1371/journal.pgen.1007900 February 12, 2019 20 / 33

Overall, we calculated FST values for 254 TEs in at least one pair of populations and we
found 78 of them showing extreme values when compared with the distribution of FST from
neutral SNPs (S6 Table). 67 of these 78 TEs were consistently present at high frequencies in
populations located in high latitudes or in low latitudes. 43 of the 67 TEs were present at high
frequencies in low latitude populations in at least one pairwise comparison, and 24 TEs were
present at high frequencies in high latitude populations in at least one pairwise comparison
(S6 and S16 Tables). Finally, to be conservative, we only considered those TEs with significant
FST values in at least two populations and always present at high frequencies in populations
located in high or low latitude (concordant FST).
Evidence of selection for fixed TEs
Following Kofler et al. (2012) [22], we investigated whether Fixed TEs showed evidence of
selection. In order to do that, we calculated Tajima´s D values [50] in non-overlapping 500 bp
window using vcftools v.0.1.15 [107]. We identified windows showing significant low Tajima´s
D values by selecting windows with values lower than the 5% quantile of the whole genome
distribution, matching by recombination rate and type of chromosome. Cutting values were
-1.65 for the autosomes and -1.82 for the X chromosome. We then looked whether significant
windows were overlapping or nearby Fixed TEs boundaries.
TE location
We analyzed whether TEs were located at specific regions in the genome regarding the nearest
gene. We used TEs and gene coordinates from FlyBase r6.04 [88, 89] and considered both cod-
ing and non-coding genes. For each TE, we determined whether it was located inside a gene or
in an intergenic region. We further classify the TEs located in intergenic regions in those
located at more or less than 1kb of the nearest gene. For TEs present inside a gene we further
determined the class site overlapping with the TE annotation: Exon, UTR, Intron. If the TE is
inserted in an intron, we checked whether it was inserted in the first intron, where is more
likely to affect expression [111, 112].
Expression quantitative trait loci (eQTL) analysis
We use Matrix eQTL v2.1.1 [64] to calculate correlations between the presence/absence of the
TEs and the expression of nearby genes. We used expression data from the DRGP lines
(Raleigh, North Carolina, [65]) as available in the DGRP2 repository (http://dgrp2.gnets.ncsu.
edu/data.html) and the presence/absence TE information for the DGRP lines for which T-lex2was successfully run (see above). T-lex2 identified 1,603 TEs in the DRGP lines and 1,177 of
them contain at least one gene at less than 1kb of any of the two junction coordinates of the
TEs. One line (RAL-591) was not present in the expression data, so we ended up with 140 lines
in the dataset. For each line, we used the average of the normalized gene expression value from
the two replicates and analyzed female and male data separately. For the genotyping data, we
used both the start and the end coordinates of the 1,615 TEs as positions in the genome and
codified the absence (0), polymorphic (1), presence (2) and no data (NA) from T-lex2 output
using a custom python script. Matrix eQTL was run with default parameters, applying only the
Linear model and with a cisDist = 1000, meaning that we considered only genes that were at
less than 1kb from any of the junction coordinates of the TE. We then evaluated the signifi-
cance of the correlations as provided by the Matrix eQTL software and we considered TEs that
were significant in at least one sex. From the 1,177 analyzed TEs, we kept only the 638 TEs
located at high recombination rate regions and classified them according to their frequency in
the DGRP population as: HighFreq (10% < frequency< 95%), LowFreq (frequency� 10%)
Adaptive insertions in Drosophila
PLOS Genetics | https://doi.org/10.1371/journal.pgen.1007900 February 12, 2019 21 / 33

and Fixed (frequency� 95%). LowFreq TEs were further classified as Private if only one strain
was containing the TE. 235 of the 300 candidate adaptive TEs were included in the 638 dataset.
Functional enrichment analysis
We performed functional enrichment analysis for Gene Ontology (GO) biological process for
the genes nearby TEs using the DAVID functional annotation cluster tool (v.6.8) [62, 63].
Based on TEs and genes coordinates from FlyBase r6.04 [88, 89], we selected genes located at
less than 1kb as the ones putatively likely affected by the TEs, since this is the approximate size
of the promoter region in D. melanogaster [113]. If there were no genes at less than 1kb, we
selected the closest one. All comparisons were performed using the full list of genes in D. mela-nogaster as the background. We considered DAVID clusters as significant when the enrich-
ment score (ES) was higher than 1.3 as described in Huang da et al. [62].
Our dataset of 300 HighFreq TEs is enriched for insertions belonging to 18 TE families (S14
Table). We thus tested whether TEs belonging to these families and located in high recombina-
tion regions were located nearby genes enriched for particular GO biological processes. We
found that three of these families, 297, jockey, and transib2, where located nearby genes
enriched for several biological processes (S8E Table). We thus removed the TEs belonging to
these three families from our 300 HighFreq dataset and re-run DAVID. We found that the GO
enrichments did not significantly change when we removed the insertions from these three
families (S8F Table).
In addition, in December 2016 we searched the literature using PubMed to find publica-
tions that identified genes associated with phenotypic traits studied in the DGRP project
(olfactory behavior, alcohol exposure, desiccation, aggressiveness, cold tolerance, pigmenta-
tion, starvation, mating behavior, and oxidative stress). We also included phenotypic traits for
which there is gene expression data available (heavy-metal stress, xenobiotic stress, diapause,
locomotor behavior, and hypoxia). Finally, we looked for publications related with immunity,
heat-shock stress, and circadian behavior as these three are relevant adaptive traits in Drosoph-
ila. We included genome-wide studies (GWAS, QTL, gene expression, and protein-protein
interactions) and candidate-gene studies (S9 Table). We generated lists of candidate genes for
each one of the 17 different fitness-related traits. We then converted the gene names to Flybase
gene identifiers. This step was necessary because in D. melanogaster genes often have more
than one name but all genes have a single Flybase identifier. To construct our final candidate
gene lists, we only considered those genes that were present in two or more independent publi-
cations. We then checked whether the genes nearby the 300 HighFreq TEs, the 84 TEs with
evidence of positive selection, the 174 OOA, and the 111 AF-OOA TEs were present in our
candidate gene lists. We used the hypergeometic test to determine whether different sets of
TEs showed more genes previously associated with different stress-related and behavior-
related traits than expected by chance.
Supporting information
S1 Fig. Distribution of number of TEs that are present at >0.10 and < 0.95 frequency by
number of populations in which they are present at that frequency. We considered TEs to
be present at high frequency (HighFreq) when they fulfil the frequency condition in at least
three samples (represented by blue bars in the figure).
(PDF)
S2 Fig. Comparison of age estimations obtained by Bergman and Bensasson (2007) and
the estimations obtained in this work. Only the 417 TEs that are common between the two
Adaptive insertions in Drosophila
PLOS Genetics | https://doi.org/10.1371/journal.pgen.1007900 February 12, 2019 22 / 33

studies are plotted. A) TE age distribution of the 417 TEs based on Bergman and Bensasson
(2007) and in this work. Note that there are 10 insertions that showed extreme age values in
our dataset (> 0.12). B) Correlation between the two age estimates before and after removing
the 10 TEs with extreme age values in our data set (n = 407).
(PDF)
S3 Fig. Boxplots showing the distribution of TE ratio percentages (percentage of the length
of the TE insertion regarding the length of the canonical family sequence) for each TE category
and colored by Age (A) and TE class (B).
(PDF)
S4 Fig. Venn diagrams for the 36 HighFreq TEs with significant evidence of selective
sweeps. A) Overlapping between TEs showing significant results for the different selective
sweeps statistics (iHS, H12 and nSL). B) Overlapping between TEs showing at least one signifi-
cant test in the North American (NA) and/or the European (EU) population. The percentage
between brackets is regarding the total number of significant TEs (36). Numbers between
square brackets show the number of TEs for which we were able to calculate at least one of the
sweep statistics.
(PDF)
S5 Fig. Venn diagrams showing the overlap between TEs showing significant FST values in
at least one pair of populations. A) TEs present at high frequency in populations located at
low latitude locations. B) TEs present at high frequency in populations located at high latitude
locations.
(PDF)
S6 Fig. Functional enrichment analysis of genes nearby OOA and AF-OOA TEs. A) Signifi-
cant Gene Ontology Clusters according to DAVID functional annotation tool. Only the
top six significant clusters are showed (enrichment score > 1.3). The horizontal axis represents
DAVID enrichment score (see S9C and S9D Table for details). B) Significantly overrepre-
sented fitness-related genes according to previous genome association studies. All FDR cor-
rected p-values < 0.05, Chi-square test (see S11C and S11D Table for details). The horizontal
axis represent the log10(χ2). In both cases, A) and B), numbers nearby each bar indicate total
number of genes in that category. Bar colors indicate similar biological functions of the clusters
(A) and the fitness-related traits (B): green: stress response; red: behavior; blue: development;
and yellow: transport.
(PDF)
S7 Fig. Distribution of the number of TEs (y axis) by the number of strains for which T-lex2 estimated frequencies in the 8 individually-sequenced populations.
(PDF)
S8 Fig. Distribution of mapped reads for the presence module (red), absence module
(green) and total number of reads (blue) for each one of the 48 DrosEU samples (Kapun
et al. 2018).
(PDF)
S9 Fig. Correlation between frequencies estimated with data obtained using different
sequencing strategies in the Stockholm (Sweden) population. Frequencies calculated using
individual strain sequencing (x) (Mateo et al 2018) and pool sequencing (y). Pearson correla-
tion coefficient r = 0.98, p-value < 2.2e-16.
(PDF)
Adaptive insertions in Drosophila
PLOS Genetics | https://doi.org/10.1371/journal.pgen.1007900 February 12, 2019 23 / 33

S10 Fig. Histogram showing the number of TEs (y axis) and the number of samples for
which we were able to estimate its frequency.
(PDF)
S11 Fig. TE frequencies estimated using all strains (x axis) vs frequencies estimated after
removing strains that contain inversions (y axis) for different individually-sequenced pop-
ulations. A) Zambia (Lack et al., 2015), B) France (Pool et al., 2012), C) DGRP (Raleigh)
(Huang et al. 2014; Mackay et al. 2012), D) Italy (Bari) and E) Sweden (Stockholm) (Mateo
et al 2018). All Pearson correlation coefficients r = 0.99 and p-value < 2.2e-16.
(PDF)
S12 Fig. Distribution of iHS values obtained for TEs (red) and neutral SNPs (cyan) in the
North American population (DGRP, Raleigh, North Carolina). A) Distribution of iHS val-
ues for all TEs and neutral SNPs. B) Distribution of iHS values for TEs and neutral SNPs at
high frequency (> 0.10) in the OOA population (Raleigh) and in the African population (Zam-
bia). C) Distribution of iHS values for TEs and neutral SNPs at high frequency (> 0.10) in the
OOA population, but at low frequency in the African population.
(PDF)
S1 Table. Information for the 91 samples used in this study.
(XLSX)
S2 Table. Frequency estimations using Tlex2 for the 1,615 TEs at each of the 91 samples.
NA indicates that the frequency could not be estimated for that TE in the given sample.
Recombination estimates according to Comeron et al. (2012) and Fiston-Lavier et al. (2010)
are showed for each TE. Class column indicates the category at which each TE was classified.
(XLSX)
S3 Table. TE length ratio statistics. At the top, mean and median TE Length Ratio (%) for
each TE category. At the bottom, results for the Wilcoxon rank sum test and Kruskal Wallis
test among different TE categories. The results are shown for All TEs (A), for onlt young TEs
(B), for only old TEs (C), for only TEs of the class DNA (D), for only TEs of the class LTR (E)
and for only TEs of the class non-LTR (F).
(XLSX)
S4 Table. Number of TEs showing significant values in the selection tests for each High-
Freq category. For each sweep test (iHS, H12 and nSL), “Continent” column indicates popula-
tion used for the analysis: NA: North America or EU: Europe. For each HighFreq category,
table shows the number of significant TEs / number of TEs for which the test was calculated.
“At least one test” indicates the number of TEs at each category showing at least one test signif-
icant / TEs with at least one test calculated.
(XLSX)
S5 Table. List of 36 TEs showing at least one significant (highlighted in red) selective
sweep test (iHS, H12 or nSL).
(XLSX)
S6 Table. List of the 254 HighFreq TEs with at least one pairwise FST calculation per-
formed. Category indicates the classification of the TE according to Fig 2. For each continent,
two pairwise comparisons were performed. Values for each comparison are the FST (in red the
significant ones). Concordant FST indicates whether TEs with significant FST were at high fre-
quency in the same climate zone in more than one population. Concordance information indi-
cates, for each significant pairwise calculation (separated by ´;´) the continent (EU, NA or OC)
Adaptive insertions in Drosophila
PLOS Genetics | https://doi.org/10.1371/journal.pgen.1007900 February 12, 2019 24 / 33

and the climate zone at which the TE is a higher frequency (Tropical/Mild Temperature,
Snow).
(XLSX)
S7 Table. Summary results for Fixed TEs showing significant Tajima´s D values on neigh-
bour windows. Significance was dermined by the 5% quantile of Tajima´s D values from all
high recombination regions in the genome (-1.65 for Autosomes and -1.82 for chromosome
X).
(XLSX)
S8 Table. A Results of gene ontology (GO) enrichment test for the 83 genes nearby the 65 TEs
showing evidence of selection (ES). B Table. Results of gene ontology (GO) enrichment test
for the 363 genes nearby the 300 HigFreq TEs. C Table: Results of gene ontology (GO) enrich-
ment test for the 215 genes nearby the 174 OOA TEs. D Table. Results of gene ontology (GO)
enrichment test for the 143 genes nearby the 111 AF-OOA TEs. E Table. Results of gene ontol-
ogy (GO) enrichment test for genes nearby TE insertions belonging to the 297, jockey, andtransib2 families. F. Table. Results of gene ontology (GO) enrichment test for genes nearby the
300 HighFreq TEs, but excluding TEs from the 297, jockey, and transib2 families.
(XLSX)
S9 Table. Gene association studies analyzing different fitness-related phenotypes.
(XLSX)
S10 Table. Enrichment of genes previously described as associated with different stress-
related and behaviour-related traits in the different datasets analyzed. A) Genes the 65 TEs
with evidence of selection. B) Genes nearby the 300 HighFreq TEs. C) Genes nearby the 174
OOA TEs. D) Genes nearby the 111 AF-OOA TEs.
(XLSX)
S11 Table. 19 TEs showing significant correlation with the expression of nearby genes.
Results are divided in correlations obtained with male and female expression data (Huang
et al. 2015). beta: Effect size estimate, t-stat: Test statistic (t-statistic of T-test), p-value: p-value
for the linear regression. FDR: False discovery rate estimated with Benjamini–Hochberg pro-
cedure. � TEs showing evidence of selection (Table 2, main text).
(XLSX)
S12 Table. Genomic location of different TE categories. Percentages and rigth-tail p-values
are showed when the Chi-square test is significant. (A) Localization of TEs regarding the near-
est gene across categories. (B) Localization of intragenic TEs across TE categories.
(XLSX)
S13 Table. TE classes across different TE categories. P-values and percentages are showed in
bold when significant enrichment according to Chi-square test p-value < 0.05 when compar-
ing with All TEs.
(XLSX)
S14 Table. Enrichment test for TE families. For each family, table shows the number of
TEs at each category. HighFreq TEs correspond to the sum of AF, AF-NA, AF-OOA and
OOA. p-value (Bonf.) indicates Bonferroni corrected p-values for Chi-square test when com-
paring HighFreq, AF-OOA and OOA TEs against All TEs. In red p-values < 0.05.
(XLSX)
Adaptive insertions in Drosophila
PLOS Genetics | https://doi.org/10.1371/journal.pgen.1007900 February 12, 2019 25 / 33

S15 Table. Genomic coordinates of cosmopolitan inversion (Kapun et al. 2016) analyzed in
order to determine its influence on the transposable elements frequency calculation.
(XLSX)
S16 Table. Summary statistics for the pairwise FST calculations. TEs with FST: Number of
TEs for which it was possible to calculate FST. Signif. (Africa H/L): Total number of significant
TEs. Between brackets: H: Number of significant TEs identified using the distribution of neu-
tral SNPs that are at high frequency in Africa. L: Number of significant TEs identified using
the distribution of neutral SNPs that are at low frequency in Africa (see Material and Meth-
ods). Low Latitude (HighFreq): Significant TEs that are at high recombination rate regions
(HRR) and are at high frequency only in populations located in low latutidinal regions. High
Latitude (HighFreq): Significant TEs that are at high recombination rate regions (HRR) and
are at high frequency in populations located in high latutidinal regions. Both (HighFreq): Sig-
nificant TEs that are at high recombination rate regions (HRR) and are at high frequency in
populations from both, low and high latutidinal regions.
(XLSX)
Acknowledgments
We thank members of the Gonzalez lab for comments on the manuscript.
Author Contributions
Conceptualization: Dmitri A. Petrov, Josefa Gonzalez.
Data curation: Gabriel E. Rech, Josefa Gonzalez.
Formal analysis: Gabriel E. Rech, Marıa Bogaerts-Marquez, Maite G. Barron, Miriam Meren-
ciano, Jose Luis Villanueva-Cañas, Vivien Horvath, Anna-Sophie Fiston-Lavier, Isabelle
Luyten, Sandeep Venkataram, Josefa Gonzalez.
Funding acquisition: Dmitri A. Petrov, Josefa Gonzalez.
Investigation: Josefa Gonzalez.
Methodology: Gabriel E. Rech, Maite G. Barron, Dmitri A. Petrov, Josefa Gonzalez.
Project administration: Dmitri A. Petrov, Josefa Gonzalez.
Resources: Dmitri A. Petrov, Josefa Gonzalez.
Supervision: Hadi Quesneville, Dmitri A. Petrov, Josefa Gonzalez.
Validation: Josefa Gonzalez.
Visualization: Gabriel E. Rech, Josefa Gonzalez.
Writing – original draft: Gabriel E. Rech, Josefa Gonzalez.
Writing – review & editing: Anna-Sophie Fiston-Lavier, Hadi Quesneville, Dmitri A. Petrov,
Josefa Gonzalez.
References1. Pardo-Diaz C, Salazar C, Jiggins CD. Towards the identification of the loci of adaptive evolution. Meth-
ods Ecol Evol. 2015; 6(4):445–64. https://doi.org/10.1111/2041-210X.12324 PMID: 25937885;
PubMed Central PMCID: PMCPMC4409029.
2. Hoban S, Kelley JL, Lotterhos KE, Antolin MF, G, Lowry DB, et al. Finding the Genomic Basis of Local
Adaptation: Pitfalls, Practical Solutions, and Future Directions. Am Nat. 2016; 188(4):379–97. Epub
Adaptive insertions in Drosophila
PLOS Genetics | https://doi.org/10.1371/journal.pgen.1007900 February 12, 2019 26 / 33

2016/09/14. https://doi.org/10.1086/688018 PMID: 27622873; PubMed Central PMCID:
PMCPMC5457800.
3. Francois O, Martins H, Caye K, Schoville SD. Controlling false discoveries in genome scans for selec-
tion. Mol Ecol. 2016; 25(2):454–69. Epub 2015/12/17. https://doi.org/10.1111/mec.13513 PMID:
26671840.
4. Fan S, Hansen ME, Lo Y, Tishkoff SA. Going global by adapting local: A review of recent human adap-
tation. Science. 2016; 354(6308):54–9. https://doi.org/10.1126/science.aaf5098 PMID: 27846491;
PubMed Central PMCID: PMCPMC5154245.
5. Jeong C, Di Rienzo A. Adaptations to local environments in modern human populations. Current opin-
ion in genetics & development. 2014; 29:1–8. Epub 2014/08/19. https://doi.org/10.1016/j.gde.2014.
06.011 PMID: 25129844; PubMed Central PMCID: PMCPMC4258478.
6. Flood PJ, Hancock AM. The genomic basis of adaptation in plants. Curr Opin Plant Biol. 2017; 36:88–
94. https://doi.org/10.1016/j.pbi.2017.02.003 PMID: 28242535.
7. Gonzalez J, Lenkov K, Lipatov M, Macpherson JM, Petrov DA. High rate of recent transposable ele-
ment-induced adaptation in Drosophila melanogaster. PLoS Biol. 2008; 6(10):e251. https://doi.org/10.
1371/journal.pbio.0060251 PMID: 18942889; PubMed Central PMCID: PMCPMC2570423.
8. Gonzalez J, Karasov TL, Messer PW, Petrov DA. Genome-wide patterns of adaptation to temperate
environments associated with transposable elements in Drosophila. PLoS Genet. 2010; 6(4):
e1000905. Epub 2010/04/14. https://doi.org/10.1371/journal.pgen.1000905 PMID: 20386746;
PubMed Central PMCID: PMCPMC2851572.
9. Dennis MY, Eichler EE. Human adaptation and evolution by segmental duplication. Current opinion in
genetics & development. 2016; 41:44–52. Epub 2016/09/02. https://doi.org/10.1016/j.gde.2016.08.
001 PMID: 27584858; PubMed Central PMCID: PMCPMC5161654.
10. Rishishwar L, Wang L, Clayton EA, Marino-Ramirez L, McDonald JF, Jordan IK. Population and clini-
cal genetics of human transposable elements in the (post) genomic era. Mobile genetic elements.
2017; 7(1):1–20. Epub 2017/02/24. https://doi.org/10.1080/2159256X.2017.1280116 PMID:
28228978; PubMed Central PMCID: PMCPMC5305044.
11. Chuong EB, Elde NC, Feschotte C. Regulatory activities of transposable elements: from conflicts to
benefits. Nat Rev Genet. 2017; 18(2):71–86. Epub 2016/11/22. https://doi.org/10.1038/nrg.2016.139
PMID: 27867194; PubMed Central PMCID: PMCPMC5498291.
12. Casacuberta E, Gonzalez J. The impact of transposable elements in environmental adaptation. Mol
Ecol. 2013; 22(6):1503–17. Epub 2013/01/09. https://doi.org/10.1111/mec.12170 PMID: 23293987.
13. Hua-Van A, Le Rouzic A, Boutin TS, Filee J, Capy P. The struggle for life of the genome’s selfish archi-
tects. Biol Direct. 2011; 6:19. Epub 2011/03/19. https://doi.org/10.1186/1745-6150-6-19 PMID:
21414203; PubMed Central PMCID: PMCPMC3072357.
14. Guio L, Gonzalez J. New insights on the evolution of genome content: population dynamics of trans-
posable elements in flies and humans. Methods in Molecular Biology 2019 (in press).
15. Elbarbary RA, Lucas BA, Maquat LE. Retrotransposons as regulators of gene expression. Science.
2016; 351(6274):aac7247. Epub 2016/02/26. https://doi.org/10.1126/science.aac7247 PMID:
26912865; PubMed Central PMCID: PMCPMC4788378.
16. Petrov DA, Fiston-Lavier AS, Lipatov M, Lenkov K, Gonzalez J. Population genomics of transposable
elements in Drosophila melanogaster. Mol Biol Evol. 2011; 28(5):1633–44. https://doi.org/10.1093/
molbev/msq337 PMID: 21172826; PubMed Central PMCID: PMCPMC3080135.
17. Chuong EB, Elde NC, Feschotte C. Regulatory evolution of innate immunity through co-option of
endogenous retroviruses. Science. 2016; 351(6277):1083–7. Epub 2016/03/05. https://doi.org/10.
1126/science.aad5497 PMID: 26941318; PubMed Central PMCID: PMCPMC4887275.
18. Daborn PJ, Yen JL, Bogwitz MR, Le Goff G, Feil E, Jeffers S, et al. A single p450 allele associated
with insecticide resistance in Drosophila. Science. 2002; 297(5590):2253–6. https://doi.org/10.1126/
science.1074170 PMID: 12351787.
19. Chung H, Bogwitz MR, McCart C, Andrianopoulos A, Ffrench-Constant RH, Batterham P, et al. Cis-
regulatory elements in the Accord retrotransposon result in tissue-specific expression of the Drosoph-
ila melanogaster insecticide resistance gene Cyp6g1. Genetics. 2007; 175(3):1071–7. Epub 2006/12/
21. https://doi.org/10.1534/genetics.106.066597 PMID: 17179088; PubMed Central PMCID:
PMCPMC1840086.
20. Kuhn A, Ong YM, Cheng CY, Wong TY, Quake SR, Burkholder WF. Linkage disequilibrium and signa-
tures of positive selection around LINE-1 retrotransposons in the human genome. Proc Natl Acad Sci
U S A. 2014; 111(22):8131–6. Epub 2014/05/23. https://doi.org/10.1073/pnas.1401532111 PMID:
24847061; PubMed Central PMCID: PMCPMC4050588.
Adaptive insertions in Drosophila
PLOS Genetics | https://doi.org/10.1371/journal.pgen.1007900 February 12, 2019 27 / 33

21. Blumenstiel JP, Chen X, He M, Bergman CM. An age-of-allele test of neutrality for transposable ele-
ment insertions. Genetics. 2014; 196(2):523–38. Epub 2013/12/18. https://doi.org/10.1534/genetics.
113.158147 PMID: 24336751; PubMed Central PMCID: PMCPMC3914624.
22. Kofler R, Betancourt AJ, Schlotterer C. Sequencing of pooled DNA samples (Pool-Seq) uncovers
complex dynamics of transposable element insertions in Drosophila melanogaster. PLoS Genet.
2012; 8(1):e1002487. Epub 2012/02/01. https://doi.org/10.1371/journal.pgen.1002487 PMID:
22291611; PubMed Central PMCID: PMCPMC3266889.
23. Quadrana L, Bortolini Silveira A, Mayhew GF, LeBlanc C, Martienssen RA, Jeddeloh JA, et al. The
Arabidopsis thaliana mobilome and its impact at the species level. Elife. 2016; 5. Epub 2016/06/04.
https://doi.org/10.7554/eLife.15716 PMID: 27258693; PubMed Central PMCID: PMCPMC4917339.
24. Stuart T, Eichten SR, Cahn J, Karpievitch YV, Borevitz JO, Lister R. Population scale mapping of
transposable element diversity reveals links to gene regulation and epigenomic variation. Elife. 2016;
5. Epub 2016/12/03. https://doi.org/10.7554/eLife.20777 PMID: 27911260; PubMed Central PMCID:
PMCPMC5167521.
25. Gonzalez J, Petrov DA. Evolution of genome content: population dynamics of transposable elements
in flies and humans. Methods in molecular biology (Clifton, NJ). 2012; 855:361–83. Epub 2012/03/13.
https://doi.org/10.1007/978-1-61779-582-4_13 PMID: 22407716.
26. David JR, Capy P. Genetic variation of Drosophila melanogaster natural populations. Trends Genet.
1988; 4(4):106–11. Epub 1988/04/01. PMID: 3149056.
27. Li H, Stephan W. Inferring the demographic history and rate of adaptive substitution in Drosophila.
PLoS Genet. 2006; 2(10):e166. https://doi.org/10.1371/journal.pgen.0020166 PMID: 17040129;
PubMed Central PMCID: PMCPMC1599771.
28. Hervas S, Sanz E, Casillas S, Pool JE, Barbadilla A. PopFly: the Drosophila population genomics
browser. Bioinformatics. 2017; 33(17):2779–80. https://doi.org/10.1093/bioinformatics/btx301 PMID:
28472360
29. Guirao-Rico S, Gonzalez J. Evolutionary insights from large scale resequencing datasets in Drosoph-
ila melanogaster. Current Opinion in Insect Science. 2019; 31:70–6. https://doi.org/10.1016/j.cois.
2018.11.002.
30. Gramates LS, Marygold SJ, Santos Gd, Urbano J-M, Antonazzo G, Matthews BB, et al. FlyBase at 25:
looking to the future. Nucleic Acids Research. 2017; 45(D1):D663–D71. https://doi.org/10.1093/nar/
gkw1016 PMID: 27799470
31. Kaminker JS, Bergman CM, Kronmiller B, Carlson J, Svirskas R, Patel S, et al. The transposable ele-
ments of the Drosophila melanogaster euchromatin: a genomics perspective. Genome Biol. 2002; 3
(12):Research0084. Epub 2003/01/23. https://doi.org/10.1186/gb-2002-3-12-research0084 PMID:
12537573; PubMed Central PMCID: PMCPMC151186.
32. Quesneville H, Bergman CM, Andrieu O, Autard D, Nouaud D, Ashburner M, et al. Combined Evi-
dence Annotation of Transposable Elements in Genome Sequences. PLOS Computational Biology.
2005; 1(2):e22. https://doi.org/10.1371/journal.pcbi.0010022 PMID: 16110336
33. Fiston-Lavier AS, Barron MG, Petrov DA, Gonzalez J. T-lex2: genotyping, frequency estimation and
re-annotation of transposable elements using single or pooled next-generation sequencing data.
Nucleic Acids Res. 2015; 43(4):e22. https://doi.org/10.1093/nar/gku1250 PMID: 25510498; PubMed
Central PMCID: PMCPMC4344482.
34. Petrov DA, Aminetzach YT, Davis JC, Bensasson D, Hirsh AE. Size matters: non-LTR retrotransposa-
ble elements and ectopic recombination in Drosophila. Mol Biol Evol. 2003; 20(6):880–92. Epub 2003/
04/30. https://doi.org/10.1093/molbev/msg102 PMID: 12716993.
35. Barron MG, Fiston-Lavier AS, Petrov DA, Gonzalez J. Population genomics of transposable elements
in Drosophila. Annu Rev Genet. 2014; 48:561–81. https://doi.org/10.1146/annurev-genet-120213-
092359 PMID: 25292358.
36. Hill WG, Robertson A. The effect of linkage on limits to artificial selection. Genetical research. 1966; 8
(3):269–94. Epub 1966/12/01. PMID: 5980116.
37. Smith JM, Haigh J. The hitch-hiking effect of a favourable gene. Genetical research. 1974; 23(1):23–
35. Epub 1974/02/01. PMID: 4407212.
38. Charlesworth B, Morgan MT, Charlesworth D. The effect of deleterious mutations on neutral molecular
variation. Genetics. 1993; 134(4):1289–303. Epub 1993/08/01. PMID: 8375663; PubMed Central
PMCID: PMCPMC1205596.
39. Hudson RR, Kaplan NL. Deleterious background selection with recombination. Genetics. 1995; 141
(4):1605–17. Epub 1995/12/01. PMID: 8601498; PubMed Central PMCID: PMCPMC1206891.
Adaptive insertions in Drosophila
PLOS Genetics | https://doi.org/10.1371/journal.pgen.1007900 February 12, 2019 28 / 33

40. Castellano D, Coronado-Zamora M, Campos JL, Barbadilla A, Eyre-Walker A. Adaptive Evolution Is
Substantially Impeded by Hill–Robertson Interference in Drosophila. Molecular Biology and Evolution.
2016; 33(2):442–55. https://doi.org/10.1093/molbev/msv236 PMC4794616. PMID: 26494843
41. Sellis D, Callahan BJ, Petrov DA, Messer PW. Heterozygote advantage as a natural consequence of
adaptation in diploids. Proceedings of the National Academy of Sciences of the United States of Amer-
ica. 2011; 108(51):20666–71. https://doi.org/10.1073/pnas.1114573108 PMC3251125. PMID:
22143780
42. Bergman CM, Bensasson D. Recent LTR retrotransposon insertion contrasts with waves of non-LTR
insertion since speciation in Drosophila melanogaster. Proceedings of the National Academy of Sci-
ences. 2007; 104(27):11340–5. https://doi.org/10.1073/pnas.0702552104 PMID: 17592135
43. Montgomery E, Charlesworth B, Langley CH. A test for the role of natural selection in the stabilization
of transposable element copy number in a population of Drosophila melanogaster. Genetical research.
1987; 49(1):31–41. Epub 1987/02/01. PMID: 3032743.
44. Petrov DA, Chao YC, Stephenson EC, Hartl DL. Pseudogene evolution in Drosophila suggests a high
rate of DNA loss. Mol Biol Evol. 1998; 15(11):1562–7. Epub 2003/02/08. https://doi.org/10.1093/
oxfordjournals.molbev.a025883 PMID: 12572619.
45. Voight BF, Kudaravalli S, Wen X, Pritchard JK. A Map of Recent Positive Selection in the Human
Genome. PLOS Biology. 2006; 4(3):e72. https://doi.org/10.1371/journal.pbio.0040072 PMID:
16494531
46. Garud NR, Messer PW, Buzbas EO, Petrov DA. Recent Selective Sweeps in North American Dro-
sophila melanogaster Show Signatures of Soft Sweeps. PLOS Genetics. 2015; 11(2):e1005004.
https://doi.org/10.1371/journal.pgen.1005004 PMID: 25706129
47. Ferrer-Admetlla A, Liang M, Korneliussen T, Nielsen R. On detecting incomplete soft or hard selective
sweeps using haplotype structure. Mol Biol Evol. 2014; 31(5):1275–91. Epub 2014/02/21. https://doi.
org/10.1093/molbev/msu077 PMID: 24554778; PubMed Central PMCID: PMCPMC3995338.
48. Kapun M, Barron Aduriz MG, Staubach F, Vieira J, Obbard D, Goubert C, et al. Genomic analysis of
European Drosophila populations reveals longitudinal structure and continent-wide selection. bioRxiv.
2018. https://doi.org/10.1101/313759
49. Weir BS, Cockerham CC. Estimating F-statistics for the analysis of population structure. Evolution.
1984; 38(6):1358–70. https://doi.org/10.1111/j.1558-5646.1984.tb05657.x PMID: 28563791.
50. Tajima F. Statistical method for testing the neutral mutation hypothesis by DNA polymorphism. Genet-
ics. 1989; 123(3):585–95. Epub 1989/11/01. PMID: 2513255; PubMed Central PMCID:
PMCPMC1203831.
51. Lerat E, Goubert C, Guirao-Rico S, Merenciano M, Dufour A-B, Vieira C, et al. Population specific
dynamics and selection patterns of transposable element insertions in European natural populations.
Molecular Ecology. 2019;0(ja). https://doi.org/10.1111/mec.14963
52. Mateo L, Ullastres A, Gonzalez J. A transposable element insertion confers xenobiotic resistance in
Drosophila. PLoS Genet. 2014; 10(8):e1004560. https://doi.org/10.1371/journal.pgen.1004560 PMID:
25122208; PubMed Central PMCID: PMCPMC4133159.
53. Mateo L, Rech GE, Gonzalez J. Genome-wide patterns of local adaptation in Western European Dro-
sophila melanogaster natural populations. Scientific Reports. 2018; 8(1):16143. https://doi.org/10.
1038/s41598-018-34267-0 PMID: 30385770
54. Ullastres A, Petit N, Gonzalez J. Exploring the phenotypic space and the evolutionary history of a natu-
ral mutation in Drosophila melanogaster. Mol Biol Evol. 2015; 32(7):1800–14. https://doi.org/10.1093/
molbev/msv061 PMID: 25862139; PubMed Central PMCID: PMCPMC4476160.
55. Merenciano M, Ullastres A, de Cara MA, Barron MG, Gonzalez J. Multiple independent retroelement
insertions in the promoter of a stress response gene have variable molecular and functional effects in
Drosophila. PLoS Genet. 2016; 12(8):e1006249. https://doi.org/10.1371/journal.pgen.1006249 PMID:
27517860; PubMed Central PMCID: PMCPMC4982627.
56. Zhu CT, Chang C, Reenan RA, Helfand SL. Indy gene variation in natural populations confers fitness
advantage and life span extension through transposon insertion. Aging. 2014; 6(1):58–69. Epub 2014/
02/13. https://doi.org/10.18632/aging.100634 PMID: 24519859; PubMed Central PMCID:
PMCPMC3927810.
57. Gonzalez J, Macpherson JM, Petrov DA. A recent adaptive transposable element insertion near highly
conserved developmental loci in Drosophila melanogaster. Mol Biol Evol. 2009; 26(9):1949–61.
https://doi.org/10.1093/molbev/msp107 PMID: 19458110; PubMed Central PMCID:
PMCPMC2734154.
58. Guio L, Barron MG, Gonzalez J. The transposable element Bari-Jheh mediates oxidative stress
response in Drosophila. Mol Ecol. 2014; 23(8):2020–30. https://doi.org/10.1111/mec.12711 PMID:
24629106.
Adaptive insertions in Drosophila
PLOS Genetics | https://doi.org/10.1371/journal.pgen.1007900 February 12, 2019 29 / 33

59. Le Manh H, Guio L, Merenciano M, Rovira Q, Barron MG, Gonzalez J. Natural and laboratory muta-
tions in kuzbanian are associated with zinc stress phenotypes in Drosophila melanogaster. Sci Rep.
2017; 7:42663. https://doi.org/10.1038/srep42663 PMID: 28218276; PubMed Central PMCID:
PMCPMC5316978.
60. Aminetzach YT, Macpherson JM, Petrov DA. Pesticide resistance via transposition-mediated adaptive
gene truncation in Drosophila. Science. 2005; 309(5735):764–7. Epub 2005/07/30. https://doi.org/10.
1126/science.1112699 PMID: 16051794.
61. Schmidt JM, Good RT, Appleton B, Sherrard J, Raymant GC, Bogwitz MR, et al. Copy number varia-
tion and transposable elements feature in recent, ongoing adaptation at the Cyp6g1 locus. PLoS
Genet. 2010; 6(6):e1000998. Epub 2010/06/30. https://doi.org/10.1371/journal.pgen.1000998 PMID:
20585622; PubMed Central PMCID: PMCPMC2891717.
62. Huang da W, Sherman BT, Lempicki RA. Bioinformatics enrichment tools: paths toward the compre-
hensive functional analysis of large gene lists. Nucleic Acids Res. 2009; 37(1):1–13. Epub 2008/11/27.
https://doi.org/10.1093/nar/gkn923 PMID: 19033363; PubMed Central PMCID: PMCPMC2615629.
63. Huang DW, Sherman BT, Lempicki RA. Systematic and integrative analysis of large gene lists using
DAVID bioinformatics resources. Nat Protocols. 2008; 4(1):44–57. http://www.nature.com/nprot/
journal/v4/n1/suppinfo/nprot.2008.211_S1.html.
64. Shabalin AA. Matrix eQTL: ultra fast eQTL analysis via large matrix operations. Bioinformatics. 2012;
28(10):1353–8. https://doi.org/10.1093/bioinformatics/bts163 PMC3348564. PMID: 22492648
65. Huang W, Carbone MA, Magwire MM, Peiffer JA, Lyman RF, Stone EA, et al. Genetic basis of tran-
scriptome diversity in Drosophila melanogaster. Proc Natl Acad Sci U S A. 2015; 112(44):E6010–9.
Epub 2015/10/21. https://doi.org/10.1073/pnas.1519159112 PMID: 26483487; PubMed Central
PMCID: PMCPMC4640795.
66. Mackay TF. Mutations and quantitative genetic variation: lessons from Drosophila. Philosophical
transactions of the Royal Society of London Series B, Biological sciences. 2010; 365(1544):1229–39.
Epub 2010/03/24. https://doi.org/10.1098/rstb.2009.0315 PMID: 20308098; PubMed Central PMCID:
PMCPMC2871822.
67. Cridland JM, Thornton KR, Long AD. Gene Expression Variation in Drosophila melanogaster Due to
Rare Transposable Element Insertion Alleles of Large Effect. Genetics. 2015; 199(1):85–93. https://
doi.org/10.1534/genetics.114.170837 PMC4286695. PMID: 25335504
68. Villanueva-Cañas JL, Rech GE, de Cara MAR, Gonzalez J. Beyond SNPs: how to detect selection on
transposable element insertions. Methods in Ecology and Evolution. 2017; 8(6):728–37. https://doi.
org/10.1111/2041-210X.12781
69. Pritchard JK, Di Rienzo A. Adaptation–not by sweeps alone. Nature Reviews Genetics. 2010; 11:665.
https://doi.org/10.1038/nrg2880 PMID: 20838407
70. Coop G, Witonsky D, Di Rienzo A, Pritchard JK. Using Environmental Correlations to Identify Loci
Underlying Local Adaptation. Genetics. 2010; 185(4):1411–23. https://doi.org/10.1534/genetics.110.
114819 PMC2927766. PMID: 20516501
71. Frichot E, Francois O, O’Meara B. LEA: An R package for landscape and ecological association stud-
ies. Methods in Ecology and Evolution. 2015; 6(8):925–9. https://doi.org/10.1111/2041-210X.12382
72. Gautier M. Genome-Wide Scan for Adaptive Divergence and Association with Population-Specific
Covariates. Genetics. 2015; 201(4):1555–79. Epub 2015/10/21. https://doi.org/10.1534/genetics.115.
181453 PMID: 26482796; PubMed Central PMCID: PMCPMC4676524.
73. Ahrens CW, Rymer PD, Stow A, Bragg J, Dillon S, Umbers KDL, et al. The search for loci under selec-
tion: trends, biases and progress. Mol Ecol. 2018; 27(6):1342–56. Epub 2018/03/11. https://doi.org/
10.1111/mec.14549 PMID: 29524276.
74. Zonato V, Collins L, Pegoraro M, Tauber E, Kyriacou CP. Is diapause an ancient adaptation in Dro-
sophila? J Insect Physiol. 2017; 98:267–74. https://doi.org/10.1016/j.jinsphys.2017.01.017 PMID:
28161445.
75. Kolaczkowski B, Kern AD, Holloway AK, Begun DJ. Genomic Differentiation Between Temperate and
Tropical Australian Populations of Drosophila melanogaster. Genetics. 2011; 187(1):245–60. https://
doi.org/10.1534/genetics.110.123059 PMID: 21059887
76. Fabian DK, Kapun M, Nolte V, Kofler R, Schmidt PS, Schlotterer C, et al. Genome-wide patterns of lat-
itudinal differentiation among populations of Drosophila melanogaster from North America. Mol Ecol.
2012; 21(19):4748–69. https://doi.org/10.1111/j.1365-294X.2012.05731.x PMID: 22913798; PubMed
Central PMCID: PMCPMC3482935.
77. Reinhardt JA, Kolaczkowski B, Jones CD, Begun DJ, Kern AD. Parallel geographic variation in Dro-
sophila melanogaster. Genetics. 2014; 197(1):361–73. https://doi.org/10.1534/genetics.114.161463
PMID: 24610860; PubMed Central PMCID: PMCPMC4012493.
Adaptive insertions in Drosophila
PLOS Genetics | https://doi.org/10.1371/journal.pgen.1007900 February 12, 2019 30 / 33

78. Bergland AO, Behrman EL, O’Brien KR, Schmidt PS, Petrov DA. Genomic evidence of rapid and sta-
ble adaptive oscillations over seasonal time scales in Drosophila. PLoS Genet. 2014; 10(11):
e1004775. https://doi.org/10.1371/journal.pgen.1004775 PMID: 25375361; PubMed Central PMCID:
PMCPMC4222749.
79. Kapun M, Fabian DK, Goudet J, Flatt T. Genomic evidence for adaptive inversion clines in Drosophila
melanogaster. Mol Biol Evol. 2016; 33(5):1317–36. Epub 2016/01/23. https://doi.org/10.1093/molbev/
msw016 PMID: 26796550.
80. Pool JE, Braun DT, Lack JB. Parallel Evolution of Cold Tolerance within Drosophila melanogaster. Mol
Biol Evol. 2017; 34(2):349–60. Epub 2016/10/26. https://doi.org/10.1093/molbev/msw232 PMID:
27777283; PubMed Central PMCID: PMCPMC5526443.
81. Rahman R, Chirn GW, Kanodia A, Sytnikova YA, Brembs B, Bergman CM, et al. Unique transposon
landscapes are pervasive across Drosophila melanogaster genomes. Nucleic Acids Res. 2015; 43
(22):10655–72. Epub 2015/11/19. https://doi.org/10.1093/nar/gkv1193 PMID: 26578579; PubMed
Central PMCID: PMCPMC4678822.
82. Nelson MG, Linheiro RS, Bergman CM. McClintock: An Integrated Pipeline for Detecting Transpos-
able Element Insertions in Whole-Genome Shotgun Sequencing Data. G3 (Bethesda). 2017; 7
(8):2763–78. Epub 2017/06/24. https://doi.org/10.1534/g3.117.043893 PMID: 28637810; PubMed
Central PMCID: PMCPMC5555480.
83. Chakraborty M, VanKuren NW, Zhao R, Zhang X, Kalsow S, Emerson JJ. Hidden genetic variation
shapes the structure of functional elements in Drosophila. Nature Genetics. 2018; 50(1):20–5. https://
doi.org/10.1038/s41588-017-0010-y PMID: 29255259
84. Ullastres A. Adaptation in Drosophila melanogaster natural populations: fitness effects and evolution-
ary history of a natural insertion and molecular effects of several transposable elements on immune-
related genes. PhD thesis http://hdl.handle.net/10803/406957
85. Lack JB, Cardeno CM, Crepeau MW, Taylor W, Corbett-Detig RB, Stevens KA, et al. The Drosophila
genome nexus: a population genomic resource of 623 Drosophila melanogaster genomes, including
197 from a single ancestral range population. Genetics. 2015; 199(4):1229–41. Epub 2015/01/30.
https://doi.org/10.1534/genetics.115.174664 PMID: 25631317; PubMed Central PMCID:
PMCPMC4391556.
86. Campo D, Lehmann K, Fjeldsted C, Souaiaia T, Kao J, Nuzhdin SV. Whole-genome sequencing of
two North American Drosophila melanogaster populations reveals genetic differentiation and positive
selection. Mol Ecol. 2013; 22(20):5084–97. Epub 2013/10/10. https://doi.org/10.1111/mec.12468
PMID: 24102956; PubMed Central PMCID: PMCPMC3800041.
87. Bastide H, Betancourt A, Nolte V, Tobler R, Stobe P, Futschik A, et al. A Genome-Wide, Fine-Scale
Map of Natural Pigmentation Variation in Drosophila melanogaster. PLOS Genetics. 2013; 9(6):
e1003534. https://doi.org/10.1371/journal.pgen.1003534 PMID: 23754958
88. Attrill H, Falls K, Goodman JL, Millburn GH, Antonazzo G, Rey AJ, et al. FlyBase: establishing a gene
group resource for Drosophila melanogaster. Nucleic Acids Res. 2016; 44(D1):D786–92. https://doi.
org/10.1093/nar/gkv1046 PMID: 26467478; PubMed Central PMCID: PMCPMC4702782.
89. Mohr SE, Hu Y, Kim K, Housden BE, Perrimon N. Resources for functional genomics studies in Dro-
sophila melanogaster. Genetics. 2014; 197(1):1–18. https://doi.org/10.1534/genetics.113.154344
PMID: 24653003; PubMed Central PMCID: PMCPMC4012471.
90. Kapitonov VV, Jurka J. Molecular paleontology of transposable elements in the Drosophila melanoga-
ster genome. Proc Natl Acad Sci U S A. 2003; 100(11):6569–74. Epub 2003/05/14. https://doi.org/10.
1073/pnas.0732024100 PMID: 12743378; PubMed Central PMCID: PMCPMC164487.
91. Singh ND, Petrov DA. Rapid sequence turnover at an intergenic locus in Drosophila. Mol Biol Evol.
2004; 21(4):670–80. Epub 2004/01/24. https://doi.org/10.1093/molbev/msh060 PMID: 14739245.
92. Yang HP, Barbash DA. Abundant and species-specific DINE-1 transposable elements in 12 Drosoph-
ila genomes. Genome Biol. 2008; 9(2):R39. Epub 2008/02/23. https://doi.org/10.1186/gb-2008-9-2-
r39 PMID: 18291035; PubMed Central PMCID: PMCPMC2374699.
93. Comeron JM, Ratnappan R, Bailin S. The Many Landscapes of Recombination in Drosophila melano-
gaster. PLOS Genetics. 2012; 8(10):e1002905. https://doi.org/10.1371/journal.pgen.1002905 PMID:
23071443
94. Fiston-Lavier AS, Singh ND, Lipatov M, Petrov DA. Drosophila melanogaster recombination rate cal-
culator. Gene. 2010; 463(1–2):18–20. https://doi.org/10.1016/j.gene.2010.04.015 PMID: 20452408.
95. Pool JE, Corbett-Detig RB, Sugino RP, Stevens KA, Cardeno CM, Crepeau MW, et al. Population
genomics of sub-saharan Drosophila melanogaster: African diversity and non-African admixture.
PLoS Genet. 2012; 8(12):e1003080. https://doi.org/10.1371/journal.pgen.1003080 PMID: 23284287;
PubMed Central PMCID: PMCPMC3527209.
Adaptive insertions in Drosophila
PLOS Genetics | https://doi.org/10.1371/journal.pgen.1007900 February 12, 2019 31 / 33

96. Huang W, Massouras A, Inoue Y, Peiffer J, Ramia M, Tarone AM, et al. Natural variation in genome
architecture among 205 Drosophila melanogaster Genetic Reference Panel lines. Genome Res.
2014; 24(7):1193–208. https://doi.org/10.1101/gr.171546.113 PMID: 24714809; PubMed Central
PMCID: PMCPMC4079974.
97. Mackay TF, Richards S, Stone EA, Barbadilla A, Ayroles JF, Zhu D, et al. The Drosophila melanoga-
ster Genetic Reference Panel. Nature. 2012; 482(7384):173–8. https://doi.org/10.1038/nature10811
PMID: 22318601; PubMed Central PMCID: PMCPMC3683990.
98. Flutre T, Duprat E, Feuillet C, Quesneville H. Considering Transposable Element Diversification in De
Novo Annotation Approaches. PLOS ONE. 2011; 6(1):e16526. https://doi.org/10.1371/journal.pone.
0016526 PMID: 21304975
99. Hoede C, Arnoux S, Moisset M, Chaumier T, Inizan O, Jamilloux V, et al. PASTEC: an automatic
transposable element classification tool. PLoS One. 2014; 9(5):e91929. Epub 2014/05/03. https://doi.
org/10.1371/journal.pone.0091929 PMID: 24786468; PubMed Central PMCID: PMCPMC4008368.
100. Thompson JD, Gibson TJ, Plewniak F, Jeanmougin F, Higgins DG. The CLUSTAL_X windows inter-
face: flexible strategies for multiple sequence alignment aided by quality analysis tools. Nucleic Acids
Res. 1997; 25(24):4876–82. Epub 1998/02/28. PMID: 9396791; PubMed Central PMCID:
PMCPMC147148.
101. Katoh K, Misawa K, Kuma Ki, Miyata T. MAFFT: a novel method for rapid multiple sequence alignment
based on fast Fourier transform. Nucleic Acids Research. 2002; 30(14):3059–66. https://doi.org/10.
1093/nar/gkf436 PMID: 12136088
102. Guindon S, Gascuel O. A simple, fast, and accurate algorithm to estimate large phylogenies by maxi-
mum likelihood. Systematic biology. 2003; 52(5):696–704. Epub 2003/10/08. PMID: 14530136.
103. Junier T, Zdobnov EM. The Newick utilities: high-throughput phylogenetic tree processing in the UNIX
shell. Bioinformatics. 2010; 26(13):1669–70. Epub 2010/05/18. https://doi.org/10.1093/bioinformatics/
btq243 PMID: 20472542; PubMed Central PMCID: PMCPMC2887050.
104. Lack JB, Lange JD, Tang AD, Corbett-Detig RB, Pool JE. A thousand fly genomes: an expanded Dro-
sophila genome nexus. Mol Biol Evol. 2016; 33(12):3308–13. https://doi.org/10.1093/molbev/msw195
PMID: 27687565; PubMed Central PMCID: PMCPMC5100052.
105. Grenier JK, Arguello JR, Moreira MC, Gottipati S, Mohammed J, Hackett SR, et al. Global diversity
lines—a five-continent reference panel of sequenced Drosophila melanogaster strains. G3
(Bethesda). 2015; 5(4):593–603. Epub 2015/02/13. https://doi.org/10.1534/g3.114.015883 PMID:
25673134; PubMed Central PMCID: PMCPMC4390575.
106. Delaneau O, Marchini J, Zagury JF. A linear complexity phasing method for thousands of genomes.
Nature methods. 2011; 9(2):179–81. Epub 2011/12/06. https://doi.org/10.1038/nmeth.1785 PMID:
22138821.
107. Danecek P, Auton A, Abecasis G, Albers CA, Banks E, DePristo MA, et al. The variant call format and
VCFtools. Bioinformatics. 2011; 27(15):2156–8. https://doi.org/10.1093/bioinformatics/btr330 PMID:
21653522; PubMed Central PMCID: PMCPMC3137218.
108. Parsch J, Novozhilov S, Saminadin-Peter SS, Wong KM, Andolfatto P. On the utility of short intron
sequences as a reference for the detection of positive and negative selection in Drosophila. Mol Biol
Evol. 2010; 27(6):1226–34. https://doi.org/10.1093/molbev/msq046 PMID: 20150340; PubMed Cen-
tral PMCID: PMCPMC2877998.
109. Szpiech ZA, Hernandez RD. selscan: An Efficient Multithreaded Program to Perform EHH-Based
Scans for Positive Selection. Molecular Biology and Evolution. 2014; 31(10):2824–7. https://doi.org/
10.1093/molbev/msu211 PMID: 25015648
110. Bergland AO, Tobler R, Gonzalez J, Schmidt P, Petrov D. Secondary contact and local adaptation
contribute to genome-wide patterns of clinal variation in Drosophila melanogaster. Mol Ecol. 2016; 25
(5):1157–74. https://doi.org/10.1111/mec.13455 PMID: 26547394; PubMed Central PMCID:
PMCPMC5089930.
111. Chen D, Liang Z. The Analysis of Sequence Features of Introns with Drosophila RP genes. Interna-
tional Journal of Information Processing and Management (IJIPM). 2013; 4(1):6. https://doi.org/10.
4156/ijipm.vol4.issue1.6
112. Park SG, Hannenhalli S, Choi SS. Conservation in first introns is positively associated with the number
of exons within genes and the presence of regulatory epigenetic signals. BMC Genomics. 2014; 15
(1):526. https://doi.org/10.1186/1471-2164-15-526 PMC4085337. PMID: 24964727
113. Hoskins RA, Carlson JW, Wan KH, Park S, Mendez I, Galle SE, et al. The Release 6 reference
sequence of the Drosophila melanogaster genome. Genome Res. 2015; 25(3):445–58. Epub 2015/
01/16. https://doi.org/10.1101/gr.185579.114 PMID: 25589440; PubMed Central PMCID:
PMCPMC4352887.
Adaptive insertions in Drosophila
PLOS Genetics | https://doi.org/10.1371/journal.pgen.1007900 February 12, 2019 32 / 33

114. Chen D, Chen HW. Using the Koppen classification to quantify climate variation and change: An exam-
ple for 1901–2010. Environmental Development. 2013; 6:69–79. http://dx.doi.org/10.1016/j.envdev.
2013.03.007.
Adaptive insertions in Drosophila
PLOS Genetics | https://doi.org/10.1371/journal.pgen.1007900 February 12, 2019 33 / 33