strength tests of 3d warp-knitted composites with … k., mikołajczyk z.; strength tests of 3d...
TRANSCRIPT
Pieklak K., Mikołajczyk Z.; Strength Tests of 3D Warp-Knitted Composites with the Use of the Thermovision Technique.FIBRES & TEXTILES in Eastern Europe 2011, Vol. 19, No. 5 (88) pp. 100-105.
100
Strength Tests of 3D Warp-Knitted Composites with the Use of the Thermovision Technique
Katarzyna Pieklak, Zbigniew Mikołajczyk
Department of Knitting Technology,Technical University of Lodz
ul. Żeromskiego 116, 90-924 Lodz, PolandE-mail: [email protected]
[email protected]@p.lodz.pl
AbstractThe article presents the results of strength tests of thin-walled composite beams carried out with the use of the thermovision technique. During a beam bending test performed in a four-point support system using a testing machine, an increase in the value of the tempera-ture on the surface of the beam was observed along with an increase in the bending input function (deflection of the beam). The curve of force (stress) is correlated with curves of changes in the values of heat emitted during the bending process. The maximum value of temperature rise of the bending composite reaches the value of ΔT = 20.02 °C. The process of the bending of a beam is accompanied by a conversion of mechanical energy into free surface energy, thermal energy as a result of damaged atomic and intermolecular bonds, and also thermal energy occurring due to friction force acting between the destroyed sur-faces. The experiments carried out confirm the thesis that analysis of the temperature distribution of composites in strength tests is the basis for the quality evaluation of stress distribution in the composites tested.
Key words: transnational corporations, corporation culture, management.
Introduction and the aim of research
The polarising and optical method, based on the birefringence phenomenon [1 - 3], is the most commonly used in mechanics and in empirical tests on the stress dis-tribution in structural elements. In this method a flat, transparent model of the object tested is placed in a polariscope, and then a ray of polarised light is trans-mitted through this object. As a result, we obtain an image of isoclinic and iso-chromatic lines related to the state and distribution of stresses. Photoelasticity is mainly used to analyse stresses in ele-ments of irregular shape, to detect criti-cal stress points in glass objects and also to analyse polymer structure. Methods based on such measurements include the reflected light method, the transmitted light method and the stress freezing meth-od. The main disadvantage of this group of methods is that there is no possibility to perform tests on real objects. There-fore, it is necessary to produce models from materials of photoelastic properties or to apply special coats reflecting light from the surface of the samples tested, as well as to use a specialised, complex measuring apparatus. Another technique which also requires the use of a special experimental model made of transparent material is the moire technique, using the moire effect, created as a result of over-exposing two overlying nets of lines, in which one is distorted, whereas the sec-ond one is the model net. Other signifi-cant fields that perform stress analyses include strain gauge measurements using strain gauges fixed on the surface of the elements tested, and the brittle coating method, in which the elements tested
without the exchanging of mass with the environment [5]. The subject-matter of strength tests concerns the new genera-tion of 3D warp-knitted composites. The aim of this research was to identify the strength properties of 3D warp knitted composites on the basis of an analysis of temperature fields using the thermovison technique.
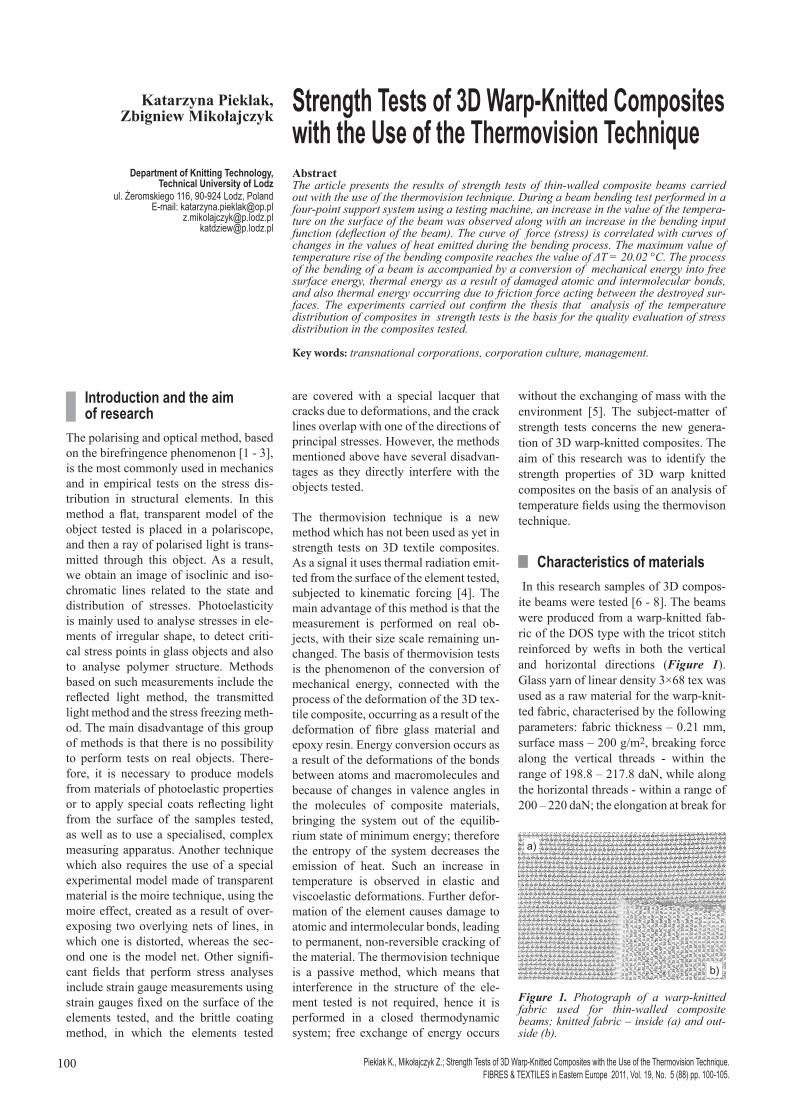
n Characteristics of materials In this research samples of 3D compos-ite beams were tested [6 - 8]. The beams were produced from a warp-knitted fab-ric of the DOS type with the tricot stitch reinforced by wefts in both the vertical and horizontal directions (Figure 1). Glass yarn of linear density 3×68 tex was used as a raw material for the warp-knit-ted fabric, characterised by the following parameters: fabric thickness – 0.21 mm, surface mass – 200 g/m2, breaking force along the vertical threads - within the range of 198.8 – 217.8 daN, while along the horizontal threads - within a range of 200 – 220 daN; the elongation at break for
are covered with a special lacquer that cracks due to deformations, and the crack lines overlap with one of the directions of principal stresses. However, the methods mentioned above have several disadvan-tages as they directly interfere with the objects tested.
The thermovision technique is a new method which has not been used as yet in strength tests on 3D textile composites. As a signal it uses thermal radiation emit-ted from the surface of the element tested, subjected to kinematic forcing [4]. The main advantage of this method is that the measurement is performed on real ob-jects, with their size scale remaining un-changed. The basis of thermovision tests is the phenomenon of the conversion of mechanical energy, connected with the process of the deformation of the 3D tex-tile composite, occurring as a result of the deformation of fibre glass material and epoxy resin. Energy conversion occurs as a result of the deformations of the bonds between atoms and macromolecules and because of changes in valence angles in the molecules of composite materials, bringing the system out of the equilib-rium state of minimum energy; therefore the entropy of the system decreases the emission of heat. Such an increase in temperature is observed in elastic and viscoelastic deformations. Further defor-mation of the element causes damage to atomic and intermolecular bonds, leading to permanent, non-reversible cracking of the material. The thermovision technique is a passive method, which means that interference in the structure of the ele-ment tested is not required, hence it is performed in a closed thermodynamic system; free exchange of energy occurs
Figure 1. Photograph of a warp-knitted fabric used for thin-walled composite beams; knitted fabric – inside (a) and out-side (b).
a)
b)
101FIBRES & TEXTILES in Eastern Europe 2011, Vol. 19, No. 5 (88)
both the vertical and horizontal threads reached the maximum value of 5%.
The knitted fabric was manufactured us-ing an RS 3 EMS warp-knitting machine of needling number 18 E, made by Karl Mayer.
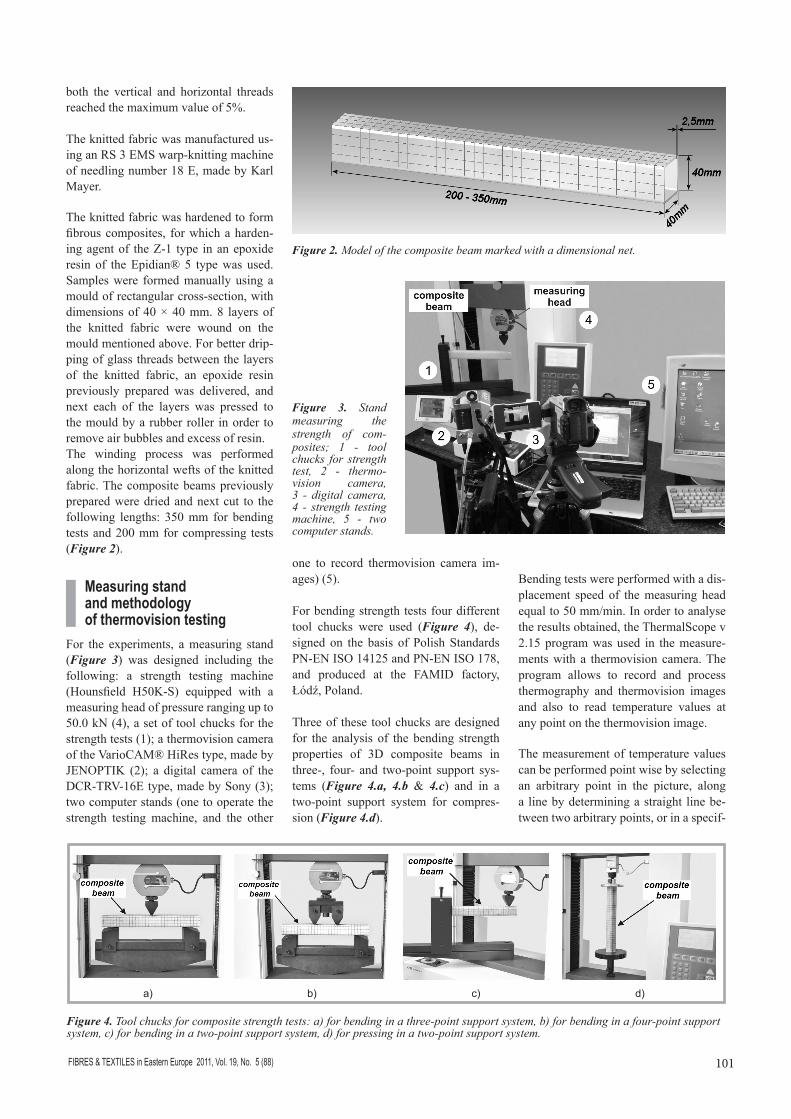
The knitted fabric was hardened to form fibrous composites, for which a harden-ing agent of the Z-1 type in an epoxide resin of the Epidian® 5 type was used. Samples were formed manually using a mould of rectangular cross-section, with dimensions of 40 × 40 mm. 8 layers of the knitted fabric were wound on the mould mentioned above. For better drip-ping of glass threads between the layers of the knitted fabric, an epoxide resin previously prepared was delivered, and next each of the layers was pressed to the mould by a rubber roller in order to remove air bubbles and excess of resin. The winding process was performed along the horizontal wefts of the knitted fabric. The composite beams previously prepared were dried and next cut to the following lengths: 350 mm for bending tests and 200 mm for compressing tests (Figure 2).
Measuring stand and methodology of thermovision testing
For the experiments, a measuring stand (Figure 3) was designed including the following: a strength testing machine (Hounsfield H50K-S) equipped with a measuring head of pressure ranging up to 50.0 kN (4), a set of tool chucks for the strength tests (1); a thermovision camera of the VarioCAM® HiRes type, made by JENOPTIK (2); a digital camera of the DCR-TRV-16E type, made by Sony (3); two computer stands (one to operate the strength testing machine, and the other
one to record thermovision camera im-ages) (5).
For bending strength tests four different tool chucks were used (Figure 4), de-signed on the basis of Polish Standards PN-EN ISO 14125 and PN-EN ISO 178, and produced at the FAMID factory, Łódź, Poland.
Three of these tool chucks are designed for the analysis of the bending strength properties of 3D composite beams in three-, four- and two-point support sys-tems (Figure 4.a, 4.b & 4.c) and in a two-point support system for compres-sion (Figure 4.d).
Figure 2. Model of the composite beam marked with a dimensional net.
Figure 3. Stand measuring the strength of com-posites; 1 - tool chucks for strength test, 2 - thermo-vision camera, 3 - digital camera, 4 - strength testing machine, 5 - two computer stands.
Figure 4. Tool chucks for composite strength tests: a) for bending in a three-point support system, b) for bending in a four-point support system, c) for bending in a two-point support system, d) for pressing in a two-point support system.
a) b) c) d)
Bending tests were performed with a dis-placement speed of the measuring head equal to 50 mm/min. In order to analyse the results obtained, the ThermalScope v 2.15 program was used in the measure-ments with a thermovision camera. The program allows to record and process thermography and thermovision images and also to read temperature values at any point on the thermovision image.
The measurement of temperature values can be performed point wise by selecting an arbitrary point in the picture, along a line by determining a straight line be-tween two arbitrary points, or in a specif-

FIBRES & TEXTILES in Eastern Europe 2011, Vol. 19, No. 5 (88)102
ic area by determining its range using el-liptical, rectangular or polygonal figures. The emissivity of the thin-walled beams tested was determined using a thermovi-sion camera, equalling ελ = 0.95, which indicates that the composite material tested is a good emitter of infrared radia-tion. The measurements were conducted at an ambient temperature of 23 °C and humidity of air of 55%.
n Results and analysisStrength tests were performed for four different support systems of the beam. The variant for bending a composite in a four-point support system was found to be the most interesting and thus sub-mitted to precise analysis. The average initial temperature for this variant was 25.8 °C. It should be noted that the trans-formations occurring within the area of composite deformation as a result of kin-ematic forcing are a very complex physi-cal phenomenon. Moreover an important fact is that before the strength test the beam is placed in a stationary sourceless vector field of temperature; however, due to forcing, the field is transformed into a non-stationary source field, in which heat exchange takes place as a result of radia-tion, conduction and convection.
In this research only one of the two sym-metrical sides of the beam were observed using thermovision and digital cameras. The analysis presented is simplified, not taking into consideration the struc-tural character of the beam. For better analysis, distributions of the temperature should be identified in all four walls of the composite: two vertical and two hori-zontal. It can be assumed that the vertical and horizontal surfaces of the bending beam will have different characters of temperature distributions correlated with the stress distribution. What is more, the upper horizontal surface of the beam is subjected to the process of compression, while the lower surface - to the process of stretching, with different solutions of support systems, which results in differ-ent stress distributions (temperature dis-tributions). Furthermore one should keep
in mind that walls of the beam’s cuboid of defined thickness will have different characters of stress in the external and internal layers of the composite.
Figure 5 presents a correlation of the forcing of beam bending and the temper-ature of the bending area as a function of the beam deformation. The violet curve describes the character of changes in the values of the bending force in time; the red and blue curves describe the changes in values of the maximal temperature for the right and left loading mandrel, re-spectively, while the green curve outlines the changes in values of the average tem-perature for both of the loading mandrels. The area between points A’ and A”, on the graph marked in red, presents the state of the initial damage of the beam in the form of micro cracks. A further
Figure 5. Correlation between the forcing of the beam deflection and the temperature of the bending area in the function of deformation.
Table 1. Values of temperature T, temperature gains ΔT and forces P for characteristic points A‘ to E.
Point TMAX RLM, °C
ΔTMAX RLM, °C
TMAX LLM, °C
ΔTMAX LLM, °C
TAVERAGE, °C
ΔTAVERAGE, °C
P, N
A' 40.60 14.84 34.35 8.59 37.48 11.72 3000A" 41.56 15.08 37.07 11.31 39.32 13.56 3300B 43.58 17.82 39.08 13.32 41.33 15.57 3450C 41.23 15.47 39.69 13.93 40.46 14.70 4043D 43.51 17.75 39.83 14.07 41.67 15.91 5130E 45.96 20.02 38.38 12.62 42.17 16.41 5040

103FIBRES & TEXTILES in Eastern Europe 2011, Vol. 19, No. 5 (88)
increase in bending results in a consecu-tive deformation of the beam. A decrease in temperature in the bending composite, on the graph marked in yellow, is charac-teristic for a visible cracking of the beam in the full height of its wall. The values of temperature T, gains in temperature ∆T and force P for characteristic points A’-E, presented in Figure 5, are given in Table 1. Significant differences in the values of temperature for the left and right loading mandrel, observed in the graph, can result from an inaccurate lev-elling of the upper part of a tool chuck. In the analysis of the bending process of a thin-walled composite beam performed in a four-point support system, an iner-tial delay τ = 171.6 ms can be observed, which refers to an increase in the values of temperature, responding to the forcing signal constant in time, being a kinematic displacement of the measuring head. The displacement is the response (work) of the bending composite beam. In the analysis it was observed that in particular areas, the curve of force gain changes its character of the course. In the following graph there are three areas presented - 1, 2 and 3, in which the angle of the curve slope P(t) changes.
Area „1” is within the range of the bending of the beam, treating it as a visco-elastic object with reversible de-formations. A high gain in force, reach-ing a value of 3 kN, is observed in this area. Within the range of these defor-mations, a significant increase in tem-perature, reaching a value of 39.3 °C (∆T = 13.56 °C), was also observed due to atoms unbalanced from the equilib-rium state, characterised by minimal en-ergy and the formation of micro cracks in the structure of the composite, which resulted from heat emission. A conver-sion of mechanical energy, Em, into free surface energy, Es, of the new surfaces created (micro cracks formation) and heat energy Ec takes place. In area “2”, in which significant damage to the element tested and, thus, permanent deformations occur, a change in the run of the curve of force gain can be observed. The angle of its slope, α2, decreased in relation to angle α1, and consequently the value of the rigidity coefficient changed as well. A decrease in the value of heat emitted was a result of the consecutive breaking of the main chemical bonds in macromolecules. The cohesion of the object was damaged due to external forces, leading to perma-nent non-reversible damage to the beam, which explains the decrease in the values
of temperature. In area “3” a further in-crease in temperature was observed for the right loading mandrel, despite any increase in the value of the force. Heat was emitted as a result of the further de-formation of hitherto undamaged atomic and intermolecular bonds, and as a result of friction when the composite layers came in contact. In this area the mechani-cal energy, Em, delivered was converted into a sum of three constituent energies: free surface energy Es, heat energy as a result of damaged atomic and intermo-lecular bonds Ecw and heat energy Ect as a result of friction force, which can be described as the following dependence: Em = Es + Ecw + Ect.
Both images of the bending beam and thermograms were registered at a suita-
ble frequency: 25 frames/s for the digital camera and 1.15 frames/s for the ther-movision camera. The graph presents six characteristic points describing the be-haviour of the composite strength process.
Four of the bending points of the 3D thin-walled composite beam selected are presented in Figure 6 as photographs of real deformations and corresponding thermovision images. Additionally, the images present enlarged areas of defor-mations and damage of the composite. Point A’ illustrates the moment of the first damage to the beam tested, in which the bending force reached a value of 3.0 kN and the maximum temperature increased in relation to the initial temperature of the beam, reaching 34.3 °C (∆T = 8.59 °C) for the left loading mandrel and 40.6 °C
POINT A’t = 393.60 ms, Δl = 5.47 mm
Tav = 37.48 °C, ΔTav = 11.72 °C
POINT Bt = 484.80 ms, Δl = 6.78 mm
Tav = 41.33 oC, ΔTav = 15.57 oC
POINT Ct = 613.20 ms, Δl = 8.52 mm
Tav = 40.46 °C, ΔTav = 14.70 °C
POINT Et = 1288.20 ms, Δl = 17.89 mmTav = 42.17 °C, ΔTav = 16.41 °C
Figure 6. Digital photographs and thermograms of characteristic points (A’, B, C, E) of the composite beam strength tests in a four-point bending system.
39.4 °C 24.6 °C 39.4 °C 24.6 °C
39.4 °C 24.6 °C 39.4 °C 24.6 °C
FIBRES & TEXTILES in Eastern Europe 2011, Vol. 19, No. 5 (88)104
(∆T = 14.84 °C) for the right loading mandrel. Point B illustrates a distinct crack in the composite of 20 mm depth. The bending force reached a value of 3.450 kN, while the maximum temper-ature was 39.1 °C (∆T = 13.32 °C) for the left loading mandrel and 43.6 °C (∆T = 17.82 °C) for the right loading mandrel.
At point C the crack of the composite deepened, reaching almost the full length of the side wall of the composite. The bending force at this point reached a value of 4.043 kN, while the maximum temperature for the left loading man-drel was 39.7 °C (∆T = 13.93 °C) and for the right loading mandrel – 41.2 °C (∆T = 15.47 °C). Point E illustrates visible damage to the side wall of the composite, in which the elements of the beam tested overlay each other. The bending force at this point reached a value of 5.040 kN, and the maximum temperature observed here was the highest, reaching 46.0 °C (∆T = 20.02 °C) for the right loading mandrel, while for the left loading man-drel the temperature slightly decreased, reaching 38.4 °C (∆T = 12.62 °C).
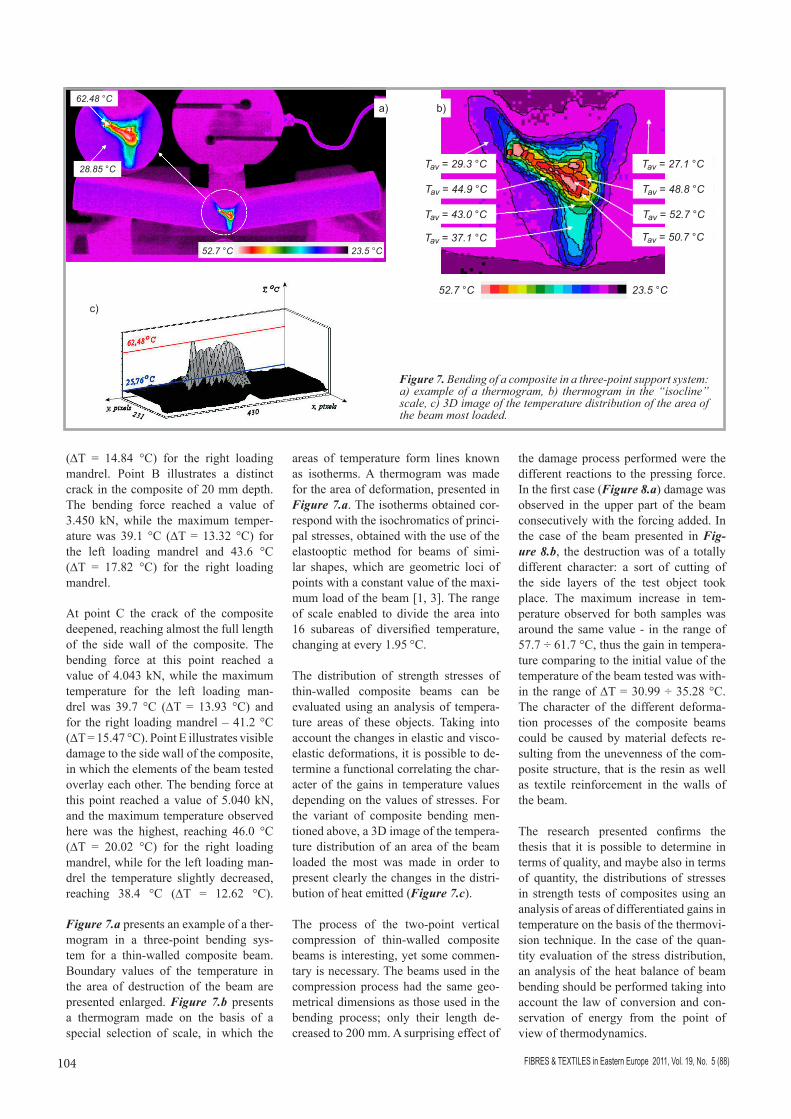
Figure 7.a presents an example of a ther-mogram in a three-point bending sys-tem for a thin-walled composite beam. Boundary values of the temperature in the area of destruction of the beam are presented enlarged. Figure 7.b presents a thermogram made on the basis of a special selection of scale, in which the
Figure 7. Bending of a composite in a three-point support system: a) example of a thermogram, b) thermogram in the “isocline” scale, c) 3D image of the temperature distribution of the area of the beam most loaded.
areas of temperature form lines known as isotherms. A thermogram was made for the area of deformation, presented in Figure 7.a. The isotherms obtained cor-respond with the isochromatics of princi-pal stresses, obtained with the use of the elastooptic method for beams of simi-lar shapes, which are geometric loci of points with a constant value of the maxi-mum load of the beam [1, 3]. The range of scale enabled to divide the area into 16 subareas of diversified temperature, changing at every 1.95 °C.
The distribution of strength stresses of thin-walled composite beams can be evaluated using an analysis of tempera-ture areas of these objects. Taking into account the changes in elastic and visco-elastic deformations, it is possible to de-termine a functional correlating the char-acter of the gains in temperature values depending on the values of stresses. For the variant of composite bending men-tioned above, a 3D image of the tempera-ture distribution of an area of the beam loaded the most was made in order to present clearly the changes in the distri-bution of heat emitted (Figure 7.c).
The process of the two-point vertical compression of thin-walled composite beams is interesting, yet some commen-tary is necessary. The beams used in the compression process had the same geo-metrical dimensions as those used in the bending process; only their length de-creased to 200 mm. A surprising effect of
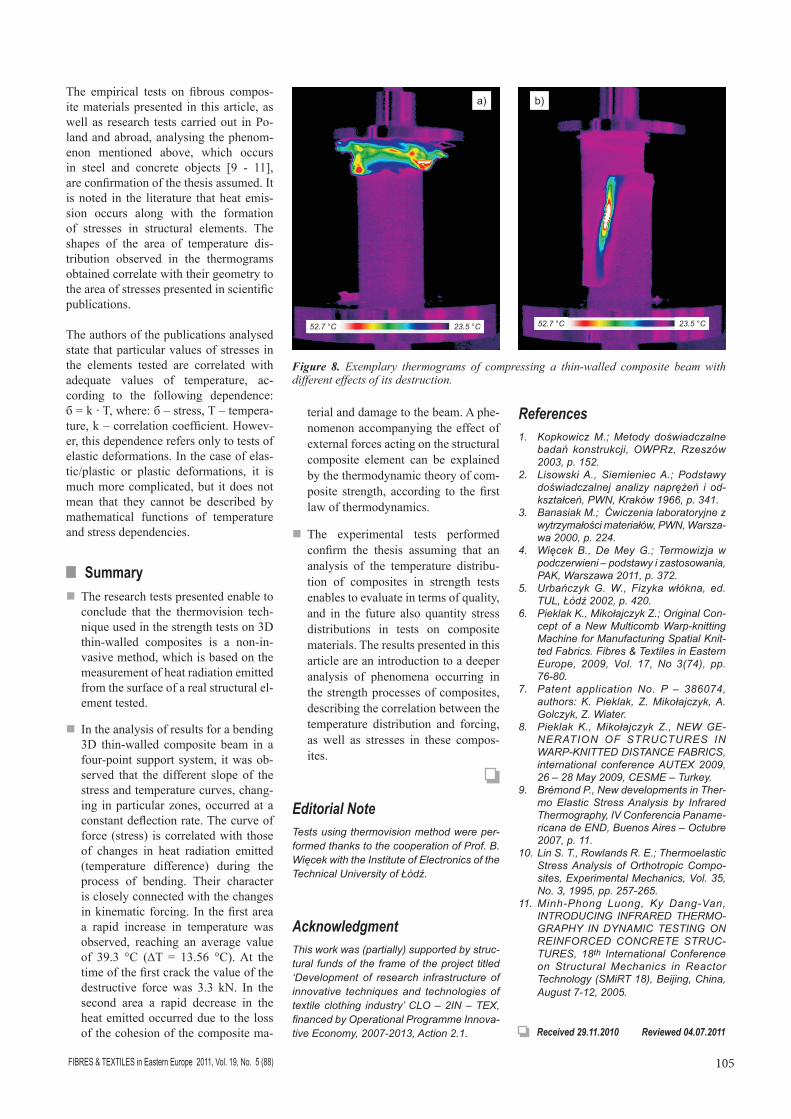
the damage process performed were the different reactions to the pressing force. In the first case (Figure 8.a) damage was observed in the upper part of the beam consecutively with the forcing added. In the case of the beam presented in Fig-ure 8.b, the destruction was of a totally different character: a sort of cutting of the side layers of the test object took place. The maximum increase in tem-perature observed for both samples was around the same value - in the range of 57.7 ÷ 61.7 °C, thus the gain in tempera-ture comparing to the initial value of the temperature of the beam tested was with-in the range of ∆T = 30.99 ÷ 35.28 °C. The character of the different deforma-tion processes of the composite beams could be caused by material defects re-sulting from the unevenness of the com-posite structure, that is the resin as well as textile reinforcement in the walls of the beam.
The research presented confirms the thesis that it is possible to determine in terms of quality, and maybe also in terms of quantity, the distributions of stresses in strength tests of composites using an analysis of areas of differentiated gains in temperature on the basis of the thermovi-sion technique. In the case of the quan-tity evaluation of the stress distribution, an analysis of the heat balance of beam bending should be performed taking into account the law of conversion and con-servation of energy from the point of view of thermodynamics.
52.7 °C 23.5 °C
62.48 °C
28.85 °C Tav = 29.3 °C
Tav = 44.9 °C
Tav = 43.0 °C
Tav = 37.1 °C
Tav = 27.1 °C
Tav = 48.8 °C
Tav = 52.7 °C
Tav = 50.7 °C
52.7 °C 23.5 °C
a) b)
c)
105FIBRES & TEXTILES in Eastern Europe 2011, Vol. 19, No. 5 (88)
The empirical tests on fibrous compos-ite materials presented in this article, as well as research tests carried out in Po-land and abroad, analysing the phenom-enon mentioned above, which occurs in steel and concrete objects [9 - 11], are confirmation of the thesis assumed. It is noted in the literature that heat emis-sion occurs along with the formation of stresses in structural elements. The shapes of the area of temperature dis-tribution observed in the thermograms obtained correlate with their geometry to the area of stresses presented in scientific publications.
The authors of the publications analysed state that particular values of stresses in the elements tested are correlated with adequate values of temperature, ac-cording to the following dependence: б = k · T, where: б – stress, T – tempera-ture, k – correlation coefficient. Howev-er, this dependence refers only to tests of elastic deformations. In the case of elas-tic/plastic or plastic deformations, it is much more complicated, but it does not mean that they cannot be described by mathematical functions of temperature and stress dependencies.
n Summaryn The research tests presented enable to
conclude that the thermovision tech-nique used in the strength tests on 3D thin-walled composites is a non-in-vasive method, which is based on the measurement of heat radiation emitted from the surface of a real structural el-ement tested.
n In the analysis of results for a bending 3D thin-walled composite beam in a four-point support system, it was ob-served that the different slope of the stress and temperature curves, chang-ing in particular zones, occurred at a constant deflection rate. The curve of force (stress) is correlated with those of changes in heat radiation emitted (temperature difference) during the process of bending. Their character is closely connected with the changes in kinematic forcing. In the first area a rapid increase in temperature was observed, reaching an average value of 39.3 °C (∆T = 13.56 °C). At the time of the first crack the value of the destructive force was 3.3 kN. In the second area a rapid decrease in the heat emitted occurred due to the loss of the cohesion of the composite ma-
terial and damage to the beam. A phe-nomenon accompanying the effect of external forces acting on the structural composite element can be explained by the thermodynamic theory of com-posite strength, according to the first law of thermodynamics.
n The experimental tests performed confirm the thesis assuming that an analysis of the temperature distribu-tion of composites in strength tests enables to evaluate in terms of quality, and in the future also quantity stress distributions in tests on composite materials. The results presented in this article are an introduction to a deeper analysis of phenomena occurring in the strength processes of composites, describing the correlation between the temperature distribution and forcing, as well as stresses in these compos-ites.
Editorial NoteTests using thermovision method were per-formed thanks to the cooperation of Prof. B. Więcek with the Institute of Electronics of the Technical University of Łódź.
AcknowledgmentThis work was (partially) supported by struc-tural funds of the frame of the project titled ‘Development of research infrastructure of innovative techniques and technologies of textile clothing industry’ CLO – 2IN – TEX, financed by Operational Programme Innova-tive Economy, 2007-2013, Action 2.1. Received 29.11.2010 Reviewed 04.07.2011
References1. Kopkowicz M.; Metody doświadczalne
badań konstrukcji, OWPRz, Rzeszów 2003, p. 152.
2. Lisowski A., Siemieniec A.; Podstawy doświadczalnej analizy naprężeń i od-kształceń, PWN, Kraków 1966, p. 341.
3. Banasiak M.; Ćwiczenia laboratoryjne z wytrzymałości materiałów, PWN, Warsza-wa 2000, p. 224.
4. Więcek B., De Mey G.; Termowizja w podczerwieni – podstawy i zastosowania, PAK, Warszawa 2011, p. 372.
5. Urbańczyk G. W., Fizyka włókna, ed. TUL, Łódź 2002, p. 420.
6. Pieklak K., Mikołajczyk Z.; Original Con-cept of a New Multicomb Warp-knitting Machine for Manufacturing Spatial Knit-ted Fabrics. Fibres & Textiles in Eastern Europe, 2009, Vol. 17, No 3(74), pp. 76-80.
7. Patent application No. P – 386074, authors: K. Pieklak, Z. Mikołajczyk, A. Golczyk, Z. Wiater.
8. Pieklak K., Mikołajczyk Z., NEW GE-NERATION OF STRUCTURES IN WARP-KNITTED DISTANCE FABRICS, international conference AUTEX 2009, 26 – 28 May 2009, CESME – Turkey.
9. Brémond P., New developments in Ther-mo Elastic Stress Analysis by Infrared Thermography, IV Conferencia Paname-ricana de END, Buenos Aires – Octubre 2007, p. 11.
10. Lin S. T., Rowlands R. E.; Thermoelastic Stress Analysis of Orthotropic Compo-sites, Experimental Mechanics, Vol. 35, No. 3, 1995, pp. 257-265.
11. Minh-Phong Luong, Ky Dang-Van, INTRODUCING INFRARED THERMO-GRAPHY IN DYNAMIC TESTING ON REINFORCED CONCRETE STRUC-TURES, 18th International Conference on Structural Mechanics in Reactor Technology (SMiRT 18), Beijing, China, August 7-12, 2005.
Figure 8. Exemplary thermograms of compressing a thin-walled composite beam with different effects of its destruction.
52.7 °C 23.5 °C 52.7 °C 23.5 °C
a) b)