strength of finnish grown timber · 2015-03-17 · keywords timber, wood, spruce, pine, strength,...
TRANSCRIPT

VTT P
UB
LICA
TION
S 668 Strength of Finnish grow
n timber A
lpo Ranta-Maunus
ESPOO 2007ESPOO 2007ESPOO 2007ESPOO 2007ESPOO 2007 VTT PUBLICATIONS 668
Alpo Ranta-Maunus
Strength of Finnish grown timber
The publication reports strength testing results obtained during past 20years by VTT and project partners. New and such older results arecollected to this publication which are considered to be relevant forrenewal of standards of structural timber. Main results were received infour research projects:
1) strength grading project in 1990's,2) strength grading project 2003–2007 (Combigrade),3) European project on the use of small diameter timber inconstruction in late 1990's and4) European duration of load project in 1990's.
ISBN 978-951-38-7067-6 (soft back ed.) ISBN 978-951-38-7068-3 (URL: http://www.vtt.fi/publications/index.jsp)ISSN 1235-0621 (soft back ed.) ISSN 1455-0849 (URL: http://www.vtt.fi/publications/index.jsp)
Julkaisu on saatavana Publikationen distribueras av This publication is available from
VTT VTT VTTPL 1000 PB 1000 P.O. Box 1000
02044 VTT 02044 VTT FI-02044 VTT, FinlandPuh. 020 722 4520 Tel. 020 722 4520 Phone internat. + 358 20 722 4520
http://www.vtt.fi http://www.vtt.fi http://www.vtt.fi
0
10
20
30
40
10 20 30 40 50
characteristic bending strength [MPa]
CO
V [
%]
density
MOR
MOE


VTT PUBLICATIONS 668
Strength of Finnish grown timber
Alpo Ranta-Maunus

ISBN 978-951-38-7067-6 (soft back ed.) ISSN 1235-0621 (soft back ed.)
ISBN 978-951-38-7068-3 (URL: http://www.vtt.fi/publications/index.jsp) ISSN 1455-0849 (URL: http://www.vtt.fi/publications/index.jsp)
Copyright © VTT Technical Research Centre of Finland 2007
JULKAISIJA � UTGIVARE � PUBLISHER
VTT, Vuorimiehentie 3, PL 1000, 02044 VTT puh. vaihde 020 722 111, faksi 020 722 4374
VTT, Bergsmansvägen 3, PB 1000, 02044 VTT tel. växel 020 722 111, fax 020 722 4374
VTT Technical Research Centre of Finland, Vuorimiehentie 3, P.O.Box 1000, FI-02044 VTT, Finland phone internat. +358 20 722 111, fax + 358 20 722 4374
VTT, Kemistintie 3, PL 1000, 02044 VTT puh. vaihde 020 722 111, faksi 020 722 7006
VTT, Kemistvägen 3, PB 1000, 02044 VTT tel. växel 020 722 111, fax 020 722 7006
VTT Technical Research Centre of Finland, Kemistintie 3, P.O. Box 1000, FI-02044 VTT, Finland phone internat. +358 20 722 111, fax +358 20 722 7006
Technical editing Leena Ukskoski Edita Prima Oy, Helsinki 2008

3
Ranta-Maunus, Alpo. Strength of Finnish grown timber [Suomalaisen puun lujuustutkimusten yhteenveto]. Espoo 2007. VTT Publications 668. 60 p. + app. 3 p.
Keywords timber, wood, spruce, pine, strength, bending, tension, compression, shear, creep,duration of load
Abstract Strength and stiffness of timber have been studied in different projects during 1986�2007. This is a summary report of results which are considered relevant for European and international standardisation. It includes both new unpublished and already published information. The growth area of timber considered in this publication is primarily limited to Finland and parts of North Western Russia.
This experimental research concerns bending, tension, compression and shear strength and stiffness of sawn timber. It includes also tension perpendicular to grain of glulam and compression perpendicular to grain of sawn timber. Also, bending and compression strength of round timber is reported. In addition, long term creep results of glulam and other structural wood products are included in this publication.

4
Ranta-Maunus, Alpo. Strength of Finnish grown timber [Suomalaisen puun lujuustutkimusten yhteenveto]. Espoo 2007. VTT Publications 668. 60 s. + liitt. 3 s.
Avainsanat timber, wood, spruce, pine, strength, bending, tension, compression, shear, creep,duration of load
Tiivistelmä Julkaisu on yhteenveto puun lujuutta koskevista tutkimuksista VTT:ssa 1986�2007. Osa koetuloksista on ennen julkaisemattomia, osa on aikaisemmin julkaistuja. Julkaisu keskittyy sellaisiin tuloksiin, joilla on ilmeistä käyttöä puurakenteiden standardeja ja normeja kehitettäessä.
Tutkimus rajoittuu Suomessa ja lähialueilla kasvaneeseen kuuseen ja mäntyyn. Tuloksia verrataan myös julkaistuihin eurooppalaisiin tutkimustuloksiin. Julkaisu sisältää sahatavaran taivutus-, veto-, puristus ja leikkauslujuustuloksia ja liima-puun lujuustuloksia syysuuntaa vastaan kohtisuoran vetorasituksen alaisena sekä liimapuun virumistuloksia 16 vuotta kestäneen kuormituksen alaisena. Julkaisu sisältää myös pyöreän puun taivutus- ja puristuskoetuloksia.

5
Preface
This report is a summary of experimental research results on strength of timber in different projects. The main reason for writing this report is to make results easily available for European and international standard writers.
This report includes both new and already published data on strength and stiffness of timber grown in Finland or neighbouring area. New data which has not been previously published is obtained in Combigrade-projects during 2006 by VTT and Helsinki University of Technology TKK. These projects were funded by the Finnish Funding Agency for Technology and Innovation Tekes, Wood Focus Ltd, Finnish glulam industry, Finnforest, Stora Enso, UPM and VTT. Several collaboration partners were working in Combigrade project performing parts of strength grading. The main aspect of Combigrade was strength grading which has been reported elsewhere.
6
Contents
Abstract ................................................................................................................. 3
Tiivistelmä ............................................................................................................ 4
Preface .................................................................................................................. 5
1. Introduction..................................................................................................... 8
2. Sawn timber .................................................................................................. 10 2.1 Bending strength and stiffness............................................................. 10
2.1.1 Characteristics of unsorted timber........................................... 10 2.1.2 Modelling of strength.............................................................. 13
2.1.2.1 Modelling by dynamic modulus of elasticity ......... 13 2.1.2.2 Modelling by KAR and density .............................. 15
2.1.3 Results for graded timber ........................................................ 17 2.2 Tension strength and stiffness parallel to grain ................................... 21
2.2.1 Characteristics of unsorted timber........................................... 21 2.2.2 Modelling of strength.............................................................. 22 2.2.3 Results for graded timber ........................................................ 23
2.3 Compression strength parallel to grain................................................ 25 2.4 Compression strength perpendicular to grain ...................................... 27 2.5 Shear strength ...................................................................................... 31
3. Round timber ................................................................................................ 35 3.1 Old results............................................................................................ 35 3.2 Small diameter timber ......................................................................... 36
3.2.1 Characteristics of test material ................................................ 37 3.2.2 Results for visually graded material........................................ 37
4. Glued laminated timber ................................................................................ 41 4.1 Tension strength perpendicular to grain .............................................. 41
4.1.1 Short term test results.............................................................. 43 4.1.2 Long term test results .............................................................. 44 4.1.3 Analysis and discussion .......................................................... 48

7
5. Creep deflection of structural size beams ..................................................... 50 5.1 Creep in heated room........................................................................... 50 5.2 Creep in unheated room and outdoors................................................. 52
6. Summary....................................................................................................... 54
Acknowledgements............................................................................................. 57
References........................................................................................................... 58
Appendix A: Combigrade project material

8
1. Introduction
The background of this research is that there are still issues related to strength of timber which need new information to be satisfactorily resolved. As an example, tension strength of sawn timber is assumed to be 60% of bending strength in European standardisation. A motivation for this research was to demonstrate that the tension strength is higher as indicated by earlier studies. In fact, tension strength of sawn timber used in structures is not a dimensioning property, because the tensile member has to be jointed to other members and connections are usually critical in structural design. Tension strength is, however, of practical importance when using strength graded sawn timber as glulam lamellas. This report includes new test results. All experimental results reported here, if not otherwise indicated, are based on testing in accordance with EN 408 as further specified in EN 384 for determination of characteristic values.
In Europe the main commercial species used in construction is European spruce. However, exporters have problems in Far East where spruce is not traditionally known. This research is expected to show that strength of spruce is on equivalent level with pine, and quite high. Even the ungraded population of Nordic spruce timber meets the requirement of characteristic strength of grade C24.
Shear strength of timber is under discussion in Europe. There are suggestions to lower shear strength because of roof failures taken place in Germany. This is not considered to be the right measure, because failures are resulted by moisture induced stresses which are caused by annual climate variations during the use of building. It is believed that the right approach is to consider moisture effects as load on structure, not as strength reduction, because �strength reduction� approach would lead to zero strength with regard to shear and tension perpendicular to grain, when moisture gradient is strong enough to cause cracking of timber. Shear strength is obviously not a dimensioning property of timber beams. From experiments we know that shear failure of a beam is seldom even if the experiment is planned to produce shear failure mode. The exception is loading of severely pre-cracked beam, or possibly loading of glulam beam which has high tension stresses perpendicular to grain due to moisture variation. In these cases timber beam can fail in shear mode. The other occasion where shear strength is needed is dimensioning of connections. This report includes test results of shear

9
strength of wood material and long term tests of glulam under tension perpendicular to grain stresses caused by combination of mechanical and moisture load.
In structural design the creep deflection under long term loading is calculated. This report has new results on creep of glued laminated timber during 16 years under low load levels comparable to dead load of roofs in Nordic countries.
Timber structures have been traditionally designed to carry mainly compression loads. Design against compression seems less problematic, at least in dimensioning of columns strength is not often critical, when there are other factors which determine the dimensions. However, compression test results are included in the report.

10
2. Sawn timber
2.1 Bending strength and stiffness
2.1.1 Characteristics of unsorted timber
Results of two projects are reported here. Both consist of testing of spruce (Picea abies) and pine (Pinus sylvestris). The former research has been reported in greater detail by Ranta-Maunus et al. [2001]. The aim of sampling was to be representative for spruce timber grown in Finland. The later is Combigrade project and its materials and methods are described in Appendix A and by Hanhijärvi and Ranta-Maunus [2008]. Combigrade project sampling was made for strength grading purposes, and it includes also logs of lower quality than normally used for sawn timber. Diameter of logs was smaller than the average used for sawn timber.
In the former project spruce was sampled from six different locations in Finland as well as from one location in Sweden. Pine was sampled from one location in Finland as well as from one location in Sweden. Both spruce and pine were randomly sampled from ungraded lots of sawn timber. Sample size, dimensions, and mean values of bending strength (edgewise), density and modulus of elasticity (local) are given in Table 1, where years 1986�1997 refer to the former research. VTT has tested Finnish grown timber and Trätek Swedish grown timber. Variation of density, bending strength and modulus of elasticity within major test series is summarised in Table 2. Coefficient of variation (COV) of density of unsorted samples is about 10%, COV of bending strength from 20 to 40% and COV of MOE from 15 to 24%. In general, the variation of properties of spruce is smaller than that of pine.

11
Table 1. Mean values of characteristics in different test series: width, b, depth, h, moisture content, ω, density, ρ, bending strength, f, and modulus of elasticity, E where E is local MOE and ρ is measured from small specimens at test conditions.
Species Series Number b mm
h mm
ω %
ρ kg/m3
f N/mm2
E N/mm2 Data source
Spruce S-1 589 42 146 14.7 448 45.2 13 000 VTT 1995 Spruce S-2 150 72 221 14.6 415 38.1 10 800 VTT 1996 Spruce S-3 149 35 97 14.6 457 46.9 12 800 VTT 1996 Spruce S-4 172 45 172 12.2 435 42.8 11 900 VTT 1997 Spruce S-5 167 35 120 11.4 456 44.3 12 200 VTT 1997 Spruce S-97 122 45 95 11.5 497 39.6 - TRÄTEK 1990 Spruce S-98 80 45 145 11.0 479 42.0 - TRÄTEK 1990 Spruce S-99 79 45 190 10.3 462 34.0 - TRÄTEK 1990 Spruce K0 201 38 100 10.6 437 45.6 11 600 Combigrade Spruce K100 211 50 100 11.1 442 48.2 12 300 Combigrade Spruce K200 214 50 151 11.0 443 46.3 12 400 Combigrade Spruce K300 156 63 201 11.5 434 41.3 12 200 Combigrade Spruce K400 139 44 200 10.8 428 35.6 11 300 Combigrade Pine P-1 188 42 146 13.6 508 48.5 12 800 VTT 1995 Pine P-97 100 45 95 15.0 471 37.9 10 400 TRÄTEK 1986 Pine P-98 99 45 145 15.3 475 38.1 10 100 TRÄTEK 1986 Pine P-99 100 45 190 15.1 477 38.8 10 000 TRÄTEK 1986 Pine M0 205 39 100 11.0 458 41.1 10 900 Combigrade Pine M100 211 50 100 10.6 456 40.6 10 500 Combigrade Pine M200 194 50 151 10.5 461 39.5 11 100 Combigrade Pine M300 183 63 201 11.1 483 39.8 11 700 Combigrade Pine M400 141 44 200 10.5 496 36.8 11 600 Combigrade
Before analysis, all individual bending strength values were adjusted to a reference depth of 150 mm according to EN 384. Furthermore, all individual modulus of elasticity and density values were adjusted to a moisture content of 12% according to EN 384.
In series S-1, the depth of all the 589 specimens was about 146 mm which is close to the reference depth. Hence, the effect of size on bending strength did not affect the results. The mean moisture content of the specimens was 14.7% while

12
the standard deviation was 1.5%. This resulted in a little lower bending strength values than for specimens of 12% moisture content. The bending strength, f, is plotted against the modulus of elasticity, E, in Figure 1. Using linear regression analysis the relationship is given by
Ef 00392.066.2 +−= and R2 = 0.65 (1)
In Figure 1 and in Equation (1) the bending strength as well as the modulus of elasticity obtained from the tests were used without any depth or moisture content adjustments.
Based on Combigrade data, including different dimensions and adjusting bending strength to reference size 150 mm we obtain for spruce
Ef 00401.091.4 +−= and R2 = 0.63 (2)
and for pine
Ef 00448.072,10 +−= and R2 = 0.68 (3)
Modulus of elasticity (N/mm2)
20000150001000050000
Ben
ding
stre
ngth
(N/m
m2)
80
60
40
20
0
Figure 1. The relationship between bending strength and modulus of elasticity for spruce with a depth of 150 mm, series S-1. The linear regression line and the 90% confidence interval are included.

13
Table 2. Variation of density, ρ, bending strength, f, and local modulus of elasticity, E.
ρ f E Series Number Mean
kg/m3 COV
% Mean
N/mm3 COV
% Mean
N/mm3 COV
%
S-1 & S-98 589 448 9.0 45.2 25.2 13000 18.8 S-1 to S-99 1508 451 9.7 43.1 27.1 12400 19.8
K0 201 437 10.0 45.6 22.2 11600 18.5 K100 211 442 9.0 48.2 20.9 12300 15.5 K200 214 443 10.5 46.3 24.8 12400 17.3 K300 156 434 9.2 41.3 24.1 12200 15.9 K400 139 428 9.0 35.6 31.6 11300 19.8
K0 to K400 921 438 9.7 44.1 25.8 12000 17.6 M0 205 458 10.4 41.1 30.8 10900 20.7
M100 211 456 11.2 40.6 34.7 10500 23.4 M200 194 461 10.6 39.5 33.0 11100 20.7 M300 183 483 13.4 39.8 33.3 11700 21.1 M400 141 496 13.3 36.8 38.4 11600 22.6
M0 to M400 934 468 12.2 39.7 33.9 11100 22.1
2.1.2 Modelling of strength
2.1.2.1 Modelling by dynamic modulus of elasticity
Size adjusted bending strength obtained from Combigrade data was first modelled by using dynamic modulus of elasticity as the strength indicator. The size effect was also included in the analysis. The first model fitted to data was
321
0
a
refdyn,
dyna
ref
a
ref
amodeladj,m, E
E*
bb *
hh* e f ⎟
⎟⎠
⎞⎜⎜⎝
⎛⎟⎟⎠
⎞⎜⎜⎝
⎛⎟⎟⎠
⎞⎜⎜⎝
⎛=
(4)
where href = 150 mm, bref = 50 mm, Edyn,ref = 12 500 MPa and Edyn is based on measurement of natural frequency and density. Results obtained in regression analysis for model (4) are given in Table 3.

14
Also a simple linear model was fitted to spruce material (four dimensions excluding 63 x 200) Edyn being the only variable which gave result
373,6E00395,0 f dynadjm, −= R2 = 0.59 (5)
Table 3. Results obtained in regression analysis when using model (4).
Material a0 a1 a2 a3 R2
pine, all 5 dimensions 3.788515365 -0.01843 0.167005 1.440592493 0.70
pine, 4 dimensions 3.789478797 -0.01718 0.1738 1.439485862 0.71
spruce, 4 dimensions 3.752235734 -0.07663 0.263538 1.133972058 0.60
Also a prediction for the lower five percentile fractiles were modelled by the use of sliding 5 percentiles of 50 values. For spruce we obtained, based on the linear model
645.12E00357.0 f dynkm, −= (6)
and based on model (4):
baf += modelkm, f (7)
where coefficients a and b are given in Table 5. Please observe that values given in CIB paper [Hanhijärvi et al. 2007] related to Equations (4) and (6) are those for pine instead of spruce claimed in the paper.

15
2.1.2.2 Modelling by KAR and density
In the second case, adjusted bending strength was modelled by using both knot area ratio KAR and density as strength indicating parameters as follows
4321
0
a
ref
a
ref
a
ref
a
ref
amodeladj,m, dens
dens*KARKAR*
bb *
hh* e f ⎟⎟
⎠
⎞⎜⎜⎝
⎛⎟⎟⎠
⎞⎜⎜⎝
⎛⎟⎟⎠
⎞⎜⎜⎝
⎛⎟⎟⎠
⎞⎜⎜⎝
⎛=
(8)
with values href = 150 mm, bref = 50 mm, KARref = 0,2, densref = 450 kg/m3.
Results of regression analysis are given in Table 4. Also this model was used to predict 5 percentile of bending strength based on sliding 5 percentiles and fitting a linear model to the 5 percentiles. Coefficients obtained for Equation (7) are given in Table 5.
Table 4. Results of regression analysis for modelling bending strength as function of KAR and density as in Equation (8).
a0 a1 a2 a3 a4 R2
pine, 5 dim 3.439723007 -0.24082 0.152993 -0.18717 1.794648 0.63 spruce, 4 dim 3.665306358 -0.21953 0.182431 -0.22605 1.102889 0.48
Table 5. Coefficients a and b for Equation (7) for estimation of 5 percentile values. Results obtained in regression analysis when using strength model (4) or (8).
Material Model (4) Model (8) a b a b
pine, all 5 dimensions 0.8638 - 4.5858 0,7751 -2,8594 pine, 4 dimensions 0.8668 - 4.9896 spruce, 4 dimensions 0.874 - 5.1334 1,0229 -11,538

16
y = 0,8553x + 6,8852R2 = 0,4795
5 percentile:y = 1,0229x - 11,538
R2 = 0,8725
0
10
20
30
40
50
60
70
80
20 30 40 50 60 70 80 90
fm,model
fm,a
dj
Series1Series2
Figure 2. Observed bending strength of spruce vs. modelled (8) based on 4 dimensions. Sliding 5 percentiles (series 2) with a fitted trendline are also shown.
y = 0,8777x + 5,4651R2 = 0,6287
5 percentile:y = 0,7751x - 2,8594
R2 = 0,9075
0
10
20
30
40
50
60
70
80
10 20 30 40 50 60 70 80 90 100
fm,model
fm,a
dj Series1
Series2
Figure 3. Observed bending strength of pine vs. modelled (8) based on 5 dimensions tested. Sliding 5 percentiles (series 2) with a fitted trendline are also shown.

17
In both cases, the regression analysis of spruce timber is based on strength data of four dimensions (excluding 63 x 200) and the regression analysis of pine timber is based on strength data of all five dimensions.
2.1.3 Results for graded timber
In series S-1 to S-99, the depths of specimens were between 95 and 221 mm. The tested bending strength values were adjusted to a reference depth of 150 mm and modulus of elasticity and density values were adjusted to a moisture content of 12% according to EN 384. The mean moisture content of the specimens was 13.3% while the standard deviation was 2.0%. Visual grading was made according to the Nordic grading rules given in INSTA 142 to a grade equivalent to C24. Grading was carried out in laboratory with no time limit. Machine grading was made by use of Raute bending type machine to one grade equivalent to C30, corresponding to settings used in mid 1990�s.
Combigrade material was graded to artificial grades based on Equations (4) and (8). Grades are defined as fmodel > 20 and fmodel > 40. The lower grade includes practically all material, and the higher grade roughly the better half. The density, bending strength and modulus of elasticity of these data sets are summarised in Table 6.
Third kind of grading is made by using threshold values for Edyn, KAR and density, in order to compare the effectiveness of a linear strength model to exclusion of worst specimens while aiming to similar kind of yields. The following grades are defined:
1: G1: Edyn > 7000 MPa, and KAR < 0.4 and density at 12% MC > 400 for pine, and > 360 kg/m3 for spruce.
2: G2: Edyn > 10 000 MPa for pine and > 11 000 for spruce, and KAR < 0.25 and density at 12% MC > 440 for pine, and > 400 kg/m3 for spruce.
3: G3: Edyn > 13 000 MPa, and KAR < 0.25 and density at 12% MC > 440 for pine, and > 400 kg/m3 for spruce.
4: G4: Edyn > 14 000 MPa, and KAR < 0.25 for pine and <0.2 for spruce, and density at 12% MC > 440.

18
Requirements for the lower grades (fmodel > 20 or G1 with threshold limits) are such that the number of rejects is small in Combigrade material. Yield to the lower grades amounts from 88 to 100%. For the better grades (fmodel > 40 or G2 with threshold limits) yield amounts from 34 to 60% being in the same range as in case of test series �S-1 to S-99� where visual grading to C24 gave a yield of 52% and machine grading to C30 gave yield 65%. 5 percentile of strength in all these cases where yield is from 34 to 65% is above 30 MPa (from 31.6 to 33.2). For ungraded timber, as in case fmodel > 20, 5 percentile of bending strength of Combigrade material is 20 MPa for pine and 24 MPa for spruce. The highest grade G4 had a yield 17% for spruce and 19% for pine, and resulted in 5 percentiles of bending strength above 40 MPa.
The relation of yield and characteristic bending strength is illustrated in Figure 5. Different grading methods have similar trends, but methods which include measurement of dynamic modulus of elasticity are more efficient. Figure also shows that spruce gives higher yield to strength grades than pine. At highest grades yields are equal. These yields are based on Combigrade material, other sampling might give different yields.
Figure 4 illustrates variability of density, stiffness and strength in different grades based on numbers given in Table 6. The clear trend is that coefficient of variation decreases when characteristic strength increases. COV of bending strength, modulus and elasticity and density of grade C40 is only half of the COV values for C22.

19
Table 6. Density, ρ, bending strength, f, and local modulus of elasticity, E, for some samples of graded timber.
ρ f E
Test series Grade N (yield %) Mean
kg/m3 COV
% Mean
N/mm2COV
%
5 %-tile
N/mm2
Mean N/
mm2
COV %
S-1 to S-99 C24 visual lab 781 (52) 447 8.8 47.3 21.2 31.6 13 000 18.1 S-1 to S-99 C30 machine 986 (65) 465 8.4 47.8 21.0 31.3 13 400 15.3
K0 to K400 Edyn, fmodel>20 909
(100) 438 9.7 44.1 25.7 24.9 12 000 17.5
K0 to K400 Edyn, fmodel>40 562 (62) 458 7.6 49.5 18.8 32.9 13 200 12.0
K0 to K400 KAR + ρ, fmodel >20
909 (100) 438 9.6 44.1 25.9 24.3 12 000 17.6
K0 to K400 KAR + ρ, fmodel >40
531 (58) 459 7.6 49.5 19.3 33.2 13 100 13.5
M0 to M400 Edyn fmodel >20 910
(100) 470 12.1 40.3 32.8 20.7 11 200 21.3
M0 to M400 Edyn fmodel >40 362 (40) 518 9.7 51.5 20.8 32.7 13 500 12.1
M0 to M400 KAR + ρ, fmodel >20
911 (100) 469 12.3 39.8 33.7 19.8 11 100 22.1
M0 to M400 KAR + ρ, fmodel >40
307 (34) 525 9.7 52.2 21.1 33.1 13 500 13.7
K0 to K400 G1 866 (95) 443 9.3 43.8 24.0 26.5 12 200 16.5 K0 to K400 G2 546 (60) 458 7.6 48.3 18.8 31.8 13 100 12.8
K0 to K400 G3 318 (35) 474 7.0 52.0 16.3 39.2 14 000 10.0
K0 to K400 G4 153 (17) 493 6.1 55.9 14.0 43.2 14 800 8.9
M0 to M400 G1 800 (88) 478 9.8 41.0 31.4 21.6 11 500 20.2 M0 to M400 G2 398 (44) 508 7.8 49.6 21.8 32.9 13 100 14.2
M0 to M400 G4 178 (19) 536 5.8 56.4 16.2 41.1 14 500 8.0

20
0
10
20
30
40
10 20 30 40 50
characteristic bending strength [MPa]
CO
V [%
] densityMORMOE
Figure 4. Coefficient of variation of density, modulus of elasticity and bending strength as function of characteristic bending strength of sample.
Strength vs. yield
0
10
20
30
40
50
0 20 40 60 80 100
yield [%]
fm,k
Figure 5. Characteristic bending strength vs. yield received by using different grading methods (Table 6). Open triangles are for pine, filled diamonds for spruce.

21
2.2 Tension strength and stiffness parallel to grain
2.2.1 Characteristics of unsorted timber
Tension strength of spruce was tested as collaboration of TKK and VTT as part of Combigrade project. Tests were made in accordance with EN408 except that free length of tension specimen was in all cases 2 m. Tested material is characterised in Tables 7 and 8.
Table 7. Sawn timber used in tension tests. Mean values of thickness, b, width, h, moisture content, ω, density, ρ, tension strength, f, and modulus of elasticity, E, are given for each series.
Species Series Number b mm
h mm
ω %
ρ kg/m3
f N/mm2
E N/mm2 Data source
Spruce K0 115 38 99 12.3 434 34.6 11 900 Combigrade Spruce K100 113 50 99 12.7 446 35.1 12 000 Combigrade Spruce K200 115 50 150 12.5 441 34.7 12 000 Combigrade Spruce K400 114 44 200 12.3 423 29.8 11 200 Combigrade
Table 8. Variation of density, ρ, tension strength, f, and modulus of elasticity, E.
ρ f E Series Number Mean
kg/m3 COV
% Mean
N/mm2 COV
% Mean
N/mm2 COV
%
K0 115 434 10.8 34.6 30.7 11 900 16.3 K100 113 446 10.2 35.1 26.0 12 000 15.8 K200 115 441 9.6 34.7 27.7 12 000 16.0 K400 114 423 9.6 29.8 37.4 11 200 20.3
K0 to K400 457 436 10.2 33.5 30.9 11 800 17.7

22
2.2.2 Modelling of strength
Equations (4) and (8) were used to model also tension strength, which was size adjusted to reference width 150 mm according to EN384:
f150
hf t
0,2
adjt, ⎟⎠⎞
⎜⎝⎛=
(9)
No adjustment was made to reference length even if the actual free length in tests was 2 m, which is more than nine times the width of specimen specified by EN 408. KAR measurements are made before loading and density of full boards is used as variable in Equation (8). Numerical results are shown in Table 9.
Table 9. Parameters for Equations (4), (8) and (7) obtained for modelling of tension strength of spruce.
Equation a0 a1 a2 a3 a4 a b (4)/(7) 3.46529 0.054676 -0.00531 1.449265 0.8079 -2.63
(8)/(7) 3.41037 -0.1124 0.057898 -0.36526 1.357855 0.827 -3.87
y = 0,9959x + 0,7716R2 = 0,5759
Series 2 = 5 percentile:y = 0,8079x - 2,6291
R2 = 0,8677
0
10
20
30
40
50
60
70
0 10 20 30 40 50 60 70
ft,model
ft,ad
j Series1
Series2
Linear (Series1)
Linear (Series2)
Figure 6. Tension strength vs. modelled strength of spruce based on dynamic modulus of elasticity. Sliding 5 percentiles (series 2) with a fitted trendline are also shown. See Equations (4) and (7) and Table 9.
23
Series 2 = 5 percentile:y = 0,827x - 3,8739
R2 = 0,8712
y = 0,8344x + 6,0491R2 = 0,4567
0
10
20
30
40
50
60
70
10 20 30 40 50 60
ft,model
f t,ad
j
Series1Series2
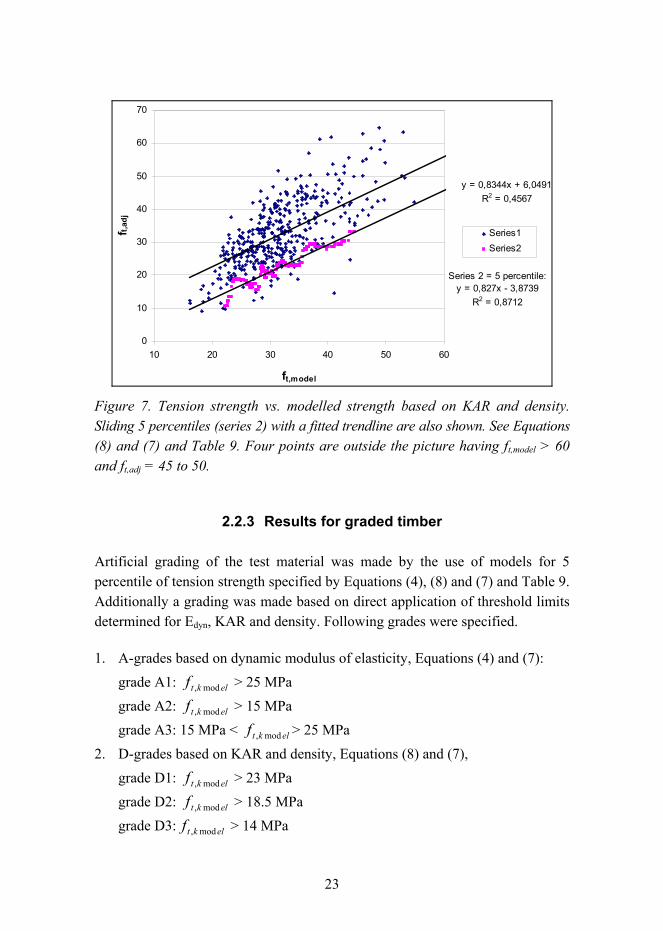
Figure 7. Tension strength vs. modelled strength based on KAR and density. Sliding 5 percentiles (series 2) with a fitted trendline are also shown. See Equations (8) and (7) and Table 9. Four points are outside the picture having ft,model > 60 and ft,adj = 45 to 50.
2.2.3 Results for graded timber
Artificial grading of the test material was made by the use of models for 5 percentile of tension strength specified by Equations (4), (8) and (7) and Table 9. Additionally a grading was made based on direct application of threshold limits determined for Edyn, KAR and density. Following grades were specified.
1. A-grades based on dynamic modulus of elasticity, Equations (4) and (7): grade A1: elktf mod, > 25 MPa grade A2: elktf mod, > 15 MPa grade A3: 15 MPa < elktf mod, > 25 MPa
2. D-grades based on KAR and density, Equations (8) and (7), grade D1: elktf mod, > 23 MPa grade D2: elktf mod, > 18.5 MPa grade D3: elktf mod, > 14 MPa

24
3. X-grade based on exclusion of material with low density or Edyn or with high KAR grade X: Edyn >13 000 MPa & KAR < 0.25 & ρ12 > 430 kg/m3.
Characteristics of timber belonging to these grades are shown in Table 10. Results show that grading based on Edyn is slightly more effective in terms of tension strength and yield than grading based on KAR and density. Grade X determined by threshold limits is as good and economic as grade A1 based on Edyn. Relation of yield and characteristic bending strength is illustrated in Figure 8.
Table 10. Density, ρ, tension strength, f, and modulus of elasticity, E, for some samples of graded timber. 5 percentile value is based on nonparametric method. Material includes series K0, K100, K200 and K400 with total N = 457.
ρ f E Test series Grade Yield
% Sample
size Meankg/m3
COV%
MeanN/mm2
COV%
5 %-tile N/mm2
Mean N/mm2
COV%
K0 to K400 A1 36 166 472 7.2 41.6 21.6 27.2 14 000 10.2 K0 to K400 A2 92 420 440 9.5 34.6 28.3 19.9 12 400 15.6 K0 to K400 A3 56 254 420 7.8 30.0 24.4 18.4 11 300 12.7 K0 to K400 D1 34 154 467 8.2 41.4 23.3 25.7 13 600 12.8 K0 to K400 D2 65 296 453 8.4 36.9 26.9 22.1 12 900 14.0 K0 to K400 D3 86 392 440 9.7 34.3 29.5 19.0 12 300 16.2 K0 to K400 X 33 136 478 6.6 41.2 20.7 28.2 14 000 10.4
15
20
25
30
0 20 40 60 80 100
Yield [%]
Stre
ngth
[MP
a]
Figure 8. Characteristic tension vs. yield based on Table 10. Squares refer to grades D, triangle to grade X and two diamonds to grades A1 and A2.

25
2.3 Compression strength parallel to grain
Compression tests were made by TKK. Three dimensions of spruce of Combigrade sampling were tested in compression parallel to grain. Length of test specimen was six times smaller dimension, about 300 mm. Original report of the tests is published by Poussa et al. [2007a and b].
Statistical summary of the results is given in Table 11. In total 403 specimens were tested. Compression strength shows fairly good correlation to density (R2 = 0.5...0.6), see Figure 9. 282 specimens were visually strength graded according to the Nordic INSTA rules, and most specimens qualified to grade T3 (C30). Reason for high quality is that bending specimens had first been taken from the same planks with intention to include the weakest material in bending specimen, and compression specimen is taken from the remaining part. Results for visually graded material are shown in Table 12. Characteristic values are 30% higher than those given in EN338 for an equivalent grade. Coefficient of variation of compression strength of ungraded material was about 15%.
Table 11. Summary of results in compression parallel to grain.
Test 50 x 1002 ex log
50 x 150 2 ex log
44 x 200 4 ex log All
N 120 144 139 403 minimum (MPa) fc,0,min 24.3 23.9 21.1 21.1 mean (MPa) fmean 36.5 38.0 36.2 36.9 maximum(MPa) fc,0,max 47.2 53.5 51.0 53.5 coeff. of variation 0.14 0.15 0.16 0.15 5 percentile (MPa) fc,0,k 27.9 29.2 26.3 27.9 density (kg/m3) ρmean 445.4 438.2 426.1 436.1 coeff. of variation 0.10 0.10 0.10 0.10 mean moisture content (%) MC 12.3 12.5 12.4 12.4

26
COMP 0°50x150 mm2
R2 = 0.5647
0
10
20
30
40
50
60
200 300 400 500 600 700
density [kg/m3]
f max
[MPa
]
COMP 0°44x200 mm2
R2 = 0.5253
0
10
20
30
40
50
60
200 300 400 500 600 700
density [kg/m3]
f max
[MPa
]
Figure 9. Compression strength of spruce parallel to grain vs. density. Dimensions 50 x 150 and 44 x 200.
Table 12. Compression strength of visually INSTA T-graded spruce compared to EN338 strength values. Characteristic values are calculated also with EN14358-method. For comparison, also values are given for two grades for which 1) modelled compression strength (10) is between 30 and 40 MPa, and 2) above 40 MPa.
T1/C18 T2/C24 T3/C30 Modelled 1 Modelled 2 N 13 58 211 192 67 average [MPa] 30.2 34.0 38.6 36,1 43,1 standard dev. [MPa] 4.2 4.7 5.1 4,0 4,4 fc,0,k nonparametric 24.2 26.2 29.8 29.4 36.5 fc,0,k acc. to EN14358 22.5 26.4 29.4 fc,0,k in EN338 18 21 23
Compression strength was modelled as function of density and KAR by using the same type of equation as Glos [Ehlbeck et al. 1985]. We obtained
KARfc ⋅−⋅+= 62042,0002222.0701029.2ln ρ (10)
where fc is compression strength in MPa, ρ density in kg/m3, and KAR total knot area ratio. Observed compression strength vs. modelled strength is shown in Figure 10 and shows r2 = 0.64. Same picture shows also prediction of characteristic value based on sliding 5 percentiles.

27
Equation (10) was used also to grade test material to grades as follows:
grade 1: modelled compression strength is between 30 and 40 MPa. grade 2: modelled compression strength is larger than 40 MPa.
This grading resulted in 14 rejects, 192 specimens in grade 1 and 67 specimens in grade 2. Strength values of these grades are included in Table 12.
y = 0,9665x + 1,3866R2 = 0,6412
5 percentile:y = 1,0044x - 4,3827
R2 = 0,9167
20
25
30
35
40
45
50
55
60
20 30 40 50 60fc,model
f c
f
5 percentile
Linear (f)
Linear (5percentile)
Figure 10. Modelling of compression strength by Equation (10) and sliding 5 percentile values.
2.4 Compression strength perpendicular to grain
Compression tests perpendicular to grain were made according to EN408 and ASTM D143-standards. Additional beam-tests were also made and setups are shown in Figure 11. Tested specimens are listed in Tables 13 and 14. Obtained results are shown in Table 15. Tests were made by TKK and original report is published by Poussa et al. [2007a].

28
Figure 11. Perpendicular to grain tests. From left to right: EN408, ASTM D 143, beam end, and continuous beam.
Table 13. Perpendicular to grain standard tests.
Test Species Pcs. Specimen
a x b x length [mm]
Standard Loading program
Gauge length [mm]
COMPRESSION 90 DEG, Small size
Spruce 200 45 x 90 x 70 EN408 Deformation controlled. 300 ± 120 s
90
COMPRESSION 90 DEG, Small size
Spruce 200 45 x 50 x 150 ASTM D143
Deformation controlled.
max. 2,5 mm 50
Table 14. Perpendicular to grain tests for spruce beams.
Test Pcs. Specimen,
a x b x length [mm]
Standard Loading program
Free distance to beam-end [mm]
Gauge length [mm]
CONTINUOUS BEAM COMPRESSION 90 DEG,
27 45 x 90 x 400 applied EN408
Deformation controlled. 300 ± 120 s
165 90
BEAM END COMPRESSION 90 DEG, Small size
27 45 x 90 x 400 applied EN408
Deformation controlled. 300 ± 120 s
330 90

29
Table 15. Summary of results in compression perpendicular to grain.
Test ASTM D143 EN408 BEAM-
END CONTIN.
BEAM
N 200 200 27 27
minimum (MPa) 4.8 1.9 2.8 3.7
mean (MPa) 7.0 2.8 3.9 4.7
maximum(MPa) 10.5 4.1 5.0 5.7
characteristic value (MPa) by ranking 5.2 2.2 - -
characteristic value (MPa) by use of prEN14358 5.3 2.2 2.9 3.7
stand. deviation 1.1 0.4 0.5 0.6
coeff. of variation 0.16 0.14 0.14 0.12
av. density (kg/m3) 441.3 443.0 439.4 434.4
coeff. of variation of density 0.09 0.09 0.10 0.11
av. deformation (mm) 2.5 2.3 2.5 2.4
ASTM standard gave mean strength value 7 MPa, that is 2.5 times larger than the value 2.8 MPa given by EN-standard. Ratio of characteristic values is nearly as big. An obvious reason for higher values in ASTM-test is that surface of test specimen is loaded partially, 50 mm of total length of 150 mm. Test material used has mean density meeting requirement of C24. Characteristic value 2.2 MPa is lower than 2.5 MPa given in EN338 for C24.
Relation of compression strengths determined according to EN408 and ASTM D143 was studied. Specimens are knotless and taken from the same piece next to each other. Correlation analysis between EN and ASTM results gave coefficient of determination r2 = 0.49. Figure 12 shows correlation between density and perpendicular to grain compression strength measured according to both standards. Coefficient of determination is higher for ASTM-results (0.43) than for EN-results (0.29).

30
EN COMP 90°50x100 mm2
R2 = 0.2852
0.0
0.5
1.0
1.5
2.0
2.5
3.0
3.5
4.0
4.5
200 300 400 500 600 700
density [kg/m3]
f max
[MPa
]
ASTM COMP 90°50x100 mm2 R2 = 0.4271
0
2
4
6
8
10
12
200 300 400 500 600 700
density [kg/m3]
f max
[MPa
]
Figure 12. Compression strength perpendicular to grain vs. density for spruce. Upper figure: test in accordance with EM408, lower: ASTM D 143.
In EN408 compression perpendicular to grain strength value is determined using small specimen, which are loaded on the total area. In an actual structural situation, the compressed beam has more load bearing capacity because the adjacent part of beam is not loaded and supports the loaded part. Therefore when designing structures the compression capacity of the beam can be increased. In the old Eurocode pre-standard ENV1995-1-1 factor 90,ck is used. The present version EN1995-1-1:2004 and suggested prEN1995-1-1:A1 use effective area
efA which is larger than the actual area.
The ratio of strength capacity of the tested beams to compression strength determined by the standard test EN408 was calculated by using the mean values, because amount of beams tested was only 27 pieces.
Comparison of the obtained ratios when comparing factors of different Eurocode 5 versions with test results is presented in Table 16.

31
Table 16. Comparison of Aef/A-ratios obtained from test results and different versions of Eurocode.
TEST SETUPS
Test results
408.
.
ENmean
beammean
ff
prEN1995-1-1:A1new proposal
AAef
EN1995-1-1:2004
AAef
ENV1995-1-1
90,ck
MPaMPa
8,27,4
= 1.68 1.85 1.43 1.47
MPaMPa
8,29,3
= 1.40 1.43 1.21 1.0
According to the comparison of ratios presented in Table 16 it is concluded that our results support the suggested changes in prEN1995-1-1:A1. In case of continuous beam, the suggested design capacity of the beam is, however, ten percent higher than our test result. (1.85/1.68 = 1.10).
2.5 Shear strength
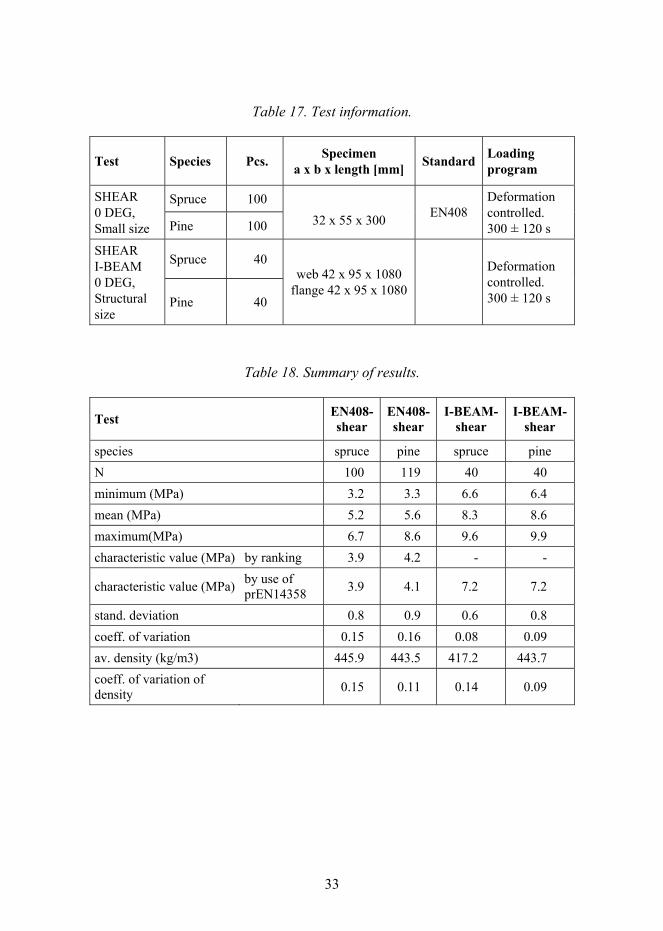
Shear tests were made by TKK, and test report is published by Poussa et al. [2007a and b]. Both spruce and pine of Combigrade project were used in tests which were made according to EN408-standard and also by the use of I-beam. Test setups are shown in Figures 13 and 14. Tested specimens are characterised in Table 17. Obtained results are shown in Table 18. We obtained 3.9 MPa for characteristic value of shear strength of spruce in standard test, and 4.2 MPa for pine. Value for spruce is very well in line with earlier result of Glos and Denzler [2003], 3.8 MPa. I-beams gave at least 60% higher shear strength for both spruce and pine. Figure 15 shows that parallel to grain shear strength has no correlation with density. Similar result was obtained for I-beam tests.

32
Although the test setup was optimized for occurrence of shear failure, 10 percent of spruce and 30 percent of pine beam failures were still bending failures. Bending failures occurred because, avoiding knots at lower flange high-moment area was not realized.
In many cases shear failure took place along the annual rings in web or in flange.
Figure 13. EN408 shear strength parallel to grain test.
Figure 14. I-beam test for shear strength parallel to grain of web. 4-point bending.
33
Table 17. Test information.
Test Species Pcs. Specimen a x b x length [mm] Standard Loading
program
Spruce 100 SHEAR 0 DEG, Small size Pine 100
32 x 55 x 300 EN408
Deformation controlled. 300 ± 120 s
Spruce 40 SHEAR I-BEAM 0 DEG, Structural size
Pine 40
web 42 x 95 x 1080 flange 42 x 95 x 1080
Deformation controlled. 300 ± 120 s
Table 18. Summary of results.
Test EN408-shear
EN408-shear
I-BEAM-shear
I-BEAM-shear
species spruce pine spruce pine N 100 119 40 40 minimum (MPa) 3.2 3.3 6.6 6.4 mean (MPa) 5.2 5.6 8.3 8.6 maximum(MPa) 6.7 8.6 9.6 9.9 characteristic value (MPa) by ranking 3.9 4.2 - -
characteristic value (MPa) by use of prEN14358 3.9 4.1 7.2 7.2
stand. deviation 0.8 0.9 0.6 0.8 coeff. of variation 0.15 0.16 0.08 0.09 av. density (kg/m3) 445.9 443.5 417.2 443.7 coeff. of variation of density 0.15 0.11 0.14 0.09

34
EN408 SHEARSPRUCE 100 PCS
R2 = 0.0224
0
1
2
3
4
5
6
7
8
200 300 400 500 600 700
density [kg/m3]
f max
[MPa
]
EN408 SHEARPINE 119 PCS
R2 = 0.0775
0
1
2
3
4
5
6
7
8
9
10
200 300 400 500 600 700
density [kg/m3]
f max
[MPa
]
Figure 15. Shear strength vs. density for spruce (left) and pine (right).

35
3. Round timber
3.1 Old results
It is known that bending strength of round timber is fairly high. Some results of an old, unpublished Finnish research are shown in Figures 16 and 17 indicating a clear dependence on knot size. In Finnish building code, a characteristic bending strength of 30 MPa has traditionally been used for pine and spruce round timber, when no other information is available. According to Figures 16 and 17 this seems appropriate, when maximum knot diameter is not larger than 40 mm, or KAR (ratio of the sum of knot diameters to the circumference of the log) is less than 0.2. These results are based on testing of round pine timber which has diameter of about 250 mm.
Roundwood 9"-11"
0
10
20
30
40
50
60
70
0 20 40 60 80 100 120 140
max knot [mm]
fm
[N/mm²]
Figure 16. Bending strength of seasoned pine logs tested in 1950s vs. knot size.

36
Roundwood 9"-11"
0
10
20
30
40
50
60
70
0,00 0,05 0,10 0,15 0,20 0,25 0,30 0,35 0,40
KAR
fm
[N/mm²]
Figure 17. Bending strength of seasoned pine logs tested in 1950s vs. KAR.
3.2 Small diameter timber
A large European project (FAIR CT 95-0091) was conducted on the use of small diameter round timber in construction. Final report of project includes not only strength of material but also aspects related to economy of harvesting in thinnings, drying, oil impregnation, development of feasible structures and connections [Ranta-Maunus 1999]. This publication repeats the main conclusions concerning strength values. Much more details can be found in the final report and in several published detailed reports such as a CIB W18 paper [Ranta-Maunus et al. 1998].
Small diameter (80 to 150 mm) round wood could have lower strength than mature logs, because it is, to a large extent, juvenile wood. On the other hand, the small size suggests that small diameter wood could have higher strength than large diameter timber. Next chapter describes results obtained for small diameter round timber.

37
3.2.1 Characteristics of test material
Small-diameter round timber studied here consists of spruce (Picea abies and Picea sitchensis) and pine (Pinus sylvestris). Spruce was sampled from two locations in Finland, two locations in Austria and one location in the United Kingdom. Pine was sampled from four locations in Finland and one location in the United Kingdom.
Bending and compression parallel to the grain tests were carried out following, as closely as possible, the test method given in EN 408. In addition to bending strength and modulus of elasticity (true), the density and moisture content were determined.
Before analysis, all individual density values were adjusted to a moisture content of 12% according to EN 384. No other adjustments were carried out.
A summary of the results is given in Table 19. The mean diameter of the specimens was 123 mm. The mean moisture content of the specimens was 16.1%. This results in lower strength and modulus of elasticity values than those of specimens of 12% moisture content.
Table 19. Density, ρ, bending strength, f, and modulus of elasticity, E, of unsorted small-diameter round timber sampling.
ρ f E Property Number Mean
kg/m3 COV
% Mean
N/mm2COV
% Mean
N/mm2 COV
%
Bending 660 467 12.7 56.2 21.3 12 300 26.4 Compression 575 469 13.2 26.9 23.3 10 700 28.3
3.2.2 Results for visually graded material
Based on the statistical analysis of strength data performed by the different project participants, a selection of visual strength-grading parameters was made: maximum knot-size per diameter, knot sum per diameter and maximum growth ring width, and limits for these parameters were set. A synopsis of the grading criteria based on this research is given in Table 20.

38
Table 20. Definition of visual grades for round Scots pine and Norway spruce.
Strength-grading criteria Grade A Grade B
Knot sum per diameter ks/d [%] 75 100 Max. knot per diameter mk/d [%] 25 30
Ring width r [mm] 3 5
The grading criteria specified above were applied to the tested samples of Scots pine and Norway spruce from Finland. Norway spruce had an initial sample size 200, of which 143 bending specimens and 149 compression specimens fulfilled the limits of grade A. The unsorted material met strength class C30 requirements except for density, which met C18. Obviously, density is the critical factor which determines the strength class. This material was divided into 3 samples according to the moisture content of specimens. In Table 15 the results are summarized: number of specimens meeting grading criteria, and mechanical characteristics of the sample. Because so many spruce specimens passed grade A limit, sorting was not carried out for grade B.
UK Scots pine material had 100 specimens in bending and compression. Finnish Scots pine material had 150 machine-debarked specimens in bending and compression. The unsorted material suggested that C30 is possible but compression strength is difficult to achieve. Of this material, 70 UK and 52 Finnish bending specimens, and 73 UK and 47 Finnish compression specimens passed the limits of grade A, and 127 Finnish bending specimens and 119 compression specimens passed the limits of grade B given in Table 20, when grade B includes also the high quality specimens which are qualified to grade A.
The 5-percentile values of the samples are determined by the following methods:
• For strength properties fc, 0 and fm a non-parametric method is used, i.e. it is a test value for which 5 % of the values are lower. If this was not an actual test value, then interpolation between two adjacent values was permitted.
• For ρ it was calculated from a normal distribution: ρ05 = (Mean ρ12 - 1.65*s), where s is standard deviation for the sample.

39
Table 21. 5-percentile values of graded round-pole samples in bending, adjusted to 12% MC in accordance with EN 384 except for size adjustment.
Grade Sample Mean d [mm]
Mean MC [%]
Sample size
ρ05
[kg/m3]
fm,05 [N/mm2]by rank
Em,mean [kN/mm2]
A FIN spruce 1 100 13.5 47 394 45.0 12.9
A FIN spruce 2 117 14.6 48 368 52.5 12.8
A FIN spruce 3 115 19.2 47 411 46.2 14.1
A FIN pine 117 14.7 52 433 38.3 12.5
A UK pine 127 19.1 70 466 41.9 15.4
B FIN pine 126 15.2 127 416 35.2 11.8
Table 22. 5-percentile values of graded round-pole compression samples, adjusted to 12% MC in accordance with EN 384 except for size adjustment.
Grade Sample Mean d [mm]
Mean MC [%]
Sample size
ρ05
[kg/m3]
fc,05 [N/mm2] by rank
A FIN spruce 1 100 13.8 49 381 28.2
A FIN spruce 2 100 14.6 50 389 29.6
A FIN spruce 3 108 18.7 50 362 25.1
A FIN pine 124 11.1 47 434 28.6
A UK pine 126 17.4 73 462 26.8
B FIN pine 123 13.8 119 404 21.7
The equivalence between the visual grades and strength classes is considered on the basis of the results summarized in Tables 21 and 22. A timber population may be assigned to a strength class, when characteristic values of Em, fm and ρ at 12% moisture content are greater or equal to the limits given in EN338. Compression strength is also considered as a strength classification criterion, in addition to the requirements of CEN 384. As a result, it is concluded that grade A Scots pine and Norway spruce meet the requirements of C30 and grade B Scots pine C18 (Table 23).

40
The characteristic value of strength for a population in a grade, fk, is calculated in accordance with EN 384 to be:
f f k kk s v= 05 (11)
where f05 is the weighted mean of the sample's fifth percentile values, ks is a factor relative to the number of samples and their size, and kv = 1 for visual grading.
The characteristic value of ρ is calculated as the mean of the sample's fifth percentile values weighted by sample sizes, and the mean value of E is the mean of the sample's mean values weighted by sample sizes, without consideration of Equation (11).
Comparison of bending strength of 250 mm diameter poles in Figures 16 and 17 and results for small diameter poles suggests that grade A defined based on small diameter timber data could be applied also for larger size poles, and strength class C30 can be applied for different size round timber.
Table 23. Characteristic values obtained for graded populations and suggested strength classes.
Species country Grade ks
fm,k [N/mm2]
fc,k [N/mm2]
Em,mean [kN/mm2]
ρk [kg/m3]
Strength class
Norway spruce (FIN) A 0.91 43.6 25.1 13.3 384 C30
Scots pine (FIN, UK) A 0.84 33.9 23.1 14.0 450 C30
Scots pine (FIN) B 0.86 30.2 18.7 11.8 411 C18

41
4. Glued laminated timber
4.1 Tension strength perpendicular to grain
Two different projects have been executed to determine the duration of load effect on tension strength perpendicular to grain in different sized curved beams exposed to cyclically varying humidity. The earlier project (VTT) was carried out 1991�1993 and was reported by Ranta-Maunus and Gowda [1994]. The later, more comprehensive project (AIR) was completed in 1997 and was reported by Gowda et al. [1998]. As part of the AIR-project, tensile tests with specimen volumes of 0.01 and 0.03 m3 were made by FMPA in Germany [Aicher et al. 1998]. The curved beam test series are summarised in Table 24. Loading configuration is illustrated in Figure 18. The distance between loads, l, is given in Table 24 as a characteristic dimension with regard to the length effect. The radius of curvature of the centre line of beam was at VTT tests about 3 m and at AIR tests 5.7 m.
Table 24. Dimensions of curved glulam test specimens.
Test series Specimen dimensions (mm) l (mm) Loading type Conditions
VTT S1+S3 90 x 400 x 4300 1000 short term + step wise long term
cyclic RH 40 <-> 85%
VTT S2 90 x 400 x 4300 1000 step wise long term
cyclic RH painted
AIR S1 90 x 600 x 5400 2000 short term 65% RH
AIR S2 90 x 600 x 5400 2000 step wise long term
cyclic RH 55 <-> 90%
AIR S3 90 x 600 x 7400 4000 short term 65% RH
AIR S4 90 x 600 x 7400 4000 step wise long term 85% RH
AIR S5a 140 x 600 x 7400 4000 short term 65% RH AIR S5b 140 x 600 x 7400 4000 short term 85% RH
AIR S6 140 x 600 x 7400 4000 step wise long term
cyclic RH 55 <-> 90%
AIR S8 140 x 600 x 7400 4000 step wise long term 85% RH

42
Spruce material used in tensile experiments was the same as in curved beams (AIR). One difference in long term experiments was that the tensile specimens were conditioned at 65% RH before experiments whereas curved beams were conditioned at the average humidity of anticipated cyclic conditions. As a result, the first wetting cycles were more severe in tension tests than in curved beam tests. In tensile experiments and in earlier VTT tests, the long term load was applied by hanging loads (lever arms) whereas in the later tests (AIR) on curved beams the load was applied by a spring system.
All experiments were carried out under a stepwise increasing load, one step lasting 28 days. It was assumed that this kind of medium term load duration is most relevant for timber structures. For roof structures, the snow load is dimensioning in northern countries. Even if the cumulative action of snow load has much longer duration, the design loads are based on maximum snow load over 50 years, and 4 weeks is a reasonable estimate for the time the load exceeds 90% of the design value. Each test series had 6 or 8 specimens.
The results of the experiments carried out at VTT and FMPA are summarised in Table 26 and discussed by Aicher et al. [1998] and Ranta-Maunus [1998, 2001].
Figure 18. Short term reference tension test of FMPA (left) and bending test of VTT (right).

43
4.1.1 Short term test results
Short term experiments of curved beams have been originally reported by Gowda and Ranta-Maunus [1993 and 1996]. A compilation of both short and long term test results is given in Table 26.
The strength results indicate no clear dependence on moisture content, in fact the values at higher moisture content are somewhat higher than the ones with lower moisture content. However, the results in test series 5a and 5b with different moisture contents have been combined. The cumulative distributions of short term strength are illustrated in Figure 19. The Normal, lognormal and Weibull distributions are fitted to the results of AIR-programme and estimated characteristic values are given in the Table 25.
The obtained lower 5% fractile of tension strength perpendicular to grain was in VTT test series 0.95 N/mm2 based on 18 curved beams, and in AIR test series from 0.46 to 0.72 N/mm2 depending on the size of beam.
Table 25. Five and fifty percent fractile values obtained for tensile strength perpendicular to grain (N/mm2) by fitting 2-parameter Weibull, normal and lognormal distributions to the curved beams results.
Fractile Test series S1 Test series S3 Test series S5
Normal Log-
normal Weibull Normal
Log-normal
Weibull NormalLog-
normal Weibull
50 % 0.838 0.835 0.848 0.719 0.717 0.706 0.600 0.595 0.611
5 % 0.731 0.736 0.716 0.632 0.635 0.596 0.472 0.481 0.464

44
00 .10 .20 .30 .40 .50 .60 .70 .80 .9
1
0 .3 0 .4 0 .5 0 .6 0 .7 0 .8 0 .9 1
M ax . tensile stress a t fa ilu re [M P a]
Cum
. pro
babi
lity
S1S3S5a + b
Figure 19. Cumulative distributions of all short term strength values with curved glulam: observations and Weibull fitting.
4.1.2 Long term test results
Long-term loading test results are given as ratio of load at failure to estimated ramp load value, based on ranking method. Method is illustrated by Figure 20 which shows cumulative distributions of load duration tests (points) and reference short term strength distribution (curve). Duration of load factor is calculated as ratio of observed maximum stress at long term test to reference value at same cumulative probability level. Furthermore, the effect of load duration is separated from effect of moisture variation. The effect of moisture variation is considered to be primarily a short term effect caused by increased loading in form of moisture induced stresses perpendicular to grain. Two calculated stress distributions through thickness are shown in Figure 21. Most failures were observed when the moisture cycling caused high tensile stresses in the internal part of beam.
Numerical values of duration of load effect, kDOL, were observed as follows:
− at constant humidity tests, values were in range kDOL = 0.70 to 0.77, when time to failure was 2 to 4 weeks at that load level
− at cyclic humidity test kDOL = 0.76 was achieved when the beams were surface coated with alkyd paint

45
− at cyclic humidity tests the values ranged kDOL = 0.45 to 0.66 when beams were not surface treated
− at natural sheltered environment in Stuttgart the value kDOL = 0.65 was received whereas similar tension specimens gave 0.50 in cyclic test and 0.75 at constant humidity.
In all cases the lowest kDOL-value was obtained with the thinner tension specimen and largest value with beam specimens.
0
0.1
0.2
0.3
0.4
0.5
0.6
0.7
0.8
0.9
1
0.2 0.3 0.4 0.5 0.6 0.7 0.8 0.9 1
Max. tensile stress at failure [MPa]
Cum
. pro
babi
lity
S5S6 long termS8 long termS8 short term
Figure 20. Cumulative plot of long term strength results (points) with short term strength reference curve (S5 is reference curve for S6 with cyclic humidity and S8 with constant humidity). S8 short term refers to residual strength after long term loading.

46
-0.5
0
0.5
1
1.5
2
2.5
0 10 20 30 40
Dis tance from s ur face [m m ]
Stre
ss [M
pa]
126 d (dry)
140 d (wet)
Figure 21. Calculated stress distribution for half thickness of beam in test series AIR-S2 after dry period (126 d) and wet period (140 d).

Tabl
e 26
. Com
pila
tion
of m
ajor
ram
p an
d D
OL
test
res
ults
on
tens
ion
stre
ngth
per
pend
icul
ar to
the
grai
n of
glu
lam
obt
aine
d w
ith c
urve
d be
ams a
nd st
ruct
ural
size
d te
nsio
n sp
ecim
ens [
Aich
er e
t al.
1998
]. Res
ults
of d
iffer
ent t
est s
erie
s at V
TT
and
FM
PA
Ten
sion
spec
imen
s C
urve
d be
ams
Tes
t and
spec
imen
con
figur
atio
ns
Uni
ts
AIR
01a
�dA
IR 0
3a�d
V
TT
S1/2
/31)
AIR
S1/
2 A
IR S
3/4
AIR
S5/
8/6
Spec
imen
(A
pex)
vol
ume
V
m3
0,01
0,
03
0,03
6 0,
108
0,21
6 0,
336
char
acte
rist
ics
lam
ella
thic
knes
s
d m
m
33
33
16
33
33
33
la
mel
la w
idth
b
mm
90
14
0 90
90
90
14
0
mea
n de
nsity
ρ m
ean
kg/m
3 53
0 49
3 47
0 49
6 50
3 49
3 R
amp
load
te
st se
ries
A
IR 0
1a
AIR
03a
S1
A
IR S
1 A
IR S
3 A
IR S
5 re
sults
sa
mpl
e si
ze
� 44
44
12
8
8 16
mea
n m
oist
ure
cont
ent
%
12
12
12,3
11
,6
11,4
12
�15
f t,
90,
mea
n N
/mm
2 0,
89
0,67
1,
21
0,85
0,
71
0,61
f t, 9
0, 0
5 N
/mm
2 0,
74
0,55
0,
95
0,72
0,
59
0,46
D
urat
ion
of
load
res
ults
te
st se
ries
AIR
01b
AIR
03b
S2
A
IR S
4
AIR
S8
C
onst
ant
rela
tive
hum
idity
%
65
65
40
�852)
85
85
cl
imat
e m
ean
moi
stur
e co
nten
t %
12
12
11
�122)
18
18
sa
mpl
e si
ze
� 15
15
6
8
8
k DO
L, m
ean
� 0,
70
0,75
0,
76
0,
87
0,77
time
to fa
ilure
for s
ampl
e m
ean
t F, m
ean
d 22
24
13
4 14
k DO
L, m
ean,
exr
apol
ated
for 6
mon
ths l
oad
dura
tion
- 0,
64
0,70
0,
70
0,
82
0,71
Cyc
lic
test
serie
s
AIR
01c
A
IR 0
3c
S3
AIR
S2
A
IR S
6
clim
ate
rela
tive
hum
idity
span
(RH
) %
55
�90
55�9
0 40
�85
55�9
0
55�9
0
cy
cle
leng
th
d 28
28
28
28
28
co
nditi
onin
g be
fore
cyc
ling
(RH
) %
65
65
70
75
75
sa
mpl
e si
ze
� 15
15
12
8
8
k D
OL,
mea
n �
0,45
0,
50
0,55
0,
60
0,
66
tim
e to
failu
re t
F, m
ean
d 17
,5
18,5
20
28
15
N
atur
al
test
serie
s
AIR
01d
A
IR 0
3d
sh
elte
red
rela
tive
hum
idity
span
(RH
) %
35
�95
45�9
0
outd
oor
tem
pera
ture
span
°C
-5
�22
2�22
clim
ate
cond
ition
ing
befo
re lo
adin
g (R
H)
%
65
65
sa
mpl
e si
ze
� 15
15
k DO
L, m
ean
� 0,
60
0,65
time
to fa
ilure
tF,
mea
n d
2,6
24,5
1)
D
iffer
ent m
ater
ial t
este
d in
ear
lier t
est s
erie
s pre
cedi
ng A
IR p
roje
ct
2)
Bea
ms c
oate
d w
ith a
lkyd
pai
nt
47

48
4.1.3 Analysis and discussion
The results show a clear volume effect: tensile strength perpendicular to grain depends on the width and length of the curved beam, as explained in the test reports. The apparent volume effect is stronger in short term ramp loading than in long term loading. When the results for tensile specimens are compared to curved beams, it is observed that beams are stronger than can be predicted based on tensile experiments: a curved beam has the same strength as a tensile specimen if the volume of constant moment span is about 9 times the volume of the tensile specimen. Based on a parabolic vertical stress distribution in beams, we would expect that the beam volume being nearly 3 times the volume of the tension specimen, strength would be equal. The other way of adjusting beam values for compatibility with tensile test is to divide stresses by factor kdis, as has been done in Eurocode 5. In Figure 22 failure stresses of beams have been divided by factor kdis = 1.85, which together with the volume effect exponent of 0.2 gives a good fit of tensile and beam results obtained in long term testing at constant humidity. This suggests that it would be justified to use kdis = 1.85 in structural design instead of kdis = 1.4 given in Equation (6.52) of Eurocode 5 (EN1991-1-1).
The cyclic moisture content results are not exactly comparable, because tensile tests were subjected to a stronger moisture change. Short term loading results for curved beams show a larger volume effect with exponent 0.3.
The difference in strengths between curved beams and tensile specimens cannot be fully explained. Compression stresses perpendicular to grain in areas subjected to load will decrease the volume where tensile stresses perpendicular to grain are close to nominal value. However, this effect alone is not assumed to explain the difference.

49
0,1
1
0,001 0,01 0,1 1
Volume (m³)
Adj
uste
d m
ean
stre
ngth
(N/m
m²)
tension, short term
tension, DOL, cyclic
tension, DOL, 65 % RH
curved beam, short term
curved beam, DOL, cyclic
curved beam, DOL, 85 % RH
Adjustment: kdis=1,85, slope of line -0,2
Figure 22. Strength perpendicular to grain vs. volume on double logarithmic scale. Curved beam strength is divided by 1.85. Slope of line corresponds to a volume effect exponent 0.2.
50
5. Creep deflection of structural size beams
This chapter reports creep experiments in heated room conditions which have not been reported earlier for the full period of 16 years of loading. Also results of experiments in unheated building conditions, which have been reported earlier [Gowda et al. 1996, Ranta-Maunus and Kortesmaa 2000] are summarised as well as creep experiments of glulam beams exposed to uncontrolled weather conditions in 1960�s [Ranta-Maunus 1975].
5.1 Creep in heated room
In order to study creep of timber at low load levels close to the effect of dead load of roofs in Nordic countries, creep experiment of 8 glued laminated beams was started in June 1991 in heated indoor environment, and test continued until 2007. Modulus of elasticity of beams range from 13 200 to 14 400 MPa and density from 474 to 502 kg/m3. Glulam beams have cross-section 90 x 270 mm2, span 9 m and are made from spruce lamellae, and have a varnished surface. Loading consists of own weight of the beams and two point loads of 1840 N or 614 N each, being located symmetrically at distance of 2 m from each other. The maximum bending stress of 4 beams is 4 MPa and 2 MPa for the remaining 4 beams. More information of these creep experiments is published by Ranta-Maunus and Kortesmaa [2000].
Variation of relative humidity in the test room is demonstrated in Figure 23. Temperature was in range of 19 to 23, mainly 20 to 22 °C in test room which was on lowest level of VTT underground research hall.
Creep curves of glulam in heated room under low load level during 16 years are shown on Figure 24. The main result is that creep has not fully stopped during 16 years, but continues very slowly. Relative creep at the two load levels are similar. During first 8 years annual variation of relative deflection is shown, whereas during later years, measurement is made only once a year or more seldom. It is essential, that creep values are measured during the same season when we want to draw conclusions on the long term trend of creep. Otherwise effects of annual moisture cycling will complicate the analysis.

51
RH 2003-2006
0
20
40
60
80
2003 2004 2005 2006 2007
Year
RH
[%]
Figure 23. Weekly mean values of relative humidity in heated test room 2003�2006.
We can conclude that creep is 40% of elastic deformation after the first year, 60% in about 4 years increasing very slowly after that reaching 70% in 16 or 20 years. A simple creep curve
2.04.01)0()( t
wtw
+= (12)
where t is time in years, seems to fit well to the long term trend as demonstrated in Figure 25. Experimental values are based on readings during summers, except the value after 6 months loading.
1,0
1,2
1,4
1,6
1,8
2,0
0 2 4 6 8 10 12 14 16time
Rela
tive
cree
p
4 MPa
2 MPa
Figure 24. Relative creep deflection (means of 4 beams) of spruce glulam in heated room under low load levels (2 and 4 MPa). Time is given in years.

52
1,3
1,4
1,5
1,6
1,7
1,8
0 2 4 6 8 10 12 14 16Time (years)
Rel
ativ
e cr
eep
heated: 2-4 MPa
1+0.4t^0.2
Figure 25. Relative creep deflection (mean of 8 beams) of spruce glulam in heated room under low load levels (2 and 4 MPa) and simple creep curve (12).
5.2 Creep in unheated room and outdoors
Bending creep experiments made in sheltered environment conditions are summarised in Table 27 which gives relative creep values after full years. Some experiments were stopped early because of a large lateral deflection of beams. Nonlinearity of creep seems to begin at low load levels: 7 MPa gives clearly larger relative creep than 2 MPa, whereas difference between 4 and 2 MPa is minimal.
Relative creep in heated room and in sheltered room conditions in Southern Finland are equal. Surface coating and impregnation treatment which prevents moisture cycling in wood decreases creep deformation. Table 27 shows that surface coating with emulsion paint decreases relative creep 30%, alkyd paint 50% and creosote impregnation 70% whereas CCA treatment did not decrease creep. The old experiments under exposure to weather show twice as high relative creep deformation as under sheltered environment under similar stress level.

53
Table 27. Summary of relative creep deformation of specimens under long term loading in sheltered environment. All values are averages of 4 structural size beams. Some old results of glulam beams from 1960´s are also included, which are exposed to weather [Ranta-Maunus 1975].
Relative creep of specimens
Time (years) Test material
Dimension [mm]
Surface treatment
Max.stressMPa
1
2
3
4
5
6
7
Pine 50 x 150 x 5000 none emulsion
alkyd creosoted
CCA
7 7 7 7 7
1.621.461.311.191.58
1.691.521.351.221.64
1.791.57 1.401.27
1.841.601.411.28
1.901.62 1.451.27
1.911.641.451.27
0.97
0.28
Spruce 50 x 150 x 5000 non treated
7 2
1.661.42
1.761.44
1.50
1.52
1.55
1.58
1.60
Glulam, spruce
90 x 180 x 6500 non treated
2 1.44 1.48 1.57 1.61 1.62 1.65 1.65
Glulam, spruce, 1960�s
150 x 220 x 7600 plastic cover,
outdoors
5.4 1.65 1.88 2.0 2.0 2.1
Glulam, pine, 1960�s
95 x 176 x 7080 plastic cover,
outdoors
8.2 1.75 1.9 2.0 2.1 2.2
Glulam, pine, 1960�s
95 x 176 x 7080 exposed, outdoors
8.2 2.0 2.3 2.5 2.6 2.8
Kerto-LVL
51 x 200 x 6500 non treated
2 1.67 1.69 1.85 1.90 1.96 1.96 1.99
I - beam 45 x 45 flange 6,5 web
non treated
3 1.68 1.78 1.92 1.95 1.98 1.98 1.98

54
6. Summary
This report is a compilation of test results and their analysis covering a wide area of materials and loading conditions. The main function of this publication is to document valuable numerical results for future use.
The characteristic bending strength of unsorted Nordic spruce sawn timber is traditionally considered to be 26 MPa. In Combigrade project sampling where no logs were rejected because of low quality, the five percentile of bending strength was 24 MPa, and that of tensile strength 18 MPa. Five percentile of bending strength of pine was 20 MPa. However, these high five percentile values do not justify to deliver ungraded timber for structural use, because weak pieces need to be sorted out.
It was observed that bending strength of both spruce and pine timber has a positive correlation with width of beam (Tables 3 and 4). Therefore it is suggested that strength models used as basis for determination of settings of grading machines should include dimensions of sawn timber as variables. These results support the height effect used in European standards (exponent = -0.2). Especially the results obtained for spruce are close to standard approach.
Tension strength of sawn timber, especially in better grades, is higher than 60% of bending strength specified in EN338. A proposal based on results obtained for five percentiles in Chapter 2.2 is given in Table 28. For grades missing in Table, tension to bending ratios can be interpolated. Tension to bending strength ratio ranges from 0.65 for C16 and lower to 0.75 for C50.
Table 28. Suggestion for new tension strength values for EN338.
Suggested tension to bending ratio Suggested ftk Present EN338
C16 0,65 10 10 C20 0,68 14 12 C24 0,70 17 14 C30 0,72 22 18 C40 0,74 30 24 C50 0,75 37 30

55
Figure 4 illustrates nicely that variability of mechanical properties of sawn timber decreases when grade increases. The clear trend is that the coefficient of variation decreases when the characteristic strength increases. COV of bending strength, modulus of elasticity and density of grade C40 is only half of the COV values for C18. In European standardisation there are more strict requirements for strength classes C35 and higher:
− daily mechanical testing in production is required only for C35 and higher, and
− 12% decrease of strength requirement is applied for machine graded timber of C30 and lower.
In light of Figure 4 harder requirements applied to higher grades seem not justified.
Grading methods are compared in Chapter 2. The results support the earlier understanding that stiffness is the best predictor of strength. An optimised yield to grades cannot be obtained without measuring stiffness, e.g. dynamic modulus of elasticity. When grading glulam lamellas based of tension strength, density should be also measured because it has effect on strength of finger joints. Setting of threshold values for density and knot sizes should be part of lamella grading procedures. A remaining challenge in strength grading is to improve detection of weak pieces which have defects such as top failures.
Compression strength values obtained for spruce graded visually simultaneously to C24 and C30 were 30% higher than those given in EN338. This suggests that EN338 values are quite conservative.
Compression strength perpendicular to grain determined according to EN408 was lower than given in EN338 for a grade with same density (2.2 vs. 2.6 MPa). However, severe structural failures caused by compression stress perpendicular to grain are not common. It is suggested that in European standardisation either
− testing standard will be changed to be more directly relevant to structural use like ASTM D 143, or
− compression perpendicular to grain will be considered as serviceability limit state rather than ultimate limit state.

56
Shear test results show no correlation between strength and density, and suggest that same value should be used for all grades. We obtained 3.9 MPa for five percentile of spruce and 4.2 MPa for pine.
Traditionally 30MPa has been used in Finland as characteristic bending strength of round timber. The results here support this value to be used also for small diameter timber provided that there are visual grading limits for knots. Grading rules are suggested in Table 20. A special feature of small diameter round timber is that the ratio of compression strength parallel to grain to bending strength is lower than for sawn timber. This is obviously caused by larger effect of juvenile wood in compression than in bending.
The extensive research on moisture induced stresses perpendicular to grain suggests that we should not consider the lower load bearing capacity of curved beams as a material weakening effect. If doing so, there is no limit on how much weaker the material will become, because moisture gradients can and will cause splitting of wood without external loads. Therefore moisture gradients should be considered as external loads in a similar manor as snow, wind or thermal loads. Wood can be protected against these loads for example by surface coating.
Long term creep experiments are also reported in this publication. Under low load levels it takes about 20 years in heated or sheltered environment to reach a creep deformation which is 70% of elastic deformation.

57
Acknowledgements
While getting now retired, I want to thank VTT for having offered to me interesting working periods from 1970 to 1972, and from 1985 to 2007. Financial contributions of Tekes and European Commission have been crucial in execution of the work. Support of Finnish sawmilling and glulam industries is also gratefully acknowledged.

58
References
Aicher, S., Dill-Langer, G. & Ranta-Maunus, A. 1998. Duration of load effect in tension perpendicular to the grain of glulam in different climates. Holz als Roh- und Werkstoff 56, pp. 295�305.
Ehlbeck, J., Colling, F. & Görlacher R. 1985. Einfluss keilgezinkter Lamellen auf die Biegefestigkeit von Brettschichtholzträgern. Holz als Roh- und Werkstoff 43, pp. 369�373.
Glos, P. & Denzler, J. 2003. Characteristic Shear Strength Values Based on Tests according to EN 1193. CIB W 18 meeting in Colorado, Paper 36-6-1.
Gowda, S. & Ranta-Maunus, A. 1993. Curved and cambered glulam beams. Part 1. Short term load tests. Espoo: VTT Tiedotteita � Research Notes 1500. 96 p. + app. 39 p.
Gowda, S. & Ranta-Maunus, A. 1996. Duration of load effect on curved glulam beams. Part 1. Short term reference tests. Espoo: VTT Tiedotteita � Research Notes 1741. 66 p. + app. 11 p.
Gowda, S., Kortesmaa, M. & Ranta-Maunus, A. 1996. Long term creep tests on timber beams in heated and non-heated environments. Espoo: VTT Publications 278. 35 p.
Gowda, S., Kortesmaa, M. & Ranta-Maunus, A. 1998. Duration of load effect on curved glulam beams. Part 2. Long term load tests and analysis. Espoo: VTT Publications 334. 76 p. + app. 28 p.
Hanhijärvi, A. 2000. Advances in the knowledge of the influence of moisture changes on the long-term mechanical performance of timber structures. Materials and Structures/Materiaux et Constructions. Vol. 33, No: Jan.�Feb., pp. 43�49.
Hanhijärvi, A., Ranta-Maunus, A., Sarkama, H., Poussa, M., Mitsuhashi, K. & Puttonen, J. 2007. Analysis of tension and bending strength of graded spruce timber. Proceedings of CIB W18 Meeting in Bled, Paper 40-6-3.

59
Hanhijärvi, A. & Ranta-Maunus, A. 2008. Development of strength grading of timber using combined measurement techniques. Report of the Combigrade-project � phase 2. Espoo: VTT Publications. Manuscript.
Poussa, M., Tukiainen, P., Mitsuhashi, K. & Andersin, P. 2007a. COMBI T � Destructive tension, shear, and compression (0° and 90°) strength tests for Finnish sawn timber. Helsinki University of Technology, Laboratory of Structural Engineering and Building Physics Publication TKK-TRT-130. (http://www.tkk.fi/Yksikot/Talo/projektit/COMBI_T.pdf)
Poussa, M., Tukiainen, P. & Ranta-Maunus, A. 2007b. Experimental study of compression and shear strength of spruce timber. Proceedings of CIB W18 Meeting in Bled, Paper 40-6-2.
Ranta-Maunus, A. 1975. The viscoelasticity of wood at varying moisture content. Wood Sci Technol, Vol. 9, pp. 189�205.
Ranta-Maunus, A. & Gowda, S. 1994. Curved and cambered glulam beams. Part 2. Long term load tests under cyclically varying humidity. Espoo: VTT Publications 171. 36 p. + app. 18 p.
Ranta-Maunus, A. 1998. Duration of load effect in tension perpendicular to grain in curved glulam. CIB W18 Meeting in Savonlinna, Paper 31-9-1. 12 p.
Ranta-Maunus, A., Saarelainen, U. & Boren, H. 1998. Strength of small diameter round timber. CIB W18 Meeting in Savonlinna, Paper 31-6-3. 10 p.
Ranta-Maunus, A. (ed.) 1999. Round small-diameter timber for construction. Final report of project FAIR CT 95-0091. Espoo: VTT Publications 383. 191 p. + app. 19 p.
Ranta-Maunus, A. & Kortesmaa, M. 2000. Creep of Timber during 8 Years in Natural Environments. WCTE Conference in Whistler. 6 p.
Ranta-Maunus, A., Fonselius, M., Kurkela, J. & Toratti, T. 2001. Reliability analysis of timber structures. Espoo: VTT Tiedotteita � Research Notes 2109. 102 p. + app. 3 p.

60
Ranta-Maunus, A. 2001. Moisture gradient as loading of curved timber beams failing in tension perpendicular to grain. IABSE Conference Innovative Wooden Structures and Bridges, Lahti. Finland, 29.�31. August 2001.

A1
Appendix A: Combigrade project material
Selection of test material (logs)
Five different sampling regions were chosen � three in Finland and two in North-Western Russia. The three areas in Finland were: Western Finland, Eastern Finland and Kainuu. The two in Russia were East Carelia and Vologda for spruce and Novgorod and Vologda for pine. All logs were gathered during winter 2005�2006 from six sawmills in Finland � also including the logs from the Russian sampling areas. The Russian logs were chosen from railway car loads or truck loads, whose origin was known with the accuracy of the province (�oblast�), which was enough for the purposes of this study. The sawmills and sampling areas are listed in Table A1. The logs were taken from the log supply of the sawmills so that not more than 5 logs were allowed from the same truck or the same railway car. In fact, the majority of the logs were gathered so that with high probability just one log was obtained from the same growth location (logging area). Logs were taken completely randomly: no quality assessment of logs was done at selection.
The sizes of the logs were chosen so that they corresponded to the normal sawing practise in the Nordic countries, which means that the log sizes used in this study for production of different sized sawn timber cross-sections were the same as are used in normal production of the same sizes. The number of selected logs per each dimension and per sampling area was 44, which was chosen so that a 10% surplus was taken compared to the targeted sample size 1000. Table A2 shows the log sizes and selected number of logs. The surplus was intended as a buffer against losses in transportation, etc.

A2
Table A1. Sampling areas of logs. (*) Logs from coastal areas were not included.
SPRUCE
Log labels Region Sawmill Districts
KL Western Finland
Kyröskoski sawmill Tampere, Seinäjoki, Rauma(*
KE Eastern Finland Kitee sawmill Kitee
KP Kainuu Soinlahti sawmill Kajaani
KK East Carelia Kitee sawmill KV Vologda Kitee sawmill PINE Log labels Area Sawmill Districts
ML Western Finland
Merikarvia sawmill Tampere, Seinäjoki, Rauma(*
ME Eastern Finland
Kaukas sawmill Lappeenranta, Mikkeli
MP Kainuu Kajaani sawmill Kajaani
MN Novgorod Kaukas sawmill
MV Vologda Kaukas sawmill
Table A2. Log numbering system and mean top dimensions.
Sawn dimension Log numbers
Top diameter
mm
Number of logs per area
per species Sawing pattern
38 mm x 100 mm 1�44 176 44 2 ex log 50 mm x 100 mm 101�144 196 44 2 ex log 50 mm x 150 mm 201�244 230 44 2 ex log 44 mm x 200 mm 401�444 322 44 4 ex log 63 mm x 200 mm 301�344 290 44 2 ex log

A3
Sawing and drying of test material
After the log-NDT measurements had been performed, the logs were sawn according to either the 2exlog pattern (most logs) or the 4exlog pattern (logs for the 44 x 200 dimension) into boards or planks corresponding to nominal dimension as shown in Table A2. The sawing patterns are illustrated in Figure A1. The sawing was made at Kymenlaakso Polytechnic at an educational sawing line, where the production speed was slow enough to allow the transfer of the log numbering onto the boards including an additional character that was added to the sawn pieces as illustrated in Figure A1. Basically, only one board out of each log was picked to be used as a test specimen in this study (either A or B by random as illustrated in Figure A1 for dimensions 38 x 100, 50 x 100, 50 x 150 and 63 x 200; for dimension 44 x 200 the logs were first divided into half by random and then from the first half either A or D was picked by random and from the other half either B or C by random). This way one piece was obtained for bending tests. The remaining boards were saved to be used as test material in other other tests.
D
AAB C
B
Figure A1. Sawing patterns of logs. Left � 2exlog used for dimensions 38 x 100, 50 x 100, 50 x 150, 63 x 200. Either the A-specimen or B-specimen was picked from each log for bending tests. Right � 4exlog used for 44 x 200. From half of the logs either the A-specimen or D-specimen was picked and from the other half either one B-specimen or C-specimen was picked for bending specimens.
The boards were dried also at Kymenlaakso polytechnic in a small kiln using a moderate drying schedule to avoid cracking. The target average final moisture content was 15%. Due to the limitation of kiln space available and the slow production speed of the sawing, a substantial amount of the boards had to be kept waiting for kilning outside. Due to this, the actually reached final average moisture content was lower, 11�12%. The boards were not planed after drying.

Series title, number and report code of publication
VTT Publications 668 VTT-PUBS-668
Author(s) Ranta-Maunus, Alpo Title
Strength of Finnish grown timber
Abstract
Strength and stiffness of timber have been studied in different projects during 1986�2007. This is a summary report of results which are considered relevant for European and international standardisation. It includes both new unpublished and already published information. The growth area of timber considered in this publication is primarily limited to Finland and parts of North Western Russia.
This experimental research concerns bending, tension, compression and shear strength and stiffness of sawn timber. It includes also tension perpendicular to grain of glulam and compression perpendicular to grain of sawn timber. Also, bending and compression strength of round timber is reported. In addition, long term creep results of glulam and other structural wood products are included in this publication.
ISBN 978-951-38-7067-6 (soft back ed.) 978-951-38-7068-3 (URL: http://www.vtt.fi/publications/index.jsp)
Series title and ISSN Project number
VTT Publications 1235-0621 (soft back ed.) 1455-0849 (URL: http://www.vtt.fi/publications/index.jsp)
Date Language Pages December 2007 English, Finnish abstr. 60 p. + app. 3 p.
Name of project Commissioned by Combigrade Tekes, Wood Focus Ltd, Finnish glulam industry,
Finnforest, Stora Enso, UPM, VTT
Keywords Publisher timber, wood, spruce, pine, strength, bending, tension, compression, shear, creep, duration of load
VTT Technical Research Centre of Finland P.O. Box 1000, FI-02044 VTT, Finland Phone internat. +358 20 722 4404 Fax +358 20 722 4374

Julkaisun sarja, numero ja raporttikoodi
VTT Publications 668 VTT-PUBS-668
Tekijä(t) Ranta-Maunus, Alpo
Nimeke
Suomalaisen puun lujuustutkimusten yhteenveto Tiivistelmä
Julkaisu on yhteenveto puun lujuutta koskevista tutkimuksista VTT:ssa 1986�2007. Osa koetuloksista on ennen julkaisemattomia, osa on aikaisemmin julkaistuja. Julkaisu keskittyy sellaisiin tuloksiin, joilla on ilmeistä käyttöä puurakenteiden standardeja ja normeja kehitettäessä.
Tutkimus rajoittuu Suomessa ja lähialueilla kasvaneeseen kuuseen ja mäntyyn. Tuloksia verrataan myös julkaistuihin eurooppalaisiin tutkimustuloksiin. Julkaisu sisältää sahatavaran taivutus-, veto-, puristus ja leikkauslujuustuloksia ja liimapuun lujuustuloksia syysuuntaa vastaan kohtisuoran vetorasituksen alaisena sekä liimapuun virumistuloksia 16 vuotta kestäneen kuormituksen alaisena. Julkaisu sisältää myös pyöreän puun taivutus- ja puristus-koetuloksia.
ISBN 978-951-38-7067-6 (nid.) 978-951-38-7068-3 (URL: http://www.vtt.fi/publications/index.jsp)
Avainnimeke ja ISSN Projektinumero VTT Publications 1235-0621 (nid.) 1455-0849 (URL: http://www.vtt.fi/publications/index.jsp)
Julkaisuaika Kieli Sivuja Joulukuu 2007 Englanti, suom. tiiv. 60 s. + liitt. 3 s.
Projektin nimi Toimeksiantaja(t) Combigrade Tekes, Wood Focus Ltd, Finnish glulam industry,
Finnforest, Stora Enso, UPM, VTT
Avainsanat Julkaisija
timber, wood, spruce, pine, strength, bending, tension, compression, shear, creep, duration of load
VTT PL 1000, 02044 VTT Puh. 020 722 4404 Faksi 020 722 4374

VTT P
UB
LICA
TION
S 668 Strength of Finnish grow
n timber A
lpo Ranta-Maunus
ESPOO 2007ESPOO 2007ESPOO 2007ESPOO 2007ESPOO 2007 VTT PUBLICATIONS 668
Alpo Ranta-Maunus
Strength of Finnish grown timber
The publication reports strength testing results obtained during past 20years by VTT and project partners. New and such older results arecollected to this publication which are considered to be relevant forrenewal of standards of structural timber. Main results were received infour research projects:
1) strength grading project in 1990's,2) strength grading project 2003–2007 (Combigrade),3) European project on the use of small diameter timber inconstruction in late 1990's and4) European duration of load project in 1990's.
ISBN 978-951-38-7067-6 (soft back ed.) ISBN 978-951-38-7068-3 (URL: http://www.vtt.fi/publications/index.jsp)ISSN 1235-0621 (soft back ed.) ISSN 1455-0849 (URL: http://www.vtt.fi/publications/index.jsp)
Julkaisu on saatavana Publikationen distribueras av This publication is available from
VTT VTT VTTPL 1000 PB 1000 P.O. Box 1000
02044 VTT 02044 VTT FI-02044 VTT, FinlandPuh. 020 722 4520 Tel. 020 722 4520 Phone internat. + 358 20 722 4520
http://www.vtt.fi http://www.vtt.fi http://www.vtt.fi
0
10
20
30
40
10 20 30 40 50
characteristic bending strength [MPa]
CO
V [
%]
density
MOR
MOE