strength models of the terrestrial planets and
TRANSCRIPT

REVIEW Open Access
Strength models of the terrestrial planetsand implications for their lithosphericstructure and evolutionIkuo Katayama
Abstract
Knowledge of lithospheric strength can help to understand the internal structure and evolution of the terrestrialplanets, as surface topography and gravity fields are controlled mainly by deformational features within thelithosphere. Here, strength profiles of lithosphere were calculated for each planet using a recently updated flow lawand taking into account the effect of water on lithospheric deformation. Strength is controlled predominantly bybrittle deformation at shallow depths, whereas plastic deformation becomes dominant at greater depths throughits sensitivity to temperature. Incorporation of Peierls creep, in which strain rate is exponentially dependent onstress, results in the weakening of plastic strength at higher stress levels, and the transition from brittle to ductiledeformation shifts to shallower depths than those calculated using conventional power-law creep. Strength in boththe brittle and ductile regimes is highly sensitive to the presence of water, with the overall strength of the lithospheredecreasing markedly under wet conditions. The markedly low frictional coefficient of clay minerals results in a furtherdecrease in brittle strength and is attributed to expansion of the brittle field. As plastic strength is influenced by lithology,a large strength contrast can occur across the crust–mantle boundary if deformation is controlled by ductile deformation.Effective elastic thickness for the terrestrial planets calculated from the rheological models indicates its close dependenceon spatiotemporal variations in temperature and the presence of water. Although application of the strength models toobserved large-scale surface deformational features is subject to large extrapolation and uncertainties, I emphasize thedifferent sensitivity of these features to temperature and water, meaning that quantifying these features (e.g., by datafrom orbiting satellites or rovers) should help to constrain the internal structure and evolution of the terrestrial planets.
Keywords: Strength profile, Rock rheology, Terrestrial planet, Elastic thickness, Thermal gradient, Water
1 IntroductionThe terrestrial planets typically comprise an outermostrigid layer overlying a convective viscous layer. Althoughdirect subsurface information is not available for theseplanets, except for Earth, lithospheric structures can beinferred from modeling studies using orbiting satellitedata such as multispectral imaging, surface topography,and the gravity field (e.g., Watters and Schultz 2009).The flexural response to surface or subsurface loads isresponsible for flexural rigidity and can constrain the
thickness of an equivalent elastic plate. By applying simplemodels incorporating brittle, elastic, and ductile deform-ation, it is possible to calculate the effective elastic thick-ness of the lithosphere and its spatial and temporalvariations (e.g., Goetze and Evans 1979; McNutt 1984;Watts and Burov 2003). The spacing of faults and fold isalso sensitive to the thickness of a strong layer associatedwith brittle deformation and can therefore provide con-straints on lithospheric structure (e.g., Phillips and Hansen1998; Montesi and Zuber 2003).Lithospheric structure is controlled mainly by rock
strength, which is highly sensitive to temperature (e.g.,Ranalli 1992; Kohlstedt et al. 1995). Consequently,
© The Author(s). 2021 Open Access This article is licensed under a Creative Commons Attribution 4.0 International License,which permits use, sharing, adaptation, distribution and reproduction in any medium or format, as long as you giveappropriate credit to the original author(s) and the source, provide a link to the Creative Commons licence, and indicate ifchanges were made. The images or other third party material in this article are included in the article's Creative Commonslicence, unless indicated otherwise in a credit line to the material. If material is not included in the article's Creative Commonslicence and your intended use is not permitted by statutory regulation or exceeds the permitted use, you will need to obtainpermission directly from the copyright holder. To view a copy of this licence, visit http://creativecommons.org/licenses/by/4.0/.
Correspondence: [email protected] of Earth and Planetary Systems Science, Hiroshima University,Higashi-Hiroshima 739-8526, Japan
Progress in Earth and Planetary Science
Katayama Progress in Earth and Planetary Science (2021) 8:1 https://doi.org/10.1186/s40645-020-00388-2
differences in elastic thickness and faults/fold spacingare commonly interpreted to reflect spatiotemporal vari-ations in the vertical thermal gradient in the terrestrialplanets. In Earth, the effective elastic thickness ofoceanic lithosphere systematically changes with the timeof loading, consistent with the plate-cooling model (e.g.,Watts et al. 1980). The thickness of the elastic litho-sphere within Mars shows spatial variations that are gen-erally correlated with the geological epoch, most likelydue to the secular cooling of the planet (e.g., Solomonand Head 1990). Rock strength is also dependent onconstituent minerals, meaning that chemical compos-ition, including compositional changes such as the crustto mantle transition, has a substantial influence on therheological structure of the lithosphere. Because of thelarge strength contrast across the crust–mantle bound-ary within Venus, crustal deformation is likely decoupledfrom the underlying mantle convection, which mighthave resulted in the absence of plate tectonics on thatplanet (e.g., Mackwell et al. 1998; Azuma et al. 2014).Another key difference in internal structural features be-tween Venus and Earth is unstable fault motion,whereby the cold and wet lithosphere may facilitate dy-namic weakening within Earth, in contrast to stable slid-ing in the dry and hot lithosphere of Venus (Karato andBarbot 2018).Recent laboratory experiments have emphasized the
influence of water on rock rheology (e.g., Paterson andWong 2004; Karato 2008). Pore fluid pressure is wellknown to reduce the brittle strength of rock, and this re-lationship has been widely applied to enhance recoveryof oil and shale gas, as well as to exploit geothermal res-ervoirs (e.g., Gregory et al. 2011). Earthquakes can betriggered by pore pressure buildup, whereby the tem-poral evolution of fault strength is likely controlled byfluid accumulation and abrupt fluctuations (e.g., Sibson1992; Katayama et al. 2012). Another important influ-ence of water on brittle strength is the presence of clayminerals, which has been suggested as a weakeningmechanism of fault motions through its markedly lowfrictional coefficient (e.g., Moore and Lockner 2007).During ductile deformation, the presence of water re-duces plastic strength through increasing the number ofdefects in crystals and promoting mass transfer at grainboundary (e.g., Karato 2008). Nominally anhydrous min-erals such as olivine and pyroxene contain very smallamounts of water (ppm level), but the dissolved hydro-gen in crystals increases the defect concentration, mean-ing that even trace amounts of water can markedlyenhance the rate of plastic deformation (e.g., Karato andJung 2003; Hirth and Kohlstedt 2003).This review paper summarizes current knowledge of
the rheological properties of crust and mantle materials,including the effects of water on material properties.
Strength profiles of the lithosphere are calculated forMercury, Venus, Earth, and Mars, which vary in termsof gravity, temperature, and crustal thickness (Fig. 1 andTable 1), following which the implications for the spatio-temporal evolution of the lithosphere of each planet arediscussed, focusing particularly on the role of water.
2 Calculation of strength profilesThe type of deformation in the interior of rocky planetsshifts from brittle deformation at relatively shallow levelsto plastic deformation at deeper levels. This is because afracture surface can easily grow at low temperature andpressure resulting in brittle deformation, whereas atdeep levels the fracture surface tends to closes owing toincreasing pressure, with plastic deformation becomingdominant as temperature increases with depth. As brittlefracture is commonly restrained by the friction on theexisting fault plane, frictional strength is typically usedto represent the strength of the brittle region (e.g.,Goetze and Evans 1979; Kohlstedt et al. 1995). In theplastic region, strength is calculated using a flow lawthat is exponentially dependent on temperature. Detailsof calculating strength for each deformation mechanismand rheological layering are described below.
2.1 Frictional strengthFrictional strength is controlled mainly by the appliednormal stress on the fault plane, and the friction coeffi-cient is known to be insensitive to lithology andtemperature (Byerlee 1978). The strength of the brittleregion is generally expressed as follows:
τ ¼ μ σn þ C ð1Þ
where τ is shear stress, μ is the coefficient of friction, σnis normal stress, and C is frictional cohesive strength.The frictional coefficient of 0.85 under low normal stressand typically decreases to 0.6 at higher normal stresswere frequently used to calculate the brittle strength(e.g., Kohlstedt et al. 1995). However, recent laboratoryexperiments and first-principle calculations have shownextremely low the frictional coefficient for clay mineralsunder wet conditions (e.g., Moore and Lockner 2007;Katayama et al. 2015; Sakuma et al. 2018). In addition toEarth, the presence of clay minerals has been suggestedin surficial materials of Mars (e.g., Ehlmann et al. 2011).I therefore calculated brittle strength in the presence ofclay minerals for Earth and Mars, using frictional coeffi-cients as low as 0.1.Although the frictional strength obtained using Eq. (1)
is shear stress, the coordination of stress is typically dif-ferential stress in plastic deformation. Therefore, it is ne-cessary to unify the stress components when calculatinga strength profile across the brittle–ductile transition. A
Katayama Progress in Earth and Planetary Science (2021) 8:1 Page 2 of 17

fault plane is generally oriented about 30° from the max-imum principal stress axis, and the frictional strength onthe fault plane can be expressed in terms of the principalstress component using this geometrical relationship(Kohlstedt et al. 1995; Katayama and Azuma 2017). Intensional deformation, the maximum principal stress isequivalent to the overburden/lithostatic pressure,whereas the minimum principal stress is equivalent tothe pressure during compression; consequently, fric-tional strength in the tensional field becomes nearly halfof that in the compressional field.In case where pore fluids exist in the brittle region, the
pore pressure acts in the direction opposite to the nor-mal stress, so the effective normal stress on the faultplane is calculated as
σeffn ¼ σn − αPp ð2Þ
where Pp is pore fluid pressure, and α is a coefficientthat is approximated to unity (e.g., Gueguen andPalciauskas 1994). This relationship indicates that the ef-fective normal stress, and hence the frictional strength,can decrease markedly as pore fluid pressure increases.Here, in the calculation of strength profiles under hy-drous conditions, the pore pressure was assumed to behydrostatic. For the wet model, brittle strength was
calculated using Byerlee’s law, including the effect ofpore fluid pressure. For the clay model, the strength wasfurther decreased on account of the low frictionalcoefficient.
2.2 Plastic strengthIn the region of plastic deformation, mechanical strengthis strongly influenced by temperature and strain rate,whereas brittle strength is controlled predominantly bypressure. The relationship between strain rate ( ε̇ ) anddifferential stress (σ) is commonly expressed by a power-law relationship as follows:
ε̇ ¼ Aσn
dm exp −E þ PVRT
� �ð3Þ
where A is a pre-exponential factor, d is grain size, E isactivation energy, V is activation volume, P is pressure,T is temperature and R is the gas constant (e.g., Ranalli1992; Karato 2008). In this power-law relationship, nand m are constant exponents for stress and grain size,respectively. Plastic deformation is caused by the move-ment of defects in crystals, in which the dominant de-formation mechanism depends on stress, temperature,and grain size, among other factors (e.g., Frost andAshby 1982). Diffusion creep is controlled by point
Fig. 1 Internal structure of the terrestrial planets, composed of crust, mantle, and core
Table 1 Basic information for the terrestrial planets
Mercury Venus Earth Mars
Semi-major axis (AU) 0.39 0.72 1.00 1.52
Radius (km) 2439 6052 6378 3394
Gravity (m/s2) 3.70 8.87 9.78 3.69
Density (g/cm3) 5.43 5.20 5.51 3.93
Surface temperature (K) 440 730 280 220
Crustal thickness (km) 35 15 7 50
Katayama Progress in Earth and Planetary Science (2021) 8:1 Page 3 of 17

defects, for which the stress and grain size exponents are1 and 3, whereas dislocation creep is insensitive to grainsize and has a strong stress dependence (n ≈ 3).The power-law relationship is frequently used to cal-
culate plastic strength in the lithosphere. However, limi-tations of the power-law formula have been documentedfor low temperatures and high stresses (Tsenn and Car-ter 1987), in which case the strain rate becomes expo-nentially dependent on stress, as follows:
ε̇ ¼ Aσ2 exp −E þ PVRT
1 −σσp
� �2 !
ð4Þ
where σp is Peierls stress. This mechanism, known asPeierls creep, becomes dominant at depths close to thebrittle–ductile transition (e.g., Katayama and Karato2008). The parameters of flow laws used in the calcula-tions are listed in Table 2.Another key aspect of plastic deformation is that
strength varies with lithology. Plastic strength is gener-ally controlled by the weakest constituent mineral inrock, and the flow laws for plagioclase and olivine arecommonly used to calculate plastic strength in the crustand mantle, respectively (e.g., Bürgmann and Dresen2008). Plastic strength is also dependent on crystalorientation as well as mineral distribution and connect-ivity, leading to variability in strength (e.g., Yamazakiand Karato 2002); however, isotropic strength wasadopted here as the simplest model for rheologicalcalculations.Water is known to enhance the rate of plastic deform-
ation by increasing the mobility of defects in crystals(e.g., Karato 2008). Although the amounts of water dis-solved in nominally anhydrous minerals is minor (ppm
level), defect mobility can be increased markedlythrough distortion in crystals, which enhances plasticdeformation (e.g., Karato and Jung 2003; Hirth andKohlstedt 2003). The influence of water depends on thechemistry of point defects, which varies among mineralsand with the mechanism of creep. Plastic strength wascalculated for wet models using the flow law determinedunder fluid-saturated conditions (Table 2).
2.3 Elastic thicknessUnder applied moments and loads, flexure of the litho-sphere occurs on geological time-scales, and the thick-ness of the elastically responding layer is inferred fromthe strength envelope of the lithosphere (e.g., Goetzeand Evans 1979; McNutt 1984). Here, the effective elas-tic thickness was calculated following McNutt (1984),with the moment balanced between tensional and com-pressional forces within the lithosphere. The integratedbending moment of the lithosphere is estimated as
M ¼Z Tm
0σ zð Þ z − znð Þdz ð5Þ
where Tm is the mechanical thickness of the lithosphere,σ(z) is the strength at depth z, and zn is the depth of theneutral stress plane. The mechanical thickness is as-sumed to be represented by the base of the lithosphere,corresponding to the depth with a stress of < 50 MPa(e.g., McNutt 1984). The analytical solution for thebending moment of the lithosphere is expressed as
M ¼ EKT3e
12 1 − υ2ð Þ ð6Þ
where E is Young’s modulus, υ is Poisson’s ratio, K is the
Table 2 Flow law parameters used for calculation of rhelogical structures
Rock type Creepmechanism
A n m σp E V
(s-1 MPa-n μmm) (MPa) (kJ/mol) (cm3/mol)
Plagioclase (wet) Diffusion creepa 10 1.7 1 3 - 170 -
Dislocation creepb 10 -5.6 4 - - 235 -
Peierls creepc 10 -1.2 2 - 3410 235 -
Plagioclase (dry) Diffusion creepa 10 12.1 1 3 - 467 -
Dislocation creepb 10 0.9 3.9 - - 431 -
Peierls creepc 10 3.5 2 - 9830 431 -
Olivine (wet) Diffusion creepd 10 9.0 1 3 - 335 4
Dislocation creepe 10 4.2 3 - - 410 11
Peierls creepf 10 4.3 2 - 2870 410 11
Olivine (dry) Diffusion creepd 10 9.2 1 3 - 375 5
Dislocation creepe 10 6.1 3 - - 510 14
Peierls creepf 10 6.3 2 - 9600 510 14aRybacki and Dresen (2000), bShelton (1981), cAzuma et al. (2014), dHirth and Kohlstedt (2003), eKarato and Jung (2003), fKatayama and Karato (2008)The rhelogical parameters followed those used by Katayama et al. (2019), except for activation volume, which was given incorrectly in that study
Katayama Progress in Earth and Planetary Science (2021) 8:1 Page 4 of 17

flexural curvature, and Te is the effective elastic thick-ness. The elastic constants of the lithosphere were as-sumed to be E = 100 GPa and υ = 0.25, and thecurvature was set as 5 × 10⁻⁷ m−1. The sensitivity ofthese parameters is discussed in the following sections.As the bending moment of the lithosphere is controlledmainly by the strength close to the brittle–ductile transi-tion, incorporation of Peierls creep provides a large con-tribution to the estimated elastic thickness.
3 Rheological models for the terrestrial planetsIn the calculation of strength as a function of depth,lithostatic pressure is calculated using density and grav-ity for each planet (Table 1). The thermal structure inthe terrestrial planets is highly uncertain, so constantthermal gradients ranging from 5 to 20 K/km were as-sumed, corresponding to a surface heat flow of 20–80mW/m2 with a typical thermal conductivity of 4 W m−1
K−1 for mantle material. Although the strain rate mayvary with location and tectonic processes, a constantstrain rate of 10−17 s−1 was used to compare the litho-spheric strength for the different planets. Variations instrain rate ranging from 10−16 to 10−18 s−1 are shown asdashed lines in Fig. 2 and have a relatively minor influ-ence on the strength profiles. For plastic deformation,grain size was assumed to be 1 mm, resulting in
deformation controlled mainly by diffusion creep at thebase of lithosphere, with dislocation and Peierls creeps be-coming dominant in the middle parts of the lithosphere.Figure 2 shows the calculated strength profiles of oceaniclithosphere within Earth using different thermal gradientsunder dry and wet conditions. Increasing temperature re-sults in a decrease in plastic strength at depth, and a shal-low brittle–ductile transition develops under a highthermal gradient. Water influences lithospheric strengthin both the brittle and ductile regions of the terrestrialplanets, with the overall strength of the lithosphere de-creasing markedly under wet conditions. The presence ofclay minerals results in a marked decrease in frictional re-sistance, and hence the brittle–ductile transition shifts togreater depths (Fig. 2). Figure 3 shows the strength pro-files of the planets calculated using a constant thermalgradient of 10 K/km. Lithospheric strength and the depthof the brittle–ductile transition are highly variable amongthese different planets, even if a similar thermal structureis assumed.
3.1 MercuryStrength models of Mercury are shown in Fig. 4 withdifferent thermal gradients under dry and wet condi-tions. Given the relatively small gravity of this planet,the brittle strength is moderate, attributed to a deeper
Fig. 2 Strength models for Earth calculated using a constant strain rate of 10−17 s−1 (solid lines) with variation in strain rates between 10−16 and10−18 s−1 (dashed lines). The strength of shallow parts is controlled mainly by frictional sliding and that of deeper parts by plastic deformation.Arrows indicate the transition from brittle to ductile deformation for each model. An increasing thermal gradient results in a decrease in plasticstrength at depth and a shallower brittle–ductile transition. Water reduces the strength of both the brittle and ductile regions; consequently,lithospheric strength is markedly lower under wet conditions compared with dry. The presence of clay results in the markedly low frictionalcoefficient, and hence further decreases the brittle strength
Katayama Progress in Earth and Planetary Science (2021) 8:1 Page 5 of 17

brittle–ductile transition. Increasing the thermal gradientresults in a systematic decrease in the plastic strength, andthe transition from brittle to ductile deformation occurs atshallower depths. Nimmo and Watters (2004) calculatedthe depth of the brittle–ductile transition within Mercurywith variable crustal thickness and surface heat flow. Thepresent results are mostly consistent with the results ofthose authors for a given crustal thickness under dry con-ditions. For wet models, the brittle–ductile transition oc-curs at shallower depths than those of dry models with amarkedly lower transitional strength (Fig. 4). As the plasticstrength of plagioclase is weaker than that of olivine, alarge strength contrast can be observed across the crust–mantle boundary, particularly for a low thermal gradientunder wet conditions. A significant weakness in the lowercrust may result in mechanical decoupling between crustand mantle, similar to that expected for Venus.
3.2 VenusWith a mean surface temperature of 730 K, the overallstrength of the Venusian lithosphere is much lower thanthat of the other terrestrial planets. The rheologicalmodel of Venus is also highly dependent on the thermalgradient under dry conditions (Fig. 5), whereas thestrength of the lithosphere is very low under wet condi-tions, meaning that almost the entire lithosphere acts asa viscous layer. Mackwell et al. (1998) presented astrength profile for Venus using the flow of diabase asthe crustal material. The difference in the plasticstrength between diabase and plagioclase is not signifi-cant under deformation controlled by dislocation creep;
however, Peierls creep becomes the dominant deform-ation mechanism near the brittle–ductile transition, andthis type of flow law is not available for diabase. Azumaet al. (2014) conducted two-layer experiments withplagioclase and olivine under conditions correspondingto the depth of the crust–mantle boundary within Venusand found that crustal plagioclase is much weaker thanmantle olivine. Because of the large strength contrastacross the crust–mantle boundary, they suggested thatdecoupling between crustal deformation and mantleconvection likely occurred during the early evolution ofVenus.
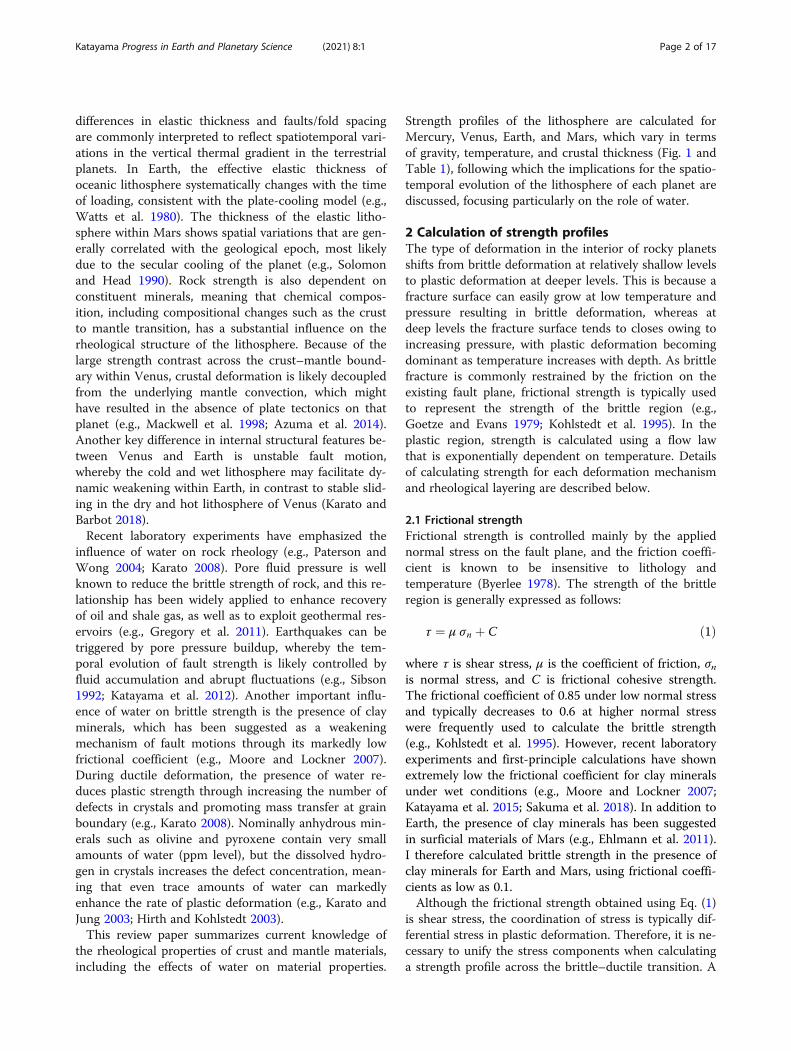
3.3 EarthFigure 6 shows the calculated strength profiles foroceanic lithosphere within Earth. The thermal structureof oceanic lithosphere is known to have an age depend-ence (e.g., McKenzie et al. 2005), and the structures calcu-lated for thermal gradients using 10 and 20 K/kmcorrespond approximately to oceanic lithosphere withages of 100 and 20 Ma, respectively. As oceanic plate coolswith increasing distance from the ocean ridge, the rigidity,and thickness of oceanic lithosphere systematically in-crease (Fig. 6). Volatile elements are generally depleted inoceanic lithosphere during magmatic differentiations (e.g.,Hirth and Kohlstedt 1996), so the dry model is appropri-ate for the rheological structure. However, recent geo-physical observations have suggested extensive hydrationalong outer-rise bending faults close to the trench (e.g.,Obana et al. 2019), which may modify the rigidity ofoceanic lithosphere as a hydrous model, giving a weak and
Fig. 3 Strength profiles for Mercury, Venus, Earth, and Mars calculated using a constant thermal gradient of 10 K/km and a constant strain rate of10−17 s−1, under both dry (red lines) and wet (blue lines) conditions. Dashed lines indicate the influence of strain rate of 10−16 and 10−18 s−1, anddotted lines indicate the brittle strength in the presence of clay minerals. As plastic strength differs between crust and mantle, the strengthprofiles show a gap across the crust–mantle boundary (Moho) in case where deformation is plastic
Katayama Progress in Earth and Planetary Science (2021) 8:1 Page 6 of 17

Fig. 4 Strength profiles for Mercury with variable thermal gradients under dry (upper panel) and wet (lower panel) conditions. Brittle strength iscalculated from Byerlee’s law, and plastic strength is calculated from flow laws using a constant strain rate of 10−17 s−1. The stress state assumestensional deformation at shallow depths that shifts to compression at greater depths. A flexural curvature of 5 × 10⁻⁷ m−1 was used for calculations.The red/blue shading indicates the bending moment, which is balanced between tensional and compressional forces within the lithosphere
Fig. 5 Strength profiles for Venus with variable thermal gradients under dry conditions. Note that strength under wet conditions is extremely lowand that the mechanical thickness is expected to be less than 1 km. Calculation parameters are the same as those for Fig. 4
Katayama Progress in Earth and Planetary Science (2021) 8:1 Page 7 of 17
relatively thin elastic layer (Fig. 6). Strength profiles of thecontinental lithosphere are highly variable, depending onthe geotherm, chemical stratification, and the distributionof water (e.g., Burov and Diament 1995). Marked strengthlayering, such as depicted in the “jelly sandwich” model,results in a weak lower crust and mechanical decouplingat the crust–mantle boundary, whereas the “crème brûlée”model predicts a weak mantle with strength being limitedto the crust (e.g., Bürgmann and Dresen 2008). Because ofthese complexities, strength profiles were calculated onlyfor oceanic lithosphere.
3.4 MarsStrength profiles within Mars for a given thermal gradientare similar to those within Mercury because of the rela-tively small gravity (Fig. 7). However, surface temperatureof the present-day Mars is much cooler than the other ter-restrial planets due to the small amounts of solar radi-ation, indicating a relatively rigid lithosphere. Grott andBreuer (2008) presented strength envelopes for variousthermal models including the influence of water, and con-cluded that rheologically significant amounts of water canbe retained in the Martian lithosphere. However, those
authors used power-law creep for flow law of plastic de-formation, which is not an appropriate mechanism nearthe brittle–ductile transition, resulting in an overesti-mation of lithospheric strength. Solomon and Head(1990) calculated the strength profile and elastic thicknessincorporating Peierls creep, but the calculations were lim-ited under dry conditions. Considering the Peierls creepand the effect of water, Azuma and Katayama (2017) sug-gested that a shallow brittle–ductile transition and lowlithospheric strength under wet conditions might havechanged to a thick and rigid plate owing to depletion ofwater during the evolution of the lithosphere in Mars.However, if clay minerals are present in shallow parts ofthe lithosphere, the markedly low frictional coefficient re-sults in a deeper brittle–ductile transition, similar to thatcalculated for the dry model, whereas the elastic layer isthinner because of the low flexural rigidity.
4 Discussion4.1 Effects of thermal gradient and water on elasticthickness and the depth of the brittle–ductile transitionThe calculated elastic thickness for each terrestrialplanet is presented in Fig. 8 as a function of thermal
Fig. 6 Strength profiles for oceanic lithosphere of Earth with variable thermal gradients under dry (upper panel) and wet (lower panel)conditions. Dotted lines in the lower panels indicate brittle strength calculated in the presence of clay minerals. Calculation parameters are thesame as those for Fig. 4
Katayama Progress in Earth and Planetary Science (2021) 8:1 Page 8 of 17

gradient for various models (the values are listed inTable 3). For all planets, a decreasing thermal gradientresults in increasing elastic thickness, although the de-pendencies are slightly different for each planet. I calcu-lated elastic thickness using strain rates ranging from10−16 to 10−18 s−1, and the variation in strain rate has arelatively minor influence on the estimated elastic thick-ness (Fig. 8). The calculated elastic thickness under dryconditions for Mercury, Earth, and Mars is highlydependent on thermal gradient, but less so for Venus.This is likely due to the lithospheric strength for Venusbeing controlled mainly by crustal material propertiesand less so by temperature (because of the relatively lowactivation energy for plagioclase). Wet models result in amarkedly thin elastic layer, and the presence of clay min-erals further decreases lithospheric strength and henceyields a smaller elastic thickness (Fig. 8). It should benoted that for Venus, the calculated elastic thicknessesunder wet conditions are smaller than the calculatedvertical resolution (1 km), even at the lowest thermalgradient. Although absolute values carry large uncertain-ties, as discussed in the following section, the relative
changes in elastic thickness with temperature and waterare robust.The depths of the brittle–ductile transition for the ter-
restrial planets are presented in Fig. 9 as a function ofthermal gradient (the values are listed in Table 4). Thebrittle–ductile transition under dry conditions changessystematically with thermal gradient, whereby a lowthermal gradient results in a stiff lithosphere and deepertransition depth. The wet model results in a markedlyshallower brittle–ductile transition than those calcu-lated for the dry model, although the presence ofclay minerals shows deeper transitional depths thanthose of wet model (Fig. 9). In the case of Earth andthe low thermal gradients for Mars, the brittle–duc-tile transitions occur at greater depths similar tothose of the dry model, as the brittle fields are ex-panded to mantle depths owing to the low frictionalcoefficient of clay minerals. In the other cases, sig-nificant weakening of wet plagioclase cancels the ef-fect of clay minerals, hence the clay model shows asimilar depth of the brittle–ductile transition to thatof the wet model at depths below the Moho.
Fig. 7 Strength profiles for Mars with variable thermal gradients under dry (upper panel) and wet (lower panel) conditions. Dotted lines in thelower panels indicate brittle strength calculated in the presence of clay minerals. Calculation parameters are the same as those for Fig. 4
Katayama Progress in Earth and Planetary Science (2021) 8:1 Page 9 of 17

Fig. 8 Effect of thermal gradient on elastic thickness for each planet for various models. Dashed, solid, and dotted lines indicate calculationresults using strain rates of 10−16, 10−17, and 10−18 s−1, respectively. In the calculations, a tensional stress field is assumed at shallow depths, whichshifts to compression at greater depths. The parameters for the calculations are listed in Tables 1 and 2
Table 3 Elastic thickness (km) calculated using strain-rate of 10-17 s-1
Model Thermal gradient (K/km)
5 7.5 10 12.5 15 17.5 20
Mercury
dry 52.6 36.0 27.5 21.8 17.5 15.0 13.3
wet 33.4 12.6 10.1 8.4 7.2 6.3 5.7
Venus
dry 29.2 19.9 15.3 12.3 8.4 7.8 7.2
Earth
dry 88.8 59.9 45.5 36.7 30.8 26.6 23.4
wet 59.4 41.0 32.6 25.8 22.0 19.0 16.8
clay 47.3 31.7 24.1 19.4 16.2 14.0 12.3
Mars
dry 74.9 51.4 39.2 31.4 24.9 21.5 19.0
wet 52.1 36.0 19.0 15.7 13.4 11.7 10.4
clay 38.0 25.5 13.2 10.9 9.2 8.0 7.1
Katayama Progress in Earth and Planetary Science (2021) 8:1 Page 10 of 17

Fig. 9 Effect of thermal gradient on the depth of the brittle–ductile transition in each planet for various models. Dashed, solid, and dotted linesindicate calculation results using strain rate of 10−16, 10−17, and 10−18 s−1, respectively. The tensional stress field is assumed at shallow depths, andthe parameters for the calculations are listed in Tables 1 and 2
Table 4 Brittle–ductile transition (km) calculated using strain-rate of 10-17 s-1
Model Thermal gradient (K/km)
5 7.5 10 12.5 15 17.5 20
Mercury
dry 75 55 43 30 26 22 20
wet 47 19 15 13 11 10 9
Venus
dry 24 19 15 9 8 7 6
Earth
dry 75 57 46 39 34 30 27
wet 41 34 29 25 22 20 19
clay 83 60 48 39 34 29 26
Mars
dry 110 78 62 46 39 34 30
wet 74 40 32 27 23 20 18
clay 110 78 40 33 27 24 21
Katayama Progress in Earth and Planetary Science (2021) 8:1 Page 11 of 17
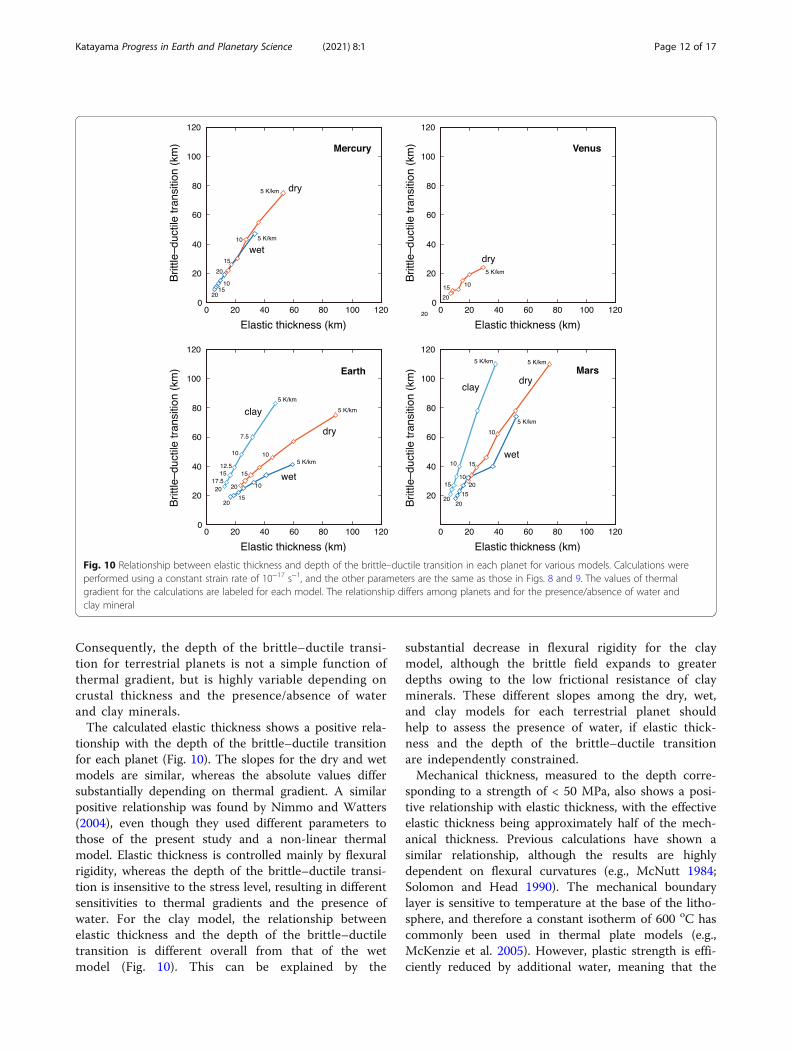
Consequently, the depth of the brittle–ductile transi-tion for terrestrial planets is not a simple function ofthermal gradient, but is highly variable depending oncrustal thickness and the presence/absence of waterand clay minerals.The calculated elastic thickness shows a positive rela-
tionship with the depth of the brittle–ductile transitionfor each planet (Fig. 10). The slopes for the dry and wetmodels are similar, whereas the absolute values differsubstantially depending on thermal gradient. A similarpositive relationship was found by Nimmo and Watters(2004), even though they used different parameters tothose of the present study and a non-linear thermalmodel. Elastic thickness is controlled mainly by flexuralrigidity, whereas the depth of the brittle–ductile transi-tion is insensitive to the stress level, resulting in differentsensitivities to thermal gradients and the presence ofwater. For the clay model, the relationship betweenelastic thickness and the depth of the brittle–ductiletransition is different overall from that of the wetmodel (Fig. 10). This can be explained by the
substantial decrease in flexural rigidity for the claymodel, although the brittle field expands to greaterdepths owing to the low frictional resistance of clayminerals. These different slopes among the dry, wet,and clay models for each terrestrial planet shouldhelp to assess the presence of water, if elastic thick-ness and the depth of the brittle–ductile transitionare independently constrained.Mechanical thickness, measured to the depth corre-
sponding to a strength of < 50 MPa, also shows a posi-tive relationship with elastic thickness, with the effectiveelastic thickness being approximately half of the mech-anical thickness. Previous calculations have shown asimilar relationship, although the results are highlydependent on flexural curvatures (e.g., McNutt 1984;Solomon and Head 1990). The mechanical boundarylayer is sensitive to temperature at the base of the litho-sphere, and therefore a constant isotherm of 600 oC hascommonly been used in thermal plate models (e.g.,McKenzie et al. 2005). However, plastic strength is effi-ciently reduced by additional water, meaning that the
Fig. 10 Relationship between elastic thickness and depth of the brittle–ductile transition in each planet for various models. Calculations wereperformed using a constant strain rate of 10−17 s−1, and the other parameters are the same as those in Figs. 8 and 9. The values of thermalgradient for the calculations are labeled for each model. The relationship differs among planets and for the presence/absence of water andclay mineral
Katayama Progress in Earth and Planetary Science (2021) 8:1 Page 12 of 17

mechanical thickness is also sensitive to the presence ofwater.
4.2 Sensitivity and uncertaintiesUsing the analytical models of elastic lithosphere pre-sented above, it is possible to capture simplified repre-sentations of the lithosphere and calculate its elasticthickness as well as the depth of the brittle–ductile tran-sition. However, the calculations include various uncer-tainties introduced by the simplifying assumptions madeto obtain the strength profiles of the terrestrial planets,as discussed below.The assumption of a linear thermal gradient is not com-
pletely realistic, as thermal conductivity is dependent ontemperature and porosity, and the concentration of heat-producing elements are also dependent on chemical com-positions. The thermal structure on Earth is known tohave a non-linear concave-upward profile (e.g., McKenzieet al. 2005), and therefore the thermal gradient becomessmaller with depth, resulting in a stiffer lithosphere thanthat calculated using a constant thermal gradient. Thethermal conductivity of crust is typically less than that ofmantle (e.g., Petitjean et al. 2006), which may also contrib-ute to a non-linear thermal gradient across the crust–mantle boundary.Strain rate is another source of uncertainty in calcula-
tions of plastic strength. The strain rate during the de-formation of a planet’s interior is mostly in the range10−16 to 10−19 s−1 (e.g., Nimmo and McKenzie 1998),and an average strain rate of 10−17 s−1 was used here.This range leads to a large difference in the plasticstrength determined by power-law creep; however, if de-formation is controlled by Peierls creep, the exponentialdependence of strain rate on stress results in a relativelyminor influence of strain rate on the plastic strength.Diffusion creep has a relatively minor influence on litho-spheric strength if the grain size is larger than 1 mm, al-though a smaller grain size enhances the rate of diffusioncreep and may result in a weaker plastic strength. Grainboundary sliding has been highlighted recently as playingan important role on strain localization (e.g., Hansen et al.2011). However, this mechanism is predominant betweendislocation and diffusion creeps, and has a minor influ-ence on the overall strength of the lithosphere.Considerable uncertainty in the strength profile can
arise from variation in crustal thickness in the terrestrialplanets. Plastic strength is dependent on material com-position and is therefore sensitive to the crust–mantleboundary, whereas brittle strength is less sensitive to therock type. Because of the large mineralogical variation incrustal materials, the plastic strength of the crust is lesstightly constrained than that of the mantle. This studyemployed the flow law for plagioclase, which is mostlikely the weakest major constituent minerals in crustal
materials; however, quartz shows a significant hydraulicweakening that may enhance the rate of ductile deform-ation for silica-rich materials under hydrous conditions(e.g., Paterson 1989). The rheology of clinopyroxene, whichexhibits a strength intermediate between plagioclase andmantle olivine, has in some cases been used as an analogfor basaltic crust, (e.g., Kirby and Kronenberg 1984).In the calculation of brittle strength, the frictional co-
efficient was assumed to be constant. However, chemicalreactions may be facilitated along fault zones, whereaqueous fluids can penetrate, which might result in thelocal presence of hydration products such as clay min-erals. Spatial scaling of such reaction zones has a markedimpact on brittle strength, with interconnected weakzones likely controlling the overall strength of the litho-sphere. It is noted that a low frictional coefficient of clayminerals has been reported under fluid-saturated and/orhigh-humidity environments, but a relatively high fric-tional coefficient similar to that of Byerlee’s law underdry conditions (e.g., Behnsen and Faulkner 2012;Tetsuka et al. 2018). Accordingly, the presence of clayminerals on fluid-saturated fault planes may facilitatefrictional sliding and reduce the brittle strength of thelithosphere, whereas drained and dry conditions maycause temporal changes in brittle strength.For plastic deformation, water-saturated flow laws de-
termined from laboratory experiments at a pressure of ~2 GPa were used (e.g., Karato and Jung 2003). However,the influence of water depends on the water contents incrystals, which commonly increases with pressure (e.g.,Kohlstedt et al. 1996). Consequently, the influence ofwater on plastic strength could be underestimated atgreater depths and overestimated under conditions ofpartial saturation. Hydrous minerals such as serpentinemay further decrease plastic strength (e.g., Hilairet et al.2007; Chernak and Hirth 2010). However, the flow lawand deformation mechanism of these minerals are stillunclear, and further experimental-derived constraintsare needed.Calculation of elastic thickness from a strength profile
is highly dependent on flexural curvature. The curvatureis commonly inferred from the second derivative ofgravity/topography admittance data, which are highlyvariable even in the same tectonic domain (e.g., McNutt1984). Bending moments are dominant in those parts ofthe vertical profile with the maximum strength, so max-imum values of curvature have commonly been used forcalculations. A constant curvature of 5 × 10⁻⁷ m−1 wasused here, although it could vary for different features inthese planets. Previous modeling have shown that anorder of magnitude lower curvature results in a nearlyhalf elastic thickness (e.g., Solomon and Head 1990;Katayama et al. 2019). If the elastic layer is subjected toadditional force, the stress state in the lithosphere can
Katayama Progress in Earth and Planetary Science (2021) 8:1 Page 13 of 17

change. This also causes corresponding changes in theequivalent elastic thickness, but such effects are highlyuncertain and were disregarded here.In contrast to elastic thickness, the depth of the brit-
tle–ductile transition is less sensitive to these parametersand is rather well constrained under a given thermalstructures. Brittle strength is dependent on the stressfield, whereby the strength calculated for the tensionalfield is roughly half that for the compressional field, as aresult of the lithostatic pressure corresponding to themaximum principal stress in tension. Although it wasassumed here that the tensional stress field correspondsto the strength profile, winkle ridge deformation is pos-sibly attributable to shortening and compression, mean-ing that brittle strength could be doubled in suchcompressional regions, indicating a shallower transitiondepth from the brittle to ductile deformation.
4.3 Internal structure and evolution of the terrestrialplanetsLittle is known about the internal structure of Mercurybecause of limited radar and stereo coverage. One of thefew clues for assessing the physical state is the existence oflobate scarps, which likely developed in response to ther-mal contraction (e.g., Watters et al. 1998). Topographicprofiles of the lobate scarps indicate that thrust faultingextended to depths of 30–40 km, corresponding to a lowerlimit for the brittle–ductile transition (Watters et al.2002). Assuming the limiting isotherm for Mercury, Wat-ters et al. (2002) suggested a paleo-thermal gradient in theranges of 3–11 K/km. Our calculations of the brittle–duc-tile transition for Mercury are highly dependent on themodel used, with 8–10 K/km for the dry model and 5–6K/km for the wet model, to explain the observed transi-tion depth. Nimmo and Watters (2004) estimated an ef-fective elastic thickness of 25–30 km using a yieldstrength envelope model, similar to the approach taken inthe present study. The slope of the brittle–ductile transi-tional depth and elastic thickness is similar between thedry and wet models (Fig. 10), consistent with the observedrelationship, although it is difficult to distinguish these ef-fects in the Mercury’s lithosphere. Another estimate usingwrinkle ridges in Caloris basin implies an elastic thicknessof ~ 100 km (Melosh and McKinnon 1988), which far ex-ceeds the thickness inferred from the lobate scarps. As thewrinkle ridge structures were probably formed before thethrust faulting related to the lobate scarps, they cannot beexplained by secular cooling (Nimmo and Watters 2004).The discrepancy between the two estimates may reflect adifferent curvature in these features or the local depletionof water, particularly at the time of the wrinkle ridgeformation.Although there is no clear evidence for plate tectonics
on Venus, extensive deformational landforms have been
observed on the surface (e.g., Campbell et al. 1984;Zuber and Parmentier 1995). Admittance data from theMagellan mission indicate a long-wavelength range ofelastic thickness of ~ 20–30 km (Barnett et al. 2000),consistent with most previous flexural modeling(Johnson and Sandwell 1994). These estimates are simi-lar to those observed in shields and ancient ocean basinson Earth, although the surface temperature of Venus ismuch higher than that of Earth, suggesting that thelithosphere of Venus is dry and maintains an elastic coreeven at the higher temperatures (Barnett et al. 2000).Fault motion is slow and stable under dry conditions,whereas unstable slip and dynamic weakening can occurin fluid-bearing fault zones; hence, the dry lithosphere inVenus might lead to strong plates and promote stagnantlid convection (Karato and Barbot 2018). The drystrength model calculated in the present study requires athermal gradient of 4–8 K/km to explain the observedranges of elastic thickness in Venus, indicating that thesefeatures occurred during the later history of Venus, mostlikely after global resurfacing events. Using inelastic flex-ure modeling, Brown and Grimm (1997) calculated ther-mal gradients as low as 4 K/km for Artemis Chasm, alarge circular structure in Aphrodite Terra, to accountfor the absence of flexurally induced faulting and thebending moment of thick lithosphere. In contrast, rela-tively old surface features such as tessera suggest thin-skin tectonics with very short-wavelength features andhence a shallow brittle–ductile transition (Phillips andHansen 1998). As the brittle–ductile transition is sensi-tive to temperature gradient, this difference is likely at-tributable to the internal thermal structures formingthese features. The simplest model accounting for theseobservations is a transition from thin, hot lithosphereduring the early history of Venus to thick, cold litho-sphere as a result of planetary cooling (e.g., Nimmo andMcKenzie 1998). Another possible scenario is hydraulicweakening of crustal rocks during the early history ofthe planet, as vigorous volcanic activity prior to or dur-ing resurfacing may have released substantial amountsof water to the surface. Grinspoon (1993) suggested thatthe high abundance ratio of deuterium to hydrogen inthe atmosphere of Venus can be explained by efficientvolcanic outgassing during this period, although this isstill an open question.Plate tectonics on Earth occur as an outermost layer
that acts as a mechanically rigid plate that is decoupledfrom the convecting mantle. Characteristics of thestrong outer layer have been determined from litho-spheric flexures caused by long-term surface loads suchas ice sheets, oceanic islands, and subduction trenches(e.g., Watts and Burov 2003). Although the elastic layerbeneath continents is highly variable owing to complextectonic features, the effective elastic thickness of
Katayama Progress in Earth and Planetary Science (2021) 8:1 Page 14 of 17

oceanic lithosphere shows a systematic correlation withtime of loading (e.g., Watts et al. 1980; Bodine et al.1981; McNutt 1984). An increase in elastic thicknesswith age is commonly considered as oceanic lithospherecools over time and becomes more rigid in its responseto surface loading. The depth of the brittle–ductile tran-sition is also related to the age of oceanic lithosphere, asinferred from the lower limit of intraplate earthquakes,consistent with a plate-cooling model (e.g., McKenzieet al. 2005). These mechanical models of oceanic litho-sphere allow elastic stresses to be transmitted over largedistances and enable the plate to move as a rigid capabove the convecting mantle, bounded by faults at sub-duction trenches. However, recent detailed modeling ofplate flexure beneath the Hawaiian Ridges has shown alarge deficit in lithospheric strength using conventionalpower-law creep (Pleus et al. 2020), and has suggestedthat the flexural rigidity is controlled mainly by low-temperature plasticity (Peierls creep), as was calculatedin the present study. Although the dry model can mostlyaccount for the observed elastic thickness in the oceaniclithosphere, the thin elastic layer found in several deep-sea trenches cannot be explained by this model, possiblybecause of the weakening due to sea-water penetrationinto the lithosphere. Seismic reflection and refractionsurveys have recently shown low-velocity anomalies evenin the oceanic mantle, possibly due to water infiltrationalong the outer-rise faults (e.g., Fujie et al. 2013). As ser-pentinite, a product of mantle hydration, is known to besignificantly weaker than anhydrous minerals (e.g., Hilairetet al. 2007; Reynard 2013; Hirauchi and Katayama 2015),the plate hydration in these regions is likely responsiblefor decreasing the thickness of the effective elastic layer.Various missions to Mars have shown a hemispheric
dichotomy in topographic and tectonic features, with thepresence of a wide contrast between the high-standingsouthern hemisphere and the low-lying northern hemi-sphere (e.g., Zuber 2001). The hemispheric dichotomy isconsidered to reflect differing crust and mantle structure,whereby crustal thickness in the southern hemisphere isconsiderably greater than that in the northern hemisphere,except beneath large impact craters (Neumann et al.2004). Elastic thickness is also correlated with these topo-graphic variations, in which the southern hemisphere ex-hibits a relatively thin elastic layer (e.g., McGovern et al.2004). As plastic strength is dependent on lithology, athick crust can result in weak lithospheric strength owingto the weaker plastic strength of plagioclase comparedwith olivine, which partly explains the difference in theobserved elastic thickness. An extremely thick elastic layerhas been reported for the northern polar cap (up to 300km), which may be due to a subchondritic composition inradioactive heat sources or the presence of mantle upwell-ing in the other regions of Mars (Phillips et al. 2008; Grott
et al. 2013). In addition to these compositional variations,the elastic thickness is highly sensitive to internal thermalstructures and hence to the time of loading to create thegravitational/topographic anomalies. A low temperaturegradient leads to a stiff lithosphere, resulting in a thickelastic layer (Fig. 8), so that the temporal change due tothe lithosphere cooling is another important source ofvariation in elastic thickness (e.g., Solomon and Head1990; Grott and Breuer 2008; Ruiz et al. 2011). The pres-ence of water and clay minerals can also lead to variationin the elastic thickness, as indicated in our models. Theextremely thin elastic thickness of < 10 km observed inthe Noachian terranes, such as Noachis Terra and TerraCimmeria, can be attributed to a significant amount ofwater in these relatively old regions, whereby volatile ele-ments might have been incorporated during accretion(e.g., Dreibus and Wänke 1987) or transported by platesubduction during the early evolution of Mars (e.g., Sleep1994). However, lithospheric stress can change with timeowing to viscous relaxation, and caution must be exer-cised when interpreting these deformational features inold terranes (e.g., Grott et al. 2013). The lateral spacing ofwrinkle ridges suggests a rigid lithosphere in the northernhemisphere, where the transition from brittle to ductiledeformation occurs at a greater depth than in the south-ern highlands (Montesi and Zuber 2003). The northernplains are characterized by a relatively thick elastic layer,so the positive correlation between the elastic thicknessand the depth of the brittle–ductile transition is consistentwith our models shown in Fig. 10. Although Montesi andZuber (2003) suggested that the difference in the depth ofthe brittle–ductile transition is associated with the differ-ence of crustal thickness, the appearance of water in thelithosphere can also contribute to the variation of the brit-tle–ductile transition. One of the main objectives of theon-going InSight mission is to detect Marsquakes andtheir depth distributions (e.g., Giardini et al. 2020), resultsof which may help identify the local presence/absence ofwater in the Martian lithosphere.
5 ConclusionsStrength profiles were calculated for the terrestrialplanets using a recently updated flow law and consider-ing the effect of water. Using these models, it was pos-sible to constrain the lithospheric strengths of thedifferent planets and to calculate elastic thickness andthe depth of the brittle–ductile transition. Althoughthese models present the maximum strength of therocks, assuming a simple mineralogical stratification anddeforming at a constant strain rate, they are useful forexplaining the large-scale deformation features capturedby surface topographic and gravity data for the terrestrialplanets. I suggest that these features are highly sensitiveto the thermal gradient as well as the presence of water
Katayama Progress in Earth and Planetary Science (2021) 8:1 Page 15 of 17

in the lithosphere. Temporal changes in elastic thicknesscan be explained by secular cooling of planets; however,the extremely thin elastic layer in early Mars cannot beexplained by temperature alone and might have beenpromoted by the presence of water possibly with clayminerals. The relatively shallow brittle–ductile transitionwithin Mercury, as inferred from lobate scarp structures,might also be associated with the local presence ofwater. Recent orbiting satellite and rover missions haveprovided data showing various structures and spatiotem-poral heterogeneity in deformational features of Mars.Given the sensitivity of the obtained strength models totemperature and water, these data should help to pro-vide a more detailed understanding of the internal struc-ture and evolution of these terrestrial planets.
AcknowledgementsI thank Shintaro Azuma, Keishi Okazaki, Ken-ichi Hirauchi, and Yhuki Matsuokafor fruitful discussions. Comments from Editors (Shun-ichiro Karato) and twoanonymous reviewers greatly improved the paper. I also thank the Nishidaprize committee at JpGU for their encouragement to prepare this reviewarticle.
Author’s contributionsI.K. conducted the calculations and wrote the manuscript. The author readand approved the final manuscript.
FundingThis work was supported by JSPS KAKENHI Grant Numbers 18H03733 and20H00200.
Availability of data and materialsData sharing is not applicable to this article as no datasets were generatedor analyzed during the current study. Please contact the correspondingauthor for data requests.
Competing interestsThe author declares no competing interests.
Received: 28 June 2020 Accepted: 3 November 2020
ReferencesAzuma S, Katayama I (2017) Evolution of the rheological structure of Mars. Earth
Planets Space 69:8. https://doi.org/10.1186/s40623-016-0593-zAzuma S, Katayama I, Nakakuki T (2014) Rheological decoupling at the Moho and
implication to Venusian tectonics. Sci Rep 4:4403. https://doi.org/10.1038/srep04403
Barnett DN, Nimmo F, McKenzie D (2000) Elastic thickness estimates for Venususing line of sight accelerations from magellan cycle 5. Icarus 146:404–419.https://doi.org/10.1006/icar.2000.6352
Behnsen J, Faulkner DR (2012) The effect of mineralogy and effective normalstress on frictional strength of sheet silicates. J Struct Geol 42:49–61. https://doi.org/10.1016/j.jsg.2012.06.015
Bodine J, Steckler H, Watt MS (1981) Observations of flexure and the rheology ofthe oceanic lithosphere. J Geophys Res 86:3695–3707. https://doi.org/10.1029/JB086iB05p03695
Brown CD, Grimm RE (1997) Tessera deformation and contemporaneous thermalstate of the plateau highlands, Venus. Earth Planet Sci Lett 147:1–10.https://doi.org/10.1016/S0012-821X(97)00007-1
Bürgmann R, Dresen G (2008) Rheology of the Lower Crust and Upper Mantle:Evidence from Rock Mechanics, Geodesy, and Field Observations. Annu RevEarth Planet Sci 36:531–677. https://doi.org/10.1146/annurev.earth.36.031207.124326
Burov EB, Diament M (1995) The effective elastic thickness (Te) of continentallithosphere: What does it really mean? J Geophys Res 100:3905–3927.https://doi.org/10.1029/94JB02770
Byerlee J (1978) Friction of rocks. Pure Apply Geophys 116:615–626. https://doi.org/10.1007/BF00876528
Campbell D, Head J, Harmon J, Hine A (1984) Venus: Volcanism and riftformation in Beta Regio. Science 226:167–170. https://doi.org/10.1126/science.226.4671.167
Chernak LJ, Hirth G (2010) Deformation of antigorite serpentinite at hightemperature and pressure. Earth Planet Sci Lett 296:23–33. https://doi.org/10.1016/j.epsl.2010.04.035
Dreibus G, Wänke H (1987) Volatiles on Earth and Mars–A comparison. Icarus 71:225–240. https://doi.org/10.1016/0019-1035(87)90148-5
Ehlmann BL, Mustard JF, Murchie SL, Bibring JP, Meunier A, Fraeman AA,Langevin Y (2011) Subsurface water and clay mineral formation during theearly history of Mars. Nature 479:53–60. https://doi.org/10.1038/nature10582
Frost HJ, Ashby MF (1982) Deformation-mechanism maps: The plasticity andcreep of metals and ceramics, Oxford: Pergamon Press, p 166.
Fujie G, Kodaira S, Yamashita M, Sato T, Takahashi T, Takahashi N (2013)Systematic changes in the incoming plate structure at the Kuril trench.Geophys Res Lett 40:88–93. https://doi.org/10.1029/2012GL054340
Giardini D et al (2020) The seismicity of Mars. Nature Geoscience 13:205–212.https://doi.org/10.1038/s41561-020-0539-8
Goetze C, Evans B (1979) Stress and temperature in the bending lithosphere asconstrained by experimental rock mechanics. Geophys J R 59:463–478.https://doi.org/10.1111/j.1365-246X.1979.tb02567.x
Gregory K, Vidic R, Dzombak D (2011) Water management challenges associatedwith the production of shale gas by hydraulic fracturing. Elements 7:181–186.https://doi.org/10.2113/gselements.7.3.181
Grinspoon DH (1993) Implications of the high deuterium-to-hydrogen ratio forthe sources of water in Venus’ atmosphere. Nature 363:428–431. https://doi.org/10.1038/363428a0
Grott M, Breuer D (2008) The evolution of the Martian elastic lithosphere andimplications for crustal and mantle rheology. Icarus 193:503–515. https://doi.org/10.1016/j.icarus.2007.08.015
Grott M et al (2013) Long-term evolution of the Martian crust-mantle system.Space Sci Rev 174:49–111. https://doi.org/10.1007/s11214-012-9948-3
Gueguen Y, Palciauskas V (1994) Introduction to the Physics of Rocks. PrincetonUniversity Press, Princeton, p 296
Hansen LN, Zimmerman ME, Kohlstedt DL (2011) Grain-boundary sliding in SanCarlos olivine: Flow-law parameters and crystallographic-preferredorientation. J Geophys Res 116:B08201. https://doi.org/10.1029/2011JB008220
Hilairet N, Reynard B, Wang Y, Daniel I, Merkel S, Nishiyama N, Petitgirard S(2007) High-pressure creep of serpentine, interseismic deformation, andinitiation of subduction. Science 318:1910–1913. https://doi.org/10.1126/science.1148494
Hirauchi K, Katayama I (2015) Rheological properties of serpentinite and theirtectonic significance. J Geography 124:371–396. (in Japanese with Englishabstract). https://doi.org/10.5026/jgeography.124.371
Hirth G, Kohlstedt DL (1996) Water in the oceanic upper mantle: Implications forrheology, melt extraction and the evolution of the lithosphere. Earth PlanetSci Lett 144:93–108. https://doi.org/10.1016/0012-821X(96)00154-9
Hirth G, Kohlstedt DL (2003) Rheology of the Upper Mantle and the MantleWedge: A View from the Experimentalists. Geophys Monogr 138:83–105.https://doi.org/10.1029/138GM06
Johnson CL, Sandwell DT (1994) Lithospheric flexure on Venus. Geophys J Inter119:627–647. https://doi.org/10.1111/j.1365-246X.1994.tb00146.x
Karato S (2008) Deformation of Earth Materials: An introduction to the rheologyof solid Earth., 463 p, Cambridge: Cambridge University Press.
Karato S, Barbot S (2018) Dynamics of fault motion and the origin of contrastingtectonic style between Earth and Venus. Sci Rep 8. https://doi.org/10.1038/s41598-018-30174-6
Karato S, Jung H (2003) Effects of pressure on high-temperature dislocation creepin olivine. Phil Mag A83:401–414. https://doi.org/10.1080/0141861021000025829
Katayama I, Azuma S (2017) Effect of water on rock deformation and rheologicalstructures of continental and oceanic plates. J Geol Soc Japan 123:365–377.(in Japanese with English abstract). https://doi.org/10.5575/geosoc.2017.0019
Katayama I, Karato S (2008) Low-temperature, high-stress deformation of olivineunder water-saturated condition. Phys Earth Planet Inter 168:125–133.https://doi.org/10.1016/j.pepi.2008.05.019
Katayama I, Kubo T, Sakuma H, Kawai K (2015) Can clay minerals account for thebehavior of non-asperity on the subducting plate interface? Prog EarthPlanet Sci 2. https://doi.org/10.1186/s40645-015-0063-4
Katayama Progress in Earth and Planetary Science (2021) 8:1 Page 16 of 17

Katayama I, Matsuoka Y, Azuma S (2019) Sensitivity of elastic thickness to waterin the Martian lithosphere. Prog Earth Planet Sci 6. https://doi.org/10.1186/s40645-019-0298-6
Katayama I, Terada T, Okazaki K, Tanikawa W (2012) Episodic tremor and slow slippotentially linked to permeability contrasts at the Moho. Nature Geo 5:731–734. https://doi.org/10.1038/ngeo1559
Kirby SH, Kronenberg AK (1984) Deformation of clinopyroxenite: evidence for atransition in flow mechanisms and semibrittle behavior. J Geophys Res 89:3177–3192. https://doi.org/10.1029/JB089iB05p03177
Kohlstedt D, Evans B, Mackwell S (1995) Strength of the lithosphere: Constraintsimposed by laboratory experiments. J Geophys Res 100:17587–17602.https://doi.org/10.1029/95JB01460
Kohlstedt DL, Keppler H, Rubie DC (1996) Solubility of water in the α, β and γphases of (Mg,Fe)2SiO4. Contrib Mineral Petrol 123:345–357. https://doi.org/10.1007/s004100050161
Mackwell S, Zimmerman M, Kohlstedt D (1998) High-temperature deformation ofdry diabase with application to tectonics on Venus. J Geophys Res 103:975–984. https://doi.org/10.1029/97JB02671
McGovern PJ, Solomon SC, Smith DE, Zuber MT, Simons M, Wieczorek MA,Phillips RJ, Neumann GA, Aharonson O, Head JW (2004) Correction to“Localized gravity/topography admittance and correlation spectra on Mars:Implications for regional and global evolution”. J Geophys Res 107:5418.https://doi.org/10.1029/2004JE002286
McKenzie D, Jackson J, Priestley K (2005) Thermal structure of oceanic andcontinental lithosphere. Earth Planet Sci Lett 233:337–349. https://doi.org/10.1016/j.epsl.2005.02.005
McNutt MK (1984) Lithospheric Flexure and Thermal Anomalies. J Geophys Res89:11180–11194. https://doi.org/10.1029/JB089iB13p11180
Melosh HJ, McKinnon WB (1988) The tectonics of Mercury. Mercury, edited byVilas F, Chapman CR, Matthews MS. University of Arizona Press, Tucson, pp374–400
Montesi LG, Zuber MT (2003) Clues to the lithospheric structure of Mars fromwrinkle ridge sets and localization instability. J Geophys Res 108:5048.https://doi.org/10.1029/2002JE001974
Moore DE, Lockner DA (2007) Friction of the smectite clay montmorillonite. TheSeismogenic Zone of Subduction Thrust Faults, edited by Dixon T, Moore C.Columbia Univ. Press, New York, pp 317–345
Neumann GA et al (2004) Crustal structure of Mars from gravity and topography.J Geophys Res 109:E08002. https://doi.org/10.1029/2004JE002262
Nimmo F, McKenzie D (1998) Volcanism and tectonics on Venus. Annu Rev EarthPlanet Sci 26:23–51. https://doi.org/10.1146/annurev.earth.26.1.23
Nimmo F, Watters TR (2004) Depth of faulting on Mercury: implications for heatflux and crustal and effective elastic thickness. Geophys Res Lett 31:L02701.https://doi.org/10.1029/2003GL018847
Obana K, Fujie G, Takahashi T, Yamamoto Y, Tonegawa T, Miura S, Kodaira S(2019) Seismic velocity structure and its implications for oceanic mantlehydration in the trench–outer rise of the Japan Trench. Geophys J Int:1629–1642. https://doi.org/10.1093/gji/ggz099
Paterson MS (1989) The interaction of water with quartz and its influence indislocation flow–an overview. In: Karato S, Toriumi M (eds) Rheology ofSolids and of the Earth. Oxford Univ. Press, New York, pp 107–142
Paterson MS, Wong T (2004) Experimental Rock Deformation, The Brittle Field.Springer-Verlag, New York, p 347
Petitjean S, Rabinowicz M, Grégoire M, Chevrot S (2006) Differences betweenArchean and Proterozoic lithospheres: Assessment of the possible major roleof thermal conductivity. Geochem Geophys Geosyst 7:Q03021. https://doi.org/10.1029/2005GC001053
Phillips RJ, Hansen VL (1998) Geological evolution of Venus: Rises, plains, plumes,and plateaus. Science 279:1492–1497. https://doi.org/10.1126/science.279.5356.1492
Phillips RJ et al (2008) Mars north polar deposits: Stratigraphy, age, andgeodynamical response. Science 320:1182–1185. https://doi.org/10.1126/science.1157546
Pleus A, Ito G, Wessel P, Frazer LN (2020) Rheology and thermal structure of thelithosphere beneath the Hawaiian Ridge inferred from gravity data andmodels of plate flexure. Geophys J Inter 222:207–224. https://doi.org/10.1093/gji/ggaa155
Ranalli G (1992) Rheology of the Earth, 409 p, London: Chapman and Hall.Reynard B (2013) Serpentine in active subduction zones. Lithos 178:171–185.
https://doi.org/10.1016/j.lithos.2012.10.012
Ruiz J, McGovern PJ, Jimenénez-Díaz A, López V, Williams JP, Hahn BC, Tejero R(2011) The thermal evolution of Mars as constrained by paleoheat flows.Icarus 215–508–517. https://doi.org/10.1016/j.icarus.2011.07.029.
Rybacki E, Dresen G (2000) Dislocation and diffusion creep of synthetic anorthiteaggregates. J Geophys Res 105:26017–26036. https://doi.org/10.1029/2000JB900223
Sakuma H, Kawai K, Katayama I, Suehara S (2018) What is the origin ofmacroscopic friction? Science Advances 4. https://doi.org/10.1126/sciadv.aav2268
Shelton GL (1981) Experimental deformation of single phase and polyphasecrustal rocks at high pressures and temperatures. Providence: PhD thesis,Brown University.
Sibson RH (1992) Implications of fault-valve behavior for rupture nucleation andrecurrence. Tectonophys 211:283–293. https://doi.org/10.1016/0040-1951(92)90065-E
Sleep NH (1994) Martian plate tectonics. J Geophys Res 99:5639–5655. https://doi.org/10.1029/94JE00216
Solomon SC, Head JW (1990) Heterogeneities in the thickness of the elasticlithosphere of Mars: Constraints on heat flow and internal dynamics. JGeophys Res 95:11073–11083. https://doi.org/10.1029/JB095iB07p11073
Tetsuka H, Katayama I, Sakuma H, Tamura K (2018) Effects of humidity andinterlayer cations on the frictional strength of montmorillonite. Earth PlanetSpace 70:56. https://doi.org/10.1186/s40623-018-0829-1
Tsenn MC, Carter NL (1987) Upper limits of power law creep in rocks.Tectonophys 136:1–26. https://doi.org/10.1016/0040-1951(87)90332-5
Watters T, Schultz R (2009) Planetary Tectonics. Cambridge University Press.https://doi.org/10.1017/CBO9780511691645
Watters TR, Robinson MS, Cook AC (1998) Topography of lobate scarps onMercury: new constraints on the planet’s contraction. Geology 26:991–994.https://doi.org/10.1130/0091-7613
Watters TR, Schultz RA, Robinson MS, Cook AC (2002) The mechanical andthermal structure of Mercury's early lithosphere. Geophys Res Lett 29:1542.https://doi.org/10.1029/2001GL014308
Watts AB, Bodine JH, Steckler MS (1980) Observations of flexure and the state ofstress in the oceanic lithosphere. J Geophys Res 85:5369–6376. https://doi.org/10.1029/JB085iB11p06369
Watts AB, Burov EB (2003) Lithospheric strength and its relationship to the elasticand seismogenic layer thickness. Tectonophys 213:113–131. https://doi.org/10.1016/S0012-821X(03)00289-9
Yamazaki D, Karato S (2002) Fabric development in (Mg,Fe)O during large strain,shear deformation: Implications for seismic anisotropy in Earth’s lowermantle. Phys Earth Planet Int 131:251–267. https://doi.org/10.1016/S0031-9201(02)00037-7
Zuber M, Parmentier E (1995) Formation of fold-and-thrust belts on Venus bythick-skinned deformation. Nature 377:704–707. https://doi.org/10.1038/377704a0
Zuber MT (2001) The crust and mantle of Mars. Nature 412:220–227. https://doi.org/10.1038/35084163
Publisher’s NoteSpringer Nature remains neutral with regard to jurisdictional claims inpublished maps and institutional affiliations.
Katayama Progress in Earth and Planetary Science (2021) 8:1 Page 17 of 17