strength in numbers: the duke infection control …
TRANSCRIPT

dcasip.medicine.duke.edu
STRENGTH IN NUMBERS: THE DUKE INFECTION CONTROL OUTREACH NETWORK (DICON) APPROACH
DEVERICK J. ANDERSON, MD, MPH, FIDSA, FSHEA
ACIPC – NOVEMBER 2017
Disclosures
Research grants – AHRQ, NIH/NIAID, CDC
Royalties – UpToDate

Disclosures
Outline
The “DICON Model” for infection prevention ▪ Expanding the enterprise – eDICON
The Duke Antimicrobial Stewardship Outreach Network (DASON)
Using the DICON model for research
Principles Related to Our Success
1. Personal relationships are paramount
2. All parties have to have “skin in the game”
3. One size does not fit all
4. Our staff is our most important resource
5. Data must be accurate
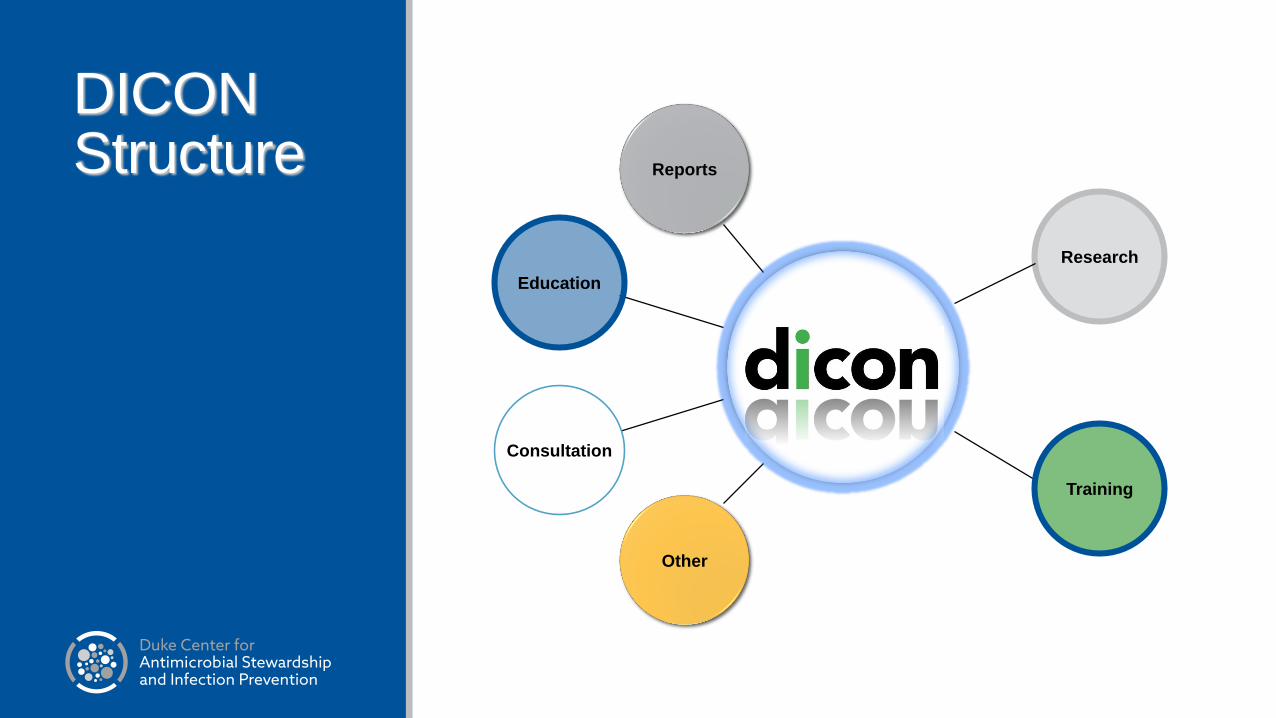
DICON Structure
Research
Reports
Other
Training
Consultation
Education
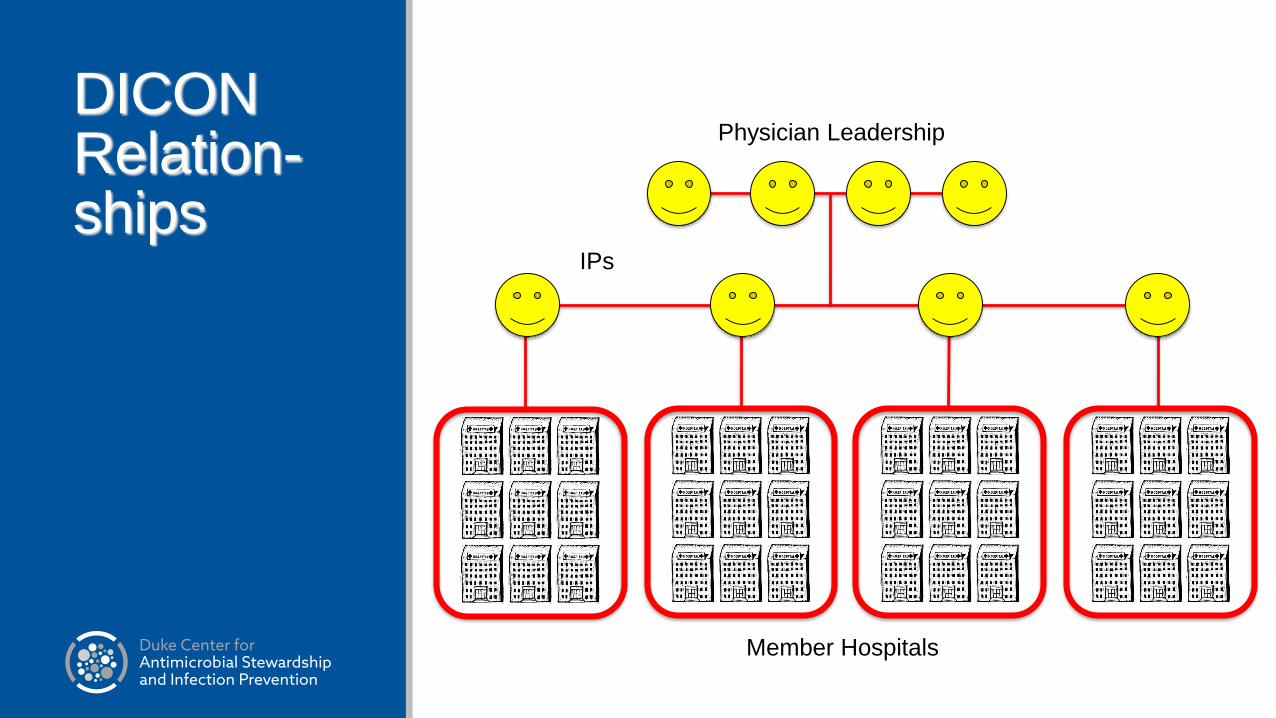
DICON Relation-ships
Physician Leadership
IPs
Member Hospitals

DICON Relation-ships
Physician Leadership
IPs
Member Hospitals

DICONWhat is it? Contractually based collaboration with 46 Hospitals and Surgery Centers in 6 states in the southeastern US
Focus: community hospitals with limited resources▪ <25% of member hospitals have access to ID consultants
Affiliated hospitals range from 38 to 638 beds with mean of 175, total beds > 9,000 and total ICPs > 60. ▪ Does not include Duke University Hospital
Goal: help member hospitals implement best infection control practices
Approach: Infection Control Consultative Services

DICONProvide hospitals and surgery centers with regular and timely information on best practices, best technology, and educational programs on infection control
Core services▪ Monthly visits from IPs▪ Educational Programs for Infection Control Professionals and Healthcare Providers▪ Prevention Initiatives▪ Data collection, analysis, and benchmarking
▪ Local Ips have access to their hospital’s database through local interface▪ Mandatory reporting of data with NHSN
Core services designed to motivate and stimulate physicians, nurses, and other HCPs to do the right thing
Special projects outside DICON core services

Key Component of Model
Regular (at least monthly) visits to site by liaison IP for “hands on” activity▪ Crucial for relationship building
▪ The “face of DICON”
▪ Agenda set by local IP
▪ Range of activities
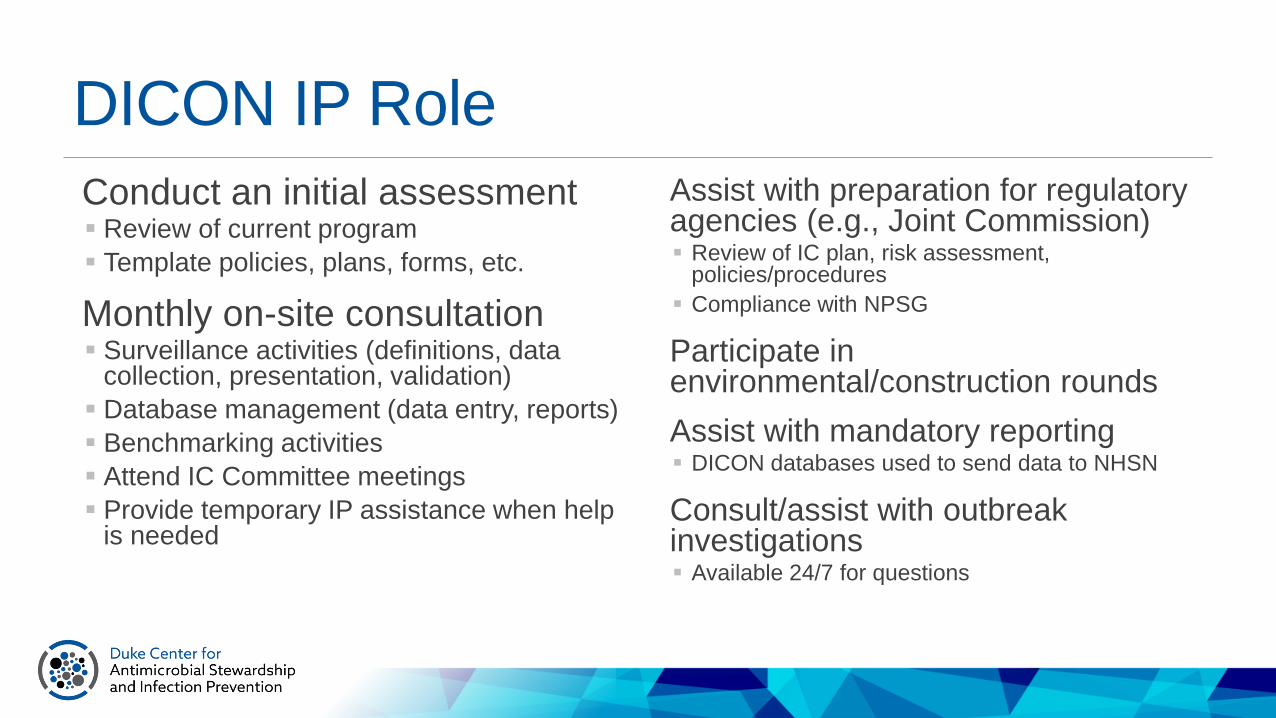
DICON IP Role
Conduct an initial assessment▪ Review of current program
▪ Template policies, plans, forms, etc.
Monthly on-site consultation ▪ Surveillance activities (definitions, data
collection, presentation, validation)
▪ Database management (data entry, reports)
▪ Benchmarking activities
▪ Attend IC Committee meetings
▪ Provide temporary IP assistance when help is needed
Assist with preparation for regulatory agencies (e.g., Joint Commission)▪ Review of IC plan, risk assessment,
policies/procedures
▪ Compliance with NPSG
Participate in environmental/construction rounds
Assist with mandatory reporting ▪ DICON databases used to send data to NHSN
Consult/assist with outbreak investigations▪ Available 24/7 for questions
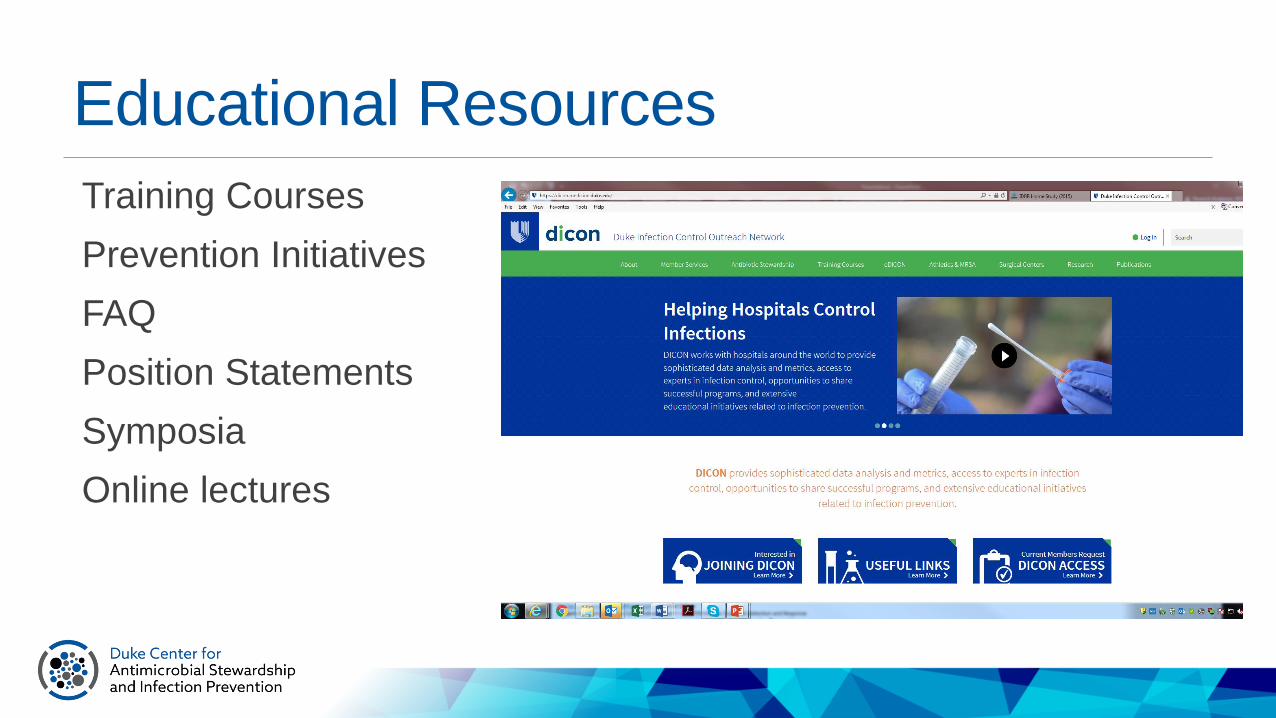
Educational Resources
Training Courses
Prevention Initiatives
FAQ
Position Statements
Symposia
Online lectures
Training Courses
Insertion of CVCs (clinicians)
Care and Maintenance of CVCs (nurses)
Stopping the Spread Videos▪ Improving Hand Hygiene
Safe Injection Practices: Core Competencies for all HCW
Preventing SSI in the OR
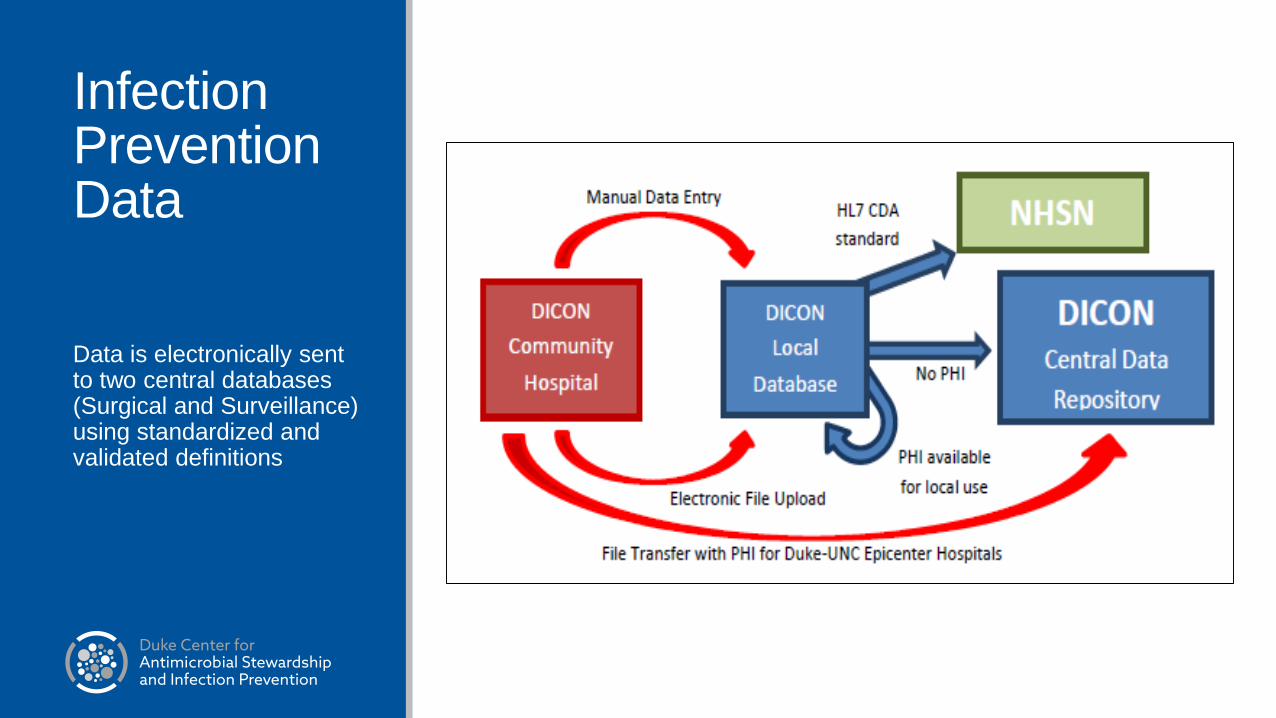
Infection Prevention Data
Data is electronically sent to two central databases (Surgical and Surveillance) using standardized and validated definitions

Infection Prevention Data
>18 years of data from some hospitals
Total Patient Days: >24.2 million
Total Surgical Procedures: > 1,539,000
Total SSI: > 16,300
Admissions involving infection or colonization with MRSA and other MDROs: > 150,000
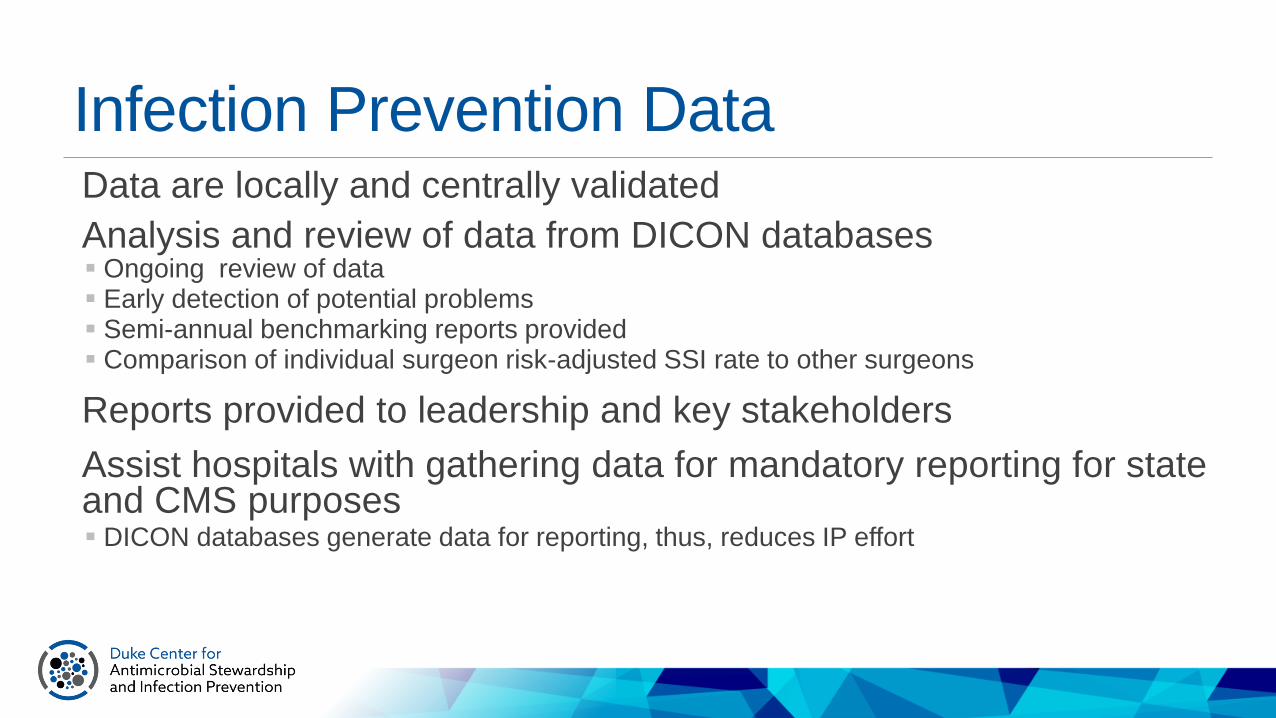
Infection Prevention Data Data are locally and centrally validated
Analysis and review of data from DICON databases▪ Ongoing review of data▪ Early detection of potential problems▪ Semi-annual benchmarking reports provided▪ Comparison of individual surgeon risk-adjusted SSI rate to other surgeons
Reports provided to leadership and key stakeholders
Assist hospitals with gathering data for mandatory reporting for state and CMS purposes▪ DICON databases generate data for reporting, thus, reduces IP effort

Data Reports for DICON Members
Benchmarked SSI report
0.00
0.20
0.40
0.60
0.80
1.00
1.20
1.40
1.60
1.80
2.00
1.74
0.00
0.78
0.00 0.00 0.00
0.26
1.85
0.29
0.00 0.00
0.61
0.00
0.39
0.52R
ate
per
100
Pro
ced
ure
s
Hospitals
Rate of SSI following Total Knee Replacement from 7/1/2014 - 6/30/2015 by HospitalAll Risk Indices
(Hospitals with 1,500 to 4,000 total procedures - Invasive SSI - Inpatient Only)
- EH breakdown (0/86)

Data Reports for DICON Members
Benchmarked SSI report
0.00
0.50
1.00
1.50
2.00
2.50
0.00
1.111.20
0.00
1.52
0.93
0.26
0.45
0.72
0.53
2.11
1.20
0.00
0.65
0.97
Rat
e pe
r 10
0 Pr
oced
ures
Hospitals
Rate of SSI following Total Hip Replacement from 7/1/2014 - 6/30/2015 by HospitalAll Risk Indices
(Hospitals with 1,500 to 4,000 total procedures - Invasive SSI - Inpatient Only)
- EH breakdown (1/90)
Data Reports for DICON Members
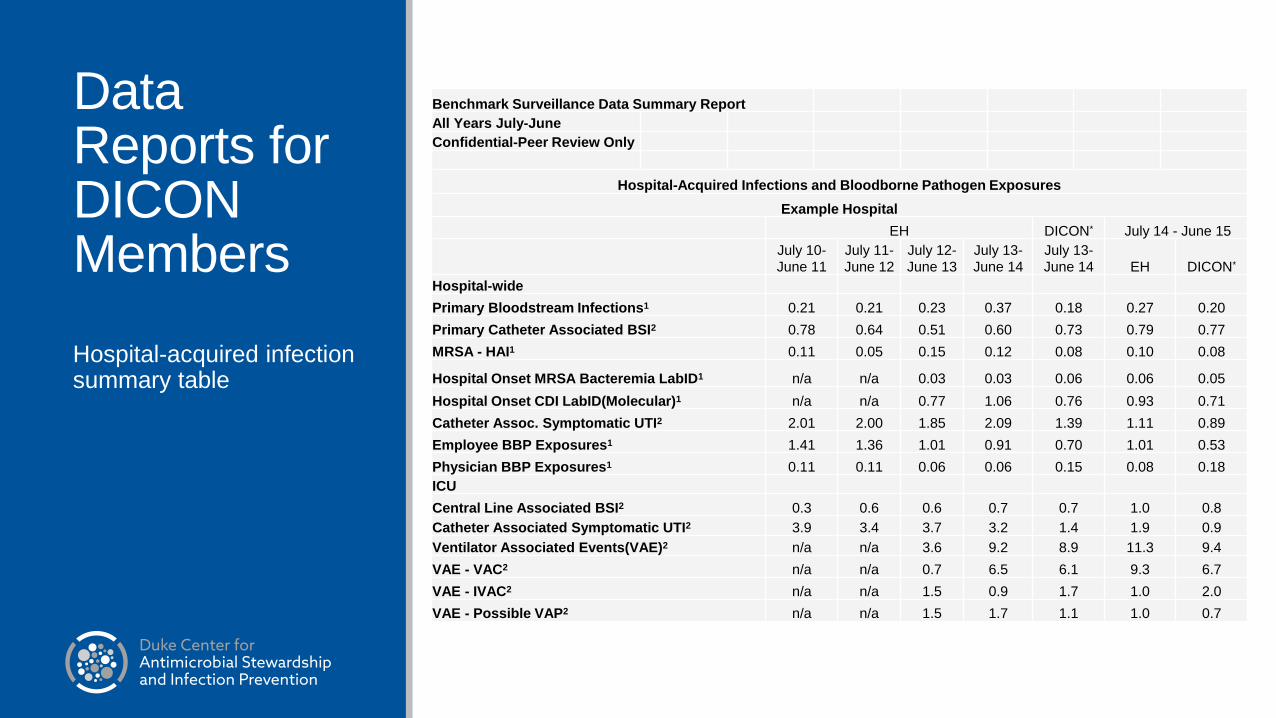
Hospital-acquired infection summary table
Benchmark Surveillance Data Summary Report
All Years July-June
Confidential-Peer Review Only
Hospital-Acquired Infections and Bloodborne Pathogen Exposures
Example Hospital
EH DICON* July 14 - June 15
July 10-
June 11
July 11-
June 12
July 12-
June 13
July 13-
June 14
July 13-
June 14 EH DICON*
Hospital-wide
Primary Bloodstream Infections1 0.21 0.21 0.23 0.37 0.18 0.27 0.20
Primary Catheter Associated BSI2 0.78 0.64 0.51 0.60 0.73 0.79 0.77
MRSA - HAI1 0.11 0.05 0.15 0.12 0.08 0.10 0.08
Hospital Onset MRSA Bacteremia LabID1 n/a n/a 0.03 0.03 0.06 0.06 0.05
Hospital Onset CDI LabID(Molecular)1 n/a n/a 0.77 1.06 0.76 0.93 0.71
Catheter Assoc. Symptomatic UTI2 2.01 2.00 1.85 2.09 1.39 1.11 0.89
Employee BBP Exposures1 1.41 1.36 1.01 0.91 0.70 1.01 0.53
Physician BBP Exposures1 0.11 0.11 0.06 0.06 0.15 0.08 0.18
ICU
Central Line Associated BSI2 0.3 0.6 0.6 0.7 0.7 1.0 0.8
Catheter Associated Symptomatic UTI2 3.9 3.4 3.7 3.2 1.4 1.9 0.9
Ventilator Associated Events(VAE)2 n/a n/a 3.6 9.2 8.9 11.3 9.4
VAE - VAC2 n/a n/a 0.7 6.5 6.1 9.3 6.7
VAE - IVAC2 n/a n/a 1.5 0.9 1.7 1.0 2.0
VAE - Possible VAP2 n/a n/a 1.5 1.7 1.1 1.0 0.7
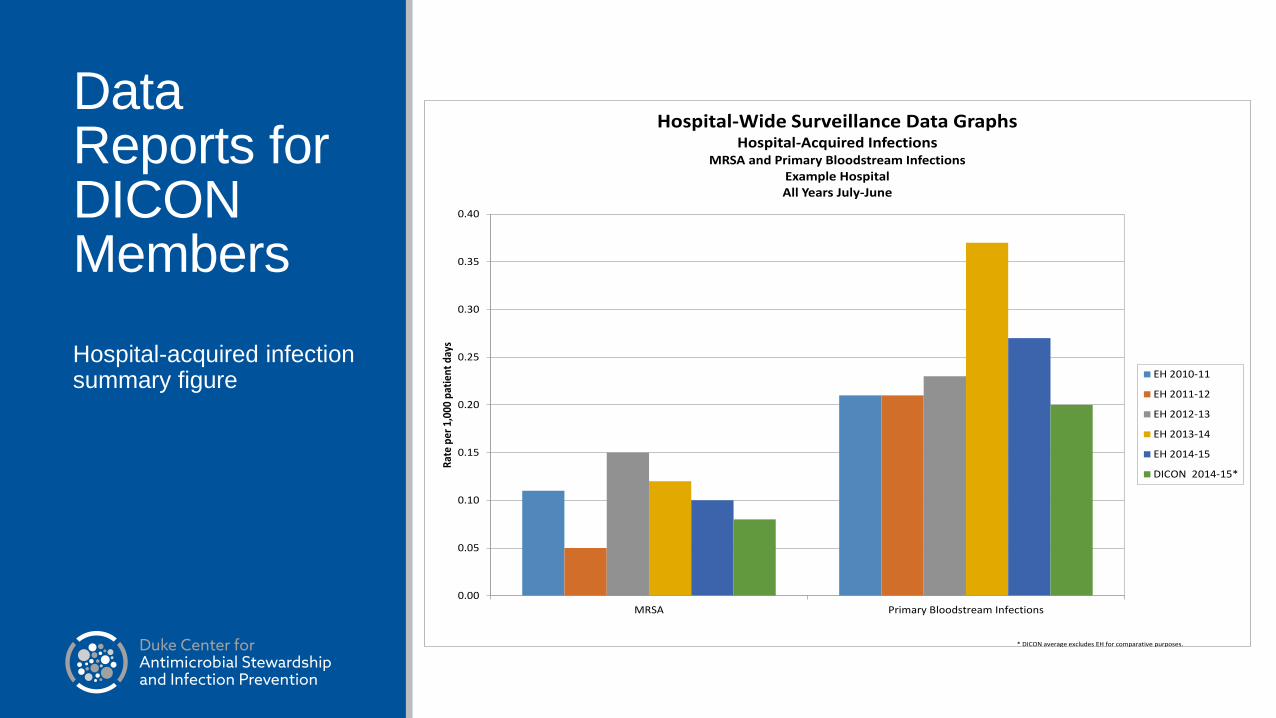
Data Reports for DICON Members
Hospital-acquired infection summary figure
0.00
0.05
0.10
0.15
0.20
0.25
0.30
0.35
0.40
MRSA Primary Bloodstream Infections
Rat
e pe
r 1,
000
pati
ent
days
Hospital-Wide Surveillance Data GraphsHospital-Acquired Infections
MRSA and Primary Bloodstream InfectionsExample HospitalAll Years July-June
EH 2010-11
EH 2011-12
EH 2012-13
EH 2013-14
EH 2014-15
DICON 2014-15*
* DICON average excludes EH for comparative purposes.

0
5
10
15
20
25
30
35
40
45
50Ti
me
be
twe
en
infe
ctio
ns
(day
s)
T-chart: CDI (All types)*(CY2010 vs YTD2011)
g g-bar LCL UCL
Average Time between Infections2010: 8.2 days2011: 4.1 days
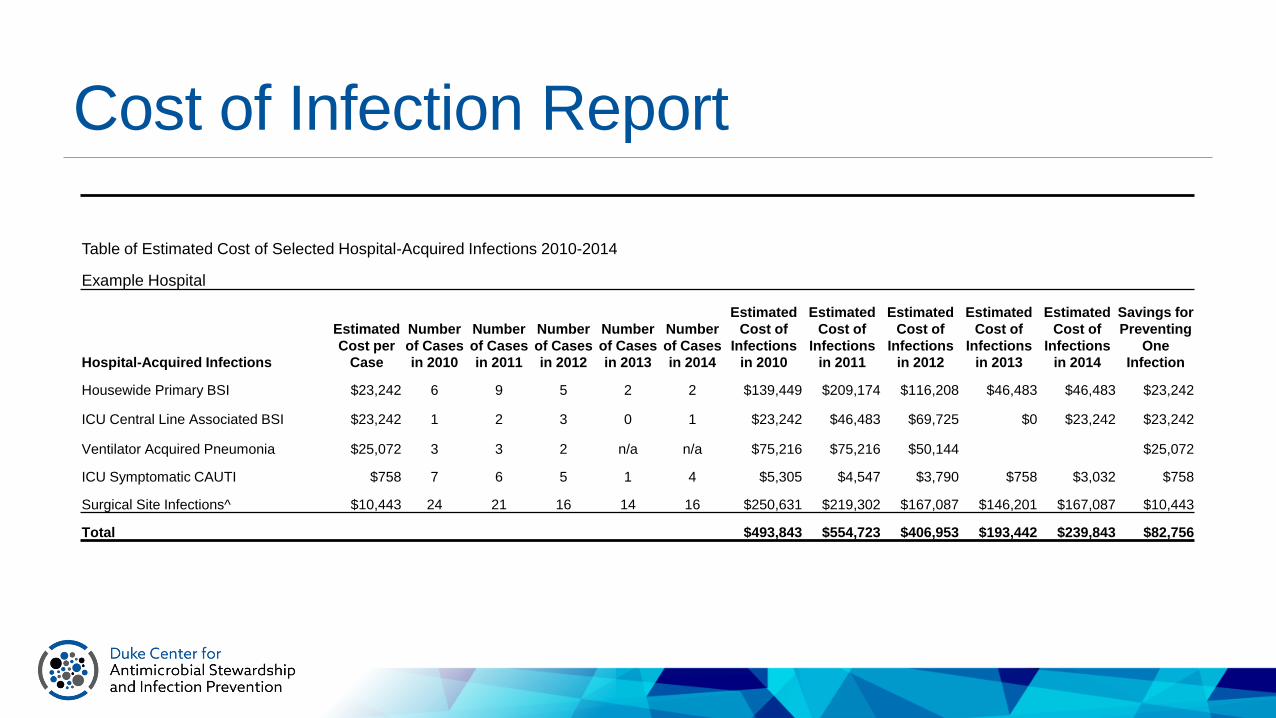
Cost of Infection Report
Table of Estimated Cost of Selected Hospital-Acquired Infections 2010-2014
Example Hospital
Hospital-Acquired Infections
Estimated
Cost per
Case
Number
of Cases
in 2010
Number
of Cases
in 2011
Number
of Cases
in 2012
Number
of Cases
in 2013
Number
of Cases
in 2014
Estimated
Cost of
Infections
in 2010
Estimated
Cost of
Infections
in 2011
Estimated
Cost of
Infections
in 2012
Estimated
Cost of
Infections
in 2013
Estimated
Cost of
Infections
in 2014
Savings for
Preventing
One
Infection
Housewide Primary BSI $23,242 6 9 5 2 2 $139,449 $209,174 $116,208 $46,483 $46,483 $23,242
ICU Central Line Associated BSI $23,242 1 2 3 0 1 $23,242 $46,483 $69,725 $0 $23,242 $23,242
Ventilator Acquired Pneumonia $25,072 3 3 2 n/a n/a $75,216 $75,216 $50,144 $25,072
ICU Symptomatic CAUTI $758 7 6 5 1 4 $5,305 $4,547 $3,790 $758 $3,032 $758
Surgical Site Infections^ $10,443 24 21 16 14 16 $250,631 $219,302 $167,087 $146,201 $167,087 $10,443
Total $493,843 $554,723 $406,953 $193,442 $239,843 $82,756

Data Reports for DICON Members
Benchmarked cost of HAI report
$0.00
$0.20
$0.40
$0.60
$0.80
$1.00
$1.20
8 9 10 11 12 13 EH 15 16 17 18 19 20 21 22
Cost
of
HA
I (M
illio
ns
US$
)
Hospitals
Total Cost of Selected HAIs at DICON Hospitals for 2012-2014(Hospitals 30,000 to 70,000 annual patient days)
2012
2013
2014
For surgical site infections, all infection types are included: superficial, deep incisional and organ/space.

Improved Outcomes
Infection/Exposure 3 years1 5 years2 7 years2
Employee EBBP DOWN 18% DOWN 20% DOWN 47%
HA-MRSA DOWN 22% DOWN 48% DOWN 65%
CLABSI DOWN 23% DOWN 47% DOWN 42%
CAUTI DOWN 27% DOWN 50% DOWN 60%
VAP DOWN 40% DOWN 46% DOWN 68%
1Kaye KS et al. Infect Control Hosp Epidemiol 2006;27:228-32.
2Anderson DJ et al. Infect Control Hosp Epidemiol April 2011; 32:315-322.


eDICON
>130 hospitals have contracts to access DICON educational content▪ Training Courses
▪ > 50,000 HCW—Insertion of CVC
▪ > 20,000 Nurses—CVC Care & Maintenance
▪ > 18,000 HCW—Safe Injection videos viewed
▪ > 60,000 HCW—Hand hygiene course completions
▪ Prevention Initiatives
▪ Website and Symposia
▪ Online lectures

eDICONTraining Courses
Build the enterprise
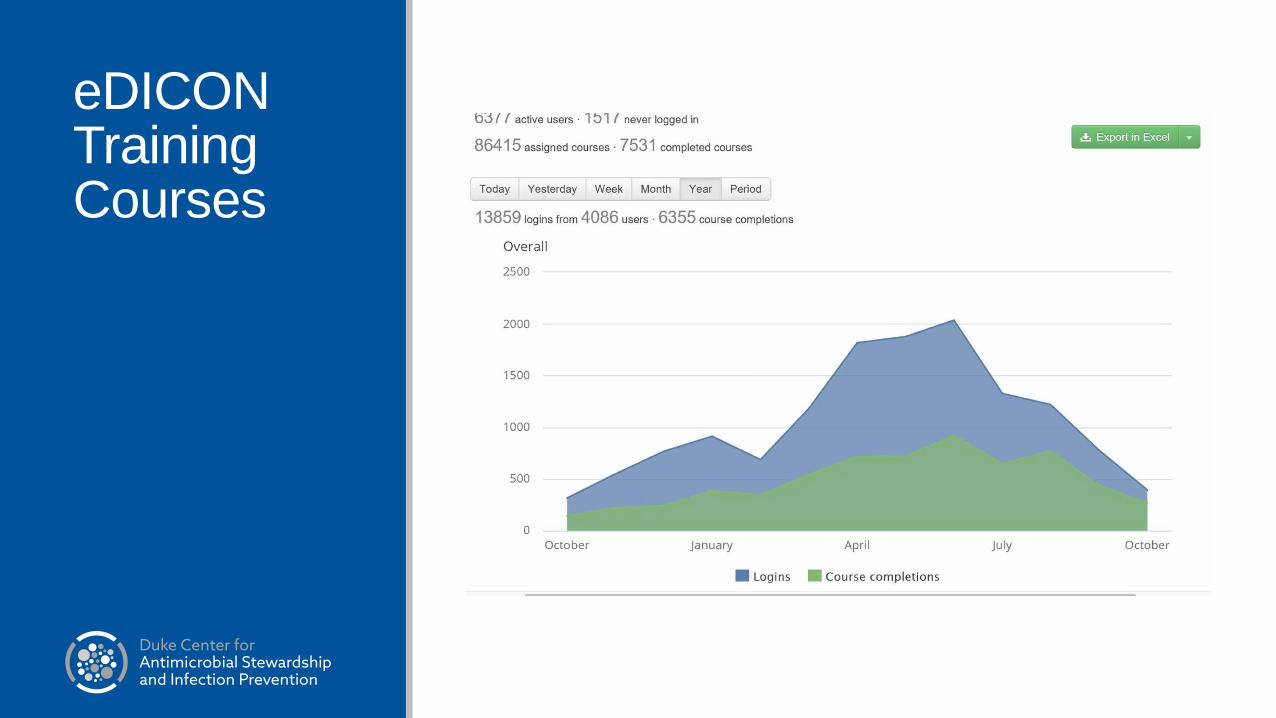
eDICONTraining Courses
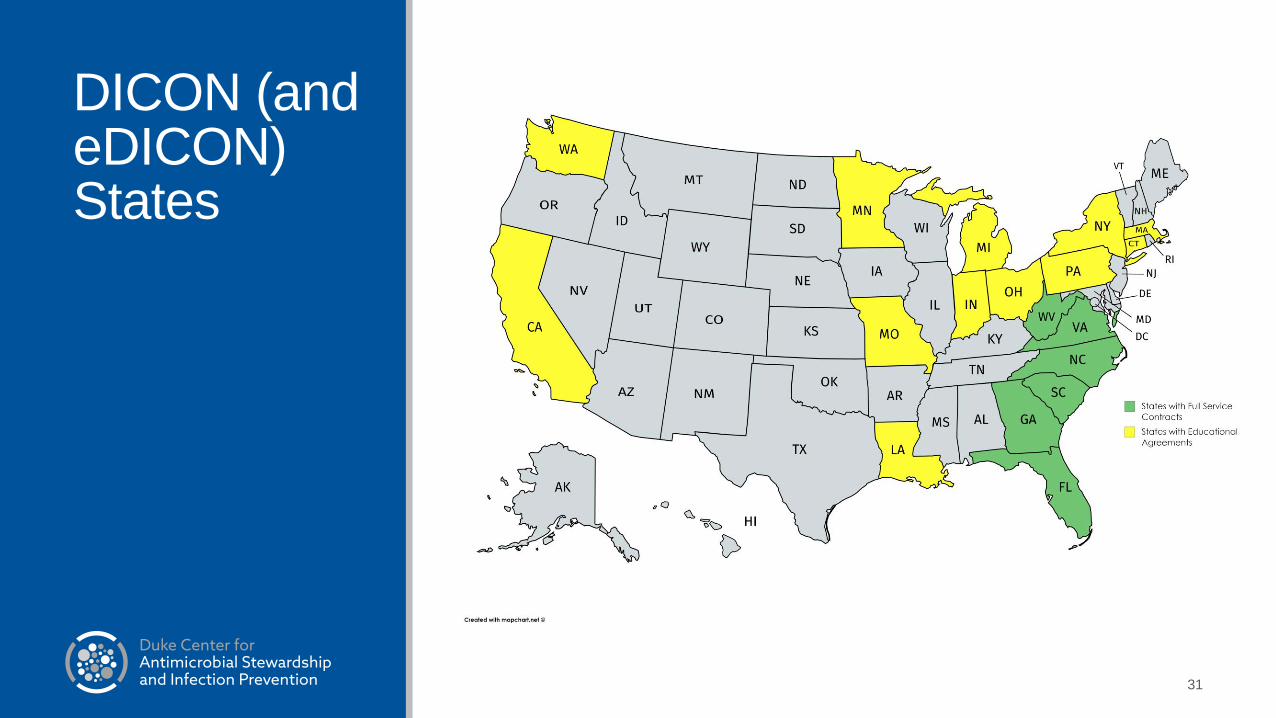
DICON (and eDICON) States
31

dcasip.medicine.duke.edu
DUKE ANTIMICROBIAL STEWARDSHIP OUTREACH NETWORK

DASON
Built using the “DICON Model”▪ Liaison pharmacists
Mission:▪ DASON exists to help community hospitals
address issues via an evidence-based, state-of-the art AS network focusing on
▪ Data collection, analysis, feedback, and integration
▪ Educational initiatives
▪ Expert consultation
Goals ▪ To improve quality of patient care
▪ To enhance patient safety
▪ To promote judicious antimicrobial use for patients treated in community hospitals
Key improvement – Data Infrastructure

Data Sharing, Analysis, and Benchmarking
Change from “gum shoe” epidemiology and manual data entry to 100% electronic data transfer
Multiple file types▪ Antimicrobial utilization
▪ Demographics
▪ Bed flow
▪ Outcomes
▪ Diagnosis and procedure codes
Requires IT infrastructure (locally and centrally)▪ Local server set-up (virtual or physical server)
▪ All data with identifiers stays at local hospital
▪ Local data accessible via DASON app “ASAP”

DASON Architecture
Local database with hospital data
De-identified data transferred to DASON Central
DASON benchmarks from aggregate hospital data
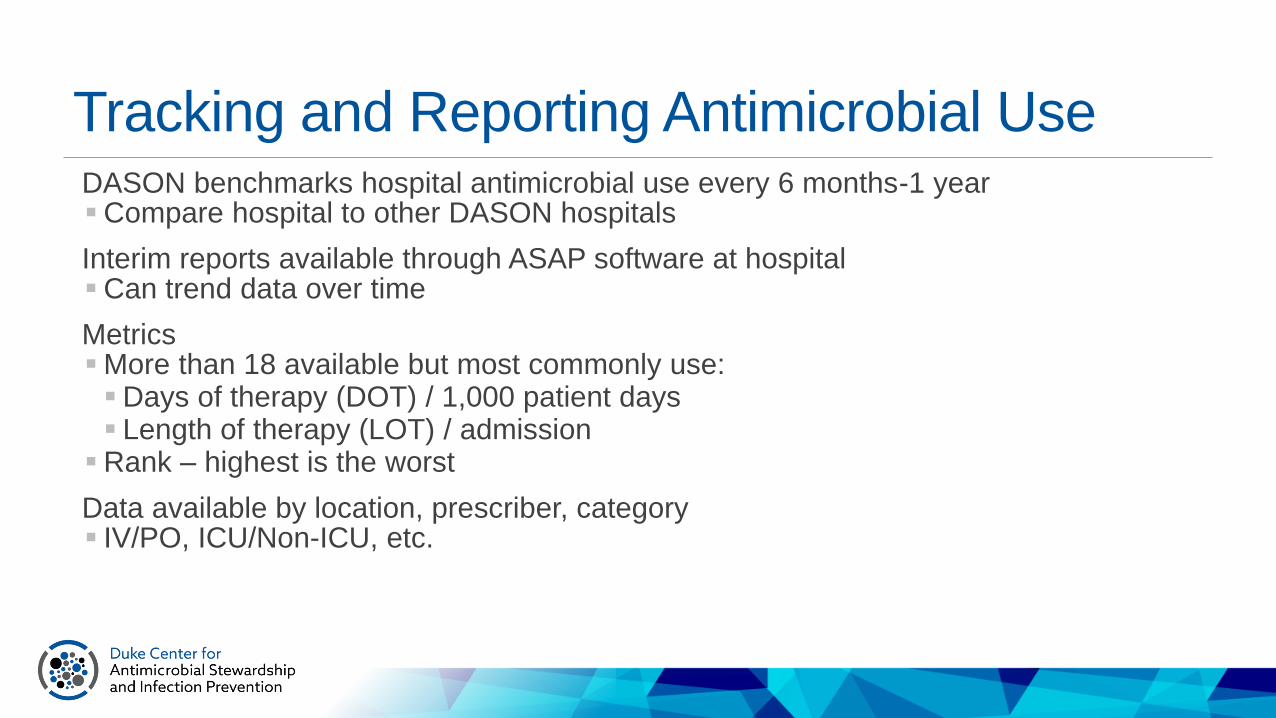
Tracking and Reporting Antimicrobial UseDASON benchmarks hospital antimicrobial use every 6 months-1 year▪ Compare hospital to other DASON hospitals
Interim reports available through ASAP software at hospital▪ Can trend data over time
Metrics▪ More than 18 available but most commonly use:▪ Days of therapy (DOT) / 1,000 patient days▪ Length of therapy (LOT) / admission
▪ Rank – highest is the worst
Data available by location, prescriber, category ▪ IV/PO, ICU/Non-ICU, etc.
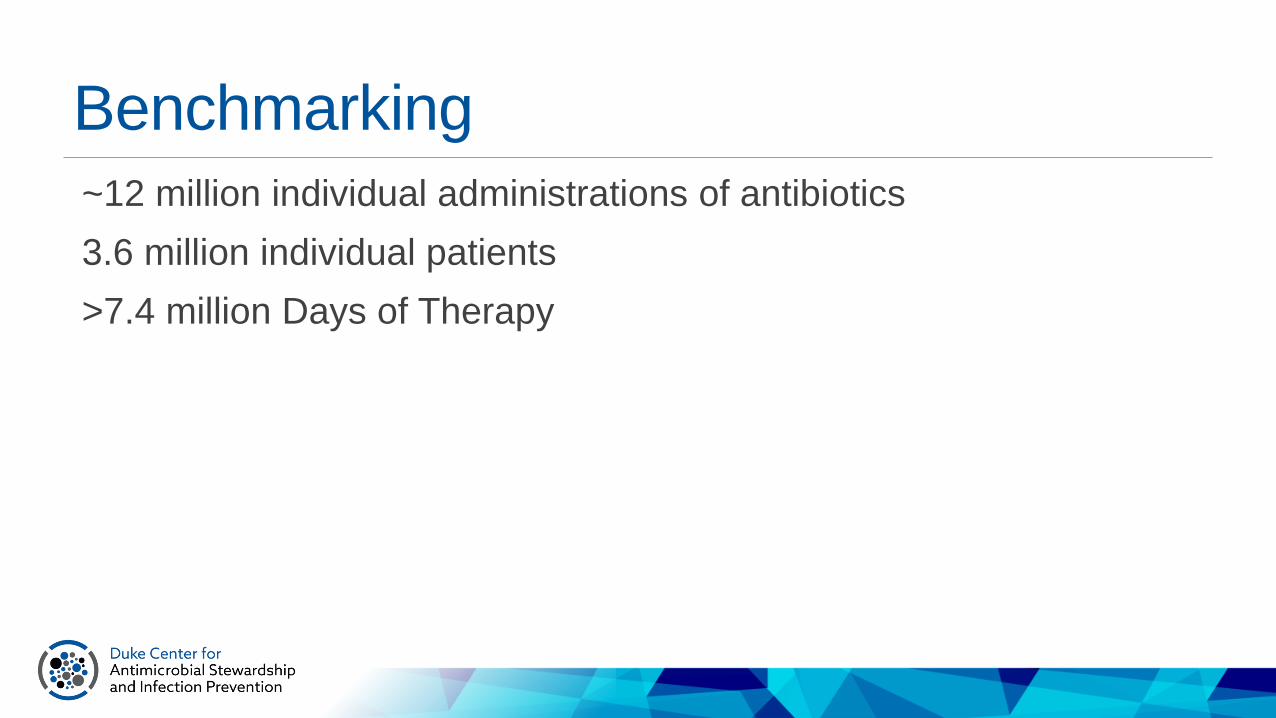
Benchmarking
~12 million individual administrations of antibiotics
3.6 million individual patients
>7.4 million Days of Therapy
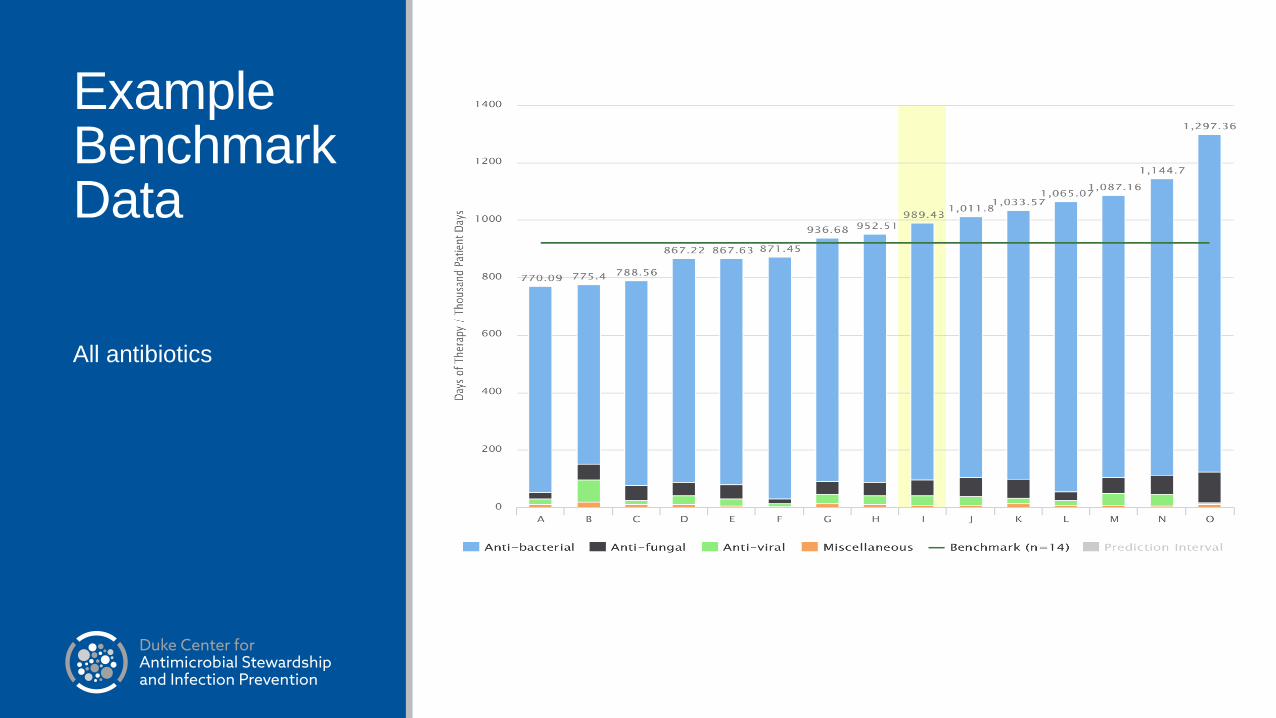
Example Benchmark Data
All antibiotics
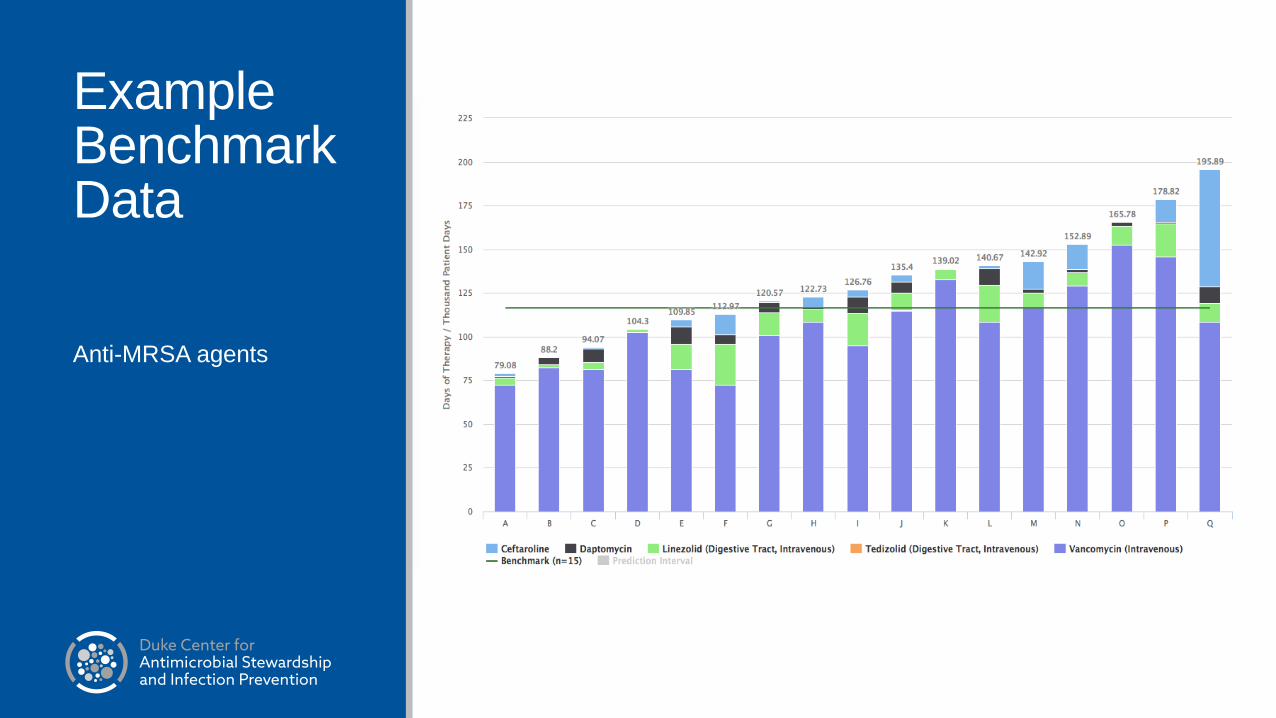
Example Benchmark Data
Anti-MRSA agents
40

Prescriber-Specific Example
HospitalFluoroquinolone Administrations by Prescriber 2015Emergency Department

Tracking an Intervention- FQ Example
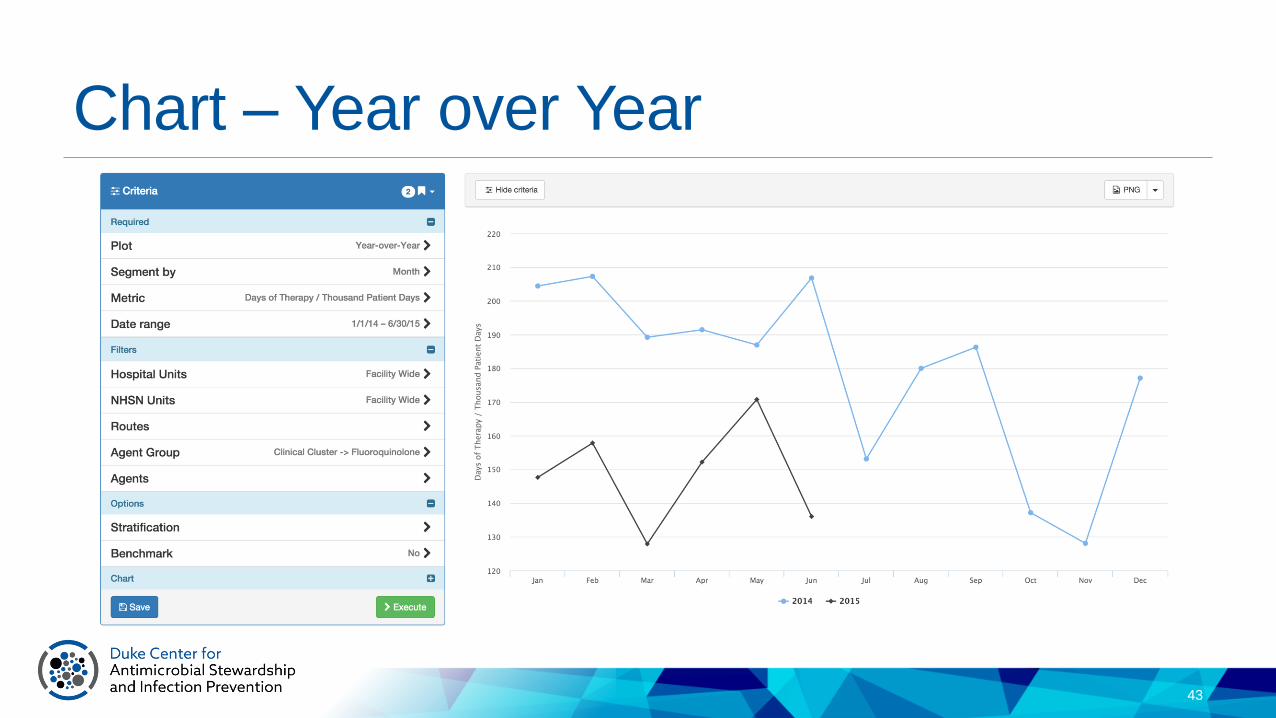
Chart – Year over Year
43

Research in Community Hospitals
2 keys▪ Relationships with members hospitals (service)
▪ Data infrastructure
Performed multiple types of research with this model▪ Epidemiological analyses – case/control, cohort
▪ Mathematical modeling
▪ Molecular epidemiology
▪ Randomized controlled trials
Completed Study – MDR E. coli
63 MDR E. coli isolates▪ First application of WGS to analyze E. coli isolates from community hospitals
▪ Unique component – combination of molecular and clinical epidemiology
ST131 most prevalent strain type – 39 (62%)▪ Associated with a unique subclone (H30Rx) and plasmids (IncF[F2:A1:B--])
▪ Resistance to fluoroquinolones, TMP-SMX
Demonstrated circulation of this MDR organism throughout the community▪ Only 10% hospital onset
▪ 48% community-onset, healthcare-associated
Kanamori et al. Antimicrob Agent Chemother 2017;61:e00912.
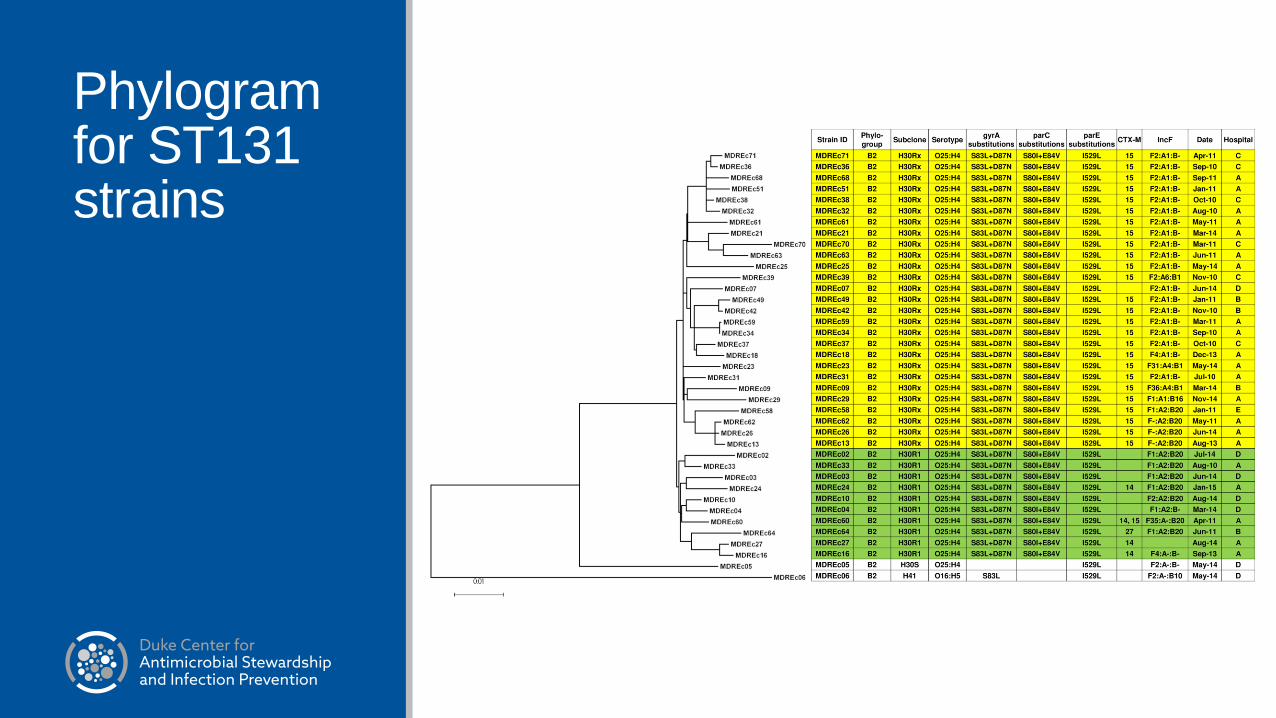
Phylogramfor ST131 strains
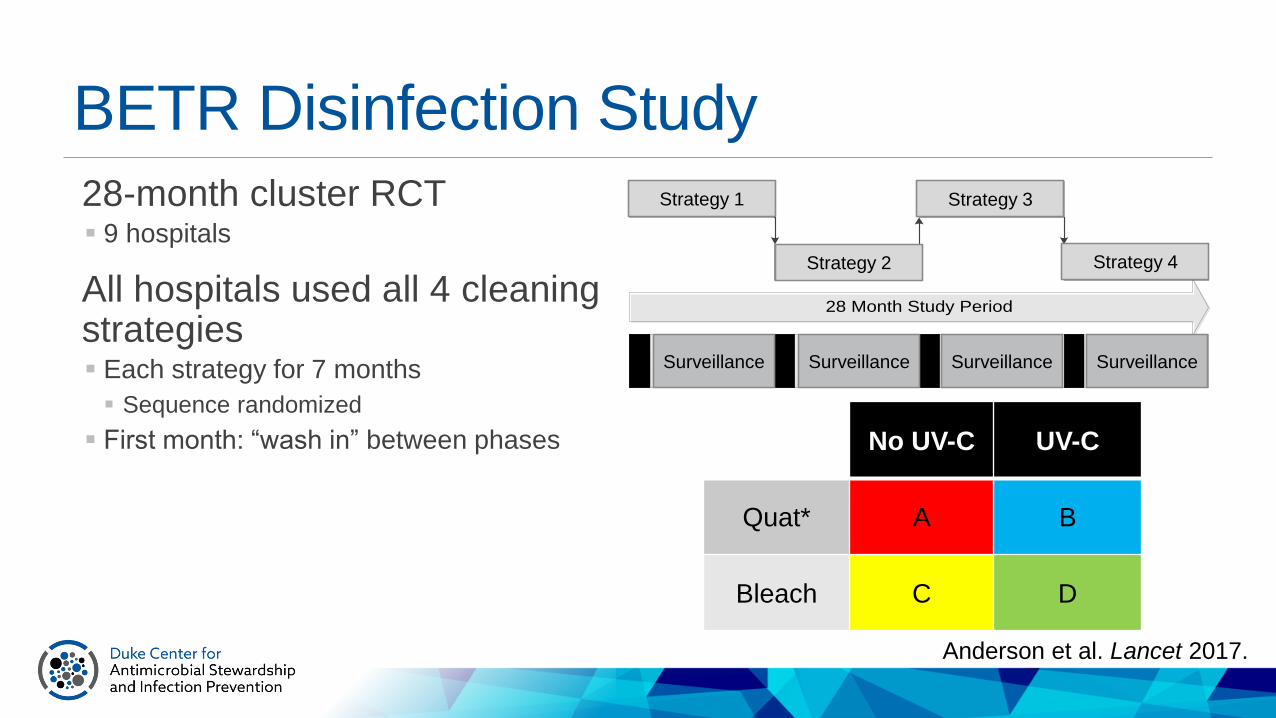
BETR Disinfection Study
28-month cluster RCT▪ 9 hospitals
All hospitals used all 4 cleaning strategies ▪ Each strategy for 7 months
▪ Sequence randomized
▪ First month: “wash in” between phases
28 Month Study Period
Intervention 1
Intervention 2
Intervention 3
Intervention 4
Surveillance for HAIs Surveillance for HAIs Surveillance for HAIs Surveillance for HAIsSurveillanceSurveillanceSurveillance Surveillance
Strategy 1
Strategy 2
Strategy 3
Strategy 4
No UV-C UV-C
Quat* A B
Bleach C D
Anderson et al. Lancet 2017.
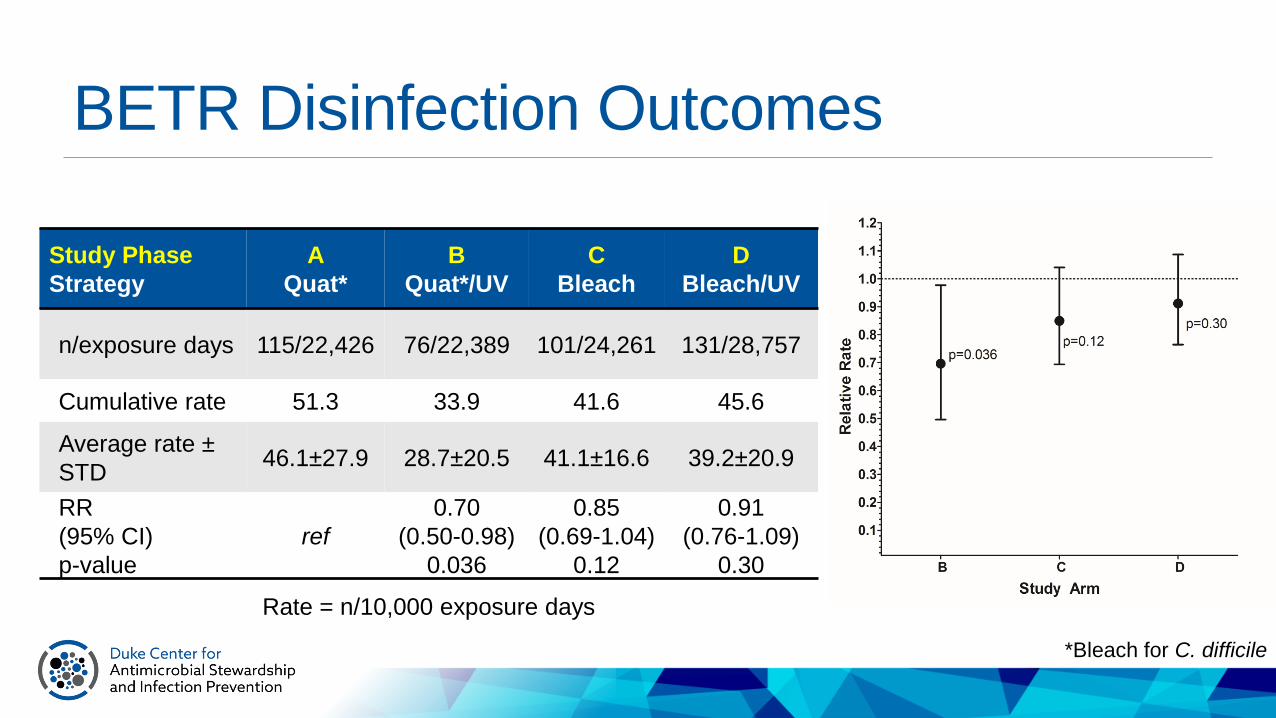
BETR Disinfection Outcomes
Study Phase
Strategy
A
Quat*
B
Quat*/UV
C
Bleach
D
Bleach/UV
n/exposure days 115/22,426 76/22,389 101/24,261 131/28,757
Cumulative rate 51.3 33.9 41.6 45.6
Average rate ±
STD46.1±27.9 28.7±20.5 41.1±16.6 39.2±20.9
RR
(95% CI)
p-value
ref
0.70
(0.50-0.98)
0.036
0.85
(0.69-1.04)
0.12
0.91
(0.76-1.09)
0.30
Rate = n/10,000 exposure days
*Bleach for C. difficile

Ongoing Federal Research SupportNIH/ARLG - Pharmacy-Based Interventions for Antimicrobial Use
AHRQ K08 - Develop and trial strategies for feedback of utilization data
AHRQ R01 – Use of statistical process control charts to reduce surgical site infections (SSI)
CDC Foundation - Evaluate and develop metrics for stewardship reporting
CDC SHEPheRD (Contracts)▪ Reporting of Antibiotic Use to the NHSN AU module
▪ Core Elements of Stewardship
Duke-UNC Prevention Epicenter▪ Impact of antimicrobial therapy on cutaneous
microbiome▪ Environmental disinfection▪ Continuous disinfection
▪ Daily bleach
▪ Quantitative methods
▪ DETOURS Trial – opt-out protocol to decrease unnecessary antibiotic therapy
▪ Changes in cutaneous microbiome during routine elective surgical procedures▪ Impact of antimicrobial therapy on risk of SSI
▪ Feasibility of feeding back molecular microbiological data to prescribers to impact antimicrobial prescribing
Take Home Points
The “DICON model” can successfully help hospitals improve patient care and safety
A network approach to infection prevention and ASP is practical and effective▪ KEYS TO SUCCESS
▪ Relationships
▪ Excellent liaison IPs
▪ Data
The “DICON model” focuses on service ▪ But inherently creates infrastructure for research
Locally collected data can be used to motivate and stimulate doctors, nurses, and administrators to improve performance
The opportunities for improvement in current rates of healthcare-associated infections and ASP are numerous▪ We expect more growth in AS than IC in the near future

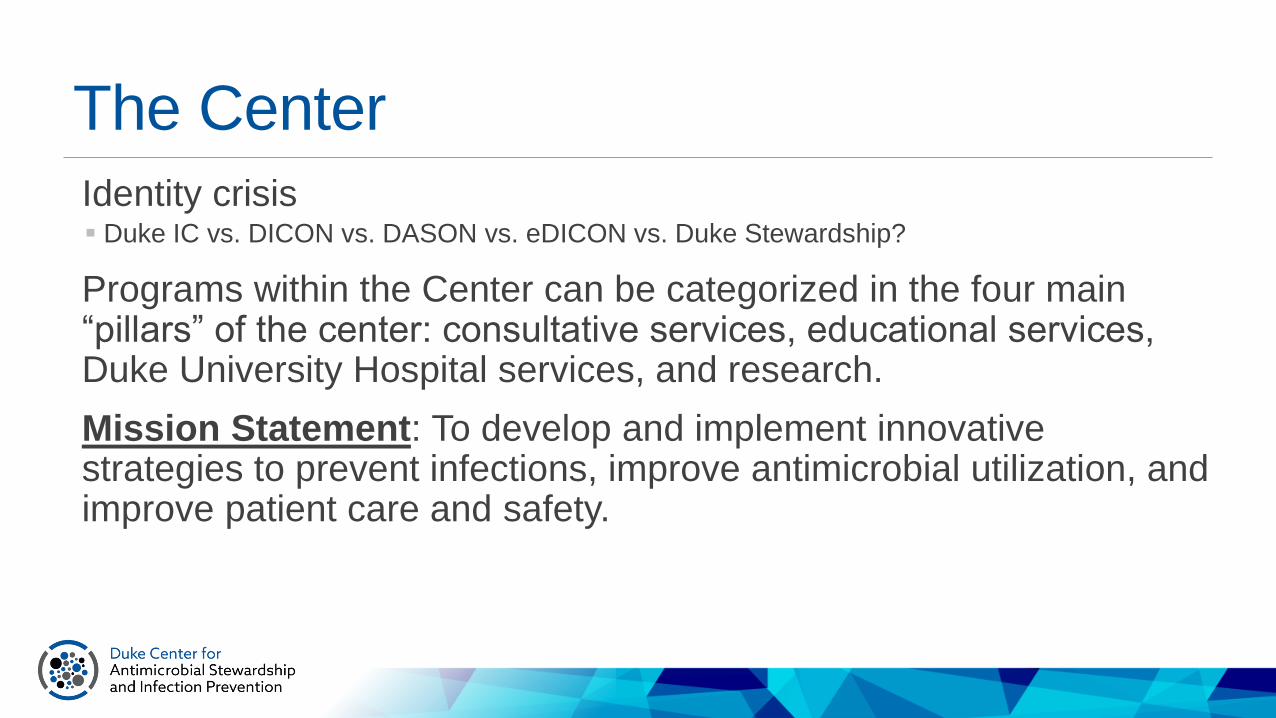
The Center
Identity crisis▪ Duke IC vs. DICON vs. DASON vs. eDICON vs. Duke Stewardship?
Programs within the Center can be categorized in the four main “pillars” of the center: consultative services, educational services, Duke University Hospital services, and research.
Mission Statement: To develop and implement innovative strategies to prevent infections, improve antimicrobial utilization, and improve patient care and safety.

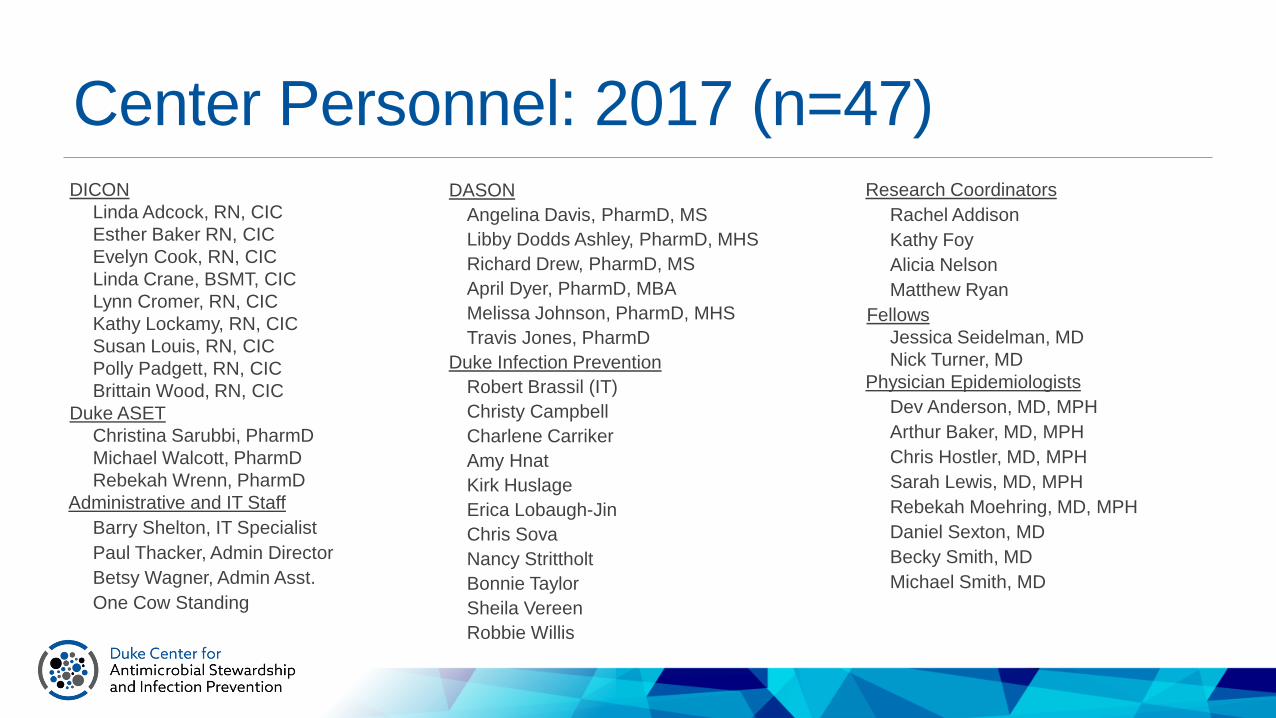
Center Personnel: 2017 (n=47)DICON
Linda Adcock, RN, CIC
Esther Baker RN, CIC
Evelyn Cook, RN, CIC
Linda Crane, BSMT, CIC
Lynn Cromer, RN, CIC
Kathy Lockamy, RN, CIC
Susan Louis, RN, CIC
Polly Padgett, RN, CIC
Brittain Wood, RN, CIC
Duke ASET
Christina Sarubbi, PharmD
Michael Walcott, PharmD
Rebekah Wrenn, PharmD
Administrative and IT Staff
Barry Shelton, IT Specialist
Paul Thacker, Admin Director
Betsy Wagner, Admin Asst.
One Cow Standing
Research Coordinators
Rachel Addison
Kathy Foy
Alicia Nelson
Matthew Ryan
Fellows
Jessica Seidelman, MD
Nick Turner, MD
Physician Epidemiologists
Dev Anderson, MD, MPH
Arthur Baker, MD, MPH
Chris Hostler, MD, MPH
Sarah Lewis, MD, MPH
Rebekah Moehring, MD, MPH
Daniel Sexton, MD
Becky Smith, MD
Michael Smith, MD
DASON
Angelina Davis, PharmD, MS
Libby Dodds Ashley, PharmD, MHS
Richard Drew, PharmD, MS
April Dyer, PharmD, MBA
Melissa Johnson, PharmD, MHS
Travis Jones, PharmD
Duke Infection Prevention
Robert Brassil (IT)
Christy Campbell
Charlene Carriker
Amy Hnat
Kirk Huslage
Erica Lobaugh-Jin
Chris Sova
Nancy Strittholt
Bonnie Taylor
Sheila Vereen
Robbie Willis
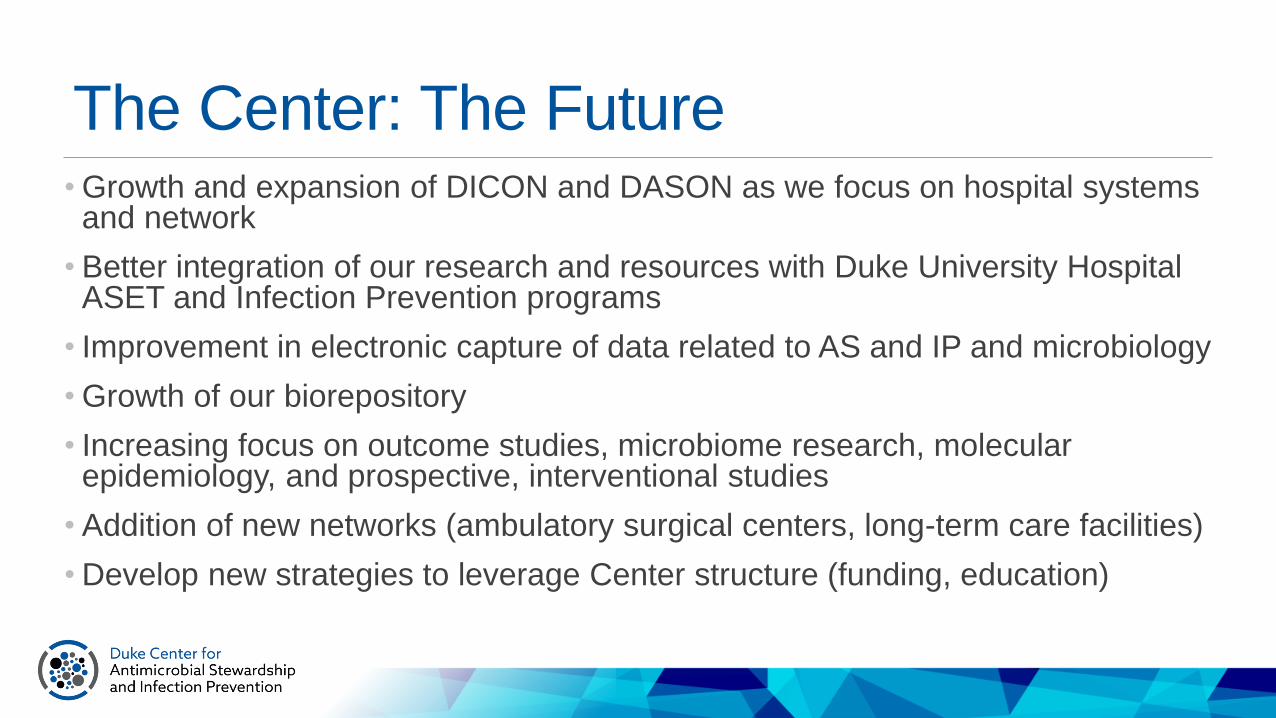
The Center: The Future• Growth and expansion of DICON and DASON as we focus on hospital systems
and network
• Better integration of our research and resources with Duke University Hospital ASET and Infection Prevention programs
• Improvement in electronic capture of data related to AS and IP and microbiology
• Growth of our biorepository
• Increasing focus on outcome studies, microbiome research, molecular epidemiology, and prospective, interventional studies
• Addition of new networks (ambulatory surgical centers, long-term care facilities)
• Develop new strategies to leverage Center structure (funding, education)