strength characteristics of clay-rubber waste mixtures in
TRANSCRIPT
geosciences
Article
Strength Characteristics of Clay-Rubber WasteMixtures in UU Triaxial Tests
Małgorzata Jastrzebska
Department of Geotechnics and Roads, Faculty of Civil Engineering, Silesian University of Technology,Akademicka 5, Gliwice 44-100, Poland; [email protected]; Tel.: +48-32-237-1543
Received: 5 July 2019; Accepted: 8 August 2019; Published: 10 August 2019�����������������
Abstract: This paper presents results of undrained and unconsolidated (UU) triaxial tests related tothe influence of tire waste addition on strength characteristics of red clay from Patoka in SouthernPoland. Angle of internal friction and cohesion values were estimated for 30 specimens preparedfrom pure red clay (RC), its mixtures with two different fractions of shredded rubber in 5%, 10%, and25% mass proportions as well as for pure powder (P) and granulate (G). It has been observed that theaddition of granulate contributes more to the increase in the angle of friction than the addition ofpowder (∆Φuu = +1% (G-5) / +16% (G-10) / +31% (G-25), ∆Φuu = +1% (P-5) / +10% (P-10) / +19%(P-25)). On the other hand, rubber additions reduce cohesion in mixtures, and the effect is enhancedwith increases in their grain size and percentage composition (∆cuu = −31% (G-5) / −63% (G-10) /
−87% (G-25), ∆cuu = −67% (P-5) / −58% (P-10) / −58% (P-25)). It has been noticed that a change ofparameters Φuu and cuu causes a decline of shear stresses at increasing granulate content. There is aninverse relationship for powder. At the same time, it has been shown that the failure strain, hence achange in red clay-rubber (RCR) mixtures plasticity, is related to the level of confining stress σ3 andthe type of rubber waste. Results of tests and their comparison with results of other researchers showthat each time it is necessary to experimentally verify a given soil with specific rubber waste.
Keywords: tire waste; clay; civil engineering construction; UU triaxial test; shear strength of mixtures
1. Introduction
The contemporary world grapples with many problems, including the disposal of a huge numberof waste car tires (referred to as ‘end-of-life tires’ (ELT)) and the need to strengthen or to reuse weakfine-grained soils, in particular expansive clays. Scrap tires create breeding grounds for disease carryingvermin (tires hold water, which becomes stagnant and attracts the insects), in case of (self)ignition thetires emit black, thick and toxic smoke, which is very difficult to fight. Expansive soils cause seriousdamage and distortion to light buildings (especially to wooden constructions), highway pavements,and underground networks. Rogers et al. [1] state that according to estimates, shrinking and swellingsoils cause about $2.3 billion of damage annually in the United States alone which, to put things inperspective, is more than twice the annual cost of damage from floods, hurricanes, tornadoes, andearthquakes combined [2].
The practice of dumping tires anywhere or stockpiling them on huge dump sites results not onlyin the environmental pollution but causes also significant fire and life hazards. Methods of variousrubber types waste management (not only tires) are regulated by appropriate laws and regulations,which require tests to be performed on new applications, e.g., in civil engineering works (reportedby the World Business Council for Sustainable Development (WBCSD) [3]). Primarily their use asbackfills for road and railway embankments or as retaining wall backfills (e.g., [4–9]) or adding themto asphalt mixtures (e.g., [10,11]) or as buildings protection against earthquakes (e.g., [12]). It is truethat the excess of waste, including rubber, results directly from human activities. On the other hand,
Geosciences 2019, 9, 352; doi:10.3390/geosciences9080352 www.mdpi.com/journal/geosciences
Geosciences 2019, 9, 352 2 of 16
the existence of weak soils is a natural factor that causes a lot of difficulties in founding buildings.Also, their reuse after appropriate modification of their properties is not an easy job. This is caused,among other things, by the fact that the testing methodology dedicated to such soils is specific andfrequently complicated [13,14]. Soils, which feature plastic consistency, or those which show volumechanges (swelling or shrinking) due to moisture content, change and are considered weak cohesivesoils. The subsoil built of such soils features a low strength and is susceptible to significant and unevensettlement [15]. One of the methods for improving weak cohesive soils usability consists of reducingthe weight of embankments built on them, and in the case of expansive soils, reducing their swelling.To this end, rubber waste originating from car tires can be used in each of these cases.
The basic aim of the presented paper—being the determination of rubber waste in the form of0–1 mm powder and 1–5 mm granulate influence on strength parameters of swelling red clay—resultsfrom those premises. UU triaxial tests (unconsolidated and undrained shearing) were performedfor this issue, considering such a case as the most unfavorable in the situation of quick loading.The influence of the aforementioned waste on swelling parameters was presented by Kowalska andJastrzebska [16]. They drew attention to three important aspects. First of all, not every researchmethod (e.g., free-swell after Head or the swelling index from the Casagrande apparatus) is suitablefor soil—rubber mixtures. Secondly, after the initial compaction of the mixture in Proctor’s apparatusit should be taken into account the fact that the rubber relaxes, which is difficult to quantify. Thirdly,certainly, the rubber waste reduces the swelling pressure of expansive soils, but the determination ofthe optimal rubber size and shape and its content in the mix still requires further research.
2. Literature Review
The majority of research carried out on waste is directed primarily towards checking their influenceon a change of the optimum moisture content in soils [17,18], on the mechanical behavior of soils [19–23],on the reduction of Atterberg’s limits and plasticity index of fine-grained soils [21,24–26], and on thereduction of natural soils swelling [16,27–30]. If the first two groups of issues apply to all soils, thenthe next two are strictly related to cohesive (frequently expansive) soils. At the same time, most papersdefinitely focus on non-cohesive soils. The few referring to cohesive soils, and related to their shearstrength, are based primarily on direct shear tests or on unconfined compression tests. Triaxial tests areperformed relatively less often, and if they are, then they are only done so with consolidation and aredrained (CD—consolidated drained tests) or undrained (CU—consolidated undrained tests) duringshearing. The author is aware of only one paper where the researchers carried out UU triaxial tests [31].
The above observation is confirmed inter alia by an extensive review by Yadav and Tiwari [32],devoted entirely to the ELT inclusion in fine-grained soils. At the same time, having analyzed theavailable literature, the following conclusions come to the fore, which frequently function within agiven soils group: non-cohesive or cohesive. First of all, irrespective of the soil type, after addingit to rubber waste, its unit weight goes down, making the structure lighter. Moreover, after addingshredded rubber to non-cohesive soils, a noticeable decline of the angle of internal friction value isobserved by approximately 22%, according to CD triaxial tests [26] or even by approximately 30%according to tests in a direct shear apparatus [6]. It is accompanied by an increase in the apparentcohesion of the mixture, where so-called threshold values are observed (according to Bałachowskiand Gotteland [33] this is approximately 50% of rubber waste content in the mixture, and according toKowalska and Chmielewski [6] this is approximately 30%). After exceeding them, the cohesion startsshowing downward trends after its initial increase. Then, such a proportion between the strengthparameter values and the content of the rubber additive is sought that finally the mixture would reachthe highest strength.
In the case of mixing cohesive soils with rubber waste, it is not possible to generalize thosemixtures’ behavior due to the diversity of the mechanical properties of this group of soils. For example,when analyzing deformation parameters, Carraro et al. [20] in triaxial tests with internal measurementof strains and bender elements observed a small increase in the Poisson’s ratio and a decrease in the
Geosciences 2019, 9, 352 3 of 16
stiffness modulus in the case of expansive soils with 6.7 mm granulate. The author is not aware of otherreports of similar scope, with the exception of a few other papers published by researchers gatheredaround Carraro, including Dunham-Friel and Carraro [34].
In turn, Ramirez et al. [18], also in CD triaxial tests, have shown a significant impact of confiningstress value on the shear strength of clay with granulate mixture. The strengthening of materialwas highest for the confining stress of 100 kPa at 10% addition of granulate, while for 400 kPa,the shear strength slightly diminished, whereas different behaviors are observed in direct shear tests.Cetin et al. [21] showed an increase in cohesion with the addition of rubber to 40%, and then its decreasewhen the addition of rubber was greater than 40%. In turn, Balasooriya et al. [19] observed a decreasein cohesion with the addition of rubber to 1.7%, and then its increase (with a rubber addition greaterthan 1.7%). Also, the value of the angle of internal friction behaves non-linearly, where its changes arefairly irregular [19,21]. Only Tafti and Emadi [35] observed a steady increase of the internal frictionangle. However, it should be noted that they only studied clayey soils with a small content of tire fibers(maximum 3%).
All those discrepancies observed in the soil-rubber mixtures behavior result from three basicreasons: soil type, type of rubber waste used (size/shape; e.g., [28,29,36,37]), and its percentage (weightor volume) content. According to European Committee for Standardization Workshop AgreementCEN CWA 14243:2002 [38], the following types of rubber waste are distinguished: powder (P) <1 mmand fine powder (F) <0.5 mm, granulate (G) 1–10 mm, chips (C) 10–50 mm, shreds (S) 50–300 mm,tire cuts (X) >300 mm, and buffings (B) 1–40 mm. American Society for Testing and Materials ASTMD 6270-08:2014 [39] suggests another division, with different size ranges: granulated rubber, groundrubber, powdered rubber, rough shreds, tire chips, tire-derived aggregate, and tire shreds, but theauthor will use the breakdown consistent with CEN CWA 14243:2002 [38]. Referring to the percentagecontent of rubber waste, most frequently, the rubber content in the mixture ranges from 5% to 50%,although additions of 60%–80% or 0.5%–5% are also encountered. Most often, in the case of smallreported rubber contents, additionally cement, fly ash, bottom ash, silica fume, and biomass silica areused [32,40–42]. Certain authors also take into account in the mixtures the fact of random or intentionaldistribution of rubber additive in the mixture. For example, Bałachowski and Gotteland observed afive-time decrease in the strength of the mixture with chips placed randomly compared against themixture with horizontally arranged chips [33].
The few examples presented prove various soil responses in the field of their physical andmechanical properties changes after adding rubber waste originating from tires to them and justify theneed to undertake further research in this direction.
3. Materials and Methods
3.1. Fine-Grained Soil
A cohesive soil originating from Triassic deposits in Patoka near Czestochowa, Southern Poland,was used in tests. Because of its characteristic reddish-brown color caused by the presence of ironcompounds, it was referred to as red clay (RC). On the basis of areometric [16], and with the use oflaser analyzer tests [43], the soil was classified as clay with silt (siCl) in accordance with PN-EN ISO14688-2:2006 [44]. According to classification consistent with the Unified Soil Classification System(USCS) [45], the soil subjected to the tests is clay with high plasticity (CH). According to Stempkowska’sX-ray diffraction [43], this soil is the expansive soil. Its basic parameters are presented in Tables 1 and 2.
3.2. Rubber Waste
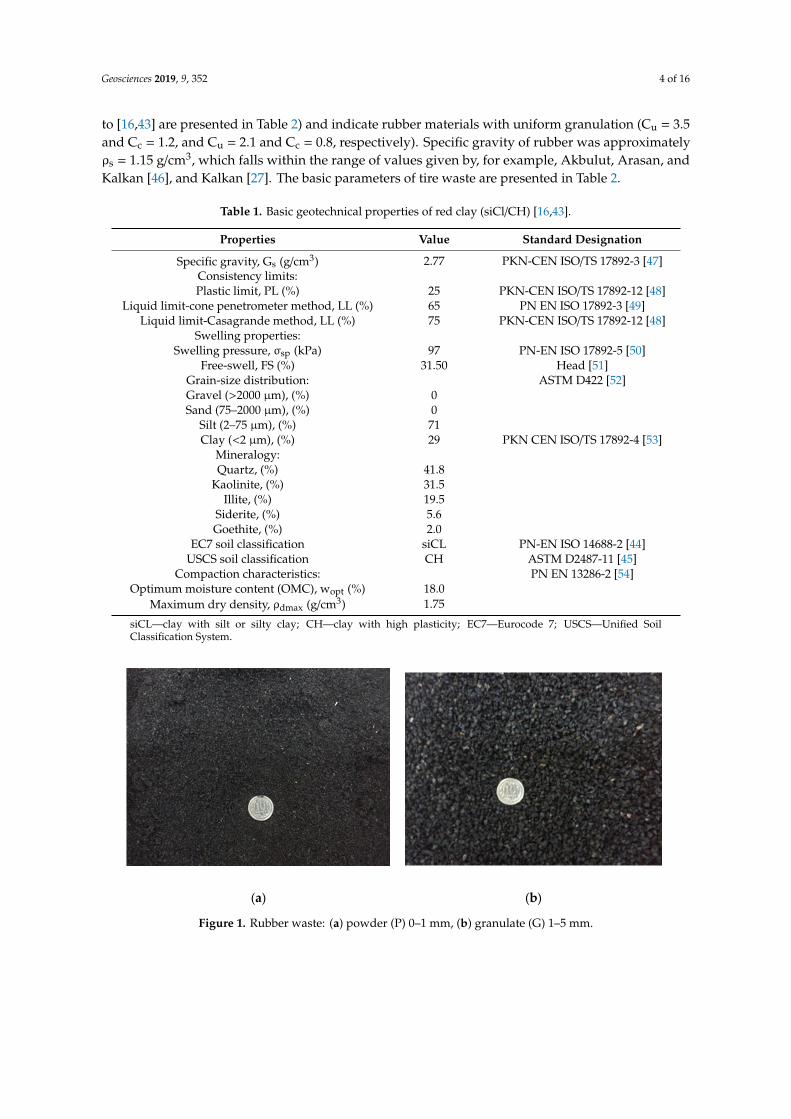
In this research, two sizes of tire waste were used: powder (P) 0.1–1.0 mm (Figure 1a) andgranulate (G) 1–5 mm (Figure 1b). Both rubber additives originated from two different local shreddingcompanies and contained negligible amounts of textile parts. The values of coefficient of uniformityand coefficient of curvature were obtained based on grain size curves (effective diameters according
Geosciences 2019, 9, 352 4 of 16
to [16,43] are presented in Table 2) and indicate rubber materials with uniform granulation (Cu = 3.5and Cc = 1.2, and Cu = 2.1 and Cc = 0.8, respectively). Specific gravity of rubber was approximatelyρs = 1.15 g/cm3, which falls within the range of values given by, for example, Akbulut, Arasan, andKalkan [46], and Kalkan [27]. The basic parameters of tire waste are presented in Table 2.
Table 1. Basic geotechnical properties of red clay (siCl/CH) [16,43].
Properties Value Standard Designation
Specific gravity, Gs (g/cm3) 2.77 PKN-CEN ISO/TS 17892-3 [47]Consistency limits:Plastic limit, PL (%) 25 PKN-CEN ISO/TS 17892-12 [48]
Liquid limit-cone penetrometer method, LL (%) 65 PN EN ISO 17892-3 [49]Liquid limit-Casagrande method, LL (%) 75 PKN-CEN ISO/TS 17892-12 [48]
Swelling properties:Swelling pressure, σsp (kPa) 97 PN-EN ISO 17892-5 [50]
Free-swell, FS (%) 31.50 Head [51]Grain-size distribution: ASTM D422 [52]Gravel (>2000 µm), (%) 0Sand (75–2000 µm), (%) 0
Silt (2–75 µm), (%) 71Clay (<2 µm), (%) 29 PKN CEN ISO/TS 17892-4 [53]
Mineralogy:Quartz, (%) 41.8
Kaolinite, (%) 31.5Illite, (%) 19.5
Siderite, (%) 5.6Goethite, (%) 2.0
EC7 soil classification siCL PN-EN ISO 14688-2 [44]USCS soil classification CH ASTM D2487-11 [45]
Compaction characteristics: PN EN 13286-2 [54]Optimum moisture content (OMC), wopt (%) 18.0
Maximum dry density, ρdmax (g/cm3) 1.75
siCL—clay with silt or silty clay; CH—clay with high plasticity; EC7—Eurocode 7; USCS—Unified SoilClassification System.
Geosciences 2019, 9, 352 4 of 16
(Cu = 3.5 and Cc = 1.2, and Cu = 2.1 and Cc = 0.8, respectively). Specific gravity of rubber was approximately ρs = 1.15 g/cm3, which falls within the range of values given by, for example, Akbulut, Arasan, and Kalkan [46], and Kalkan [27]. The basic parameters of tire waste are presented in Table 2.
Table 1. Basic geotechnical properties of red clay (siCl/CH) [16,43].
Properties Value Standard Designation Specific gravity, Gs (g/cm3) 2.77 PKN-CEN ISO/TS 17892-3 [47]
Consistency limits: Plastic limit, PL (%) 25 PKN-CEN ISO/TS 17892-12 [48]
Liquid limit-cone penetrometer method, LL (%) 65 PN EN ISO 17892-3 [49] Liquid limit-Casagrande method, LL (%) 75 PKN-CEN ISO/TS 17892-12 [48]
Swelling properties: Swelling pressure, σsp (kPa) 97 PN-EN ISO 17892-5 [50]
Free-swell, FS (%) 31.50 Head [51] Grain-size distribution: ASTM D422 [52] Gravel (>2000 μm), (%) 0 Sand (75–2000 μm), (%) 0
Silt (2–75 μm), (%) 71 Clay (<2 μm), (%) 29 PKN CEN ISO/TS 17892-4 [53]
Mineralogy: Quartz, (%) 41.8
Kaolinite, (%) 31.5 Illite, (%) 19.5
Siderite, (%) 5.6 Goethite, (%) 2.0
EC7 soil classification siCL PN-EN ISO 14688-2 [44] USCS soil classification CH ASTM D2487-11 [45]
Compaction characteristics: PN EN 13286-2 [54] Optimum moisture content (OMC), wopt (%) 18.0
Maximum dry density, ρdmax (g/cm3) 1.75 siCL – clay with silt or silty clay; CH – clay with high plasticity; EC7 – Eurocode 7; USCS – Unified Soil Classification System.
(a) (b)
Figure 1. Rubber waste: (a) powder (P) 0–1 mm, (b) granulate (G) 1–5 mm.
Table 2. Physical properties of the red clay (siCl/CH), powder (P) and granulate (G), based on the grain-size distribution curves [16,43].
Figure 1. Rubber waste: (a) powder (P) 0–1 mm, (b) granulate (G) 1–5 mm.
Geosciences 2019, 9, 352 5 of 16
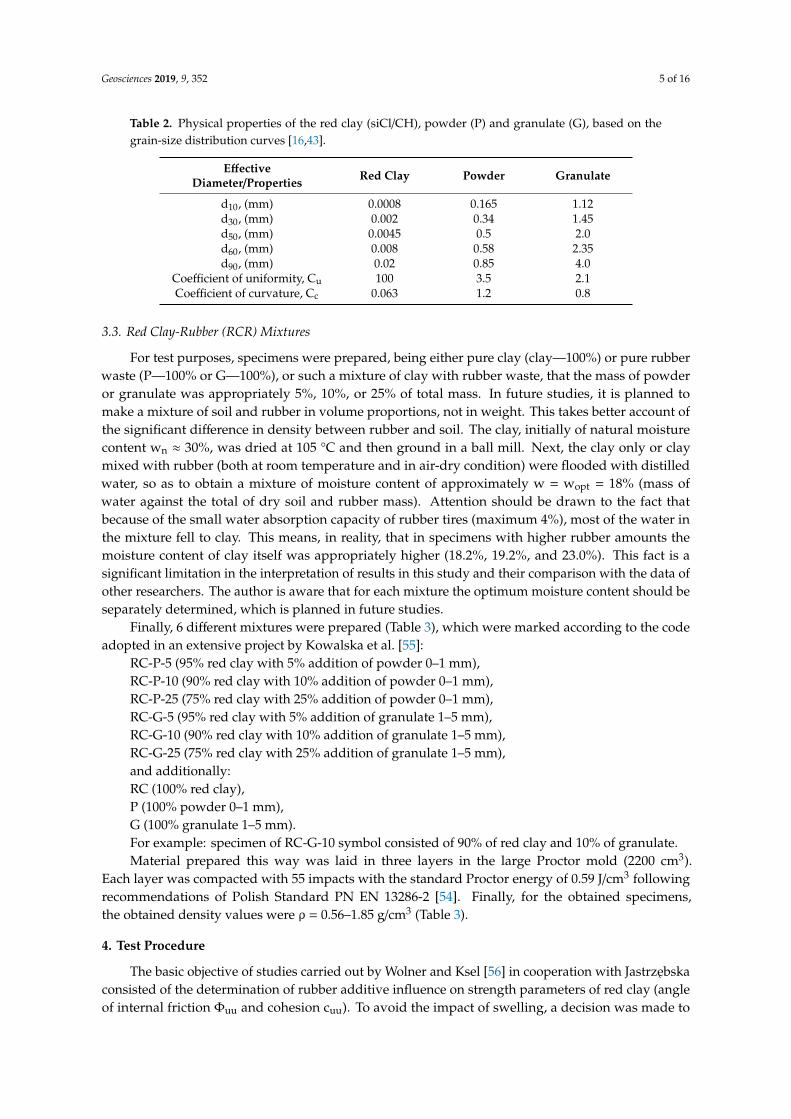
Table 2. Physical properties of the red clay (siCl/CH), powder (P) and granulate (G), based on thegrain-size distribution curves [16,43].
EffectiveDiameter/Properties Red Clay Powder Granulate
d10, (mm) 0.0008 0.165 1.12d30, (mm) 0.002 0.34 1.45d50, (mm) 0.0045 0.5 2.0d60, (mm) 0.008 0.58 2.35d90, (mm) 0.02 0.85 4.0
Coefficient of uniformity, Cu 100 3.5 2.1Coefficient of curvature, Cc 0.063 1.2 0.8
3.3. Red Clay-Rubber (RCR) Mixtures
For test purposes, specimens were prepared, being either pure clay (clay—100%) or pure rubberwaste (P—100% or G—100%), or such a mixture of clay with rubber waste, that the mass of powderor granulate was appropriately 5%, 10%, or 25% of total mass. In future studies, it is planned tomake a mixture of soil and rubber in volume proportions, not in weight. This takes better account ofthe significant difference in density between rubber and soil. The clay, initially of natural moisturecontent wn ≈ 30%, was dried at 105 °C and then ground in a ball mill. Next, the clay only or claymixed with rubber (both at room temperature and in air-dry condition) were flooded with distilledwater, so as to obtain a mixture of moisture content of approximately w = wopt = 18% (mass ofwater against the total of dry soil and rubber mass). Attention should be drawn to the fact thatbecause of the small water absorption capacity of rubber tires (maximum 4%), most of the water inthe mixture fell to clay. This means, in reality, that in specimens with higher rubber amounts themoisture content of clay itself was appropriately higher (18.2%, 19.2%, and 23.0%). This fact is asignificant limitation in the interpretation of results in this study and their comparison with the data ofother researchers. The author is aware that for each mixture the optimum moisture content should beseparately determined, which is planned in future studies.
Finally, 6 different mixtures were prepared (Table 3), which were marked according to the codeadopted in an extensive project by Kowalska et al. [55]:
RC-P-5 (95% red clay with 5% addition of powder 0–1 mm),RC-P-10 (90% red clay with 10% addition of powder 0–1 mm),RC-P-25 (75% red clay with 25% addition of powder 0–1 mm),RC-G-5 (95% red clay with 5% addition of granulate 1–5 mm),RC-G-10 (90% red clay with 10% addition of granulate 1–5 mm),RC-G-25 (75% red clay with 25% addition of granulate 1–5 mm),and additionally:RC (100% red clay),P (100% powder 0–1 mm),G (100% granulate 1–5 mm).For example: specimen of RC-G-10 symbol consisted of 90% of red clay and 10% of granulate.Material prepared this way was laid in three layers in the large Proctor mold (2200 cm3).
Each layer was compacted with 55 impacts with the standard Proctor energy of 0.59 J/cm3 followingrecommendations of Polish Standard PN EN 13286-2 [54]. Finally, for the obtained specimens,the obtained density values were ρ = 0.56–1.85 g/cm3 (Table 3).
4. Test Procedure
The basic objective of studies carried out by Wolner and Ksel [56] in cooperation with Jastrzebskaconsisted of the determination of rubber additive influence on strength parameters of red clay (angleof internal friction Φuu and cohesion cuu). To avoid the impact of swelling, a decision was made to
Geosciences 2019, 9, 352 6 of 16
perform UU triaxial tests (unconsolidated undrained) in accordance with the European StandardPKN-CEN ISO/TS 17892-8:2009 [57]. For the same reason, specimens were not saturated with deaeratedwater prior to shearing, contrary to Tajdini et al. [31] whose samples of non-swelling kaolin weresaturated before the tests (first by the injection of CO2, then by deaerated water flushing). Thanks tolimiting the swelling of samples in UU triaxial tests in this study and the use of non-swelling materialin Tajdini et al.’s tests [31], the author decided to compare the results mostly to Tajdini et al.’s data [31].Because of the specific nature of the studied materials (pure red clay, clay with addition of rubberpowder or granulate, pure powder or granulate), three various forms of specimens formed for triaxialtests were applied, each of them was d = 38 mm in diameter and h = 80 mm high. A minimum of3 specimens were prepared for each type of material, except for pure clay, their number was 6 (in total30 specimens).
4.1. Preparation of Proper Specimens from Clay and from a Clay-Rubber Waste Mixture
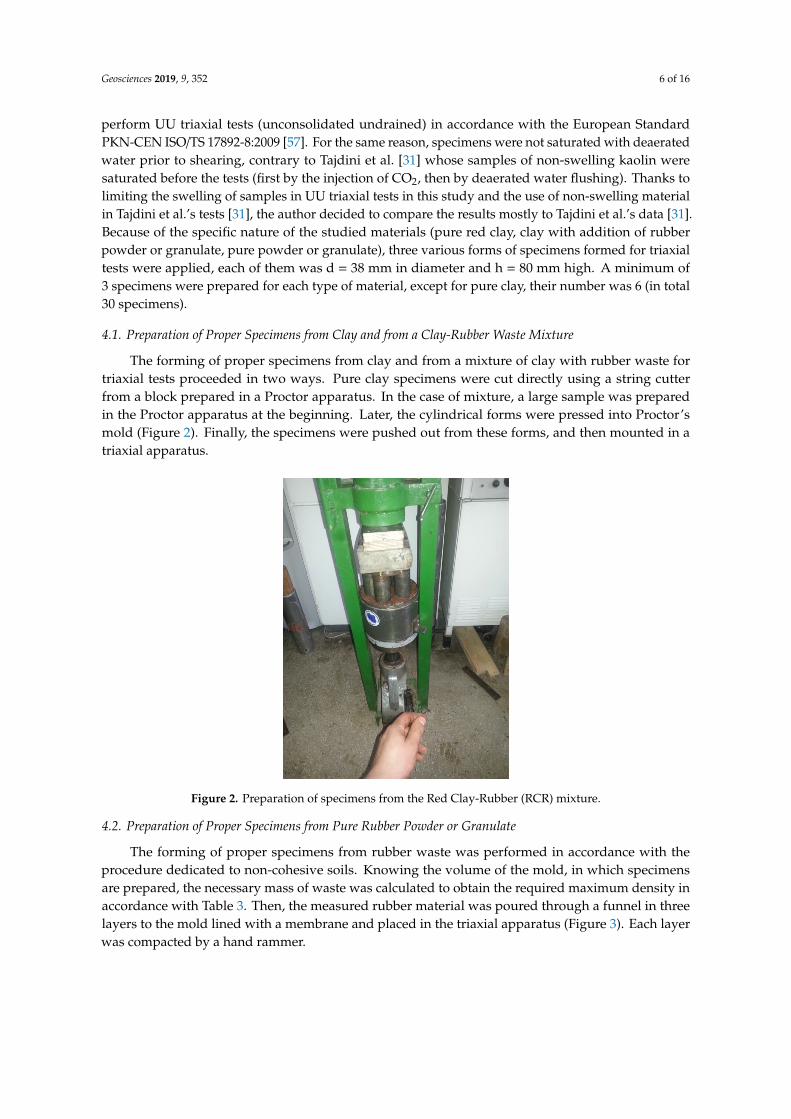
The forming of proper specimens from clay and from a mixture of clay with rubber waste fortriaxial tests proceeded in two ways. Pure clay specimens were cut directly using a string cutterfrom a block prepared in a Proctor apparatus. In the case of mixture, a large sample was preparedin the Proctor apparatus at the beginning. Later, the cylindrical forms were pressed into Proctor’smold (Figure 2). Finally, the specimens were pushed out from these forms, and then mounted in atriaxial apparatus.
Geosciences 2019, 9, 352 6 of 16
Thanks to limiting the swelling of samples in UU triaxial tests in this study and the use of non-swelling material in Tajdini et al.’s tests [31], the author decided to compare the results mostly to Tajdini et al.’s data [31]. Because of the specific nature of the studied materials (pure red clay, clay with addition of rubber powder or granulate, pure powder or granulate), three various forms of specimens formed for triaxial tests were applied, each of them was d = 38 mm in diameter and h = 80 mm high. A minimum of 3 specimens were prepared for each type of material, except for pure clay, their number was 6 (in total 30 specimens).
4.1. Preparation of Proper Specimens from Clay and from a Clay-Rubber Waste Mixture
The forming of proper specimens from clay and from a mixture of clay with rubber waste for triaxial tests proceeded in two ways. Pure clay specimens were cut directly using a string cutter from a block prepared in a Proctor apparatus. In the case of mixture, a large sample was prepared in the Proctor apparatus at the beginning. Later, the cylindrical forms were pressed into Proctor's mold (Figure 2). Finally, the specimens were pushed out from these forms, and then mounted in a triaxial apparatus.
4.2. Preparation of Proper Specimens from Pure Rubber Powder or Granulate
The forming of proper specimens from rubber waste was performed in accordance with the procedure dedicated to non-cohesive soils. Knowing the volume of the mold, in which specimens are prepared, the necessary mass of waste was calculated to obtain the required maximum density in accordance with Table 3. Then, the measured rubber material was poured through a funnel in three layers to the mold lined with a membrane and placed in the triaxial apparatus (Figure 3). Each layer was compacted by a hand rammer.
Figure 2. Preparation of specimens from the Red Clay-Rubber (RCR) mixture. Figure 2. Preparation of specimens from the Red Clay-Rubber (RCR) mixture.
4.2. Preparation of Proper Specimens from Pure Rubber Powder or Granulate
The forming of proper specimens from rubber waste was performed in accordance with theprocedure dedicated to non-cohesive soils. Knowing the volume of the mold, in which specimensare prepared, the necessary mass of waste was calculated to obtain the required maximum density inaccordance with Table 3. Then, the measured rubber material was poured through a funnel in threelayers to the mold lined with a membrane and placed in the triaxial apparatus (Figure 3). Each layerwas compacted by a hand rammer.

Geosciences 2019, 9, 352 7 of 16
Geosciences 2019, 9, 352 7 of 16
Figure 3. Preparation of specimens from the pure powder or granulate.
4.3. Tests Conditions
A constant loading rate (strain controlled) equal to vs = 7.2 mm/h was applied in UU triaxial tests. A change of specimen height and the value of shear force were recorded during shearing. Each series of tests was carried out at confining stresses equal to σ3 = 50 kPa, 100 kPa, and 200 kPa. Because of the tests and specimen type (unsaturated and unconsolidated), the effective stresses were not considered at the results interpretation.
5. Results and Discussion
The influence of the rubber addition on red clay was already observed at the stage of specimens for proper tests preparation in a Proctor apparatus. The obtained values of density ρ = 0.56–1.85 g/cm3 (Table 3) clearly prove that the addition of powder or granulate reduces the density of pure red clay by approximately 2.2% and 3.8% (for P-5 and G-5, respectively). For P-10 and G-10 this is a reduction by 6.0% and 7.6%, while in the case of 25% rubber addition, the declines are 14.1% (P-25), and 16.8% (G-25). The given values show that the higher the grain size of rubber waste, the higher the decrease of density, which results from a low specific gravity of rubber itself and from reduced compaction efficiency due to the elasticity of rubber particles. This relationship is confirmed by most researchers, e.g., Yadav and Tiwari [58].
Table 3. Results of strength parameters φuu and cuu and of density ρ determination for studied materials obtained for moisture content w = 18%.
Material Rubber Content
(%)
Internal Angle of
Friction Uu (⁰)
Ratio of Improvement in Angle of Friction
Cohesion cuu (kPa)
Ratio of Reduction in
Cohesion
Density for w = 18%
(g/cm3)
RC 0 21.03 - 167.45 - 1.85 RC-P-5 5 21.21 1.0 55.66 0.33 1.81 RC-P-10 10 23.12 1.1 69.60 0.42 1.74 RC-P-25 25 24.93 1.19 69.71 0.42 1.59
P 100 27.50 - 1.72 - 0.56 RC-G-5 5 21.17 1.0 114.88 0.69 1.78 RC-G-10 10 24.37 1.16 62.00 0.37 1.71 RC-G-25 25 27.63 1.31 21.51 0.13 1.54
G 100 28.74 - 6.06 - 0.61
Results of UU triaxial tests are presented in the form of angle of internal friction Φuu or cohesion cuu changes depending on the powder or granulate content (Figures 4 and 5) and in the form of shear characteristics in Figure 6.
In addition, Figure 7 shows the plots of the shear stress against the confining stress for the (RC) and the (RCR) mixtures (this study), and for the clay and clay-crumb mixtures (Tajdini et al.’s tests
Figure 3. Preparation of specimens from the pure powder or granulate.
4.3. Tests Conditions
A constant loading rate (strain controlled) equal to vs = 7.2 mm/h was applied in UU triaxial tests.A change of specimen height and the value of shear force were recorded during shearing. Each seriesof tests was carried out at confining stresses equal to σ3 = 50 kPa, 100 kPa, and 200 kPa. Because of thetests and specimen type (unsaturated and unconsolidated), the effective stresses were not consideredat the results interpretation.
5. Results and Discussion
The influence of the rubber addition on red clay was already observed at the stage of specimensfor proper tests preparation in a Proctor apparatus. The obtained values of density ρ = 0.56–1.85 g/cm3
(Table 3) clearly prove that the addition of powder or granulate reduces the density of pure red clay byapproximately 2.2% and 3.8% (for P-5 and G-5, respectively). For P-10 and G-10 this is a reductionby 6.0% and 7.6%, while in the case of 25% rubber addition, the declines are 14.1% (P-25), and 16.8%(G-25). The given values show that the higher the grain size of rubber waste, the higher the decreaseof density, which results from a low specific gravity of rubber itself and from reduced compactionefficiency due to the elasticity of rubber particles. This relationship is confirmed by most researchers,e.g., Yadav and Tiwari [58].
Table 3. Results of strength parameters Φuu and cuu and of density ρ determination for studiedmaterials obtained for moisture content w = 18%.
Material RubberContent (%)
Internal Angleof Friction
Φuu (0)
Ratio ofImprovement inAngle of Friction
Cohesion cuu(kPa)
Ratio ofReduction in
Cohesion
Density for w= 18% (g/cm3)
RC 0 21.03 - 167.45 - 1.85
RC-P-5 5 21.21 1.0 55.66 0.33 1.81
RC-P-10 10 23.12 1.1 69.60 0.42 1.74
RC-P-25 25 24.93 1.19 69.71 0.42 1.59
P 100 27.50 - 1.72 - 0.56
RC-G-5 5 21.17 1.0 114.88 0.69 1.78
RC-G-10 10 24.37 1.16 62.00 0.37 1.71
RC-G-25 25 27.63 1.31 21.51 0.13 1.54
G 100 28.74 - 6.06 - 0.61
Results of UU triaxial tests are presented in the form of angle of internal friction Φuu or cohesioncuu changes depending on the powder or granulate content (Figures 4 and 5) and in the form of shearcharacteristics in Figure 6.

Geosciences 2019, 9, 352 8 of 16
In addition, Figure 7 shows the plots of the shear stress against the confining stress for the (RC)and the (RCR) mixtures (this study), and for the clay and clay-crumb mixtures (Tajdini et al.’s tests [31]).In turn, Figure 8 shows the variation of deviator stress at failure with rubber waste content for this studyand Tajdini et al.’s tests [31]. The results interpretation is supplemented with Figure 9, which showsthe variation of the failure strain ε1,f with confining stress (this study and Tajdini et al.’s tests [31]).
5.1. The Effect of Rubber Waste on the Shear Strength Parameters
The analysis of results shows a clear influence of rubber additives on the strength properties ofsoil-rubber mixtures. The results of all tests are specified in Table 3. It has been noticed that the additionof 5% of powder or granulate practically does not affect the value of Φuu (change of approximately1%). At a further increase in the rubber waste content in the mixture, the angle of internal friction Φuu
also grows. Higher increments are observed when rubber granulate has been added to clay, so forcontents: (P-10)—∆Φuu = +10%, (G-10)—∆Φuu = +16%, (P-25)—∆Φuu = +19%, (G-25)—∆Φuu = +31%(Figure 4).
Geosciences 2019, 9, 352 8 of 16
[31]). In turn, Figure 8 shows the variation of deviator stress at failure with rubber waste content for this study and Tajdini et al.’s tests [31]. The results interpretation is supplemented with Figure 9, which shows the variation of the failure strain ε1,f with confining stress (this study and Tajdini et al.’s tests [31]).
5.1. The Effect of Rubber Waste on the Shear Strength Parameters
The analysis of results shows a clear influence of rubber additives on the strength properties of soil-rubber mixtures. The results of all tests are specified in Table 3. It has been noticed that the addition of 5% of powder or granulate practically does not affect the value of Φuu (change of approximately 1%). At a further increase in the rubber waste content in the mixture, the angle of internal friction Φuu also grows. Higher increments are observed when rubber granulate has been added to clay, so for contents: (P-10)—ΔΦuu = +10%, (G-10)—ΔΦuu = +16%, (P-25)—ΔΦuu = +19%, (G-25)—ΔΦuu = +31% (Figure 4).
Figure 4. Variation of the angle of internal friction with the rubber waste content.
By analyzing the obtained values of cohesion cuu, it has been found that rubber additives cause its decisive decline in mixture, the higher it is, the bigger their grain size and percentage composition (Figure 5). This fact can be explained by the decreasing domination of electromagnetic force between clay particles, which results in the separation of soil particles due to the increasing content of rubber waste. The following relationships have been observed in presented studies. For contents: 10% and 25% of powder—Δcuu = −58%, 10% granulate—Δcuu = −63%, 25% granulate—Δcuu = −87%. Although the disturbance of general trend in the mixture containing 5% powder content seems problematic, for which the cohesion decrease is higher than for the other mixtures with powder (Δcuu = −67% > −58%), contrary to 5% of granulate, where Δcuu = −32% < −63% < −87%. This requires the performance of the next tests to confirm or reject a similar relationship.
Figure 4. Variation of the angle of internal friction with the rubber waste content.
By analyzing the obtained values of cohesion cuu, it has been found that rubber additives cause itsdecisive decline in mixture, the higher it is, the bigger their grain size and percentage composition(Figure 5). This fact can be explained by the decreasing domination of electromagnetic force betweenclay particles, which results in the separation of soil particles due to the increasing content of rubberwaste. The following relationships have been observed in presented studies. For contents: 10% and25% of powder—∆cuu = −58%, 10% granulate—∆cuu = −63%, 25% granulate—∆cuu = −87%. Althoughthe disturbance of general trend in the mixture containing 5% powder content seems problematic, forwhich the cohesion decrease is higher than for the other mixtures with powder (∆cuu = −67% > −58%),contrary to 5% of granulate, where ∆cuu = −32% < −63% < −87%. This requires the performance of thenext tests to confirm or reject a similar relationship.
It is worth drawing attention to the fact that results of presented tests can be compared with onlyone paper, in which authors also were carrying out UU triaxial tests on specimens of kaolinite clayand kaolinite clay-crumb rubber mixtures [31]. In both cases, for rubber waste there are similar valuesof angle of internal friction −27.5◦ for powder and 28.7◦ for granulate (in this study) and 19◦–26◦
for crumb [31] as well as cohesion—1.7 kPa for powder and 6 kPa for granulate (in this study) and1–5 kPa for crumb [24]. Tajdini et al. [31], in mixtures with kaolin, were using crumb-type waste intwo size ranges: 2–5 mm (marked by symbol G30) and 1–3 mm (marked by symbol G80) and withthree weight contents: 5%, 10%, and 15%. In the study by Tajdini et al. [31], an increase in the angle of
Geosciences 2019, 9, 352 9 of 16
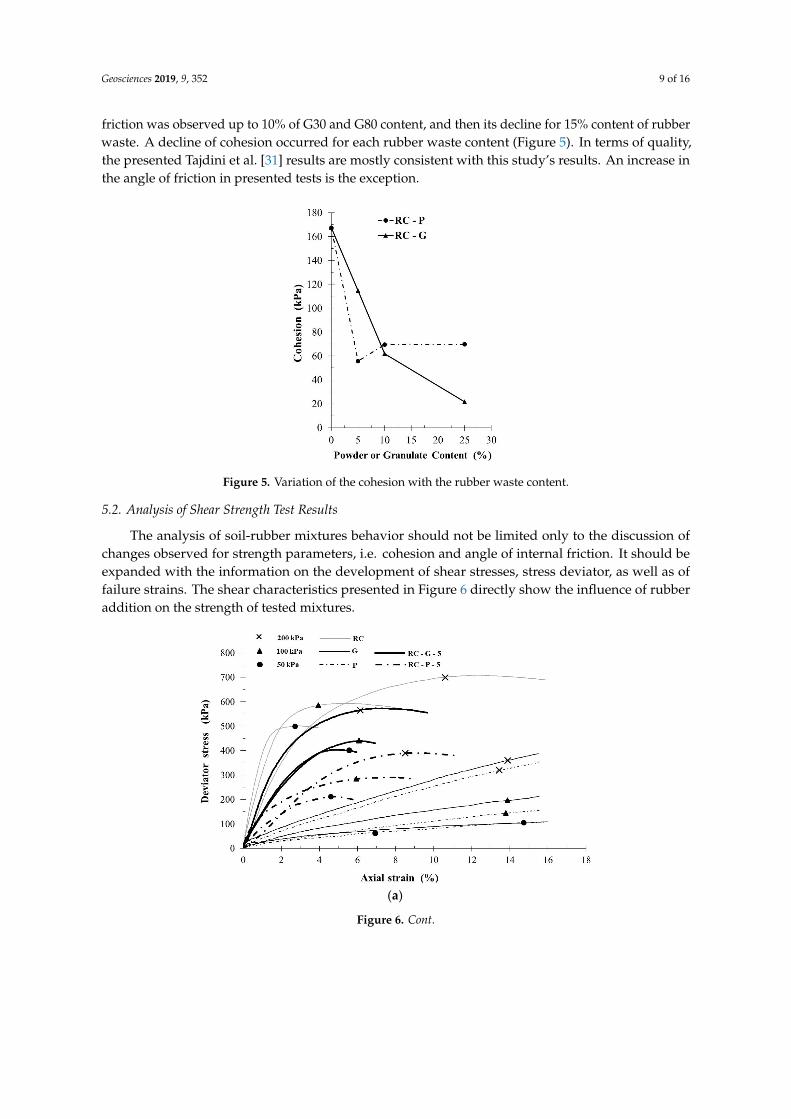
friction was observed up to 10% of G30 and G80 content, and then its decline for 15% content of rubberwaste. A decline of cohesion occurred for each rubber waste content (Figure 5). In terms of quality,the presented Tajdini et al. [31] results are mostly consistent with this study’s results. An increase inthe angle of friction in presented tests is the exception.Geosciences 2019, 9, 352 9 of 16
Figure 5. Variation of the cohesion with the rubber waste content.
It is worth drawing attention to the fact that results of presented tests can be compared with only one paper, in which authors also were carrying out UU triaxial tests on specimens of kaolinite clay and kaolinite clay-crumb rubber mixtures [31]. In both cases, for rubber waste there are similar values of angle of internal friction −27.5° for powder and 28.7° for granulate (in this study) and 19°–26° for crumb [31] as well as cohesion—1.7 kPa for powder and 6 kPa for granulate (in this study) and 1–5 kPa for crumb [24]. Tajdini et al. [31], in mixtures with kaolin, were using crumb-type waste in two size ranges: 2–5 mm (marked by symbol G30) and 1–3 mm (marked by symbol G80) and with three weight contents: 5%, 10%, and 15%. In the study by Tajdini et al. [31], an increase in the angle of friction was observed up to 10% of G30 and G80 content, and then its decline for 15% content of rubber waste. A decline of cohesion occurred for each rubber waste content (Figure 5). In terms of quality, the presented Tajdini et al. [31] results are mostly consistent with this study’s results. An increase in the angle of friction in presented tests is the exception.
5.2. Analysis of Shear Strength Test Results
The analysis of soil-rubber mixtures behavior should not be limited only to the discussion of changes observed for strength parameters, i.e. cohesion and angle of internal friction. It should be expanded with the information on the development of shear stresses, stress deviator, as well as of failure strains. The shear characteristics presented in Figure 6 directly show the influence of rubber addition on the strength of tested mixtures.
(a)
Figure 5. Variation of the cohesion with the rubber waste content.
5.2. Analysis of Shear Strength Test Results
The analysis of soil-rubber mixtures behavior should not be limited only to the discussion ofchanges observed for strength parameters, i.e. cohesion and angle of internal friction. It should beexpanded with the information on the development of shear stresses, stress deviator, as well as offailure strains. The shear characteristics presented in Figure 6 directly show the influence of rubberaddition on the strength of tested mixtures.
Geosciences 2019, 9, 352 9 of 16
Figure 5. Variation of the cohesion with the rubber waste content.
It is worth drawing attention to the fact that results of presented tests can be compared with only one paper, in which authors also were carrying out UU triaxial tests on specimens of kaolinite clay and kaolinite clay-crumb rubber mixtures [31]. In both cases, for rubber waste there are similar values of angle of internal friction −27.5° for powder and 28.7° for granulate (in this study) and 19°–26° for crumb [31] as well as cohesion—1.7 kPa for powder and 6 kPa for granulate (in this study) and 1–5 kPa for crumb [24]. Tajdini et al. [31], in mixtures with kaolin, were using crumb-type waste in two size ranges: 2–5 mm (marked by symbol G30) and 1–3 mm (marked by symbol G80) and with three weight contents: 5%, 10%, and 15%. In the study by Tajdini et al. [31], an increase in the angle of friction was observed up to 10% of G30 and G80 content, and then its decline for 15% content of rubber waste. A decline of cohesion occurred for each rubber waste content (Figure 5). In terms of quality, the presented Tajdini et al. [31] results are mostly consistent with this study’s results. An increase in the angle of friction in presented tests is the exception.
5.2. Analysis of Shear Strength Test Results
The analysis of soil-rubber mixtures behavior should not be limited only to the discussion of changes observed for strength parameters, i.e. cohesion and angle of internal friction. It should be expanded with the information on the development of shear stresses, stress deviator, as well as of failure strains. The shear characteristics presented in Figure 6 directly show the influence of rubber addition on the strength of tested mixtures.
(a)
Figure 6. Cont.
Geosciences 2019, 9, 352 10 of 16Geosciences 2019, 9, 352 10 of 16
(b)
(c)
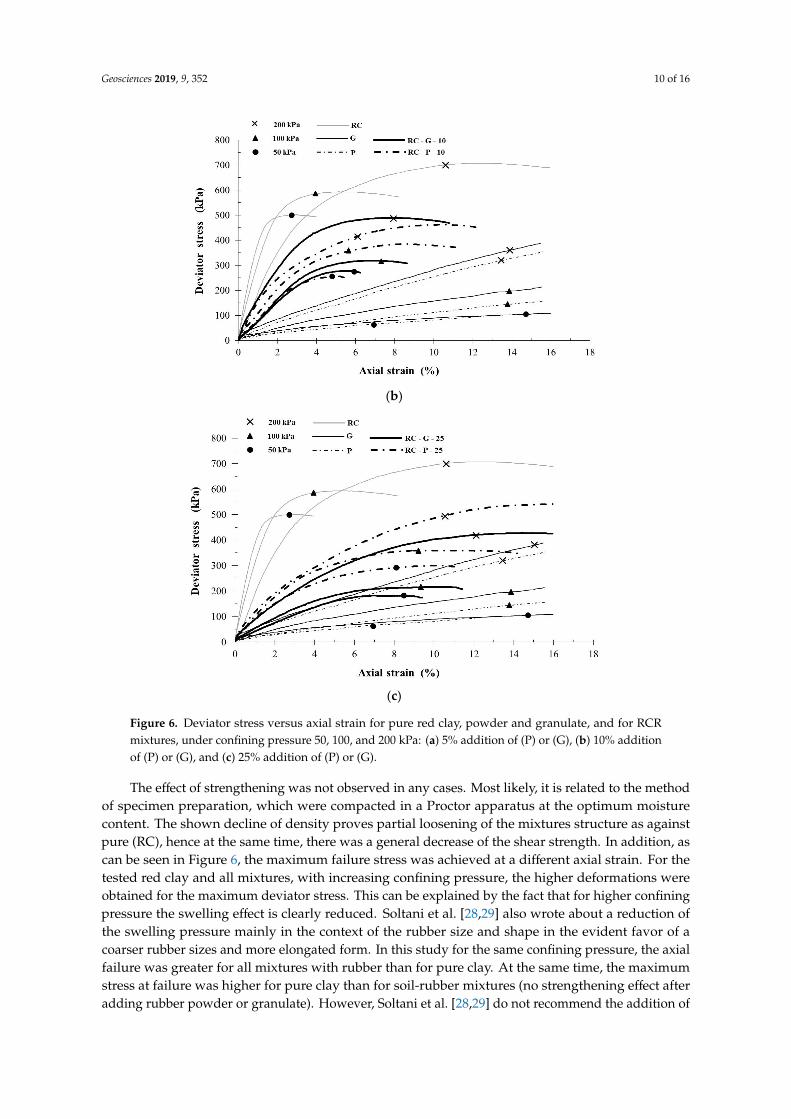
Figure 6. Deviator stress versus axial strain for pure red clay, powder and granulate, and for RCR mixtures, under confining pressure 50, 100, and 200 kPa: (a) 5% addition of (P) or (G), (b) 10% addition of (P) or (G), and (c) 25% addition of (P) or (G).
The effect of strengthening was not observed in any cases. Most likely, it is related to the method of specimen preparation, which were compacted in a Proctor apparatus at the optimum moisture content. The shown decline of density proves partial loosening of the mixtures structure as against pure (RC), hence at the same time, there was a general decrease of the shear strength. In addition, as can be seen in Figure 6, the maximum failure stress was achieved at a different axial strain. For the tested red clay and all mixtures, with increasing confining pressure, the higher deformations were obtained for the maximum deviator stress. This can be explained by the fact that for higher confining pressure the swelling effect is clearly reduced. Soltani et al. [28,29] also wrote about a reduction of the swelling pressure mainly in the context of the rubber size and shape in the evident favor of a coarser rubber sizes and more elongated form. In this study for the same confining pressure, the axial failure was greater for all mixtures with rubber than for pure clay. At the same time, the maximum stress at failure was higher for pure clay than for soil-rubber mixtures (no strengthening effect after adding rubber powder or granulate). However, Soltani et al. [28,29] do not recommend the addition of rubber at more than 20%, because then a decrease in the mixture strength is observed. The reduction in strengthening may improve the small addition of polymers (0.2 g/l) to the soil-rubber
Figure 6. Deviator stress versus axial strain for pure red clay, powder and granulate, and for RCRmixtures, under confining pressure 50, 100, and 200 kPa: (a) 5% addition of (P) or (G), (b) 10% additionof (P) or (G), and (c) 25% addition of (P) or (G).
The effect of strengthening was not observed in any cases. Most likely, it is related to the methodof specimen preparation, which were compacted in a Proctor apparatus at the optimum moisturecontent. The shown decline of density proves partial loosening of the mixtures structure as againstpure (RC), hence at the same time, there was a general decrease of the shear strength. In addition, ascan be seen in Figure 6, the maximum failure stress was achieved at a different axial strain. For thetested red clay and all mixtures, with increasing confining pressure, the higher deformations wereobtained for the maximum deviator stress. This can be explained by the fact that for higher confiningpressure the swelling effect is clearly reduced. Soltani et al. [28,29] also wrote about a reduction ofthe swelling pressure mainly in the context of the rubber size and shape in the evident favor of acoarser rubber sizes and more elongated form. In this study for the same confining pressure, the axialfailure was greater for all mixtures with rubber than for pure clay. At the same time, the maximumstress at failure was higher for pure clay than for soil-rubber mixtures (no strengthening effect afteradding rubber powder or granulate). However, Soltani et al. [28,29] do not recommend the addition of
Geosciences 2019, 9, 352 11 of 16
rubber at more than 20%, because then a decrease in the mixture strength is observed. The reduction instrengthening may improve the small addition of polymers (0.2 g/l) to the soil-rubber mixtures [30] oradding only 10% of the rubber to the expansive soil so as to obtain a favorable relationship betweenreinforcement and swelling reduction [37].
At the same time, Tajdini et al. [31] have shown strengthening of clay-crumb mixtures againstpure clay, where for both types of materials in UU tests the specimens were damaged at lower shearstresses than in CD tests. The presented studies have not shown strengthening of (RCR) mixtures(Figures 7 and 8).
Geosciences 2019, 9, 352 11 of 16
mixtures [30] or adding only 10% of the rubber to the expansive soil so as to obtain a favorable relationship between reinforcement and swelling reduction [37].
At the same time, Tajdini et al. [31] have shown strengthening of clay-crumb mixtures against pure clay, where for both types of materials in UU tests the specimens were damaged at lower shear stresses than in CD tests. The presented studies have not shown strengthening of (RCR) mixtures (Figures 7 and 8).
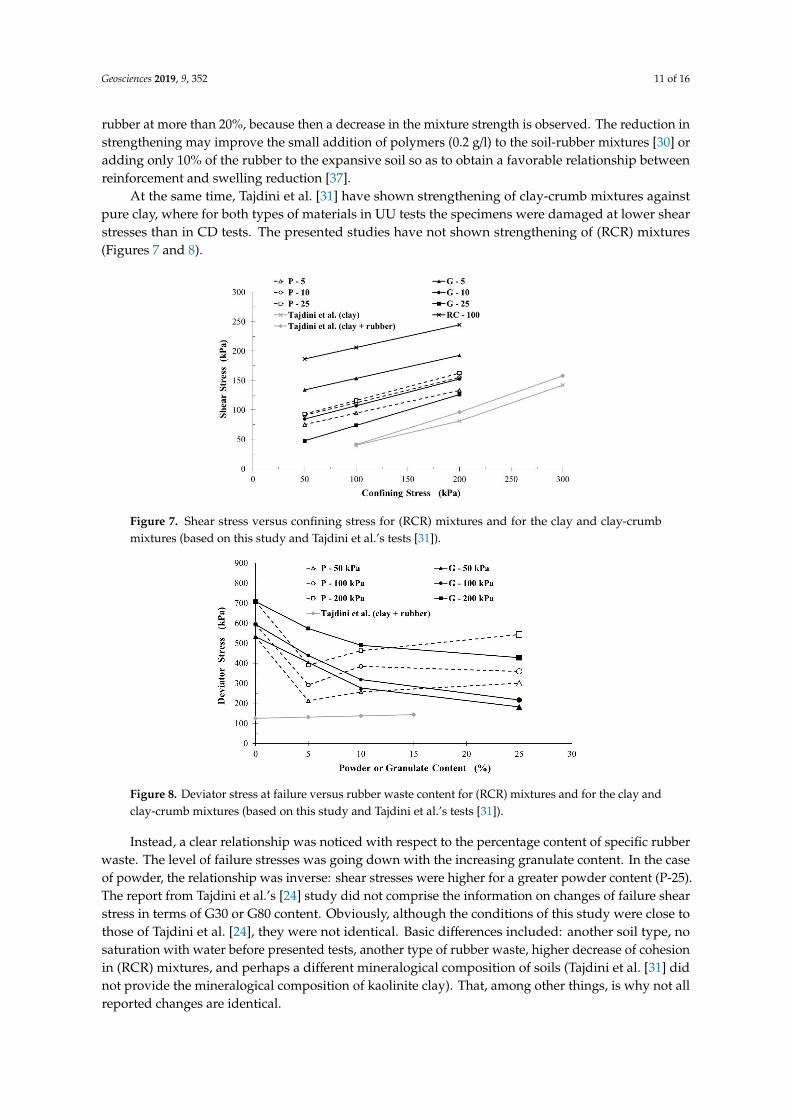
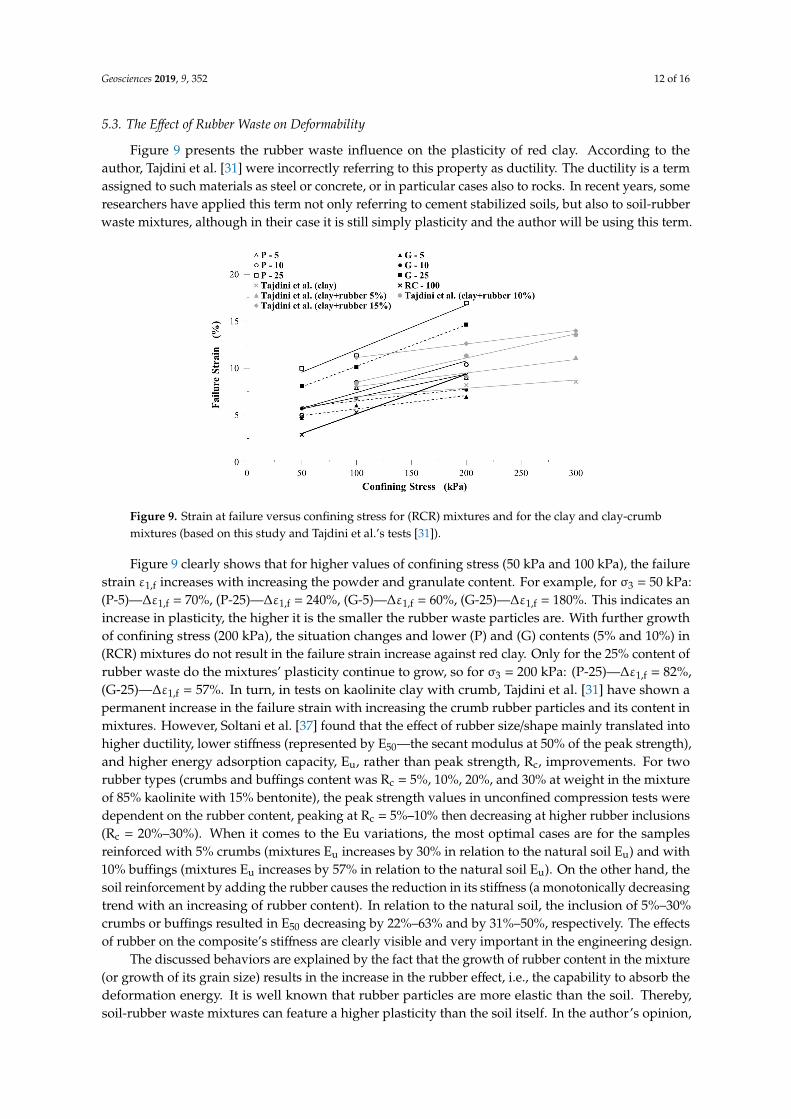
Figure 7. Shear stress versus confining stress for (RCR) mixtures and for the clay and clay-crumb mixtures (based on this study and Tajdini et al.’s tests [31]).
Figure 8. Deviator stress at failure versus rubber waste content for (RCR) mixtures and for the clay and clay-crumb mixtures (based on this study and Tajdini et al.’s tests [31]).
Instead, a clear relationship was noticed with respect to the percentage content of specific rubber waste. The level of failure stresses was going down with the increasing granulate content. In the case of powder, the relationship was inverse: shear stresses were higher for a greater powder content (P-25). The report from Tajdini et al.’s [24] study did not comprise the information on changes of failure shear stress in terms of G30 or G80 content. Obviously, although the conditions of this study were close to those of Tajdini et al. [24], they were not identical. Basic differences included: another soil type, no saturation with water before presented tests, another type of rubber waste, higher decrease of cohesion in (RCR) mixtures, and perhaps a different mineralogical composition of soils (Tajdini et al. [31] did not provide the mineralogical composition of kaolinite clay). That, among other things, is why not all reported changes are identical.
5.3. The Effect of Rubber Waste on Deformability
Figure 7. Shear stress versus confining stress for (RCR) mixtures and for the clay and clay-crumbmixtures (based on this study and Tajdini et al.’s tests [31]).
Geosciences 2019, 9, 352 11 of 16
mixtures [30] or adding only 10% of the rubber to the expansive soil so as to obtain a favorable relationship between reinforcement and swelling reduction [37].
At the same time, Tajdini et al. [31] have shown strengthening of clay-crumb mixtures against pure clay, where for both types of materials in UU tests the specimens were damaged at lower shear stresses than in CD tests. The presented studies have not shown strengthening of (RCR) mixtures (Figures 7 and 8).
Figure 7. Shear stress versus confining stress for (RCR) mixtures and for the clay and clay-crumb mixtures (based on this study and Tajdini et al.’s tests [31]).
Figure 8. Deviator stress at failure versus rubber waste content for (RCR) mixtures and for the clay and clay-crumb mixtures (based on this study and Tajdini et al.’s tests [31]).
Instead, a clear relationship was noticed with respect to the percentage content of specific rubber waste. The level of failure stresses was going down with the increasing granulate content. In the case of powder, the relationship was inverse: shear stresses were higher for a greater powder content (P-25). The report from Tajdini et al.’s [24] study did not comprise the information on changes of failure shear stress in terms of G30 or G80 content. Obviously, although the conditions of this study were close to those of Tajdini et al. [24], they were not identical. Basic differences included: another soil type, no saturation with water before presented tests, another type of rubber waste, higher decrease of cohesion in (RCR) mixtures, and perhaps a different mineralogical composition of soils (Tajdini et al. [31] did not provide the mineralogical composition of kaolinite clay). That, among other things, is why not all reported changes are identical.
5.3. The Effect of Rubber Waste on Deformability
Figure 8. Deviator stress at failure versus rubber waste content for (RCR) mixtures and for the clay andclay-crumb mixtures (based on this study and Tajdini et al.’s tests [31]).
Instead, a clear relationship was noticed with respect to the percentage content of specific rubberwaste. The level of failure stresses was going down with the increasing granulate content. In the caseof powder, the relationship was inverse: shear stresses were higher for a greater powder content (P-25).The report from Tajdini et al.’s [24] study did not comprise the information on changes of failure shearstress in terms of G30 or G80 content. Obviously, although the conditions of this study were close tothose of Tajdini et al. [24], they were not identical. Basic differences included: another soil type, nosaturation with water before presented tests, another type of rubber waste, higher decrease of cohesionin (RCR) mixtures, and perhaps a different mineralogical composition of soils (Tajdini et al. [31] didnot provide the mineralogical composition of kaolinite clay). That, among other things, is why not allreported changes are identical.
Geosciences 2019, 9, 352 12 of 16
5.3. The Effect of Rubber Waste on Deformability
Figure 9 presents the rubber waste influence on the plasticity of red clay. According to theauthor, Tajdini et al. [31] were incorrectly referring to this property as ductility. The ductility is a termassigned to such materials as steel or concrete, or in particular cases also to rocks. In recent years, someresearchers have applied this term not only referring to cement stabilized soils, but also to soil-rubberwaste mixtures, although in their case it is still simply plasticity and the author will be using this term.
Geosciences 2019, 9, 352 12 of 16
Figure 9 presents the rubber waste influence on the plasticity of red clay. According to the author, Tajdini et al. [31] were incorrectly referring to this property as ductility. The ductility is a term assigned to such materials as steel or concrete, or in particular cases also to rocks. In recent years, some researchers have applied this term not only referring to cement stabilized soils, but also to soil-rubber waste mixtures, although in their case it is still simply plasticity and the author will be using this term.
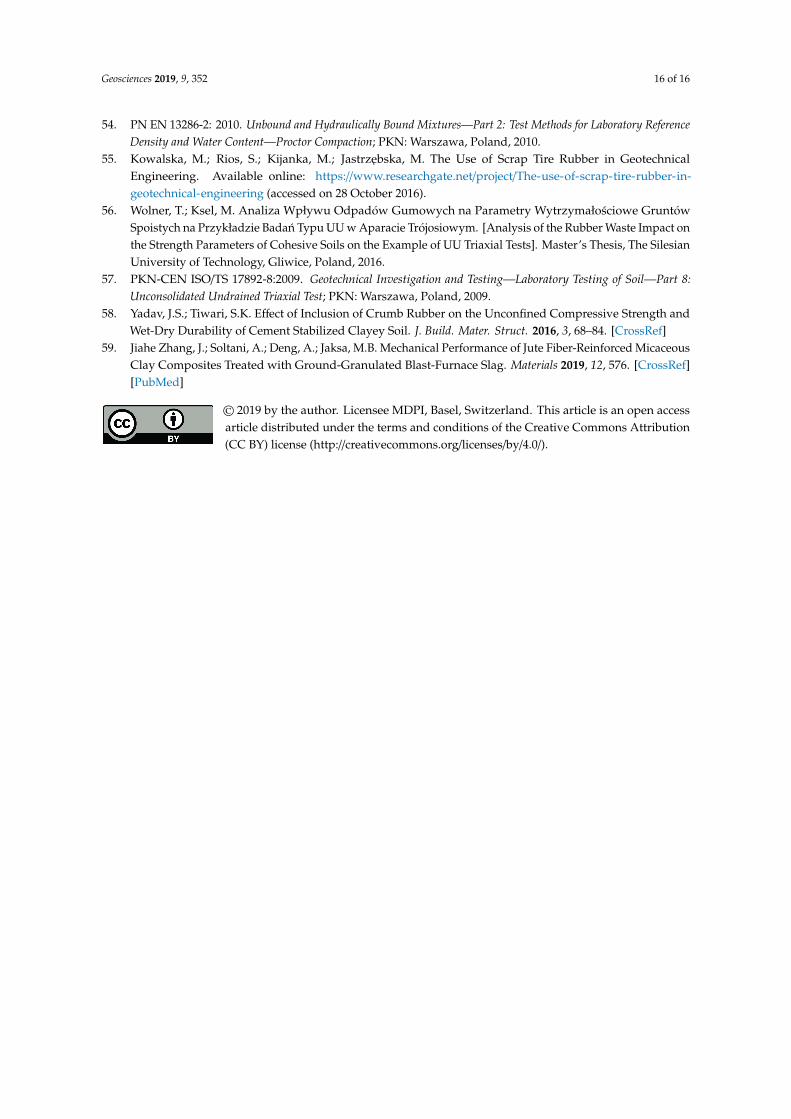
Figure 9. Strain at failure versus confining stress for (RCR) mixtures and for the clay and clay-crumb mixtures (based on this study and Tajdini et al.’s tests [31]).
Figure 9 clearly shows that for higher values of confining stress (50 kPa and 100 kPa), the failure strain ε1,f increases with increasing the powder and granulate content. For example, for σ3 = 50 kPa: (P-5)—Δε1,f = 70%, (P-25)—Δε1,f = 240%, (G-5)—Δε1,f = 60%, (G-25)—Δε1,f = 180%. This indicates an increase in plasticity, the higher it is the smaller the rubber waste particles are. With further growth of confining stress (200 kPa), the situation changes and lower (P) and (G) contents (5% and 10%) in (RCR) mixtures do not result in the failure strain increase against red clay. Only for the 25% content of rubber waste do the mixtures’ plasticity continue to grow, so for σ3 = 200 kPa: (P-25)—Δε1,f = 82%, (G-25)—Δε1,f = 57%. In turn, in tests on kaolinite clay with crumb, Tajdini et al. [31] have shown a permanent increase in the failure strain with increasing the crumb rubber particles and its content in mixtures. However, Soltani et al. [37] found that the effect of rubber size/shape mainly translated into higher ductility, lower stiffness (represented by E50—the secant modulus at 50% of the peak strength), and higher energy adsorption capacity, Eu, rather than peak strength, Rc, improvements. For two rubber types (crumbs and buffings content was Rc = 5%, 10%, 20%, and 30% at weight in the mixture of 85% kaolinite with 15% bentonite), the peak strength values in unconfined compression tests were dependent on the rubber content, peaking at Rc = 5%–10% then decreasing at higher rubber inclusions (Rc = 20%–30%). When it comes to the Eu variations, the most optimal cases are for the samples reinforced with 5% crumbs (mixtures Eu increases by 30% in relation to the natural soil Eu) and with 10% buffings (mixtures Eu increases by 57% in relation to the natural soil Eu). On the other hand, the soil reinforcement by adding the rubber causes the reduction in its stiffness (a monotonically decreasing trend with an increasing of rubber content). In relation to the natural soil, the inclusion of 5%–30% crumbs or buffings resulted in E50 decreasing by 22%–63% and by 31%–50%, respectively. The effects of rubber on the composite’s stiffness are clearly visible and very important in the engineering design.
The discussed behaviors are explained by the fact that the growth of rubber content in the mixture (or growth of its grain size) results in the increase in the rubber effect, i.e., the capability to absorb the deformation energy. It is well known that rubber particles are more elastic than the soil. Thereby, soil-rubber waste mixtures can feature a higher plasticity than the soil itself. In the author’s opinion, however, certain threshold values of confining stress can exist, after exceeding which, the influence of rubber on plasticity of the mixtures substantially decreases. Soltani et al. [37] and Zhang
Figure 9. Strain at failure versus confining stress for (RCR) mixtures and for the clay and clay-crumbmixtures (based on this study and Tajdini et al.’s tests [31]).
Figure 9 clearly shows that for higher values of confining stress (50 kPa and 100 kPa), the failurestrain ε1,f increases with increasing the powder and granulate content. For example, for σ3 = 50 kPa:(P-5)—∆ε1,f = 70%, (P-25)—∆ε1,f = 240%, (G-5)—∆ε1,f = 60%, (G-25)—∆ε1,f = 180%. This indicates anincrease in plasticity, the higher it is the smaller the rubber waste particles are. With further growthof confining stress (200 kPa), the situation changes and lower (P) and (G) contents (5% and 10%) in(RCR) mixtures do not result in the failure strain increase against red clay. Only for the 25% content ofrubber waste do the mixtures’ plasticity continue to grow, so for σ3 = 200 kPa: (P-25)—∆ε1,f = 82%,(G-25)—∆ε1,f = 57%. In turn, in tests on kaolinite clay with crumb, Tajdini et al. [31] have shown apermanent increase in the failure strain with increasing the crumb rubber particles and its content inmixtures. However, Soltani et al. [37] found that the effect of rubber size/shape mainly translated intohigher ductility, lower stiffness (represented by E50—the secant modulus at 50% of the peak strength),and higher energy adsorption capacity, Eu, rather than peak strength, Rc, improvements. For tworubber types (crumbs and buffings content was Rc = 5%, 10%, 20%, and 30% at weight in the mixtureof 85% kaolinite with 15% bentonite), the peak strength values in unconfined compression tests weredependent on the rubber content, peaking at Rc = 5%–10% then decreasing at higher rubber inclusions(Rc = 20%–30%). When it comes to the Eu variations, the most optimal cases are for the samplesreinforced with 5% crumbs (mixtures Eu increases by 30% in relation to the natural soil Eu) and with10% buffings (mixtures Eu increases by 57% in relation to the natural soil Eu). On the other hand, thesoil reinforcement by adding the rubber causes the reduction in its stiffness (a monotonically decreasingtrend with an increasing of rubber content). In relation to the natural soil, the inclusion of 5%–30%crumbs or buffings resulted in E50 decreasing by 22%–63% and by 31%–50%, respectively. The effectsof rubber on the composite’s stiffness are clearly visible and very important in the engineering design.
The discussed behaviors are explained by the fact that the growth of rubber content in the mixture(or growth of its grain size) results in the increase in the rubber effect, i.e., the capability to absorb thedeformation energy. It is well known that rubber particles are more elastic than the soil. Thereby,soil-rubber waste mixtures can feature a higher plasticity than the soil itself. In the author’s opinion,

Geosciences 2019, 9, 352 13 of 16
however, certain threshold values of confining stress can exist, after exceeding which, the influence ofrubber on plasticity of the mixtures substantially decreases. Soltani et al. [37] and Zhang et al. [59] takeinto account the mechanical interlocking of soil particles and rubbers [37] (or jute fibers [59]) and thefrictional resistance generated at the soil-rubber [37] (or jute fibers [59]) interface. At present, this issueis intensively studied by many researchers.
Based on results of tests reported in the Yadav and Tiwari [32] review, it is clearly visible that thevalues of the angle of internal friction and of cohesion for mixtures originating from fine-grained soiland rubber waste show various trends: they can only fall or grow, initially decline and then increase, orvice versa. At the same time, some authors were reporting growing, and others, decreasing cohesion.There is a similar situation with the effect of strengthening, which was confirmed or not. Such behaviorproves that there is no clear answer to the question of how the rubber waste addition affects the soil.
Undoubtedly, the behavior of such mixture depends on the type of soil itself and on the type ofrubber waste, as well as on the testing method used, which can reflect the actual conditions of thesoil-rubber mixtures use. This fact proves that it is necessary to perform appropriate tests each time.
6. Conclusions
Red clay with the optimum moisture content of wopt = 18% originating from the Patoka deposit isa soil featuring good strength parameters and a high swelling pressure. The addition to it of rubberwaste in the form of 0–1 mm powder or 1–5 mm granulate results in specific consequences in theform of:
(1) A general decrease in the shear strength by a much higher reduction of cohesion than increase inthe angle of internal friction;
(2) Various effects of shear strength decline due to the content (5%, 10%, or 15%) and the size ofrubber waste particles (powder 0–1 mm or granulate 1–5 mm);
(3) Reduction of the soil-rubber mixtures density;(4) Increase in the soil-rubber mixtures plasticity for certain ranges of confining stress;(5) Reduction of the swelling pressure and other swelling parameters [16].
Because of that, the next possibilities of such mixtures’ application appear, for example, as amaterial used to backfill engineering structures such as embankments or bridge abutments, foundedon weak soils, for which it is very important to limit their deformations. It is worth paying attention tothe fact that the above conclusions are based on tests reproducing the most unfavorable case of fastloading of the subsoil. The performance of a series of consolidated and undrained with measurementof water pressure triaxial tests (CU + u) is planned next.
Funding: This research received no external funding.
Acknowledgments: The Author would like to express her gratitude to the representatives of the tire shreddingcompanies ORZEŁ S.A. and ATB TRUCK S.A., who delivered the rubber powder and granulate for this study freeof charge. Also, the author would like to thank the students Michał Ksel and Tomasz Wolner for their valuableinvolvement in the performance of experimental research.
Conflicts of Interest: The author declares no conflict of interest.
References
1. Rogers, J.D.; Olshansky, R.; Rogers, R.B. Damage to Foundations from Expansive Soils. Claims People 1993, 3,1–4.
2. Holtz, R.D.; Kovacs, W.D. An Introduction to Geotechnical Engineering; Prentice-Hall: Upper Saddle River, NJ,USA, 1981.
3. WBCSD. World Business Council for Sustainable Development Home Page. Available online: https://docs.wbcsd.org/2008/08/EndOfLifeTires-FullReport.pdf (accessed on 10 August 2008).
4. Gromysz, K.; Kowalska, M. Reduction of Vibrations Applied on Structures—Results of Chamber Tests withthe Use of Tire Derived Aggregate. Procedia Eng. 2017, 193, 305–312. [CrossRef]

Geosciences 2019, 9, 352 14 of 16
5. Jurczuk, J. Zastosowanie Strzepów Gumowych Jako Lekkiego Wypełnienia w Nasypach Drogowych. [Application ofRubber Shreds as a Light Filling in Road Embankments]; Mostostal Warszawa, S.A.: Warsaw, Poland, 2011.
6. Kowalska, M.; Chmielewski, M. Mechanical Parameters of Rubber-Sand Mixtures for Numerical Analysisof a Road Embankment. In Proceedings of the IOP Conference Series: Materials Science and Engineering,Beijing, China, 24–27 October 2017.
7. Signes, C.H.; Garzón-Roca, J.; Fernández, P.M.; de la Torre, M.E.G.; Franco, R.I. Swelling Potential Reductionof Spanish Argillaceous Marlstone Facies Tap Soil Through the Addition of Crumb Rubber Particles fromScrap Tires. Appl. Clay Sci. 2016, 132, 768–773. [CrossRef]
8. Sybilski, D. Zastosowanie Odpadów Gumowych w Budownictwie Drogowym. Przeglad Bud. 2009, 5, 37–44.9. Yoon, S.; Prezzi, M.; Siddiki, N.Z.; Kim, B. Construction of a Test Embankment Using a Sand—Tire Shred
Mixture as Fill Material. Waste Manag. 2006, 26, 1033–1044. [CrossRef]10. Karacasu, M.; Okur, V.; Er, A. A Study on the Rheological Properties of Recycled Rubber-Modified Asphalt
Mixtures. Sci. World J. 2015. [CrossRef]11. Lo Presti, D. Recycled Tire Rubber Modified Bitumens for Road Asphalt Mixtures: A Literature Review.
Constr. Build. Mater. 2013, 49, 863–881. [CrossRef]12. Xu, X.; Lo, S.H.; Tsang, H.H.; Sheikh, M.N. Earthquake Protection by Tire—Soil Mixtures: Numerical Study.
In Proceedings of the New Zealand Society for Earthquake Engineering (NZSEE) Conference, Wellington,New Zealand, 3–5 April 2009.
13. Jastrzebska, M.; Kowalska, M. Triaxial Tests on Weak Cohesive Soils—Some Practical Remarks (part 2).Arch. Civ. Eng. Environ. 2016, 9, 81–94. [CrossRef]
14. Kowalska, M.; Jastrzebska, M. Triaxial Tests on Weak Cohesive Soils—Some Practical Remarks (part 1). Arch.Civ. Eng. Environ. 2016, 9, 71–80. [CrossRef]
15. Chen, F.H. Foundations on Expansive Soils (Developments in Geotechnical Engineering 12); Elsevier Science:Amsterdam, The Netherlands, 1975; ISBN 978-0-44-456962-2.
16. Kowalska, M.; Jastrzebska, M. Pecznienie Mieszanek Gruntu Spoistego z Granulatem Gumowym. [Swelling ofCohesive Soil with Rubber Granulate]. In Analizy i Doswiadczenia w Geoinzynierii; Bzówka, J., Łupiezowiec, M.,Eds.; Politechniki Slaskiej: Gliwice, Poland, 2017; Volume 651, pp. 261–270. ISBN 978-8-37-880446-8.
17. Kowalska, M. Compactness of Scrap Tire Rubber Aggregates in Standard Proctor Test. Procedia Eng. 2016,161, 975–979. [CrossRef]
18. Ramirez, G.; Casagrande, M.; Folle, D.; Pereira, A.; Paulon, V. Behavior of Granular Rubber Waste TireReinforced Soil for Application in Geosynthetic Reinforced Soil Wall. Rev. IBRACON Estrut. Mater. 2015, 8,567–576. [CrossRef]
19. Balasooriya, M.G.B.T.; Kumari, W.G.S.D.; Mallawarachchi, M.A.S.N.; Udakara, D.D.S. Study the Effect ofWaste Rubber Materials on Shear Strength of Residual Soils. In Proceedings of the ICSBE-2012: InternationalConference on Sustainable Built Environment, Ipoh, Malaysia, 23–24 April 2012.
20. Carraro, J.A.H.; Budagher, E.; Badanagki, M.; Kang, J.B. Sustainable Stabilization of Sulfate-Bearing Soil withExpansive Soil-Rubber Technology; Technical Report No. CDOT-2013-2; Colorado Department of Transportation:Washington, DC, USA, 2013.
21. Cetin, H.; Fener, M.; Gunaydin, O. Geotechnical Properties of Tire—Cohesive Clayey Soil Mixtures as a FillMaterial. Eng. Geol. 2006, 88, 110–120. [CrossRef]
22. Daud, N.; Yusoff, Z.; Muhammed, A. Ground Improvement of Problematic Soft Soils Using Shredded WasteTire. In Proceedings of the 6th Jordanian International Civil Engineering Conference (JICEC06), Amman,Jordan, 10–12 March 2015.
23. Glinicka, M. Własciwosci Mechaniczne Mieszaniny Gruntu i Odpadów z Opon Samochodowych. [MechanicalProperties of The Soil—Tire Waste Mixture]. Bud. Inzynieria Srodowiska 2013, 4, 99–104.
24. Soltani, A.; Deng, A.; Taheri, A.; Sridharan, A. Consistency Limits and Compaction Characteristics of ClaysSoils Containing Rubber Waste. Proc. Inst. Civ. Eng. Geotech. Eng. 2019, 172, 174–188. [CrossRef]
25. Srivastava, A.; Pandey, S.; Rana, J. Use of Shredded Tire Waste in Improving the Geotechnical Properties ofExpansive Black Cotton Soil. Geomech. Geoeng. 2014, 9, 303–311. [CrossRef]
26. Akbarimehr, D.; Aflaki, E. An Experimental Study on the Effect of Tire Powder on the Geotechnical Propertiesof Clay Soils. Civ. Eng. J. 2018, 4, 594–601. [CrossRef]
27. Kalkan, E. Preparation of Scrap Tire Rubber Fiber-Silica Fume Mixtures for Modification of Clayey Soils.Appl. Clay Sci. 2013, 80, 117–125. [CrossRef]

Geosciences 2019, 9, 352 15 of 16
28. Soltani, A.; Deng, A.; Taheri, A.; Mirzababaei, M.; Vanapalli, S.K. Swell-Shrink Behavior of RubberizedExpansive Clays During Alternate Wetting and Drying. Minerals 2019, 9, 224. [CrossRef]
29. Soltani, A.; Deng, A.; Taheri, A.; Sridharan, A. Swell-Shrink-Consolidation Behavior of Rubber-ReinforcedExpansive Soils. Geotech. Test. J. 2018, 42, 761–788. [CrossRef]
30. Soltani, A.; Deng, A.; Taheri, A.; Mirzababaei, M. Rubber Powder–Polymer Combined Stabilization of SouthAustralian Expansive Soils. Geosynth. Int. 2018, 25, 304–321. [CrossRef]
31. Tajdini, M.; Nabizadeh, A.; Taherkhani, H.; Zartaj, H. Effect of Added Waste Rubber on the Properties andFailure Mode of Kaolinite Clay. Int. J. Civ. Eng. 2016, 15, 949–958. [CrossRef]
32. Yadav, J.S.; Tiwari, S.K. The Impact of End-of-Life Tires on The Mechanical Properties of Fine-Grained Soil:A Review. Environ. Dev. Sustain. 2017, 21, 485–568. [CrossRef]
33. Bałachowski, L.; Gotteland, P. Characteristics of Tire Chips—Sand Mixtures from Triaxial Tests. Arch. HydroEng. Environ. Mech. 2007, 54, 25–36.
34. Dunham-Friel, J.; Carraro, J.A.H. Effects of Compaction Effort, Inclusion Stiffness, and Rubber Size on theShear Strength and Stiffness of Expansive Soil-Rubber (ESR) Mixtures. In Proceedings of the Geo-Congress2014: Geo-characterization and Modeling for Sustainability, Atlanta, GA, USA, 23–26 February 2014.
35. Tafti, M.F.; Emadi, M.Z. Impact of Using Recycled Tire Fibers on the Mechanical Properties of Clayey andSandy Soils. Electron. J. Geotech. Eng. 2016, 21, 7113–7125.
36. Özkul, Z.H.; Baykal, G. Shear Behavior of Compacted Rubber Fiber-Clay Composite in Drained andUndrained Loading. J. Geotech. Geoenviron. Eng. 2007, 133, 767–781. [CrossRef]
37. Soltani, A.; Taheri, A.; Deng, A.; Nikraz, H. Tire Rubber and Expansive Soils: Two Hazards, One Solution.Proc. Inst. Civ. Eng. Constr. Mater. 2019, 1–17. [CrossRef]
38. CEN CWA 14243-2002. Post-Consumer Tire Materials and Applications; PKN: Warszawa, Poland, 2002.39. ASTM D 6270-08. Standard Practice for Use a Scrap Tires in Civil Engineering Applications; ASTM: Philadelphia,
PA, USA, 2014.40. Yadav, J.S.; Tiwari, S.K. Assessment of Geotechnical Properties of Uncemented/Cemented Clayey Soil
Incorporated with Waste Crumb Rubber. J. Mater. Eng. Struct. 2017, 4, 37–50.41. Yadav, J.S.; Tiwari, S.K. Effect of Waste Rubber Fibres on the Geotechnical Properties of Clay Stabilized with
Cement. Appl. Clay Sci. 2017, 149, 97–110. [CrossRef]42. Yadav, J.S.; Tiwari, S.K. Influence of Crumb Rubber on the Geotechnical Properties of Clayey Soil. Environ. Dev.
Sustain. 2017, 20, 2565–2586. [CrossRef]43. Stempkowska, A. Badanie Własciwosci Glin i Mas Klinkierowych. Glina Czerwona. [Determination of Properties of
Clays and Clinker Masses. Red Clay]; AGH University of Science and Technology: Kraków, PL, USA, 2014;unpublished report.
44. PN-EN ISO 14688-2:2006. Geotechnical Investigation and Testing—Determination and Classification of Soils—Part2: Classification Rules; PKN: Warszawa, Poland, 2006.
45. ASTM D2487-11. Standard Practice for Classification of Soils for Engineering Purposes (Unified Soil ClassificationSystem); ASTM International: Philadelphia, PA, USA, 2017.
46. Akbulut, S.; Arasan, S.; Kalkan, E. Modification of Clayey Soils Using Scrap Tire Rubber and Synthetic Fibers.Appl. Clay Sci. 2007, 38, 23–32. [CrossRef]
47. PKN-CEN ISO/TS 17892-3:2009. Geotechnical Investigation and Testing—Laboratory Testing of Soil—Part 3:Determination of Particle Density—Pycnometer Method; PKN: Warszawa, Poland, 2009.
48. PKN-CEN ISO/TS 17892-12:2009. Geotechnical Investigation and Testing—Laboratory Testing of Soil—Part 12:Determination of Atterberg Limits; PKN: Warszawa, Poland, 2009.
49. PN EN ISO 17892-3: 2016. Geotechnical Investigation and Testing—Laboratory Testing of Soil—Part 3: Determinationof Particle Density (ISO 17892-3:2015); PKN: Warszawa, Poland, 2016.
50. PN-EN ISO 17892-5:2017-06. Geotechnical Investigation and Testing—Laboratory Testing of Soil—Part 5:Incremental Loading Oedometer Test; PKN: Warszawa, Poland, 2017.
51. Head, K.H. Manual of Soil Laboratory Testing: Soil Classification and Compaction Test, 3rd ed.; Whittles Publishing:Scotland, UK, 2006; Volume 1.
52. ASTM D422-63:(2007)e2. Standard Test Method for Particle-Size Analysis of Soils; ASTM International:West Conshohocken, PA, USA, 2007.
53. PKN CEN ISO/TS 17892-4: 2009. Geotechnical Investigation and Testing—Laboratory Testing of Soil—Part 4:Determination of Particle Size Distribution; PKN: Warszawa, Poland, 2009.
Geosciences 2019, 9, 352 16 of 16
54. PN EN 13286-2: 2010. Unbound and Hydraulically Bound Mixtures—Part 2: Test Methods for Laboratory ReferenceDensity and Water Content—Proctor Compaction; PKN: Warszawa, Poland, 2010.
55. Kowalska, M.; Rios, S.; Kijanka, M.; Jastrzebska, M. The Use of Scrap Tire Rubber in GeotechnicalEngineering. Available online: https://www.researchgate.net/project/The-use-of-scrap-tire-rubber-in-geotechnical-engineering (accessed on 28 October 2016).
56. Wolner, T.; Ksel, M. Analiza Wpływu Odpadów Gumowych na Parametry Wytrzymałosciowe GruntówSpoistych na Przykładzie Badan Typu UU w Aparacie Trójosiowym. [Analysis of the Rubber Waste Impact onthe Strength Parameters of Cohesive Soils on the Example of UU Triaxial Tests]. Master’s Thesis, The SilesianUniversity of Technology, Gliwice, Poland, 2016.
57. PKN-CEN ISO/TS 17892-8:2009. Geotechnical Investigation and Testing—Laboratory Testing of Soil—Part 8:Unconsolidated Undrained Triaxial Test; PKN: Warszawa, Poland, 2009.
58. Yadav, J.S.; Tiwari, S.K. Effect of Inclusion of Crumb Rubber on the Unconfined Compressive Strength andWet-Dry Durability of Cement Stabilized Clayey Soil. J. Build. Mater. Struct. 2016, 3, 68–84. [CrossRef]
59. Jiahe Zhang, J.; Soltani, A.; Deng, A.; Jaksa, M.B. Mechanical Performance of Jute Fiber-Reinforced MicaceousClay Composites Treated with Ground-Granulated Blast-Furnace Slag. Materials 2019, 12, 576. [CrossRef][PubMed]
© 2019 by the author. Licensee MDPI, Basel, Switzerland. This article is an open accessarticle distributed under the terms and conditions of the Creative Commons Attribution(CC BY) license (http://creativecommons.org/licenses/by/4.0/).