strength analysis of the main structural component in ship
TRANSCRIPT

HAL Id: hal-02172003https://hal.archives-ouvertes.fr/hal-02172003
Submitted on 8 Jul 2019
HAL is a multi-disciplinary open accessarchive for the deposit and dissemination of sci-entific research documents, whether they are pub-lished or not. The documents may come fromteaching and research institutions in France orabroad, or from public or private research centers.
L’archive ouverte pluridisciplinaire HAL, estdestinée au dépôt et à la diffusion de documentsscientifiques de niveau recherche, publiés ou non,émanant des établissements d’enseignement et derecherche français ou étrangers, des laboratoirespublics ou privés.
Strength Analysis of the Main Structural Component inShip-to-Shore Cranes Under Dynamic Load
Gang Tang, Chen Shi, Yanping Wang, Xiong Hu
To cite this version:Gang Tang, Chen Shi, Yanping Wang, Xiong Hu. Strength Analysis of the Main Structural Compo-nent in Ship-to-Shore Cranes Under Dynamic Load. IEEE Access, IEEE, 2019, 7, pp.23959-23966.�10.1109/ACCESS.2019.2899400�. �hal-02172003�

Strength analysis of the main structuralcomponent in ship-to-shore cranesunder dynamic loadGANG TANG1,2, CHEN SHI1,2,YIDE WANG2 and XIONG HU11Logistics Engineering College, Shanghai Maritime University, Shanghai 201306, China2Université de Nantes IETR, Nantes, UMR CNRS 6164 , France
Corresponding author: Xiong Hu (e-mail:[email protected]); Chen Shi(e-mail:[email protected])
ABSTRACT After a period of operation, the mechanical properties of ship-to-shore (STS) cranes canchange. It is necessary to analyze the strength of the main structural component in STS cranes underdynamic load to assess their safety. This case study was conducted on a 28-ton capacity STS crane. A testingsystem with signal sensing, conditioning, acquiring, and analysis was established. After on-site testing, allof the stresses of the test positions were calculated and determined to be in the allowable range. As a resultof this study, a systematic approach to analyze the strength of the main structural component in STS cranesunder dynamic load is proposed.
INDEX TERMS ship-to-shore cranes, dynamic load, Kalman filters
I. INTRODUCTION1
SHIP-to-shore (STS) cranes are used in ports and termi-2
nals to transfer containerized cargo to and from ships3
[1]. Since its inception more than 50 years ago (the first4
quayside container crane was built in January 1959 [2]), the5
container industry has made remarkable progress. The typical6
elements of an STS crane include a combination of two sets7
of ten rail wheels mounted to the bottom of the vertical8
frame and braced system; a structurally designed system9
of beams assembled to support the boom, cabin, operating10
machinery, and the cargo being lifted; crane boom; hook;11
operating cabin; and storage equipment. The crane is driven12
by a specially trained operator who sits in a cabin attached to13
the trolley suspended from the beam. The trolley runs along14
rails located on the top or sides of the boom and girder. The15
operator runs the trolley over the ship to lift the cargo, usually16
containers. Once the spreader locks onto the container, the17
container is lifted, moved over the dock, and placed on a truck18
chassis (trailer) to be taken to the storage yard. The crane also19
lifts containers from the chassis on the dock to load them onto20
the ship.21
STS cranes are mostly used for a long duration. Prolonged22
use affects the mechanical properties of STS cranes. If an23
accident occurs, the economic losses can be enormous, and24
thus, safety assessments are necessary. There are many per-25
formance indicators related to STS crane safety, including26
structure strength, dynamic stiffness, and fatigue strength.27
The main objective of this paper is to study the strength of 28
the main structural component in STS cranes under dynamic 29
load. 30
There are many studies on machines under dynamic load. 31
For example, a simple experimental technique employing 32
wire strain gauges for measuring dynamic loads and stresses 33
in operating gear systems has been described in [3]. Others 34
have applied simple rigid-plastic methods to analyze plastic 35
failure of ductile beams loaded dynamically, as N Jones in 36
[4]. JA Laman et al. [5] have calculated the dynamic load 37
allowance in steel through-truss bridges. PS Shenoy et al. [6] 38
have performed quasi-dynamic finite element analysis (FEA) 39
for a typical connecting rod to capture stress variations over 40
a cycle of operation. ES Hwang et al. [7] have analyzed the 41
simulation of dynamic loads in bridges. VA Kopnov [8] has 42
predicted the fatigue life of the metalwork of a travelling 43
gantry crane. Some experiments on a welded steel frame 44
exposed to fatigue loading, and on wire ropes damaged by 45
saw cuts have been conducted in [9]. Research about the 46
sensitivity of some sources of uncertainty in the seismic 47
response of a Korean container crane structure has been 48
reported in [10]. A comparative study of nonlinear static 49
and time history analyses of typical Korean STS container 50
cranes has been described in [11]. Furthermore, there are 51
some published books about the impact strength of materials 52
[12] and introductions to examples of structural computation 53
of machine components [13]. However, in the existing litera- 54
Accep
tedMan
uscri
pt

ture, we have not found a systematic testing approach applied55
to STS cranes under dynamic load. However, all the previous56
studies lack of systematic approach in analyzing the strength57
of the main structure component in STS crane under dynamic58
load.59
In this paper, the dynamic load strength test is designed60
to determine whether the main structural component of an61
STS crane can withstand transient impact stresses caused by62
preset loads and changes in the trolley position. Simulating63
the worst working conditions allow us to determine whether64
the structure meets strength requirements. In this paper, a65
study on an STS crane with 28-ton capacity and 18 years of66
service has been conducted with on-site testing. We have not67
conduct field tests under strong wind conditions because of68
the safety concerns [14].69
The remainder of the paper is organized as follows. In sec-70
tion II, we introduce the test method, including the principles71
of the testing system, the location of measuring points to find72
the loading, and the conditions. In section III, we summarize73
the data and analyze it with Kalman filters, showing the74
maximum value of stress at each measuring point. In section75
IV, we present our conclusions.76
II. TESTING METHOD77
A. TESTING SYSTEM78
The dynamic load test assesses the dynamic loading stresses79
in the main girder carrying the member system, rod system,80
and gantry system. Tensile stress is expressed as positive81
while compressive stress is negative. Figure 1 shows a82
schematic structure of our dynamic load strength test and83
analysis. It includes strain measuring points, signal sensing84
and conditioning, signal analysis, and output. The signals85
enter a 14-channel strain gauge signal conditioner to be86
processed and amplified. One of the advantages of this testing87
system is that it can produce a stable gauge output signal.88
Using the on-site data acquisition system, the parameters of89
the dynamic load working condition can be obtained. These90
data and synchronously processed signals will be stored in91
the specified virtual instrument memory for the secondary92
processing.93
Dynamic load stress testing and analysis of the main94
equipment will use the following instruments and sensors:95
1) electrical resistance strain gauges,96
2) quad strain adapter, and97
3) crane status monitoring and evaluation system, which98
mainly includes99
a) workstation,100
b) signal channel expansion box,101
c) signal conditioning apparatus,102
d) data collector,103
e) visualization software, and104
f) data management and analysis software.105
B. MEASURING POINTS106
The beam of an STS crane is primarily subjected to trans-107
verse and axial loads. When we analyze the strength of the108
main structural component, we ignore axial loads. Consider 109
a beam that is simply-supported at E and K, and subjected to 110
three concentrated loads and two distributed loads as shown 111
in Figure 2. Fx is the dynamic load acting on the beam; the 112
location of X can be changed along the beam. The transverse 113
loads cause internal shear forces and bending moments, 114
which in turn cause axial stresses and shear stresses in the 115
cross section. Considering the reactions as plane stress states, 116
we obtain the following empirical equation for calculating 117
the total stress [15]: 118
σ =√σ21 + σ2
m − σ1σm + 3τ2 (1)
where σ1 is the longitudinal axial stress caused by the bend- 119
ing moment, σm is the compressive stress caused by the 120
concentrated load, and τ is the shear stress. The simple theory 121
of elastic bending states that 122
σ1 =Mmax
Z(2)
where Mmax is the maximum bending moment for the beam 123
andZ is the section modulus. If the force is evenly distributed 124
across the cross section, the internal forces can be approx- 125
imated as uniform, and the beam is subjected to a uniform 126
normal stress, defined as 127
σm =P
δC(3)
with P the concentrated load, δ the width (depth) of the 128
concentrated load, and C the length of the concentrated load. 129
When the beam is subjected to a set of equal and opposite 130
transverse forces, there is a tendency to failure caused by 131
stratification of the material. If this failure is restricted, then 132
a shear stress τ is generated, defined as 133
τ =QAr
I∑δ
(4)
with I the moment of inertia, Q the shear force, Ar the area 134
of the cross section, and∑
the summation. To calculate these 135
parameters, it is necessary to analyze the cross section of 136
the beam, which is a rectangular tube, as shown in Figure 3. 137
Assuming that the beam is symmetric about the neutral axis 138
passing through its centroid, we can calculate the relevant 139
geometric parameters as 140
Ar = ab− a1b1
I =ab3 − a1b31
12
Z =ab3 − a1b31
6b
e =b
2
i =
√ab3 − a1b31
12(ab− a1b1)
(5)
where a and b are the length and width of the cross section, 141
respectively; a1 and b1 are the internal length and width of 142
Accep
ted M
anus
cript

FIGURE 1. Testing system.
FIGURE 2. Reaction for the beam.
FX : Dynamic load (Self-weight of trolley and hopper, and test load); FC : Force of the diagonal link reaction on point C; FL :Weight of the house (Machinery house, electric room, power station and so on); G : Self-weight of the beam; D : Center
between C and E; F : Center between E and K. FK : Force of the diagonal link reaction on point K.
the cross section, respectively; e is the extreme point; and i is143
the radius of gyration [15].144
By calculating σ, we find that the maximum σ must appear145
at points C, D, E, F, or K (as shown in Figure 2). These146
sensors will be placed at these positions. Theoretically, the147
diagonal link connects with the beam at point C. However, in148
practice, the diagonal link connects with the beam at points149
A and B by lugs, so the sensors are set at the points A and150
B instead of point C. All of the measurement points are151
shown in Figure 4. To reduce the number of sensors to 14,152
U1, U3, U5, and U7 (see Figure 4) are considered to have153
the same mechanical properties. Similarly, D1, D3, D5, and 154
D7 are considered the same. The same applies to M1 and 155
M5, and M2 and M6. Therefore U5 and D7 are chosen as 156
measurement points at A, B, D, and F; and M1 and M6 are 157
chosen as measurement points at E and K. In addition, U3 158
and U7 are measured at point D to improve measurement 159
accuracy. These points have been labeled AU5, AD7, BU5, 160
BD7, DU5, DU7, DD7, DU3, EM1, EM6, FU5, FD7, KM1, 161
and KM6. 162
Accep
ted M
anus
cript

ee
ba
N . A .
a 1b 1
FIGURE 3. Cross section of the beam (view from waterside to landside).
C. LOADING AND CONDITION163
Main structure testing with dynamic load stress is based164
on a static stress test. With static stress tests, including165
quantitative distributions and static load waveforms [16],166
we can analyze the features of large static stress points in167
both amplitude and frequency domains, and then check the168
strength of the structure with a dynamic load.169
The positions with different loading and conditions are170
shown in Figure 5. The test load is 25 tons (nominal load of171
28 tons). The wind scale was 3 and the environmental tem-172
perature was 25◦C. We have conducted a total of 10 cyclic173
experiments from testing condition 0 to testing condition 4,174
and calculated the average cycle time, which was 200 s. The175
on-site test conditions (TC - Testing Condition) are:176
1) TC0 (from position 0 to position 1): In this zero state177
condition, the test load is located in the hopper, and the178
grab bucket rests on the test load. The rope is loosened179
until there is no force between the trolley and the grab180
bucket.181
2) TC1 (from position 1 to position 2): First, the trolley182
runs at full speed to the limit position of the front183
beam and the grab bucket begins to free fall. Then,184
the control wire rope makes the bucket stop for 10185
seconds, after which the bucket grabs the test load, and186
it begins to rise at full speed. Finally, the control wire187
rope makes the grab bucket stop.188
3) TC2 (from position 2 to position 3): First, the trolley189
runs to the middle position of the front beam and the190
grab bucket begins to free fall with the test load. Then,191
the control wire rope makes the bucket stop for 10192
seconds, after which it begins to rise at full speed.193
Finally, the control wire rope makes the grab bucket194
stop.195
4) TC3 (from position 3 to position 4): First, the trolley196
runs to the position of the back beam and the grab197
bucket begins free fall with the test load. Then, the 198
control wire rope makes the bucket stop for 10 seconds, 199
after which it begins to rise at full speed. Finally, the 200
control wire rope makes the grab bucket stop. 201
5) TC4 (from position 4 to position 0): The trolley runs 202
back to the zero position of the beam. The grab bucket 203
lays down the test load. The system goes back to zero 204
and checks the zero drift of the test system. 205
III. RESULTS AND ANALYSIS 206
A. DATA COLLECTION 207
As described previously, data are collected from 14 sensitive 208
points at varying positions along the beam and around the 209
beam cross-section. 210
B. KALMAN FILTERING 211
The sampling rate of the signal voltages is 2500Hz. How- 212
ever, the field environment is complex, causing noise that 213
interferes with the signal. To improve the efficiency of data 214
analysis, it is necessary to process the data with a Kalman 215
filter. The general linear discrete system can be expressed as 216{X(k) = A(k)X(k − 1) +B(k)U(k) + w(k)
Z(k) = H(k)X(k) + v(k)(6)
where X(k) is the n-dimensional state vector; U(k) is the 217
system control vector; w(k) is the n-dimensional system 218
noise vector; A(k) is the state transition matrix from k − 1 219
to k; B(k) is the excitation transfer matrix from k − 1 to k; 220
Z(k) is the m-dimensional observation vector; H(k) is the 221
predictive output transfer matrix for time k; and v(k) is the 222
m-dimensional observation noise vector [17]. The Kalman 223
filter is applied to data prediction, which requires the use of 224
predictive derivation equations as follows: 225
X(k|k − 1) = A(k)X(k − 1|k − 1) +B(k)U(k)
P (k|k − 1) = A(k)P (k − 1|k − 1)A(k)T +Q
X(k|k) = X(k|k − 1) +Kg(k)(Z(k)−H(k)X(k|k − 1)
Kg(k) = P (k|k − 1)H(k)T /(H(k)P (k|k − 1)H(k)T +R)
P (k|k) = (I −Kg(k)H(k)P (k|k − 1)(7)
where X(k|k − 1) is the result of the prediction using the 226
previous state of the system; X(k − 1|k − 1) is the optimal 227
result of the previous state of the system; P (k|k − 1) is the 228
corresponding covariance of X(k|k − 1); P (k − 1|k − 1) 229
is the corresponding covariance of X(k − 1|k − 1); AT is 230
the transpose of matrix A; Q(k) is the covariance matrix 231
of w(k); Kg(k) is the Kalman gain at time k; R(k) is the 232
covariance matrix of v(k); and I is the unit matrix [18]. 233
In this system, x(k) represents the system status at time k, 234
and Z(k) represents the pressure measurement at time k, 235
so n = m = 1, and the state transition matrix B(k) is a 236
zero matrix. We used Gaussian white noise as our model to 237
better simulate unknown real noise, which is often caused 238
by a combination of many different sources of noise. If we 239
increase the system noise, the Kalman gain will also increase, 240
Accep
ted M
anus
cript

(a)
M 6
U 5U 6U 7
M 5
(b)
M 2
5D D
D D
2169-3536 (c) 2018 IEEE. Translations and content mining are permitted for academic research only. Personal use is also permitted,
but republication/redistribution requires IEEE permission. See
D D
7 3
6 2
http://www.ieee.org/publications_standards/publications/rights/index.html for more information.
5 1
U 1U 2U 3
M 1
(c)
FIGURE 4. Positions of the measuring points
Cross sections of left beam and right beam (view from waterside to landside)
making the initial value more reliable; if we increase the241
measured noise, the Kalman gain will decrease, making the242
theoretical value become more reliable.243
The data processed by Kalman filtering is shown in Figure244
6. The horizontal axis is time in seconds, and the vertical245
axis is stress measured at positions DU3 and DD7 after246
filtering. We also label the maximum and minimum values247
after filtering. 248
C. CALCULATE THE MEASURED POINT STRESS 249
From the filtered signal, we can obtain the maximum value 250
of stress at each stress measurement point and analyze the 251
corresponding test condition. The calculation results for each 252
measurement point are given in Table 1. The results show that 253
Accep
ted M
anus
cript
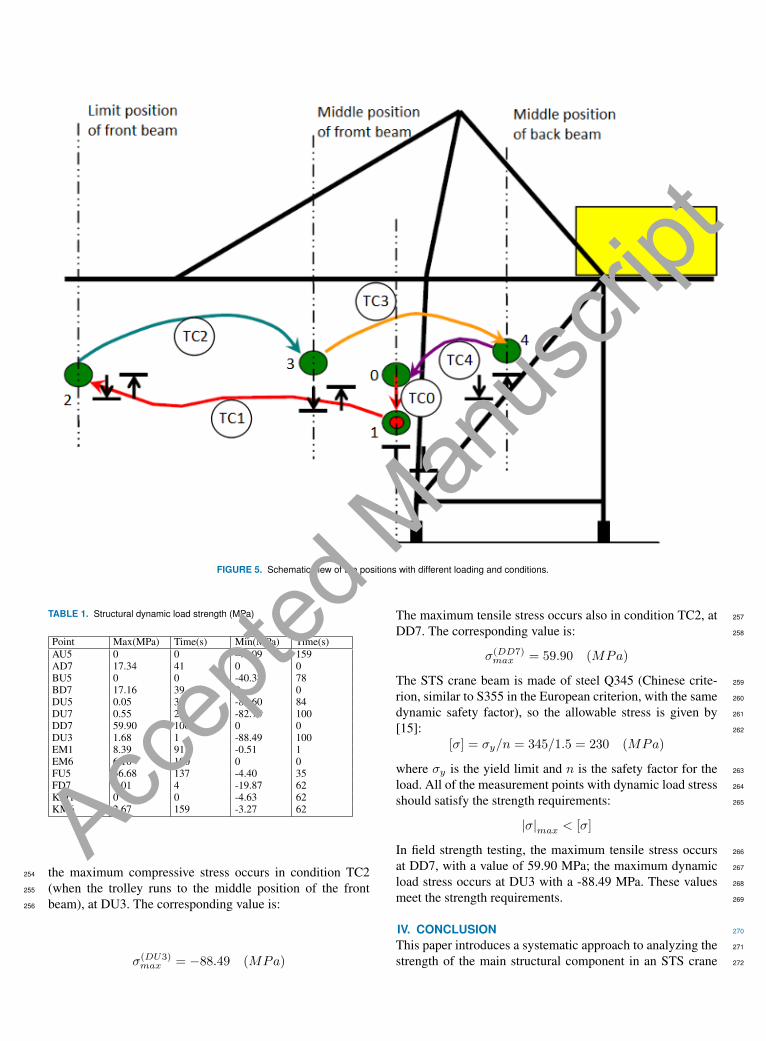
FIGURE 5. Schematic view of the positions with different loading and conditions.
TABLE 1. Structural dynamic load strength (MPa)
Point Max(MPa) Time(s) Min(MPa) Time(s)AU5 0 0 -40.09 159AD7 17.34 41 0 0BU5 0 0 -40.38 78BD7 17.16 39 0 0DU5 0.05 3 -82.60 84DU7 0.55 2 -82.75 100DD7 59.90 100 0 0DU3 1.68 1 -88.49 100EM1 8.39 91 -0.51 1EM6 6.10 100 0 0FU5 36.68 137 -4.40 35FD7 0.01 4 -19.87 62KM1 0 0 -4.63 62KM6 2.67 159 -3.27 62
the maximum compressive stress occurs in condition TC2254
(when the trolley runs to the middle position of the front255
beam), at DU3. The corresponding value is:256
σ(DU3)max = −88.49 (MPa)
The maximum tensile stress occurs also in condition TC2, at 257
DD7. The corresponding value is: 258
σ(DD7)max = 59.90 (MPa)
The STS crane beam is made of steel Q345 (Chinese crite- 259
rion, similar to S355 in the European criterion, with the same 260
dynamic safety factor), so the allowable stress is given by 261
[15]: 262
[σ] = σy/n = 345/1.5 = 230 (MPa)
where σy is the yield limit and n is the safety factor for the 263
load. All of the measurement points with dynamic load stress 264
should satisfy the strength requirements: 265
|σ|max < [σ]
In field strength testing, the maximum tensile stress occurs 266
at DD7, with a value of 59.90 MPa; the maximum dynamic 267
load stress occurs at DU3 with a -88.49 MPa. These values 268
meet the strength requirements. 269
IV. CONCLUSION 270
This paper introduces a systematic approach to analyzing the 271
strength of the main structural component in an STS crane 272
Accep
tedMan
uscri
pt

(a)
(b)
FIGURE 6. Time-domain curves of stress in maximum stress points
under dynamic load. First, we established a testing system for273
the main structural component in STS cranes, including sig-274
nal sensing, conditioning, acquisition, and analysis. Second,275
we identified dangerous positions at which maximum stress276
may occur and arranged sensors in these positions. Third, we277
designed the on-site test conditions, and acquired signals and278
processed them with Kalman filters. Fourth, we calculated279
the stresses of the test positions under various test conditions.280
However, there are some limitations of our method. Due281
to safety concerns, we have not conducted field tests un-282
der strong wind conditions. When strong winds occur, the283
structural connections of the crane (such as the connection284
between the legs and the main beam and the connection285
between the legs and the lower cross beam) can produce large286
eddy currents. Large negative pressures will be generated in287
this zone, creating a strong turbulent flow zone between the288
two main beams and producing a negative wind pressure.289
ACKNOWLEDGMENT290
This work was supported by the National Natural Science291
Foundation of China (No. 31300783), China Postdoctoral292
Science Foundation (No. 2014M561458), Doctoral Fund 293
of the Ministry of Education Jointly Funded Project (No. 294
20123121120004), the Shanghai Maritime University Re- 295
search Project (No. 20130474), the Shanghai Top Academic 296
Discipline Project management science and engineering, and 297
the high-tech research and development program of China 298
(No. 2013A2041106). 299
REFERENCES 300
[1] N. Zrnic, D. Oguamanam, and S.Bošnjak, “Dynamics and modelling 301
of mega quayside container cranes,” Fme Transactions, vol. 34, no. 4, 302
pp. 193–198, 2006. 303
[2] U. Nenad Zrni and K. Hoffmann, “Development of design of ship-to-shore 304
container cranes: 1959-2004,” 2004. 305
[3] H. H. Richardson, Static and dynamic load, stress, and deflection cycles 306
in spur-gear systems. PhD thesis, Massachusetts Institute of Technology, 307
1958. 308
[4] N. Jones, “Plastic failure of ductile beams loaded dynamically,” Journal of 309
Engineering for Industry, vol. 98, no. 1, p. 131, 1976. 310
[5] J. A. Laman, J. S. Pechar, and T. E. Boothby, “Dynamic load allowance 311
for through-truss bridges,” Journal of Bridge Engineering, vol. 4, no. 4, 312
pp. 231–241, 1999. 313
[6] P. S. Shenoy and A. Fatemi, “Dynamic analysis of loads and stresses in 314
connecting rods,” Proceedings of the Institution of Mechanical Engineers 315
– Part C, vol. 220, no. 5, pp. 615–624, 2006. 316
Accep
ted M
anus
cript

[7] E. S. Hwang and A. S. Nowak, “Simulation of dynamic load for bridges,”317
Journal of Structural Engineering, vol. 117, no. 5, pp. 1413–1434, 1991.318
[8] V. A. Kopnov, “Fatigue life prediction of the metalwork of a travelling319
gantry crane,” Engineering Failure Analysis, vol. 6, no. 3, pp. 131–141,320
1999.321
[9] G. Hearn and R. B. Testa, “Modal analysis for damage detection in322
structures,” Journal of Structural Engineering, vol. 117, no. 10, pp. 3042–323
3063, 1991.324
[10] Q. Tran, J. Huh, V. Nguyen, C. Kang, J.-H. Ahn, and I.-J. Park, “Sensitiv-325
ity analysis for ship-to-shore container crane design,” Applied Sciences,326
vol. 8, no. 9, p. 1667, 2018.327
[11] Q. Tran, J. Huh, V. Nguyen, A. Haldar, C. Kang, and K. M. Hwang,328
“Comparative study of nonlinear static and time-history analyses of typical329
korean sts container cranes,” Advances in Civil Engineering, vol. 2018,330
2018.331
[12] W. Johnson and S. L. Rice, Impact strength of materials. Arnold, 1972.332
[13] M. F. Spotts, T. E. Shoup, and L. E. Hornberger, Design of Machine333
Elements, 8/E. Prentice-Hall, 1978.334
[14] S. W. Lee, J. J. Shim, D. S. Han, G. J. Han, and K. S. Lee, “An experimental335
analysis of the effect of wind load on the stability of a container crane,”336
Journal of Mechanical Science and Technology, vol. 21, no. 3, pp. 448–337
454, 2007.338
[15] F. B. Seely, “Advanced mechanics of materials,” Physics Today, vol. 7,339
no. 4, pp. 26–27, 1954.340
[16] G. Tang, X. Hu, W. Wang, T. H. Tang, C. Claramunt, and C. W. Chen,341
“Structural strength analysis of ship-to-shore crane,” in Applied Mechan-342
ics and Materials, vol. 858, pp. 34–37, Trans Tech Publ, 2017.343
[17] Z. Wang, optimal state estimation and system identification. northwestern344
polytechnic university press, 2004.345
[18] M. S. Bartlett, “An introduction to stochastic processes with special346
reference to methods and applications.,” Technometrics, vol. 65, no. 260,347
pp. 690–692, 1978.348
349
350
Accep
ted M
anus
cript