streetlife - europa€¦ · changing significantly the mobility behaviour of streetlife users,...
TRANSCRIPT

FP7-SMARTCITIES-2013
STREETLIFE Steering towards Green and Perceptive Mobility of the Future
WP6 - City Pilot Planning and Evaluation
D6.2.1 – City pilots planning and evaluation results (initial)
Due date: 31.03.2015 Delivery Date: 14.04.2015
Author(s): Francesco Avesani (CAIRE), Davide Frigeri (CAIRE), Mistral Garzoglio (Rovereto), Antti Haikkola (CGI), Tommi Kärkäs (CGI), René Kelpin (DLR), Mika Kulmala (Tampere), Alberto Merigo (CAIRE), Vesa Meskanen (CGI), Tiziana Pezzato (Rovereto), Nicola Perri (CAIRE), Sami Ruotsalainen (TRE), Tom Schilling (VMZ), Stefan Schaffer (DFKI), Giuseppe Valetto (FBK), Mika Vuorio (CGI)
Partner(s): CAIRE, CGI, DFKI, DLR, FBK, Rovereto, Tampere, VMZ
Editor: Giuseppe Valetto (FBK) Lead Beneficiary of Deliverable: FBK
Dissemination level: Public Nature of the Deliverable: Report
Internal Reviewers: Peter Deussen (Fraunhofer), Philipp Gilka (DLR)

FP7 - 608991 - STREETLIFE D6.2.1 – City pilots planning and evaluation results (initial)
WP6 – City Pilot Planning and Evaluation © STREETLIFE Consortium Page 2 of 102
EXECUTIVE SUMMARY
This deliverable (D6.2.1) discusses the first iteration of the STREETLIFE pilots carried out in Berlin, Rovereto and Tampere. It describes the planning process and work that was carried out before the pilots’ execution, and provides details on the evaluation of the pilots’ results. The deliverable is organized as follows: after a short introduction (Section 1), and a brief explanation of the planning approach used to prepare and organize the pilots’ activities (Section 2), Section 3 describes the plans laid out for the pilot organization, execution and evaluation at each site. This discussion of planning provides an overview of the city-specific set up, concerns and constraints of each pilot site; it also provides a summarization of the scenarios and use cases activated in each pilot. Section 4 offers an extended discussion of pilots’ evaluation. It explains how the data collection was used to respond to city-specific research questions and hypotheses, and it shows and discusses the corresponding evaluation results. The scope of evaluation discussion in D6.2.1 is intentionally limited to city-specific concerns, because the evaluation of the significance of pilot results for the overall goals of the STREETLIFE project is going to be the subject of upcoming deliverable D8.2.1). Finally, D6.2.1 offers some brief conclusions in Section 5. Hereby, we wish to briefly highlight, for the readers’ convenience, the findings produced by the three pilots, which are most significance for the STREETLIFE project. • The Berlin pilot leveraged the first iteration to put in place and test their approach for the
experimentation and empirical evaluation of the STREETLIFE system; a significant hurdle was found in planning and carrying out the engagement phase of the pilot, i.e., the recruiting and retention of Berlin citizens in the proposed experiments, and this limited the volume of data available; however, even the little amount of evaluation data collected shows that informing the users about mobility alternatives and their impact, possibly once combined with an incentivizing approach to participation, such as gamification, can lead to changes in their mobility behaviour and the breaking of established mobility habits.
• The results of the Rovereto pilot indicate that the STREETLIFE tools put in place for the experiments of the first iteration were well received, and that they were effective in changing significantly the mobility behaviour of STREETLIFE users, their awareness of sustainable mobility options, and their inclination to embrace them. Among the most important results there are: the increased awareness and usage of the bike sharing service in Rovereto, the impact on the choice of more sustainable itinerary options and modes of transport, and the effectiveness of gamification as a means to incentivize citizens to adopt virtuous mobility choices, and the usage of ICT solutions that promote those choices.
• The results from the Tampere pilot show that citizens like the STREETLIFE mobile App and the information, and think that the mobility information provided to them by the STREETLIFE systems through the App is relevant and useful. More importantly, it can be said confidently that this information will lead to mobility behaviour change. After using the STREETLIFE TRE pilot App, willingness among its users to change their mobility behaviour in the direction of more sustainable mobility choices increased from 60% to 78%. Technically the STREETLIFE system in Tampere is stable, fast responsive, and it scales up. The traffic planning department of the City of Tampere appreciates STREETLIFE potential to affect people's travel habits.

FP7 - 608991 - STREETLIFE D6.2.1 – City pilots planning and evaluation results (initial)
WP6 – City Pilot Planning and Evaluation © STREETLIFE Consortium Page 3 of 102
Disclaimer: This project has received funding from the European Union’s Seventh Framework Programme for research, technological development and demonstration under grant agreement no 608991. The information and views set out in this publication are those of the author(s) and do not necessarily reflect the official opinion of the European Communities. Neither the European Union institutions and bodies nor any person acting on their behalf may be held responsible for the use which may be made of the information contained therein. © Copyright in this document remains vested with the STREETLIFE Partners

FP7 - 608991 - STREETLIFE D6.2.1 – City pilots planning and evaluation results (initial)
WP6 – City Pilot Planning and Evaluation © STREETLIFE Consortium Page 4 of 102
City pilots planning and evaluation results (initial)
Table of Contents
EXECUTIVE SUMMARY .................................................................................................................................... 2 ABBREVIATIONS ................................................................................................................................................ 6 EXPLANATIONS FOR FRONTPAGE .............................................................................................................. 7 PARTNER .............................................................................................................................................................. 7 LIST OF FIGURES ............................................................................................................................................... 8 LIST OF TABLES ............................................................................................................................................... 11 1. INTRODUCTION ............................................................................................................................................ 13 2. PILOT PLANNING APPROACH ................................................................................................................. 14 3. PREPARATION AT PILOT SITES .............................................................................................................. 16
3.1. THE PLANNING PROCESS AT BER ................................................................................................................ 16 3.1.1. Activated scenarios ............................................................................................................................. 16 3.1.2. Selected experiments ........................................................................................................................... 17
3.2. THE PLANNING PROCESS AT ROV ............................................................................................................... 19 3.2.1. Activated scenarios ............................................................................................................................. 19 3.2.2. Selected experiments ........................................................................................................................... 20
3.3. THE PLANNING PROCESS AT TRE ................................................................................................................ 27 3.3.1. Activated scenarios ............................................................................................................................. 27 3.3.2. Experiments deployed ......................................................................................................................... 28
3.4. KNOW-HOW AND LESSONS LEARNED FROM PILOT PLANNING ...................................................................... 33 4. EVALUATION OF PILOTS .......................................................................................................................... 35
4.1. EVALUATION OVERVIEW ............................................................................................................................. 35 4.2. EVALUATION RESULTS AT BER ................................................................................................................... 35
4.2.1. Goals of evaluation ............................................................................................................................. 36 4.2.2. Questions addressed ........................................................................................................................... 36 4.2.3. Data collected ..................................................................................................................................... 36 4.2.4. Findings .............................................................................................................................................. 37 4.2.5. Evaluation summary ........................................................................................................................... 53
4.3. EVALUATION RESULTS AT ROV .................................................................................................................. 54 4.3.1. Goals of evaluation ............................................................................................................................. 54 4.3.2. Questions addressed ........................................................................................................................... 56 4.3.3. Data collected ..................................................................................................................................... 57 4.3.4. Findings .............................................................................................................................................. 60 4.3.5. Evaluation summary ........................................................................................................................... 82
4.4. EVALUATION RESULTS AT TRE ................................................................................................................... 83 4.4.1. Goals of evaluation ............................................................................................................................. 83 4.4.2. Questions addressed ........................................................................................................................... 84

FP7 - 608991 - STREETLIFE D6.2.1 – City pilots planning and evaluation results (initial)
WP6 – City Pilot Planning and Evaluation © STREETLIFE Consortium Page 5 of 102
4.4.3. Data collected ..................................................................................................................................... 85 4.4.4. Findings .............................................................................................................................................. 86 4.4.5. Evaluation summary ........................................................................................................................... 96
5. CONCLUSION ................................................................................................................................................. 98 APPENDIX A: TEMPLATE FOR THE PILOT PLANNING QUESTIONNAIRE ..................................... 99 APPENDIX B: PILOT EVALUATION QUESTIONNAIRES ..................................................................... 102

FP7 - 608991 - STREETLIFE D6.2.1 – City pilots planning and evaluation results (initial)
WP6 – City Pilot Planning and Evaluation © STREETLIFE Consortium Page 6 of 102
ABBREVIATIONS
CO Confidential, only for members of the Consortium (including the Commission Services)
BER STREETLIFE Berlin-Pilot
D Deliverable
DoW Description of Work
FP7 Seventh Framework Programme
FLOSS Free/Libre Open Source Software
GUI Graphical User Interface
IPR Intellectual Property Rights
MGT Management
MS Milestone
OS Open Source
OSS Open Source Software
O Other
P Prototype
PU Public
PM Person Month
R Report
ROV STREETLIFE Rovereto-Pilot
RTD Research and Development
TRE STREETLIFE Tampere-Pilot
WP Work Package
Y1 Year 1

FP7 - 608991 - STREETLIFE D6.2.1 – City pilots planning and evaluation results (initial)
WP6 – City Pilot Planning and Evaluation © STREETLIFE Consortium Page 7 of 102
EXPLANATIONS FOR FRONTPAGE
Author(s): Name(s) of the person(s) having generated the Foreground respectively having written the content of the report/document. In case the report is a summary of Foreground generated by other individuals, the latter have to be indicated by name and partner whose employees he/she is. List them alphabetically.
Partner(s): Name of the partner(s) whose employee(s) the author(s) are. List them alphabetically.
Editor: Only one. As formal editorial name only one main author as responsible quality manager in case of written reports: Name the person and the name of the partner whose employee the Editor is. For the avoidance of doubt, editing only does not qualify for generating Foreground; however, an individual may be an Author – if he has generated the Foreground - as well as an Editor – if he also edits the report on its own Foreground.
Lead Beneficiary of Deliverable: Only one. Identifies name of the partner that is responsible for the Deliverable according to the STREETLIFE DOW. The lead beneficiary partner should be listed on the frontpage as Authors and Partner. If not, that would require an explanation.
Internal Reviewers: These should be a minimum of two persons. They should not belong to the authors. They should be any employees of the remaining partners of the consortium, not directly involved in that deliverable, but should be competent in reviewing the content of the deliverable. Typically this review includes: Identifying typos, Identifying syntax & other grammatical errors, Altering content, Adding or deleting content.
PARTNER
Fraunhofer Fraunhofer-Gesellschaft zur Förderung der angewandten Forschung e.V.
FBK Fondazione Bruno Kessler
SIEMENS Siemens AG
DFKI Deutsches Forschungszentrum für Künstliche Intelligenz GmbH
AALTO Aalto University
DLR Deutsches Zentrum für Luft- und Raumfahrt
CAIRE Cooperativa Architetti e Ingegneri - Urbanistica
Rovereto Comune di Rovereto
TSB Berlin Partner for Business and Technology
Tampere City of Tampere
Logica CGI Suomi Oy
VMZ VMZ Berlin Betreibergesellschaft mbH

FP7 - 608991 - STREETLIFE D6.2.1 – City pilots planning and evaluation results (initial)
WP6 – City Pilot Planning and Evaluation © STREETLIFE Consortium Page 8 of 102
LIST OF FIGURES
Figure 1: The GUI of the Berlin App. ...................................................................................... 18
Figure 2: Sustainable options in ViaggiaRovereto ................................................................... 21
Figure 3: Badges from the Green Game. .................................................................................. 22
Figure 4: Screenshots from the ContaParcheggi App. ............................................................. 23
Figure 5: Promotional Material for Christmas Markets .......................................................... 25
Figure 6: Tampere pilot usage and the mobile apps view. App remembered the previously searched locations, so searching in new occasion was made as easy as possible. ........... 29
Figure 7: Mixed reality field trial. Mixed reality helps users to orient themselves and for example locating the bus stop in a busy terminals area, which has multiple platforms in a wider area. ........................................................................................................................ 30
Figure 8: Publicity examples of the STREETLIFE Tampere Pilot . ........................................ 31
Figure 9: Berlin Routing System Architecture ......................................................................... 38
Figure 10: Berlin Modal Split Selected routes ......................................................................... 40
Figure 11: Berlin Modal Split week 1 ...................................................................................... 41
Figure 12: Berlin Modal Split week 2 ...................................................................................... 41
Figure 13: Weather conditions during BER-EXP-2. ................................................................ 42
Figure 14: GPS tracking App ................................................................................................... 43
Figure 15: Modal split for baseline weeks of field test ............................................................ 44
Figure 16: Modal split for treatment weeks of field test .......................................................... 44
Figure 17: Change in Modes of transportation – t1 minus t0 ................................................... 47
Figure 18: Modes of transportation by purposes ...................................................................... 48
Figure 19: Modes of transportation: modes walk and public transport at t0 and t1. ................ 48
Figure 20: Combining Modes of Transportation at t0. ............................................................. 49
Figure 21: Combining modes of transportation at t1. .............................................................. 49
Figure 22: Importance of planning-criteria duration and CO2 emissions at t0 and t1. ............ 50
Figure 23: Clarity of the information provided by the App. .................................................... 51
FP7 - 608991 - STREETLIFE D6.2.1 – City pilots planning and evaluation results (initial)
WP6 – City Pilot Planning and Evaluation © STREETLIFE Consortium Page 9 of 102
Figure 24: What users think about the Apps usefulness at t0. ................................................. 51
Figure 25: Perceived usefulness at t1. ...................................................................................... 52
Figure 26: screenshots from the ContaParcheggi App. ............................................................ 55
Figure 27: Green leaves ranking in GreenGame with ViaggiaRovereto ................................. 56
Figure 28: Utilization frequency of ViaggiaRovereto during ROV-EXP-1 (Source: post-experiment questionnaire) ................................................................................................ 61
Figure 29: amount of saved trips per week (Source: ViaggiaRovereto) .................................. 62
Figure 30: length travelled in km per week. (Source: ViaggiaRovereto) ................................ 62
Figure 31: Perceived ease of use. Chart reports testers' opinion about the following statement: Overall, the system was easy to use (Source: ROV-EXP-1 Post-experiment questionnaire) ................................................................................................................... 63
Figure 32: Perceived usefulness. Chart reports testers' assessment where 1 correspond to useless, while 5 is equal to useful (Source: Experiment 2 questionnaire). ...................... 64
Figure 33: Compliance. Chart reports testers' opinion about the following statement: I predominately follow the recommend route (Source: Post-ROV-EXP-1 questionnaire) 65
Figure 34: Number of legs for each mode of transport during ROV-EXP-1 ........................... 66
Figure 35: Percentage of legs for each mode of transport during ROV-EXP-1 ....................... 66
Figure 36: Length travelled for each mode of transport during ROV-EXP-1 .......................... 66
Figure 37: Percentage of length travelled for each mode of transport during ROV-EXP-1 .... 67
Figure 38: Number of legs travelled by car in each week and its percentage in relation to the total amount of legs. ......................................................................................................... 67
Figure 39: Length travelled by car in each week and its percentage in relation to the total amount of km. .................................................................................................................. 68
Figure 40: Number of legs travelled by bus in each week and its percentage in relation to the total amount of legs. ......................................................................................................... 68
Figure 41: Length travelled by bus in each week and its percentage in relation to the total amount of km ................................................................................................................... 69
Figure 42: Number of legs travelled by train in each week and its percentage in relation to the total amount of legs. ......................................................................................................... 69
Figure 43: Length travelled by train in each week and its percentage in relation to the total amount of km. .................................................................................................................. 70

FP7 - 608991 - STREETLIFE D6.2.1 – City pilots planning and evaluation results (initial)
WP6 – City Pilot Planning and Evaluation © STREETLIFE Consortium Page 10 of 102
Figure 44: Number of legs travelled by bike sharing in each week and its percentage in relation to the total amount of legs. .................................................................................. 70
Figure 45: Length travelled by bike sharing in each week and its percentage in relation to the total amount of km. .......................................................................................................... 71
Figure 46: Number of legs travelled by bike in each week and its percentage in relation to the total amount of legs. ......................................................................................................... 71
Figure 47: Length travelled by bike in each week and its percentage in relation to the total amount of km. .................................................................................................................. 72
Figure 48: Number of legs travelled walking in each week and its percentage in relation to the total amount of legs. ......................................................................................................... 72
Figure 49: Length travelled walking in each week and its percentage in relation to the total amount of km. .................................................................................................................. 73
Figure 50: Occupancy rate of P&R area in the 3 phases of EXP1. Occupancy rate is the average occupancy during the peak hour (from 10.00 till 12.00). ................................... 74
Figure 51: Inclination to use P&R (source: ROV-EXP-1 questionnaires) ............................... 75
Figure 52: Occupancy rate in Stadio Quercia during ROV-EXP-2 (source: Conta Parcheggi App). ................................................................................................................................. 76
Figure 53: Number of visitors registered in accommodations in Rovereto (source: Tourist Office) .............................................................................................................................. 76
Figure 54: Utilization frequency of bike sharing service in Rovereto (Source: ROV-EXP-1 questionnaires) .................................................................................................................. 78
Figure 55: Perceived usefulness of bike sharing system in Rovereto (1=useful,5=useless) .... 78
Figure 56: Boxplot - distribution of saved trips per user during ROV-EXP-1. ....................... 79
Figure 57: Boxplot - distribution of selected recommended sustainable trips per user in ROV-EXP-1 (Phase 2 vs. Phase 3). ........................................................................................... 82
Figure 58: What kind of transport mode you usually use for your trips? ................................ 87
Figure 59: How long is your usual trip? ................................................................................... 87
Figure 60: How often did you use trip planner navigation? ..................................................... 87
Figure 61: Which devices did you use to plan your trip? ......................................................... 88
Figure 62: Trip Planning importance ....................................................................................... 88

FP7 - 608991 - STREETLIFE D6.2.1 – City pilots planning and evaluation results (initial)
WP6 – City Pilot Planning and Evaluation © STREETLIFE Consortium Page 11 of 102
Figure 63:After using the STREETLIFE multimodal real time solution public users state they would change their mobility behaviour more than before the pilot. Solution provides easy access to information. ............................................................................................... 89
Figure 64: Would you use STREETLIFE app frequently? ...................................................... 89
Figure 65: What do you think about having navigation functionality? .................................... 90
Figure 66: Would you accept tracking? ................................................................................... 90
Figure 67: Do you like STREETLIFE travel assistance app? .................................................. 91
Figure 68: How relevant was the information provided? ......................................................... 91
Figure 69: Overall opinion about STREETLIFE app. ............................................................. 92
Figure 70: TRE-EXP-2 - Public pilot started 3.11.2014. Picture has user statistics for 1.1-28.2.2015. ......................................................................................................................... 93
LIST OF TABLES
Table 1: Activated BER scenarios and use case for first iteration ........................................... 16
Table 2: Activated ROV scenarios and use case for first iteration .......................................... 19
Table 3: Relationship between Experiments and Research Hypothesis ................................... 26
Table 4: Activated TRE scenarios and use cases for first iteration .......................................... 27
Table 5: Relationship between Experiments and Research Hypothesis ................................... 32
Table 6: BER collected data for field trial ............................................................................... 37
Table 7: GPS tracking data base extract ................................................................................... 43
Table 8: Demographic data ...................................................................................................... 45
Table 9: Evaluation data for ROV-EXP-1. .............................................................................. 57
Table 10: Evaluation data for ROV-EXP-2. ............................................................................ 59
Table 11: Use of parking areas during ROV-EXP-1. ............................................................... 74
Table 12: Estimation of shuttle-bus service users (Source: ROV-EXP-2 questionnaire). ....... 76
Table 13: Availability to use P&R expressed by tourists (Source: ROV-EXP-2 questionnaire) .......................................................................................................................................... 77

FP7 - 608991 - STREETLIFE D6.2.1 – City pilots planning and evaluation results (initial)
WP6 – City Pilot Planning and Evaluation © STREETLIFE Consortium Page 12 of 102
Table 14: Difference in distribution of trips per user (W-score) with statistical significance (p-value). ............................................................................................................................... 80
Table 15: types of evaluation data collected for the TRE pilot. ............................................... 85
Table 16: Interview with Tampere traffic planning. ................................................................ 94

FP7 - 608991 - STREETLIFE D6.2.1 – City pilots planning and evaluation results (initial)
WP6 – City Pilot Planning and Evaluation © STREETLIFE Consortium Page 13 of 102
1. INTRODUCTION
This Deliverable (D6.2.1) discusses the first iteration of the STREETLIFE pilots in Berlin (BER), Rovereto (ROV) and Tampere (TRE). It has a companion document, that is, STREELIFE Deliverable D7.1. This document discusses the planning and evaluation of those pilots, whereas D7.1 reports all the actions that have been carried out as part of the actual execution of the pilot.
Given the scope mentioned above, this Deliverable reports on two phases in the pilot-related work done by the Consortium. The first phase is the preparation and planning phase, that is, how each pilot was conceived, what experiments were included, how those experiment were designed, towards what evaluation goals they were aimed, and what ICT technologies were to be deployed on the field, and exercised in the context of each experiment. The second phase is the evaluation phase of the pilots, aiming at deriving findings from the experiments included in each pilot and from the data collected during their execution.
About the evaluation phase, there is another dependency between D6.2.1 and work carried out elsewhere in STREETLIFE that needs to be considered by the reader, that is, impact assessment activities underway in Work Package 8 (WP8) at the time of writing. Those impact assessment activities leverage the same data collected in the first iteration of the pilot, and some of the same evaluation results reached in the context of the work reported hereby. The distinction between the evaluation material covered in this Deliverable and those pertaining to WP8 and its own upcoming Deliverable D8.2.1, titled “Achieved impacts of STREETLIFE services” is that here we report on the evaluation of:
• the technical instruments and tools that STREETLIFE deployed in the pilot sites;
• and results of experiments that pertain to city- and pilot-specific questions (as opposed to general questions on the impact of STREETLIFE solutions on the principal project themes of carbon emissions, traffic reduction, and modification of citizens’ mobility behaviours).
The rest of this document is structured as follows. Section 2 describes how pilot planning was carried out; Section 3 describes the preparation work carried out in BER, ROV and TRE in turn; Section 4 discusses evaluation results in the scope of D6.2.1, for the pilots of BER, ROV and TRE in turn; Section 5 wraps up the Deliverable and offers our conclusions and outlook towards the second iteration of the pilots.

FP7 - 608991 - STREETLIFE D6.2.1 – City pilots planning and evaluation results (initial)
WP6 – City Pilot Planning and Evaluation © STREETLIFE Consortium Page 14 of 102
2. PILOT PLANNING APPROACH
Pilot planning was carried out at each site independently, given the specificity of each city, and the diversity of scenarios, use cases and mobility needs and concern in them. Nevertheless the planning process was managed and supervised in a unified way, for a number of reasons, including: circulating ideas and best practices among pilots; making sure that planning covered all the essential aspects in all pilots; and making sure that planning progress was uniform among pilots.
The planning process had two main starting points. The first was STREETLIFE deliverable D6.1, which provided the scenarios that would be exercised in the pilots, each specified with multiple use cases, and which the partners in each pilot clusters used to design experiments for their pilot. The second one was a brainstorming and track-keeping tool that we devised, in the form of a questionnaire that each pilot site needed to collectively and incrementally fill and keep up to date, and which would in the end contain the necessary design decisions and specifications of the pilot plan. The document template for such “Pilot Planning Questionnaire” is available in Appendix A: Template for the Pilot Planning Questionnaire of this Deliverable for readers’ reference.
The Pilot Planning Questionnaire is divided in four sections, each devoted to one major aspect of pilot preparation.
• Planning: this section asks questions about what among the conceived scenarios and use cases among those in D6.1 should be activated during the pilot experimentation. This is the first essential step to be able to design experiments in the context of the pilot iteration.
• Engagement: this section asks questions about what the pilot should take to involve the stakeholders described in the activated scenarios in the pilot experiments, and to promote STREETLIFE and the pilot among those stakeholders. The objective of this section is twofold: the definition of strategies for identifying and recruiting groups of those stakeholders, in case of controlled experiments; or the definition of measures for the promotion of STREETLIFE, the pilot and the experiment among the relevant stakeholders in case of open field experiments with the general public.
• Deployment: this section asks questions about how to put in place, configure and use STREETLIFE technologies on the ground in the pilot sites, in order to enable the experiments set up in each pilot. Answers to questions in this section detail both software artefacts and data sources that need to be available to enable those experiments, and require reporting about their state of readiness, to monitor when and how they can be effectively deployed in the pilot site.
• Evaluation: this section asks questions about how the pilot partners plan to evaluate the pilot experiments they design. Some questions address what data needs to be collected and the corresponding collection practices, while others ask to define performance indicators and metrics that are to be used for analysis of the pilot results. Notice that the work on this section of the Pilot Planning Questionnaire was a bottom-up counter art to the top-down work done in WP8 on defining and applying a common STREETLIFE methodology for impact analysis for all pilots. The two effort were complementarily carried out with collaboration between WP6 and WP8, and led to the definition of evaluation plans for the

FP7 - 608991 - STREETLIFE D6.2.1 – City pilots planning and evaluation results (initial)
WP6 – City Pilot Planning and Evaluation © STREETLIFE Consortium Page 15 of 102
pilots, which were reported on in STREETLIFE deliverable D8.1.1, titled “STREETLIFE Evaluation plan, including evaluation methodologies and definition of applicable KPI (initial)”.
Each of the above questionnaire sections includes a number of questions that the pilot cluster needs to fill in with details. It is important to notice that, the questionnaire was designed in such a way that, before passing to the following section, all the questions in a section need to be answered in detail. For example, before being able to address the questions about the Engagement phase of the pilot, the answers to questions related to Planning needed to be worked out among the pilot partners. This way, the questionnaire served also as a tool to keep track of the state and maturity of the planning process at each pilot.
The pilot planning questionnaires were circulated to the three pilot clusters at the beginning of month M7 of the project, when each cluster began to fill them. Regular inter-pilot meetings (typically every other week) were held, in order to assess the progress of the planning work, in accord to the questionnaire content, and through the “ four stages” mechanism described above. At the same time, each meeting was an opportunity to elicit feedback in between pilot clusters, about ideas and options related to the four stages of planning, engagement, deployment and evaluation. The meetings lasted until month M9, at which point all of the three pilots had reached a stage of maturity and preparation that was sufficient to effectively take action on the plan described in the questionnaires, and could begin (or had already done preliminary steps for) in-the-field preparation and execution of the pilot plans.

FP7 - 608991 - STREETLIFE D6.2.1 – City pilots planning and evaluation results (initial)
WP6 – City Pilot Planning and Evaluation © STREETLIFE Consortium Page 16 of 102
3. PREPARATION AT PILOT SITES
3.1. The planning process at BER
The first iteration mainly focussed on the setup of main travel planning and routing tools and its integration into the Berlin STREETLFE App. The main elements, such as trip planning accompanied by a carbon footprint advisory, respective end user registration routines and a preliminary incentive management to enable integration of gamification approaches, are listed in Table 1. Those elements have to be considered as a solid base for the integration of further functionalities in the second iteration. Also data flows and storages in the CIP and connected systems have been reliably established during the first iteration; this was not listed as specific Berlin pilot use cases, but has been described in respective work packages WP2 (architecture) and WP3 (data).
In Berlin pilot, specific foci have been put to cycling safety and the management control panel – aggregating and monitoring derived performance indicators from both simulations and crowd sourced ground truth data - from the very beginning of designing the pilot. This was aligned with strategic development plans and respective initiatives in the city of Berlin. Following the German-wide study “Mobility in Cities 2010”1, a remarkable share (13%) of daily trips is being performed by Berlin citizens by bike (car: 31%, public transport: 27%, walk 29%). As this share was significantly and constantly increasing during the last years – and still is, special attention is being laid on cycling safety and decreasing respective numbers of accidents. Even though many private and public mobility planning websites, services and Apps are already in operation, none of them is explicitly taking into account specific safety needs of a rapidly growing group of urban travellers. Thus, this aspect has been put in the centre of the STREETLIFE Berlin pilot. It was also decided to test according implementations and developments with a dedicated STREETLIFE Berlin App – a multi-modal mobility planner integrating available cycling safety information (accident hot spots and safe cycle routing) and respective crowd sourcing functionalities.
3.1.1. Activated scenarios
The following scenarios and use cases have been activated within the first iteration. Full details on the contents and specification of each can be found in STREETLIFE D6.1.
Table 1: Activated BER scenarios and use case for first iteration
Scenarios Use cases
On-trip itinerary surveillance - BER-PTP-1: Trip planning
- BER-PTP-2: Carbon footprint advisory
- BER-PTP-5: Create user profile with transport
1 Mobilität in Städten – SrV; http://tu-
dresden.de/die_tu_dresden/fakultaeten/vkw/ivs/srv/index_html/document_view?set_language=en

FP7 - 608991 - STREETLIFE D6.2.1 – City pilots planning and evaluation results (initial)
WP6 – City Pilot Planning and Evaluation © STREETLIFE Consortium Page 17 of 102
preferences
- BER-PTP-6: End user registration
Bike Usage and Incentives - BER-BUI-5: Incentive management (prepared à green leaves generation preliminarily integrated)
Provision of additional information aggregated from STREETLIFE services and applications
- BER-MGMT-1: Derivation, Aggregation and Monitoring of main KPI
3.1.2. Selected experiments
For piloting the activated scenarios, the following experiments have been applied:
• Technical and usability test of Berlin App with development, usability and transport experts
• GPS-tracking of “friendly” users (recruited amongst STREETLIFE and associated partners)
• Field-test of Berlin trip planning App in real-life conditions in combination with GPS-tracking
Mentioned experiments have been integrated into two main test activities described in the following.
BER-EXP-1: Usability Test of Berlin App
At October 22nd 2014, a series of usability tests has been carried out. The main goal was to let usability experts plan virtual mobility (pre-defined usage scenarios), constantly report usability issues and, consequently, provide valuable feedback for the final deployment of the Berlin STREETLIFE App. 14 experts and advanced users took part in the usability test.

FP7 - 608991 - STREETLIFE D6.2.1 – City pilots planning and evaluation results (initial)
WP6 – City Pilot Planning and Evaluation © STREETLIFE Consortium Page 18 of 102
Figure 1: The GUI of the Berlin App. The test was separated into three parts. The first was dedicated to technical and usability aspects of the App (including its GUI, see Figure 1); during the second a stronger focus was laid on qualitative applicability investigations, while in the third in group discussions main results and feedback have been discussed and harmonised.
The applied qualitative expert user survey questionnaire (in German language) can be found in Appendix B.
In general, this experiment has been dedicated to a structured user involvement into the final deployment of the Berlin App. A set of valuable improvements has been deduced from the test and the discussions with the experts, which mostly have been taken into account with the final version of the App.
Active Berlin PTP scenarios and use cases for the first iteration (as listed in Table 1) have been implemented with the first prototype of the App. The use case on incentive management (BER-BUI-5) has been preliminarily integrated by the specification of “green leaf” credits to be earned with specific route choices.
BER-EXP-2: Berlin Field Trial – App testing and User Acceptance Study
The Berlin field trial consisted of two closely linked parts, namely the GPS tracking of “friendly” users without using the SL App (baseline) and the usage of the SL App accompanied by a continuous GPS tracking (treatment). 12 users took part in this field trial.
The overall goal of this period was mainly to test the App and the underlying services in real life conditions. However, the test period was segregated into a baseline and a treatment phase. The two phases were to be compared with evaluation analyses. During the first phase, a GPS tracking application constantly collected GPS coordinates, which have been used to identify modes of transport applied by the tracked users. So, baseline mobility behaviour of the test users was to be recorded and derived. This period lasted from November 14th to November

FP7 - 608991 - STREETLIFE D6.2.1 – City pilots planning and evaluation results (initial)
WP6 – City Pilot Planning and Evaluation © STREETLIFE Consortium Page 19 of 102
27th. At November 28th the Berlin STREETLIFE App has been rolled out. In the next two weeks from November 28th to December 12th, test users have been planning and executing their daily mobility supported by the Berlin STREETLIFE App. In parallel, the GPS tracking application continued to collect data on the actual mobility behaviour. Based on this test setting two separate data sets have been elicited and analysed after the test period. Results of individual interpretation of those data sets and applied combined analyses are described in Section 4.2.
This rather technical testing has been accompanied by a user acceptance and take-up survey, which has been performed twice – at the end of the baseline and at the end of the treatment phase. Also here, the intention was to compare before and after assessments and derive general user acceptance conclusions from the study. Results and interpretation of collected study data are described in Section 4.2.
The applied user acceptance and uptake survey questionnaires (in German) can be found in Appendix C.
3.2. The planning process at ROV
3.2.1. Activated scenarios
The following scenarios and use cases have been activated within the first iteration. Full details on the contents and specification of each can be found in STREETLIFE D6.1.
Table 2: Activated ROV scenarios and use case for first iteration
Scenarios Use cases
Bike Sharing - ROV-BS-1: Find Bikes
Park & Ride - ROV-PR-1: Planned Park & Ride
- ROV-PR-3: on the ground Park & Ride Support
In the first iteration of the Rovereto Pilot, two out of the three planned scenarios that had been originally devised and described in STREETLIFE Deliverable D6.1 have been activated. The scenarios tested on the field in the first iteration are Bike Sharing (ROV-BS), and Park & Ride (ROV-PR), while the Car Pooling scenario (ROV-CP) will be activated in the second iteration since it needs more work to be done in the engagement part with local companies and enterprises. The scenario is called “Car Pooling to work”, and the involvement of the main enterprises of Rovereto is a fundamental requirement for its success.
In the Bike Sharing scenario the first iteration covered one Use Case, i.e., ROV-BS/1. The Bike Sharing app in ViaggiaRovereto enables users to search for available bikes on the city map, use a bike, get green leaves points for her green mobility choice and save the information in the End User profile.

FP7 - 608991 - STREETLIFE D6.2.1 – City pilots planning and evaluation results (initial)
WP6 – City Pilot Planning and Evaluation © STREETLIFE Consortium Page 20 of 102
In the Park & Ride scenario the Use Cases covered were the following two: ROV-PR/1, ROV-PR/3.
In ROV-PR/1 the basic flow planned in D6.1 has been followed entirely: the End User could visualize P+R options from the routing suggestions of the ViaggiaRovereto App, then she could explore the P+R option, save the P+R option on the app and that choice was recorded.
In ROV-PR/3 the traffic aides used the Conta Parcheggi app with the goal to report about the utilization rate of parking lots and parking on the streets.
The pilot iteration section covering the Control Panel will implement parts of the Use Cases ROV/PR4 and ROV/PR5: from the Use Case ROV/PR4 the mobility manager will be able to browse notification issued by the parking and traffic aides, while from ROV/PR-5 the mobility manager will be able to analyse the Park & Ride use data. This uses case will be tested later in the project.
3.2.2. Selected experiments
We organized the first pilot iteration in three distinct experiments, which were designed to exercise the activated scenarios and use cases listed in Section 3.2.1.
We describe below the content of those three experiments. In both ROV-EXP-1 and ROV-EXP-2, the use cases being exercised were ROV-PR/1, ROV-PR/3, and ROV-BS/1, since ROV-EXP-1 and ROV-EXP-2focus on commuters or visitors who travel into and through Rovereto as the primary stakeholders, with traffic aides of the city as secondary stakeholders (but nevertheless critical for the full execution of the related scenarios and use cases).ROV-EXP-3, instead, aimed at exercising use cases ROV-PR/4, ROV-PR/5, since it focuses on the STREETLIFE support for the city mobility manager.
ROV-EXP-1: Park & Ride for Commuters
ROV-EXP-1 evaluates the STREETLIFE impact on the mobility behaviour of regular commuters, and targets card drivers who need to travel daily towards the city centre. ROV-EXP-1 was tested in a closed environment of 40 motivated users, in order to have a statistically relevant sample. We recruited this user group among the owners of annual parking subscription to the zone called “Zona Gialla”. These are people who paid for the possibility to park their car in Rovereto central area. We filtered that list of subscribers in order to retain only those people who live outside of Rovereto, which were expected to be daily commuters to the city centre. Once the final list was finalized, Rovereto Municipality made actions to contact them and involve them in the experimentation. All the engagement steps taken are recorded in STREETLIFE Deliverable D7.1.
ROV-EXP-1 participants were asked to use continuously the routing App ViaggiaRovereto for their daily itinerary planning needs. The experiment spanned 5 weeks, and consisted of the following three phases:
In phase 1 (1 week) the end users became familiar with the ViaggiaRovereto App, and in the meantime their regular mobility behaviour was collected through the App log information and pre-treatment questionnaires, to form be the baseline for evaluation of the following phases.

FP7 - 608991 - STREETLIFE D6.2.1 – City pilots planning and evaluation results (initial)
WP6 – City Pilot Planning and Evaluation © STREETLIFE Consortium Page 21 of 102
In phase 2 (2 weeks) the ViaggiaRovereto routing App began to provide advice about sustainable itinerary options, by highlighting them and placing in the first two positions at the top of the list of possible itineraries (see GUI in Figure 2). Park & Ride solutions and low carbon impact solutions were promoted this way. At the same, time traffic aides used the parking availability App Conta Parcheggi in order to detect changes in occupancy rates of parking lots and on-street parking.
Figure 2: Sustainable options in ViaggiaRovereto In phase 3 (2 weeks) gamification kicked in: we launched “Green Game with ViaggiaRovereto”, which encouraged users to experiment and use Park & Ride itineraries, low carbon impact itineraries, bike sharing services etc. by assigning badges and points to users, depending on the chosen itinerary. We implemented in the game three separate types of points (with the corresponding leaderboards): Green Points, Health Points, and Park&Ride points. We also implemented a variety of badges and badge collections, some of which were linked to reaching certain amounts of points in the three categories above, while others were awarded when the user took specific kind of trips or explored certain mobility alternatives (e.g. when they used the two designated P&R facilities for the first time, or tried the Bike Sharing service for the first time, etc.). Another very important planning activity for the implemented scenario was the design of the mechanisms behind gamification: establish how many points to award for each trip, depending on the type of trip, when to award bonuses, and the thresholds that users had to reach in order to get badges and virtual prizes.

FP7 - 608991 - STREETLIFE D6.2.1 – City pilots planning and evaluation results (initial)
WP6 – City Pilot Planning and Evaluation © STREETLIFE Consortium Page 22 of 102
Figure 3: Badges from the Green Game.
There was a second group of users involved in ROV-EXP-1, that is, parking and traffic aides of the city: these are personnel or volunteers managed by the Rovereto municipality, who help with parking and traffic duties in the city. In ROV-EXP-1, they were in charge of testing the parking availability App “Conta Parcheggi” (see Figure 4), and at the same time provided data through that App regarding occupancy rates for parking lots and parking on the streets, with the purpose of having means to measure the impact of experiment on Park & Ride in the city.

FP7 - 608991 - STREETLIFE D6.2.1 – City pilots planning and evaluation results (initial)
WP6 – City Pilot Planning and Evaluation © STREETLIFE Consortium Page 23 of 102
Figure 4: Screenshots from the ContaParcheggi App.
Finally, another activity in ROV-EXP-1 was the involvement of a stakeholder external to the STREETLIFE consortium that is, the provider of the new eMotion Bike Sharing service run, which is run in Rovereto by a third party, a company called Bicincittà. The involvement of this company was important in order to get access to the data about the bike sharing service that were essential to implement Bike Sharing as one of the possible green modal alternatives. Data coming from eMotion are used in the Bike Sharing app, in order to show to users the position of bike sharing stations and the number of available bikes and free spots to leave the bikes in use. That information is also integrated in the ViaggiaRovereto itinerary planning App, and allows to plan routes that include bike sharing legs.
In the context of ROV-EXP-1, the following software components were deployed and used:
• Multi-modal journey planner; • ViaggiaRovereto mobile App; • Mobile App for parking/traffic aides; • Bike sharing app; • Gamification engine.
The data sources used to collect information about the ROV-EXP-1 and for its evaluation are the following:
• Log data from Viaggia Rovereto App (routing App), in particular requested itineraries and chosen itinerary options;
• Log Data from Conta Parcheggi App (traffic aides App) about occupancy rates of parking lots;
• Log Data from Conta Parcheggi App (traffic aides App) about on-street parking occupancy rates;
• Historical data about occupancy rates of for parking lots collected previously, to be used as baseline for comparison with data collected during the experiment;
• Baseline questionnaires submitted to End Users about their mobility behaviour at the kick-off meeting of 03.11.2014;
• Ex-Post questionnaires submitted to End Users about their mobility behaviour at the feedback meeting of 15.12.2014;
• Bike sharing data from eMotion service, in particular up-to-date availability data, and origin/destination matrix of the bikes circulating in Rovereto during the period of ROV-EXP-1.
ROV-EXP-2 – Park & Ride for special events

FP7 - 608991 - STREETLIFE D6.2.1 – City pilots planning and evaluation results (initial)
WP6 – City Pilot Planning and Evaluation © STREETLIFE Consortium Page 24 of 102
ROV-EXP-2 is similar in purpose and scope to Experiment 1. The main difference is that ROV-EXP-2 constitutes an open test field, targeting tourists and visitors coming to town to visit the Christmas Markets (one of the biggest annual events in the city of Rovereto, hosted in its centre). The goal of the experiment is to encourage these end users to adopt the ViaggiaRovereto App, and to follow its itinerary suggestions when visiting Rovereto; specifically, a dedicated version of ViaggiaRovereto promotes reaching the centre of the city and the Christmas Market with a Park & Ride solution, centred on the Stadio Quercia parking lot, and taking advantage of a special shuttle bus service set up to move people from there to the Christmas Markets locations. This new version of ViaggiaRovereto, containing all the features developed for ROV-EXP-1 and customized for ROV-EXP-2, has been made available on Google PlayStore before the experiment started.
The engagement plan for this open field experiment involved many entities. The organization in charge of the Christmas Markets in Rovereto called “Rovereto in Centro” was involved for marketing purposes, to promote usage of the Apps among the visitors (see for instance the leaflet in Figure 5), and to organize the contact point where questionnaires, filled by shuttle bus users, were collected by drivers. AMR, the company who runs parking lots in Rovereto, has been involved to organize detection of occupancy of the Stadio Quercia parking lot and to distribute the questionnaires to shuttle bus riders. The Tourism Agency for the Trento province has been contacted to promote the App, and the experiment as a whole, thorough its website and its mailing lists. Contact have been held also with Società Autostrade in order to organize a panel that promoted the Rovereto Christmas Markets on the A22 highway, and with the Camperists Organization, which used the Stadio Quercia parking lot with their vehicles.

FP7 - 608991 - STREETLIFE D6.2.1 – City pilots planning and evaluation results (initial)
WP6 – City Pilot Planning and Evaluation © STREETLIFE Consortium Page 25 of 102
Figure 5: Promotional Material for Christmas Markets
The planning effort in the shuttle bus organization required setting up a route and the timetable for the shuttle bus, involving the Trento Province that was in charge of organizing the service. It is important to remark that this service had been implemented a few years ago in the same occasion, with different routes, but due to its low level of success had been discontinued.
ROV-EXP-2 ran on specific dates during the Christmas Markets period, which in Rovereto lasts for one month (from 06.12.2104 to 06.01.2015). Within that period, 8 days were selected for ROV-EXP-2, i.e., the days with the highest expected number of tourists coming to town. The dates were 4 Saturdays in December (06-13-20-27) and the four days immediately before Christmas (21-22-23-24).

FP7 - 608991 - STREETLIFE D6.2.1 – City pilots planning and evaluation results (initial)
WP6 – City Pilot Planning and Evaluation © STREETLIFE Consortium Page 26 of 102
The software solutions deployed for ROV-EXP-2 are the same as those for ROV-EXP-1, with the exception of the Gamification Engine, since no game was organized for the Christmas Market, and a new version of ViaggiaRovereto recommending event-specific transport alternatives.
Also, the data collected was largely the same. The most important difference with respect to data sources was a questionnaire to ask incoming tourists about the routing App, the Park & Ride solution and the shuttle bus service.
ROV-EXP-3: Mobility Control Panel Quality Test
The third experiment we planned was a qualitative test on the functionality of the Mobility Management Emission Control Panel produced in STREETLIFE by WP4, for the purposes of mobility manager in Rovereto, in particular visualization and management of the parking situation, as per use cases ROV-PR/4 and ROV-PR/5.
For the planning of ROV-EXP-3, most of the work consisted in establishing the requirements for the control panel: what has to be shown in the control panel and how, in order for it to become a useful instrument for the mobility manager in ROV.
At the time of writing, ROV-EXP-3 has not been completed, since the MMECP customized for ROV and for the use cases above has not been finalized. The evaluation of this experiment will be carried out as soon as the MMECP will be made available, and will be reported on in follow-up Deliverable. That evaluation will be a qualitative one; the main instrument is a questionnaire about usability and usefulness of the MMECP solution for parking visualization and management, which will be submitted to the Rovereto Mobility Manager in order to collect his evaluation, as well as feedback and suggestions about how to improve the instrument.
Correlation with research questions and hypotheses:
The experiments we carried out in the ROV pilot provided data and qualitative answers that addressed the following research hypothesis; in Section 4.3 we present the evaluation of those hypotheses based on the outcomes of the planned experiments.
Table 3: Relationship between Experiments and Research Hypothesis
Experiments Research Hypothesis
ROV-EXP-1: Park & ride for commuters
HY-ROV15 The city cop will find the STREETLIFE system useful for P&R
HY-501 The users will use the STREETLIFE system
HY-502 The user will find the STREETLIFE system easy to use
HY-ROV18 Users choose trip options that include bike sharing

FP7 - 608991 - STREETLIFE D6.2.1 – City pilots planning and evaluation results (initial)
WP6 – City Pilot Planning and Evaluation © STREETLIFE Consortium Page 27 of 102
HY-ROV3 The utilization rate of bike sharing system will rise
HY-ROV16 The utilization rate of buses will grow
HY-ROV4 The utilization rate of outer parking slots will grow
HY-ROV19 The utilization rate of parking slots placed in the historical city centre will decrease
ROV-EXP-2: Park & ride for special events
HY-ROV15 The city cop will find the STREETLIFE system useful for P&R
HY-501 The users will use the STREETLIFE system
HY-502 The user will find the STREETLIFE system easy to use
HY-ROV16 The utilization rate of buses will grow
HY-ROV4 The utilization rate of outer parking slots will grow
HY-ROV19 The utilization rate of parking slots placed in the historical city centre will decrease
3.3. The planning process at TRE
3.3.1. Activated scenarios
The following scenarios and use cases have been activated within the first iteration. Full details on the contents and specification of each can be found in STREETLIFE D6.1.
Table 4: Activated TRE scenarios and use cases for first iteration
Scenarios Use cases
Integration of existing IT systems
TRE-01/1: Reuse IT systems
- Integrates and builds on existing technologies and investments the City of Tampere already has made in their Intelligent Transport Systems.

FP7 - 608991 - STREETLIFE D6.2.1 – City pilots planning and evaluation results (initial)
WP6 – City Pilot Planning and Evaluation © STREETLIFE Consortium Page 28 of 102
Multimodal real-time journey planner with park & ride.
Combined scenarios TRE-02, TRE-02, TRE-04 and TRE-05.
TRE-02/1: Find multi-modal real-time affected journey
- Safe, personalized and real-time routing solution covering all modes of transport to achieve the best experience during the entire travel, thanks also to advanced user interfaces.
TRE 02/1: Open API for third party access
- Establishes a new value-added chain offering an interface to mobility service providers and commercial enterprises
TRE-04/1: Make park & ride journey
- Multimodal Park&Ride Trip will check parking slot real time availability as part of trip suggestion.
- Whenever convenient, routing prefers parking sites outside the city centre.
TRE-05/1: View journey plans CO2 emissions
- Carbon footprint calculation for the trip suggestion
In addition Mixed reality field trials as described in WP5.2 and 5.4.
3.3.2. Experiments deployed
Experiments
In the first iteration of the Tampere Pilot, the following experiments were deployed. Experiments were accessible in address http://streetlife.tampere.fi with any mobile device. In addition, WP5 mixed reality field trials were done as described in WP5.2 and 5.4.
Experiment Date Number of users
TRE-EXP-1: Focus Test Group pilot 1.10.2014 - 22.2.2014 43
TRE-EXP-2: Public Pilot 3.11.2014 - 22.2.2014 4280
Data collection of experiments ended in February, but it was decided that public multimodal real-time routing service solution is kept online. It helps in the engagement of the users for the second iteration and shows what STREETLIFE has enabled so far in the City of Tampere. There was lot of marketing done before and at the launch of the pilot, keeping service running helps in dissemination and keeps momentum going. It also gives possibility further gather information about the usage.

FP7 - 608991 - STREETLIFE D6.2.1 – City pilots planning and evaluation results (initial)
WP6 – City Pilot Planning and Evaluation © STREETLIFE Consortium Page 29 of 102
Tampere pilot app was most often used on the move. STREETLIFE mobile app collected anonymously data on the usage and pre- and post-questionnaires were used in evaluation.
Figure 6: Tampere pilot usage and the mobile apps view. App remembered the previously searched locations, so searching in new occasion was made as easy as possible.

FP7 - 608991 - STREETLIFE D6.2.1 – City pilots planning and evaluation results (initial)
WP6 – City Pilot Planning and Evaluation © STREETLIFE Consortium Page 30 of 102
Figure 7: Mixed reality field trial. Mixed reality helps users to orient themselves and for example locating the bus stop in a busy terminals area, which has multiple platforms in a wider area.
Engagement strategy
Focus test group (TRE-EXP-1) was set up by first selecting a suitable target group from the stakeholders of the scenario TRE-02, and by emailing them an invitation to the focus test group. In addition to this, recruitment was enhanced by targeted on-site advertisements calling for participants. Many of the Focus Test group users came from the active public-private ITS Factory community in Tampere region, http://www.hermiagroup.fi/its-factory/.
Volunteered people got the credentials to use the pilot service and were asked to fill a pre-questionnaire before entering the service. The size of the focus group became 43 users, of which 16 filled the pre-questionnaire. Additional goal of the focus test group was to get feedback and apply possible fixes before service is opened to public pilot in TRE-EXP-2.
The public pilot (TRE-EXP-2) was engaged one month later by opening the STREETLIFE service to all users (authorization no longer needed to access the service), and by promoting the service in local magazines and internet channels, most notably in the official public transit service pages of Tampere city. During the first month, the public pilot got 3381 users. Only a small fraction of users (56 persons) volunteered to fill the pre-questionnaire. After three months experiment had 4280 users. Additional goal of the public pilot was to evaluate the stability and scalability of the solution.
Marketing of the STREETLIFE Tampere pilot got quite many local newspapers interested and several news articles were published.

FP7 - 608991 - STREETLIFE D6.2.1 – City pilots planning and evaluation results (initial)
WP6 – City Pilot Planning and Evaluation © STREETLIFE Consortium Page 31 of 102
Figure 8: Publicity examples of the STREETLIFE Tampere Pilot .
Evaluation Strategy
Tampere STREETLIFE Pilot experiments were evaluated using the following methods:
• Pre/post questionnaires
• Internal service monitoring
• Analytics of the service usage (Google analytics)
• Feedback tool in the application
• Interviews with Tampere Traffic Planning authorities
Software used
Key STREETLIFE Tampere pilot scenario was to use existing IT-systems and software available in the Tampere using industry standards. In experiments for focus test group and public pilots great care was taken that integration is fluent and tested.
STREETLIFE Multi-modal real-time routing service http://streetlife.tampere.fi integrates following services and software. These are described in further detail in D6.1 section 2.3.3. The integration utilises European Union standards like SIRI and DatexII as described in D2.2.1 STREETLIFE Blueprint Architecture, Security Architecture, and site-specific architectures for Tampere pilot. Map data access uses international Open Geospatial Consortium standards (http://www.opengeospatial.org/). Additionally Tampere Public transportation authority grew regional during the pilot setup and more static datasets were integrated in these background services.

FP7 - 608991 - STREETLIFE D6.2.1 – City pilots planning and evaluation results (initial)
WP6 – City Pilot Planning and Evaluation © STREETLIFE Consortium Page 32 of 102
• Multi-modal route planner service/API (Finnish Kalkati.net XML Interface), extended to regional and to include real-time information
• Bicycle route planner (Finnish Kalkati.net XML Interface), extended to regional
• Mobile routing application, configured to be used in Tampere pilot
• SIRI bus traffic estimates (SIRI interface), new interface integration
• Geocoding/reverse geocoding (WMS/WFS interface), extended to regional
• Background map services (WMS/WFS interface), extended to regional
• Parking place availability in parking hall (DatexII interface), new interface integration
Data Sources used
The STREETLIFE Tampere pilot use the data sources listed in below. These are described in further detail in D6.1 section 2.2.3.
• Road and street network
• National road network
• Maps of Finland
• Tampere street addresses
• Bicycling network
• Public transport timetables and routes (Buses and trains)
• Route planning API
• Tampere public transport SIRI
• Parking halls
• Parking hall status
• User preferences
• CO2 emission information per vehicle type Correlation with research hypotheses:
The experiments in the TRE pilot addressed the following research hypotheses. We present the evaluation results concerning those hypotheses in Section 4.4.
Table 5: Relationship between Experiments and Research Hypothesis
Experiments Research Hypothesis
TRE-EXP-1: Focus Test Group pilot
HY-501 The users will use the STREETLIFE system
HY-502 The user will find the STREETLIFE system easy

FP7 - 608991 - STREETLIFE D6.2.1 – City pilots planning and evaluation results (initial)
WP6 – City Pilot Planning and Evaluation © STREETLIFE Consortium Page 33 of 102
TRE-EXP-2: Public Pilot to use
HY-TRE7 Users can understand a presented route in more comprehensive manner than with traditional interfaces
HY-TRE6 Users find bus stops and identify buses easier and more accurately than from traditional interfaces
HY -TRE1 Private car users will find Park & Ride useful
HY-TRE4 STREETLIFE will stay in production after project has ended City management takes the pilot/parts of pilot into use
3.4. Know-how and lessons learned from pilot planning
The planning process for the three pilots described above has made evident a set of issues, and has led to several lessons learned. Many of those are specific to a single pilot, but others – which we summarize below - are valid across pilots and pilot sites, and represent know-how accumulated by the STREETLIFE consortium in this first iteration, which will be taken into account in the planning process for the second iteration.
Engagement challenges: in all pilots, the single most challenging aspect of the pilot preparation has been engagement of end users to participate in pilot experiments. That has been true for experiments with closed and controlled groups of volunteers and friendly users, as well as experiments directed to the general populace. For the second iteration, the pilots are already considering some actions. For example, in Section 4.2.5, the BER pilot has pointed several significant steps that can be taken to mitigate the risks for the BER pilot success coming from engagement challenges. Similar ideas can be implemented in the ROV and TRE pilots to ensure continued success of their engagement with STREETLIFE stakeholders, in particular end users / citizens.
Sustained engagement: Beyond the difficulty of initiating engagement (that is, recruitment), another aspect of this problem is keeping of recruited participant engaged and active throughout experiments, including at the very end of the experiments, when typically a lot of critical ex-post data is supposed to be collected, e.g., about the users’ experience.
Engagement effort: an additional concern related to engagement is that, even when the most successful, engagement activities have shown to be extremely resource-consuming. Conclusion: proper, more substantial planning and allocation of resources (in terms of effort as well as collateral costs, like publicity material or rewards for participation in surveys) seems necessary to have a better chance on engagement in the next iteration. Measures that can help spread awareness of the STREETLIFE pilots and its goals through “word of mouth” are also advisable; for example, TRE has already started discussion with the Tampere University of Technology student groups, which are active on traffic related matters, with the objective to engage them continuously and give them early access in second pilot iteration

FP7 - 608991 - STREETLIFE D6.2.1 – City pilots planning and evaluation results (initial)
WP6 – City Pilot Planning and Evaluation © STREETLIFE Consortium Page 34 of 102
and in TRE mixed-reality field trials. Hopefully this improved communication will also boost the participation from this particular demographic.
User application-related engagement gap: it became evident during the pilot planning activities that BER had greater difficulty in organizing and running a sizeable pilot with citizens in the role of users of STREETLIFE technology. This happened in large part because the BER partners cluster missed established end user applications, in particular a journey planning and travel assistance App, which instead was present in TRE as well as ROV with a significant level of market penetration. Especially for experiments with the general public, the natural lack of penetration of a brand new App like the one developed for the BER pilot, compounded with the fact that the application domain of urban mobility Apps tends to be crowded (in Berlin, at the very least) created problems in the execution of the case study. Conclusion: generalizing, this may be a risk that needs to be considered in pilot planning every time a completely new end user technology needs to be rolled out for a pilot experiment, as opposed to piggyback on pre-existing versions of the same technology, especially when the target is the general public (uncontrolled experiments).
Methods and tools for feedback collection: all pilots seem to have under-planned (and have encountered difficulty with) the collection of feedback for evaluation purposes. The tools used prevalently were questionnaires, either on paper or on a Web site. These conventional feedback collection tools had low yield (which is related to the engagement difficulties mentioned above) and seemed generally to be only partially welcome among participants. Conclusion: pilots need to devise with the rest of the consortium effective and efficient practices to ask for feedback, including technical means and to automatize the process.
Planning for and handling of negative results: a few of the findings upon which we report in Section 4 represent examples of negative results, with respect to the intended effects that the pilot experiments hoped to see on the corresponding STREETLIFE urban mobility scenarios. It was not clear from the pilot plans how to exploit negative results for the purposes of each pilot, and for the project as large. Conclusion: consider whether pilot planning should include a section on planning for negative evaluation results, detailing how to manage them how to communicate about them with partners involved (including municipalities), how to adjust plans for overcoming the causes of adverse mobility phenomena suggested by those negative results, and overall how to derive useful insight on sustainable mobility also from negative results, including recognizing opportunities for improvement in both the STREETLIFE system and the evaluation and impact assessment hypotheses and processes.

FP7 - 608991 - STREETLIFE D6.2.1 – City pilots planning and evaluation results (initial)
WP6 – City Pilot Planning and Evaluation © STREETLIFE Consortium Page 35 of 102
4. EVALUATION OF PILOTS
4.1. Evaluation overview
The evaluation of pilot results can be conceptually split in the following parts: i) evaluation of the technical STREETLIFE instruments that were deployed locally to enable the pilot and its various experiments; ii) evaluation of facets of the pilot that were implemented because of their importance to local sustainable mobility concerns in the pilot site; and iii) evaluation of the facets of the pilot that impact the three overall objectives of STREETLIFE project, that is, can lead to reduced carbon emission, can ameliorate the traffic situation, and can change the mobility habits and behaviours of EU citizens. In the following, we report on i) and on ii), whereas iii) is the subject of the upcoming (Month 20 of the project) STREETLIFE Deliverable D8.2.1, which is titled “Achieved impacts of STREETLIFE services”.
It is important to notice that ii) and iii) above cannot be completely separated, since in each given pilot, local concerns on mobility may obviously have a direct or indirect impact – at the scale of that individual city – on those three major STREETLIFE objectives. The approach we have taken in all of those cases is to report in this Deliverable only on the local outcomes, from the perspective of the pilot city. Those outcomes will of course be leveraged as input for the more global kind of impact analysis that D8.2.1 will present.
The evaluation methods employed in each pilot may differ, based on the kind of data that was collected and the concerns being addressed. The overall planning of the evaluation process, including the definition of research questions, related hypotheses and related performance indicators was described in STREETLIFE Deliverable 8.1. In the rest of this Section, each pilot reports its evaluation results according to that plan, and in line with the separation between city-level results evaluation and project-wide impact assessment explained above. Occasionally, some of the results reported below may also extend and augment the original evaluation plan, whenever data collection and analysis during and after the first pilot iteration has made evident features and findings that were not foreseen at the time the evaluation plan was put together.
Evaluation is regarded in all the three pilots as a continuous learning process, leading to incremental understanding and refinement of questions as well as answers. In this Deliverable, we report pilot evaluation results that have become available at the time of writing, which are necessarily a subset of the evaluation results that will become available from the data collected in the first iteration. The use of those additional evaluation results will be multifold, ranging from dissemination and exploitation, to directing the design of the second pilot iteration and related experiments, to providing feedback for the improvement of ICT tools being developed and deployed by the project. Many of those additional evaluation results are related to STREETLIFE impact assessment, and will hence be reported in D8.2.1.
4.2. Evaluation results at BER
An overall focus of the first iteration field trial BER-EXP-2 has been laid on testing the Berlin App, its applicability for evaluation purposes, corresponding data flows and service interfaces, and the intended Berlin evaluation methodologies as such. The Berlin field trials have been performed as “friendly user tests”. Up to 12 users -familiar with the project

FP7 - 608991 - STREETLIFE D6.2.1 – City pilots planning and evaluation results (initial)
WP6 – City Pilot Planning and Evaluation © STREETLIFE Consortium Page 36 of 102
STREETLIFE and the Berlin App- have used and evaluated the App and the underlying services.
4.2.1. Goals of evaluation
In the first iteration period of the project the main evaluation focus has been laid on:
• Technical evaluation and evaluation of user acceptance and usability of the STREETLIFE Berlin App as the tool for multi-modal trip planning
• Impact assessment of the Berlin pilot implementations with regard to a modal shift to “greener” modes of transport
4.2.2. Questions addressed
The following research questions identified in report D8.1 have been addressed in Berlin:
• RQ-BER-1: Is there a significant change in the mode choice?
• RQ-BER-2: Which mode benefits most of the change?
• RQ-BER-5: Why people change their mobility behaviour?
• RQ-BER-6: How do situational variables (e.g. weather, day time, etc.) have an effect regarding the mode change?
Based on this, the following hypotheses have been addressed:
• HY-205: STREETLIFE significantly leads to a change in mode choice
• HY-204: STREETLIFE does increase the use of “green” transport modes
• HY-304: Situational variables have an impact on the use of STREETLIFE
• HY-501-505: User acceptance hypotheses have been addressed with accompanying user surveys
4.2.3. Data collected
Respective data (as listed in Table 6) has been collected during the field test in November and December 2014. In the CIP the following data has been stored:
• User profiles and preferences
• Trip requests made by users
• Trip choice selected by users
During the field test BER-EXP-2 an App constantly tracked the GPS position of the devices. This data has been sent periodically to the DLR.

FP7 - 608991 - STREETLIFE D6.2.1 – City pilots planning and evaluation results (initial)
WP6 – City Pilot Planning and Evaluation © STREETLIFE Consortium Page 37 of 102
Friendly users have been approached with a user acceptance survey. Data on user acceptance has been collected anonymously and stored at DLR servers.
Table 6: BER collected data for field trial
BER Field Trial
Data source Type of data Origin of data Detailed description of data
Routing data from App
Routing data BER App à CIP data storage
Detailed data on route requests, viewed and selected routes by users, user preferences and profile data
GPS tracking data
GPS coordinates as CSV
DLR tracking App
GPS tracking data (geographical coordinates) of user movements
User acceptance and uptake
Qualitative survey data Online survey Qualitative investigations of user demographics, acceptance, assessment of the App and services, perception of service potentials, separated for baseline and treatment investigation
4.2.4. Findings
Three main data sets have been collected during BER-EXP-2 :
o Routing data,
o GPS tracking data and
o Data on the user acceptance survey.
The following sub-chapters elaborating the main findings of respective data analyses and, thus, of the Berlin field test will follow this data oriented structure.
As mentioned above, BER-EXP-2 was dedicated to the testing of the App and the corresponding data flows. The field test has been performed with 12 “friendly” users recruited amongst the Berlin SREETLIFE partners.
4.2.4.1. Routing Data Analysis
The Berlin STREETLIFE App has been used to plan daily mobility. Error! Reference source not found. depicts the Berlin routing system architecture.

FP7 - 608991 - STREETLIFE D6.2.1 – City pilots planning and evaluation results (initial)
WP6 – City Pilot Planning and Evaluation © STREETLIFE Consortium Page 38 of 102
Figure 9: Berlin Routing System Architecture
The Berlin STREETLIFE App as end user application mainly deals as a frontend to the user. The main services are realized as backend components. Users perform routing requests by means of the end user application. State [1] of the end user application shows the input screen for the routing information where users adjust the request according to their needs. The routing request is sent to the TripProposal Service that is integrated into the CIP backend as a REST service. CIP forwards the requests to the multimodal router that generates the trip proposal (a list of proposed itineraries). In state [2] the user can browse through the list of proposed trips and view the detail information of the itineraries. If the user decides for a particular trip, a routing mode (called “Companion mode”) can be activated by typing on the routing icon in state [3]. During the routing the current position and the preferred trip are displayed in a map (compare state [4]). If the routing icon is touched the following data is sent to the CIP data storage by means of the User Service:
• Device specific data: app version, device ID, model
• Longitude and latitude of the current position
• Street or stop name of origin and destination
• A timestamp of the current time
• The user request
• The proposed trips
• The details of all viewed trips
• The preferred trip (the trip where the companion mode was activated for) Resulting data is stored in the City Intelligence Platform (CIP), integrated by Siemens. Based on this data source the following analyses could be performed.

FP7 - 608991 - STREETLIFE D6.2.1 – City pilots planning and evaluation results (initial)
WP6 – City Pilot Planning and Evaluation © STREETLIFE Consortium Page 39 of 102
Three different types of routing data for each route request are stored at the CIP Platform
o Data on route proposals: The system stores data of the route proposals before a user has selected the personal best choice
o Viewed route options: The system is able to store which of the route proposals the user views in detail
o Selected route options: The system stores the from the user selected route options
Data on route proposals
The data on route proposals contains of information about routing requests (sent to the system) and route proposals (answered by the system) and gives an overview about how many route requests have been performed and answered. During the first iteration field test 34 routing requests were performed. On average each routing response contains of 3.7 trip options/proposals. That means that each response contains of much more than only one fitting trip option. Each trip proposals integrated 2.2 modes of transport on average: i.e. this could be the combination of a bicycle and the public transportation or the combination of a bus and a metro. Per trip proposal averaged 8.1 green leaves were possible to win and in total 275 green leafs were provided to win for all trips.
Data on viewed route options
It became obvious that only for 2 of 34 trip proposals more than one option has been viewed by the user. For the majority of proposals, the first –and only- trip viewed was selected and stored. As a consequence, almost no differences in routing details (e.g. modal split) between the viewed and finally selected trips could be detected. Nearly identical values were observed such as included transport modes and related modal splits. Taking this into account, the collected data for viewed route options will be equated with the data on selected route options and, thus, commonly analysed.
Data on selected route options
The overall mileage of all trips planned with the App and finally stored as “selected” at the CIP is 369 km for the mentioned 34 routes (N = 34). On average, the selected trips include 2.1 modes for each trip. Here a negligible decrease can be detected regarding the amount of included modes on a trip in comparison to the data on all route proposals. This important point needs to be further investigated with the second field test.
Figure 10 shows the modal split for the selected routes. The largest share (52 %) of all selected routes contains of the mode “train”. It includes metro (U-Bahn), suburban railway (S-Bahn) and regional trains (Deutsche Bahn). This proportion is followed by car with an amount of 29 %. This traffic type means the private “car” without car sharing and ride sharing. With 10 % the transport mode “bus” takes the third position. Other modes “bike”, “walk” and “tram” play minor role with a proportion of 4 %, 3 % and 2 %.

FP7 - 608991 - STREETLIFE D6.2.1 – City pilots planning and evaluation results (initial)
WP6 – City Pilot Planning and Evaluation © STREETLIFE Consortium Page 40 of 102
If the public transportation modes are summed up, they would have a value of 64 %, which is much “greener” than the official modal split statistics for the city of Berlin2. But on the other site, the share of the STREETLIFE relevant mode “bike” is in the Berlin test case much smaller than the official values.
Figure 10: Berlin Modal Split Selected routes
Concerning the too small share of mode “bike” a closer look differentiating between the two weeks of the test phase is helpful. Both weeks consists of 17 routes with significant differences. The mileage in week 1 is with 143 km quite short in a direct comparison to 225 km in week 2 - see Figure 11 and Figure 12. With the same amount of trips per week, the average trip distance in week 1 is with 8.1 km significantly shorter than the average trip distance in week 2 with 11.7 km. This apparently had a direct impact on the respective mode shares.
Consequently, in the second week the use of the private car increases while mode shares of “walk” and “bike” decreases. The proportion of the car in the modal split increases from 17 % to 44 % in week 2.
2 SenStadtUm (2013): Official Berlin statistics for modal split: car 32 %, 27 % PT, 13 % bike and 29 % walking
modes

FP7 - 608991 - STREETLIFE D6.2.1 – City pilots planning and evaluation results (initial)
WP6 – City Pilot Planning and Evaluation © STREETLIFE Consortium Page 41 of 102
Figure 11: Berlin Modal Split week 1
Figure 12: Berlin Modal Split week 2
As a situational variable, the impact of the weather has been investigated – as far as possible with available data – see Figure 13. It could help to justify the strong increase of mode “car” in the second week, which was characterized in particular by much more rain than the first week. The relation between the car use and the rain is strongly connected.

FP7 - 608991 - STREETLIFE D6.2.1 – City pilots planning and evaluation results (initial)
WP6 – City Pilot Planning and Evaluation © STREETLIFE Consortium Page 42 of 102
Figure 13: Weather conditions during BER-EXP-2.
Overall the number of collected green leaves is 233 within the two weeks. The number of possible green leaves of proposed trip was 274. This high amount of earned green leaf credits indicates that the gaming approach should be a matter for further elaboration in the second test period.
However, again it needs to be said that with the available amount of data no reliable evaluation conclusions could be derived.
4.2.4.2. GPS Tracking Data Analysis
During the four weeks of overall field test in Berlin, users have been tracked by an additional GPS tracking application installed on their smartphones. When enabling the tracking mode – which could be switched off by users for privacy reasons – GPS coordinates have been constantly recorded and sent to a DLR database on user request.
Temperature
Precipitation

FP7 - 608991 - STREETLIFE D6.2.1 – City pilots planning and evaluation results (initial)
WP6 – City Pilot Planning and Evaluation © STREETLIFE Consortium Page 43 of 102
Figure 14: GPS tracking App Figure 14 shows the GPS tracking App and a collection of raw GPS coordinates. In a post-process GPS coordinates of individual trips have been mapped to means of transport using only the acceleration/deceleration sensors of the smartphones. Within the time frame of four weeks field test, 409 GPS tracks have been collected and submitted to the data base.
Finally, for each trip a mapping to incorporated modes of transport has been applied. Table 7 shows a data extract of the resulting database.
Table 7: GPS tracking data base extract TRIP Duration
in ms Distance in meter
Time Walk
Dist Walk
Time Bike
Dist Bike
Time Car
Dist car
Time Bus
Dist Bus
49 132001 123 0 0 0 0 0 0 0 0 17 100001 180 0 0 0 0 0 0 0 0 19 91014 200 91014 200 0 0 0 0 0 0 29 121000 206 81000 137 0 0 40000 69 0 0 41 216000 208 216000 208 0 0 0 0 0 0 37 100688 212 65479 107 0 0 35209 105 0 0 …
Based on this mapping of tracking data to modes of transport, the following evaluation results could be derived.
The first two weeks of the field test have to be considered as a baseline investigation. Users have not use the STREETLIFE App, but the stand-alone GPS tracking App. The intention was to investigate the normal behaviour of test users.

FP7 - 608991 - STREETLIFE D6.2.1 – City pilots planning and evaluation results (initial)
WP6 – City Pilot Planning and Evaluation © STREETLIFE Consortium Page 44 of 102
Figure 15: Modal split for baseline weeks of field test
Disregarding the low number of participating users and recorded GPS tracks, Figure 15 indicates a slight but significant increase of mode “bike” can be seen. Unfortunately, this increase has not been decreasing the car usage, as for the second week a slightly longer average trip distance (1st week: 5596 m, 2nd week: 7580 m) could be observed.
Here, it needs to be said that the algorithm mapping the GPS tracks to transport modes could not reliably distinguish between modes “car” and “train” due to similar driving (acceleration/deceleration) characteristics within urban traffic contexts.
After the roll-out of the Berlin STREETLIFE App, weeks 3 and 4 of the field trial were the treatment phase. Users have been using the STREETLIFE App for planning their daily mobility and –in parallel- the GPS tracking App to record their actual performance. However, this period is still to be considered as a consolidation phase, in which users got acquainted with the App and the integrated services. An immediate change of users’ behaviour and the corresponding modal share was not expected to be seen.
Figure 16: Modal split for treatment weeks of field test Figure 16 shows an increase of usage of modes “bike” and “walk” while modes “car/train” and “bus” usage is decreased. For the fourth week, lower average trip distances have been recorded (3rd week: 5931 m, 4th week: 4966 m), which partly explains the observed changes.

FP7 - 608991 - STREETLIFE D6.2.1 – City pilots planning and evaluation results (initial)
WP6 – City Pilot Planning and Evaluation © STREETLIFE Consortium Page 45 of 102
Again, due to the low number of users participating in the field test, first iteration results does not allow deriving general evaluation conclusions. A data merging with given weather conditions (as a situational variable) has been applied, but has not provided any valuable information about its impact.
4.2.4.3. Analysis of Data on User Acceptance and Uptake Survey
To investigate the overall user acceptance and uptake, the field trial has been accompanied by a respective survey carried out during the baseline (t0) and the treatment (t1) phase. A common questionnaire has been applied, which, however, had to be slightly adjusted to the altered situation after the Berlin STREETLIFE App was rolled out. The survey has been performed as an online questionnaire, realised with the LamaPoll3 survey site.
With the following sub-chapters on specific aspects of the survey, a selection of main results relevant for better understanding user acceptance and uptake is provided. It did not seem reasonable to elaborate on all investigated aspects – especially when bearing in mind the rather small number of survey participants. However, some aspects highlighted in the following paragraphs may show and emphasise general trends and feedbacks to be taken into account for the second iteration.
Demography
12 users have taken part in the acceptance survey; 2 women and 10 men completed the questionnaires at both time points. More details on demographic data can be found in Table 8.
Table 8: Demographic data
Gender: Male Female
10 2
Employment status at the moment: Fully employed Student
11 1
Persons in household (mean) Persons Children under 18 years
2,5 0,6
Cars and bicycles available in households (mean) Cars Bicycles
0,8 2,2
Driving license available Yes Prefer not to say
11 1
3 http://www.lamapoll.de/ -

FP7 - 608991 - STREETLIFE D6.2.1 – City pilots planning and evaluation results (initial)
WP6 – City Pilot Planning and Evaluation © STREETLIFE Consortium Page 46 of 102
Public Transport ticket/subscription available Annual ticket Job ticket/ Semester ticket Monthly ticket Multiple ticket Single ticket
3 2 1 3 2
Modes of Transportation Most of the survey aspects have been investigated at two different points of time – t0 and t1. Resulting data has been analysed separately. However, to allow a better understanding of the analysis, it was decided to mainly use data interpretation showing the differences between t1 and t0. So, s stronger focus was laid to clearly show the main changes in user acceptance and uptake after the Berlin STREETLIFE App has been integrated in daily mobility planning routines in comparison with the baseline situation.
The following figures show how many survey participants have changed (increased or decreased) their attitude towards specific survey aspects. As an example: With using the App for mobility planning purposes, in comparison to the baseline investigation 2 more participants indicated using public transport 1-3 times per month, while one survey participant less used public transport on an (almost) daily base.
Figure 17 shows that by using the App no significant change with respect to the frequency of use for each mode of transportation can be derived from the data collected. “(Almost) daily" and "1-3 times a week" should be stronger weighted because as it was indicated most often. Increases and decreases between t0 and t1 are fairly symmetrically oriented to the X-axis.

FP7 - 608991 - STREETLIFE D6.2.1 – City pilots planning and evaluation results (initial)
WP6 – City Pilot Planning and Evaluation © STREETLIFE Consortium Page 47 of 102
Figure 17: Change in Modes of transportation – t1 minus t0
Modes of Transportation for Purposes A view to a mapping of trip purposes to available modes of transportation seems to be more promising as shown in Figure 18. Using the App, an increase of modes “walking (less than 500m)”, “public transportation” and the “car (as driver)” has been reported for the majority of trip purposes. However, for private trips a significant decrease of car usage is indicated with the given data. For the mode car sharing and rental car, a slight decrease of usage in general is reported.

FP7 - 608991 - STREETLIFE D6.2.1 – City pilots planning and evaluation results (initial)
WP6 – City Pilot Planning and Evaluation © STREETLIFE Consortium Page 48 of 102
Figure 18: Modes of transportation by purposes
In Figure 19 a closer look to modes “walk” and “public transport” is given. In sum, a remarkable increase of those modes has been reported by the users.
Figure 19: Modes of transportation: modes walk and public transport at t0 and t1.

FP7 - 608991 - STREETLIFE D6.2.1 – City pilots planning and evaluation results (initial)
WP6 – City Pilot Planning and Evaluation © STREETLIFE Consortium Page 49 of 102
Combining Modes of Transportation
As for the combination of different modes of transport, a slight but significant change towards multi modal mobility can be seen. At t0 only 2 users combine different modes of transportation for their trips (Figure 20). At t1, while mobility planning was supported by the App, 6 out of 11 study participants stated to combine different modes of transportation (Figure 21).
Figure 20: Combining Modes of Transportation at t0.
Figure 21: Combining modes of transportation at t1.
Planning criteria It is obvious in Figure 22 that duration is the most important trip planning criteria; it even increases with using the App for trip planning. On the other hand, CO2 was reported at t0 as the least important planning criteria. This is still the case after the App has been integrated

FP7 - 608991 - STREETLIFE D6.2.1 – City pilots planning and evaluation results (initial)
WP6 – City Pilot Planning and Evaluation © STREETLIFE Consortium Page 50 of 102
into planning, but, this has slightly changed at t1. This could be explained by making environmental impacts of individual mode choices visible (green leafs).
Figure 22: Importance of planning-criteria duration and CO2 emissions at t0 and t1.
Clarity of Information
As for usability survey aspects, one question was dedicated to the clarity of provided information. The presented information has been rated rather positively on average, whereas the relevance of the presented information was almost neutral rated by the users (Figure 23). For 4 out of 8 participants the user interface was intuitive to use, 2 of them were attuned neutral to the interface intuitive way to use.

FP7 - 608991 - STREETLIFE D6.2.1 – City pilots planning and evaluation results (initial)
WP6 – City Pilot Planning and Evaluation © STREETLIFE Consortium Page 51 of 102
Figure 23: Clarity of the information provided by the App.
Usefulness The positive expectations (as indicated in Figure 24) of the App could not be satisfied. After using the App for two weeks the perceived usefulness has been rated neutral to slightly negative as Figure 25 shows.
Figure 24: What users think about the Apps usefulness at t0.

FP7 - 608991 - STREETLIFE D6.2.1 – City pilots planning and evaluation results (initial)
WP6 – City Pilot Planning and Evaluation © STREETLIFE Consortium Page 52 of 102
Figure 25: Perceived usefulness at t1.
However, those two figures cannot be compared with each other, as at t0 users did not know the App and its usability. The positive expectations have been oriented at commercial trip planning Apps available for the Berlin transportation system. This clearly indicates a need for the integration of the mode bike and a safe bike routing into existing Apps. This is to be piloted with the Berlin STREETLIFE pilot and, thus, the App cannot compete with commercial products. Further results and conclusions
No significant differences in the importance of individual planning criteria could be investigated after implementing the App. It was clearly stated by 7 of 11 study participants the important to travel economical, but the Berlin App and the underlying services do not support more economical mobility. Even though a rather negative self-assessment of the users in terms of awareness of environmentally friendly modes of transport has been reported, Figure 22 shows that an unconscious change could happen – supported by just showing the impacts decision may have. No user would pay extra money for an additional navigational function. Besides that, 9 out of 10 would like to have an accompanying/assistance function which provides additional traffic news. In addition, 7 out of 10 users would accept a tracking function for updated traffic and route information; and the same number of users would appreciate an integrated booking request function for bike sharing services The study shows, that good travel time predictions and reliable information are provided by the App. The overall support that was given by the App was rated slightly positive. On the other hand, only 3 out of 11 users would like to use the App frequently for their trips and only 1 out of 11 users would recommend the STREETLIFE App to friends. The sample size (survey participants) cannot be considered large enough to make representative assumptions but initial data allows early trends to emerge. Further testing and

FP7 - 608991 - STREETLIFE D6.2.1 – City pilots planning and evaluation results (initial)
WP6 – City Pilot Planning and Evaluation © STREETLIFE Consortium Page 53 of 102
iterating on positive functions could allow for improvements to be scaled, with unimportant functions to be discarded down the line. 4.2.5. Evaluation summary
Based on the analyses described in the preceding sub-chapters the following main conclusions can be drawn:
- In general, the applied methodology was tested and approved to be further improved, adjusted and more extensively used for the second iteration field test. However, based on very small data sets, Berlin analyses cannot claim to be representative or reliable in a scientific sense.
- The biggest challenge is to recruit and to keep active a significant group of users for the Berlin pilot. The fact that within the Berlin pilot an individual App focussing on the specific targets has been developed from scratch requires particular attention. Even though the Berlin STREETLIFE App will not be able to compete with commercial App products available, reliable user recruitment approaches need to be identified and applied. In this respect, the following measures are foreseen to be applied for the second iteration:
o The recruitment and support of end users will be outsources to a third party expert company. Respective resources have been foreseen and planned and will be applied for hiring a significant amount of users actively using and assessing the App and connected Berlin pilot services.
o Besides that, dissemination events (e.g. Night of Sciences 2015) will be used to proactively approach cyclists to become STREETLIFE tester and user. This is planned to happen commonly between Berlin pilot partners taking part in the mentioned event.
o Furthermore, it is planned to contact associations and parties with specific interests in Berlin pilot’s focus – safe cycling, such as the cyclist association ADFC, DIE GRÜNEN (green political party), etc., but also larger companies with a significant share of cycling commuters (Fraunhofer, DLR, Siemens) via internal and external communication channels.
- Reliable data flow are established and linked with the Siemens City Intelligence Platform (CIP) as the central platform for data storage. Routing data, generated with the App, is stored at the CIP for later analyses following data protection and privacy regulations. A linkage between routing data stored at the CIP and GPS tracking data is still open for further system deployments. This linkage is necessary to compare the mobility planning process with the actual user behaviour.
- The continuous tracking of users’ position has not been considered as an issue by the majority of participants. So, it will remain a crucial method in order to compare users’ behaviour with planned mobility. Still, it needs to be linked with the routing data stored at the CIP. This combination will allow a reliable analysis of impacts the App and the integration of Berlin specific pilot use cases and scenario may have.
- It needs to be pointed out that still duration and costs are the most important planning criteria for the planning of daily mobility. Emission, as from particular interest for the

FP7 - 608991 - STREETLIFE D6.2.1 – City pilots planning and evaluation results (initial)
WP6 – City Pilot Planning and Evaluation © STREETLIFE Consortium Page 54 of 102
STREETLIFE project, is reported as least important when planning daily mobility. However, indicating the environmental impact of mobility decisions even in the planning process seems to have an effect at least on choices of available trip options. The majority of green leafs credits has been collected by the users participating in the field test.
- In general and taking into account that the Berlin App is not intending to replace commercial products, the potential of the mobility aspects addressed with the Berlin pilot and with the App is highly appreciated and rated positively by the test users. The integration of safe bike routing and some other convenience functions have been explicitly requested and are, thus, foreseen to be implemented for the second iteration. But the App will not exceed a prototype status.
4.3. Evaluation results at ROV
4.3.1. Goals of evaluation
In this Section we discuss the results of the evaluation activities for the ROV pilot, which have become available at the time of writing, from the analysis of the data collected throughout the first iteration in the experiments we have deployed.
Those evaluation activities tackled two major aspects:
1. We evaluated the technical solutions deployed in ROV; in particular, we report on the evaluation of:
• the ViaggiaRovereto mobile App, which STREETLIFE provided to citizens, together with the loosely integrated bike sharing App, for their itinerary planning needs. It is important here to discuss the various versions of ViaggiaRovereto used in each experiment of the pilot. In ROV-EXP-1 we rolled out a new beta-version STREETLIFE version of the App (not available on the Google Play store, and thus different from the official release of the App at that moment), which allowed the participants to make use of the innovative features specifically developed for STREETLIFE, while FBK could use the friendly and motivated group of users in ROV-EXP-1 to carry out beta testing. For ROV-EXP-2, that beta version, after having been opportunely patched based on testers’ feedback, was deployed as the official Google Play release, and the STREETLIFE features were made available to the general public. Moreover, since ROV-EXP-2 had to do with visitors to the ROV Christmas market, that release had a special feature facilitating the planning of itineraries with that specific destination, using an ad hoc button in the App GUI.
• the Conta Parcheggi mobile App, which STREETLIFE provided to ROV traffic aides to collect crowd-sensed data about parking availability / occupancy in parking lots and on the streets;

FP7 - 608991 - STREETLIFE D6.2.1 – City pilots planning and evaluation results (initial)
WP6 – City Pilot Planning and Evaluation © STREETLIFE Consortium Page 55 of 102
Figure 26: screenshots from the ContaParcheggi App.
• the Gamification Engine, which we have deployed in the third phase of ROV-EXP-1 as a means to promote participation of citizens, and reward their adoption of sustainable mobility habits.

FP7 - 608991 - STREETLIFE D6.2.1 – City pilots planning and evaluation results (initial)
WP6 – City Pilot Planning and Evaluation © STREETLIFE Consortium Page 56 of 102
Figure 27: Green leaves ranking in GreenGame with ViaggiaRovereto
• the Gamification Engine, which we have deployed in the third phase of Experiment 1 as a means to promote participation of citizens, and reward their adoption of sustainable mobility habits.
2. We evaluated a range of city-specific objectives for ROV, which were supported by the technology solutions above. The ROV-specific sustainable mobility concerns that we report on include:
• adoption by citizens of the Bike Sharing service recently launched in the city of Rovereto;
• adoption by citizens of suggested Park&Ride itineraries, which we promoted in our Experiments 1 and 2;
• increased utilization of public transportation services in the city compared to other modes of transportation;
• decreased utilization of private transportation (cars) in the city compared to other modes of transportation.
All of those evaluation goals are represented by one of more evaluation facets, which have been addressed via the data we have collected during the experiments and their post-mortem analysis.
4.3.2. Questions addressed
The facets that we address in our evaluation, within the scope of this Deliverable, can be grouped into three major themes, each of which contains some of the evaluation items defined in the original evaluation plan for ROV:
1. Usability and trust in the Apps
HY-ROV15 The traffic aides will find the STREETLIFE system useful for P&R
HY-501 The users will use the STREETLIFE system
HY-502 The user will find the STREETLIFE system easy to use
2. Impact on the choice of modes for urban mobility in ROV
HY-ROV18 Users choose trip options that include bike sharing
HY-ROV3 The utilization rate of bike sharing system will rise
HY-ROV16 The utilization rate of buses will grow
3. Change in the behaviour of citizens
HY-ROV4 The utilization rate of outer parking slots will grow

FP7 - 608991 - STREETLIFE D6.2.1 – City pilots planning and evaluation results (initial)
WP6 – City Pilot Planning and Evaluation © STREETLIFE Consortium Page 57 of 102
HY-ROV19 The utilization rate of parking slots placed in the historical city centre will decrease
Moreover, although not explicitly foreseen in the original evaluation plan for ROV, we were able through the design and results of ROV-EXP-1 to evaluate addition hypotheses on the effect on citizen behaviour. Those additional hypotheses (which remain so far specific to the ROV pilot, at least for the first iteration) investigate the effect of the introduction of gamification and the Gamification Engine software, ad are listed as follows:
HY-GE1 Gamification increased App Usage
HY-GE2 Gamification changed User Choices on the type of trips
4.3.3. Data collected
We collected a wide variety of data during the first ROV pilot iteration through our ROV-EXP-1 and ROV-EXP-2. The following tables provide a summary of that data at a glance, for each individual experiment.
Table 9: Evaluation data for ROV-EXP-1.
ROV-EXP-1
Data source Type of data Origin of data Detailed description of data
Occupancy rate for P&R parking lots
PARKING LOTS “Conta Parcheggi” App
To be compared to occupancy rate for other parking lots
33 observations collected for each P&R parking lots by 5 traffic aides within 9 days
On-street parking lots occupancy rate
PARKING LOTS “Conta Parcheggi” App
Observed by micro-zone and grouped by city macro-zones; to be compared to historical data about the same macro-zone
931 observations collected by 5 traffic aides within 14 days
735 observation in phase 1
196 observation in phase 2
Log app ViaggiaRovereto
User mobility behaviour
ViaggiaRovereto app
Data collected in the 3 phases; to be compared to

FP7 - 608991 - STREETLIFE D6.2.1 – City pilots planning and evaluation results (initial)
WP6 – City Pilot Planning and Evaluation © STREETLIFE Consortium Page 58 of 102
each other.
Information about mode of transport, length, duration, origin and destination.
889 saved trips by 36 users within 5 weeks.
ACTIVE USERS 26 in phase 1 28 in phase 2 28 in phase 3
SAVED TRIPS 113 in phase 1 236 in phase 2 540 in phase 3
Bike sharing usage
Bike sharing Bicincittà withdrawal control system
To be compared to ViaggiaRovereto data about bike sharing.
O/D matrix between all bike sharing stations
1706 bikes withdrawn by 159 users within 5 weeks.
Questionnaire
Closed-ended questions Baseline and post-experiment questionnaires
Comparison between ex-ante and ex-post questionnaires
User feedback about ViaggiaRovereto app.
40 baseline questionnaires and 24 post-experiment questionnaires filled in
Users' feedback about ViaggiaRovereto
Quality feedback email from ViaggiaRovereto from end-users
Feedback sent by users in order to point out bugs, mistakes and possible improvement.
N mail received by n users

FP7 - 608991 - STREETLIFE D6.2.1 – City pilots planning and evaluation results (initial)
WP6 – City Pilot Planning and Evaluation © STREETLIFE Consortium Page 59 of 102
In ROV-EXP-1, data have been collected both through the Apps ("Conta Parcheggi" and "ViaggiaRovereto") and questionnaires. Questionnaires were filled in at the beginning, in order to collect information about users' habits, and the end of the experiment, to evaluate the effectiveness of STREETLIFE and any changes on the users’ responses and habits that can be attributed to STREETLIFE technologies. For example the issue of ViaggiaRovereto usability has been evaluated through questionnaires, while the mobility behaviour changes have been assessed using both data from log of the ViaggiaRovereto App and information from questionnaires.
The comparison between the same questions of the two questionnaires has considered only answers given by users that have delivered both baseline and post-experiment questionnaire, in order to have a clearer picture of the variation.
Detailed questions about the usefulness and reliability of the ViaggiaRovereto App were asked only at the end of first experiment. Thus, among the 36 testers, those ones that assessed the usability of the app are 24.
Concerning the Park&Ride option, the actual Park&Ride trips considered were the only one that had a ride side; in other words, some testers used the P&R facilities, but not all utilized the bus and bike sharing service to complete their journey. In fact, diverse users parked in the P&R areas, but actually reached their destination walking for a short distance, covering at times less than 300 m. We decided not to consider those trips as real Park&Ride trips, even though they can be regarded as an indicator of the inclination of our users to take advantage of long-stay parking areas out of the city centre, and we have considered them when discussing that evaluation aspect.
Table 10: Evaluation data for ROV-EXP-2.
ROV-EXP-2
Data source Type of data Origin of data Detailed description of data
Questionnaire Close-ended questions Questionnaires fulfilled by selected P&R users (tourists)
General evaluation of ViaggiaRovereto app; mode of transport.
196 questionnaires collected within 8 days.
Occupancy rate for P&R parking lot
PARKING LOTS “Conta Parcheggi” App
33 observations collected for each P&R parking lots by 5 traffic aides within 9 days
ROV-EXP-2 was an open field experiment with the general public. Collection of data for this experiment in the field conditions set for ROV-EXP-2 was necessarily less multi-faceted than for ROV-EXP-1, since we did not have the same amount of control. We focused on two main data sets, that is, the occupancy rate observed at the selected P&R facility for the Christmas

FP7 - 608991 - STREETLIFE D6.2.1 – City pilots planning and evaluation results (initial)
WP6 – City Pilot Planning and Evaluation © STREETLIFE Consortium Page 60 of 102
Market (the Stadio Quercia parking), obtained through the Conta Parcheggi App, and a short questionnaire that was delivered to visitors riding the shuttle bus from the Stadio Quercia parking to Christmas Markets in the city centre.
It must be noted that while friendly user in the focus group for ROV-EXP-1were fully aware of the STREETLIFE project and motivated, therefore more inclined to spend their time answering questions and providing feedback, for example for evaluation of specific App features, the subjects of ROV-EXP-2 were occasional visitors to the Christmas markets and the general public, who, for obvious reasons were only inclined to provide – if anything - their opinion quickly. Therefore, the questionnaire for ROV-EXP-2 was designed to be as unobtrusive and quick to fill as possible, resulting in less detailed data in comparison with the questionnaire data of ROV-EXP-1.
In order to evaluate correctly the opinion about ViaggiaRovereto and its usability expressed by end users of ROV-EXP-2, only answers of users that actually had been guided by the app to the P&R area have been considered, i.e. 32 people.
Moreover, a specific question in the questionnaire was needed to distinguish car from camper drivers. In effect, the Stadio Quercia parking lot is located nearby a camper area and a significant number of camper drivers was expected to use the shuttle-bus service. This distinction was helpful to estimate the amount of people that used the shuttle-bus service. In fact, the answer about the number of people that were travelling with the person who filled in the questionnaire was sometimes empty. Thus, based on the completed answers, a coefficient expressing the number of person carried in cars and campers was calculated for each mode of transport used to reach the city centre. Consequently, this coefficient was utilized to estimate how many people arrived from the P&R area to the Christmas market when this information was not declared in the questionnaire. The distinction between camper and car drivers, vehicles, which are supposed to carry a different number of person, yields a more accurate estimation of that parameter.
4.3.4. Findings
In this section, results will be presented in the three categories identified in paragraph 4.3.2 in order to have a clear understanding of the several available data.
As described in detail in Section 3.2.2, ROV-EXP-1 consisted of three phases: during phase 1 (first week) baseline data were collected thanks to the recorded itinerary choices made by users through the ViaggiaRovereto App; during phase 2 (second and third week), users were pushed by the App to improve the sustainability of their trips by suggesting them greener mobility solutions for their journeys; in the last phase (fourth and fifth week) gamification was introduced, and a game was launched among ROV-EXP-1 participant to increase their number of accepted green trips.
USABILITY AND TRUST IN THE APPS
Conta Parcheggi
Overall, the Conta Parcheggi App had a positive feedback from both traffic aides who directly used it and the AMR company (Rovereto parking company), which manages traffic aides,

FP7 - 608991 - STREETLIFE D6.2.1 – City pilots planning and evaluation results (initial)
WP6 – City Pilot Planning and Evaluation © STREETLIFE Consortium Page 61 of 102
which is now willing to adopt the App. The traffic aides spokesperson reported a favourable opinion about the usability of the App and gave useful suggestion to improve it.
The Director of AMR would like to introduce the App in the daily routine of traffic aides activities. AMR aims to leverage the App functionality to increase the number and the frequency of observations, so as to obtain a database that allows making the analysis of parking in ROV more specific and thorough than what is possible currently. Moreover, he expresses the importance to package the App with a control panel tool that can quickly and easily analyse collected data. Finally, he considers this package marketable and he is willing to test and promote it among other parking companies and municipalities.
ViaggiaRovereto
The results of data analysis concerning usability and trust in the app can be divided in four sub-sections: usage, ease of use, usefulness, compliance.
Usage. The use of ViaggiaRovereto has increased during the trial process. In ROV-EXP-1 with N= 40 (40 users involved in the experiment overall), the amount of active users in the three phases, where for "active user" is meant a user that had saved at least one trip in the referred phase, had been quite steady. Indeed, the active users were 26 in the first phase, and 28 in the second and third part. Users that had been continuously active for all the three phases were 20. In fact, some testers were active in only one or two phases. Analysing the post-experiment questionnaire, 58% of users affirmed that they had used ViaggiaRovereto every day, while 33% had utilized it at least one time per week.
Figure 28: Utilization frequency of ViaggiaRovereto during ROV-EXP-1 (Source: post-experiment questionnaire)
Concerning the amount of saved trips, in phase one and two it is quite steady, while it has increased significantly in the third phase, when the gamification process had been introduced.
58%
8%
25%
4% 4%
every day
2-‐3 times per week
1-‐2 times per week
1-‐2 time per month
never
no answer

FP7 - 608991 - STREETLIFE D6.2.1 – City pilots planning and evaluation results (initial)
WP6 – City Pilot Planning and Evaluation © STREETLIFE Consortium Page 62 of 102
Figure 29: amount of saved trips per week (Source: ViaggiaRovereto)
The length of saved trips has the same trend; if in phase 1 and 2 the total length is about 1000 km, in the last phase it reached a peak of more than 1500 km in week 4. Analysing the length of the individual journey, it moderately grew from phase 1 to phase 2, but it considerably cut down in the third phase, passing from 9 to less than 5.5 km. That trend can be interpreted as a hint that during the experimentation the confidence in the App increased, and users in the later weeks began to utilize ViaggiaRovereto even for shorter trips. Another element contributing to that trend could have been the launch of the game Green Game with ViaggiaRovereto in Week 4, which has likely incentivized its players to use the App more frequently and accept its sustainable mobility suggestions.
Figure 30: length travelled in km per week. (Source: ViaggiaRovereto)
113133
103
295
245
0
50
100
150
200
250
300
350
WEEK 1 WEEK 2 WEEK 3 WEEK 4 WEEK 5
PHASE 1 PHASE 2 PHASE 3
N°o
f TRIPS
985
1199
946
1537
1388
0
200
400
600
800
1000
1200
1400
1600
1800
WEEK 1 WEEK 2 WEEK 3 WEEK 4 WEEK 5
PHASE 1 PHASE 2 PHASE 3
TOTA
L LEN
GTH (km)

FP7 - 608991 - STREETLIFE D6.2.1 – City pilots planning and evaluation results (initial)
WP6 – City Pilot Planning and Evaluation © STREETLIFE Consortium Page 63 of 102
In ROV-EXP-2, when the App had been tested in an open field, in December 2014, a total of 223 new users installed the new version of the ViaggiaRovereto App from the Google Play store.
Focusing on the target users of the ROV-EXP-2, 17% of interviewed people had been guided to the P&R area of the Stadio Quercia parking lot through the ViaggiaRovereto App, while the remaining part of visitors to the Christmas markets reached the Stadio Quercia parking lot thanks to the promotional campaign built by Rovereto municipality. Since the average penetration of Android smartphones in Italy is 68% with respect to smartphones users, and 45.5% of the total Italian population, a percentage of 17% leads to an estimation of about 38% among the visitors that could be guided by the App who actually used ViaggiaRovereto to plan their Christmas market visit
Ease of use. In general, ViaggiaRovereto had very good results: 31% of testers of the first experiment strongly think that the App is easy to use and 52% agree with the statement that "Overall the app is easy to use" (Figure 21). The percentage of people that consider the app easy and very easy to use increased to 94% looking at the answers given by visitors in ROV-EXP-2. In particular, in the first experiment 70% of users thought that ViaggiaRovereto is intuitive to use and 83% thought that it easy to learn
Figure 31: Perceived ease of use. Chart reports testers' opinion about the following statement: Overall, the system was easy to use (Source: ROV-EXP-1 Post-experiment questionnaire)
Usefulness. Overall, the App was considered useful in both experiments: 89% of tourists perceived ViaggiaRovereto as a useful tool for their journey; Specifically, 63% considered the app very easy to use and 26% easy (Figure 22) Moreover, as reported by testers in ROV-EXP-1, the information provided was detailed enough for almost 50% of testers and
4%13%
52%
31%
I strongly disagree
I disagree
I neither agree nor disagree
I agree
I strongly agree

FP7 - 608991 - STREETLIFE D6.2.1 – City pilots planning and evaluation results (initial)
WP6 – City Pilot Planning and Evaluation © STREETLIFE Consortium Page 64 of 102
according to 41% the app helped them to move more economically. Moreover, for 59% of testers ViaggiaRovereto increased their awareness of sustainable mobility options.
Figure 32: Perceived usefulness. Chart reports testers' assessment where 1 correspond to useless, while 5 is equal to useful (Source: Experiment 2 questionnaire).
Compliance. In order to correctly comment this data, it has to be clarified that testers were not tracked during their journeys, for issues related to privacy. During the kick-off meeting, testers were clearly instructed that choosing the option "save itinerary" made available by the ViaggiaRovereto App, they would self-certify that they would follow the corresponding itinerary suggested by the App. Using this App feature was thus the method used to collect information about the users’ traveling habits and choices, in ROV-EXP-1. In the post-experiment questionnaire, 8% of users indicated their strong agreement with the statement " I predominately follow the recommend route" and another 33% indicated their agreement with the same affirmation (Figure 33). Overall, 41% of users declared to have followed the suggestions given by the App. Moreover, 65% of testers declared it was easy to follow the directions given by ViaggiaRovereto (Figure 31).
4%7%
26%
63%
very useless
useless
neutral
useful
very useful

FP7 - 608991 - STREETLIFE D6.2.1 – City pilots planning and evaluation results (initial)
WP6 – City Pilot Planning and Evaluation © STREETLIFE Consortium Page 65 of 102
Figure 33: Compliance. Chart reports testers' opinion about the following statement: I predominately follow the recommend route (Source: Post-ROV-EXP-1 questionnaire)
MODE TRANSPORT CHOICE
This section assesses user mobility behaviour and change thereof during ROV-EXP-1, using data from the log of ViaggiaRovereto related to chosen itineraries. Each trip is composed by one or more legs associated to a mode of transportation. In order to correctly evaluate the variation of mode choice, the length of each leg has also been taken into consideration.
The data shown in Figure 34, Figure 35, Figure 36, and Figure 37 make evident that car trips considerably cut down, in terms of travelled km by car (if not number of legs), decreasing from about 500 to less than 250 km.
This reduction leads to the increment of other more sustainable modes of transport; in particular, bike-sharing trips increase from 2 to 7% of total length travelled. The amount of km walked increased from 5 to 12% as well.
N° of LEGS
PHAS
E
WEEK
TRIPS
LEGS
CAR
BUS
TRAIN
BIKE
SHAR
ING
BIKE
WAL
K
PHASE 1 WEEK 1 113 162 40 38 11 12 3 58
21%
38%
33%
8%I strongly disagree
I disagree
I neither agree nor disagree
I agree
I strongly agree

FP7 - 608991 - STREETLIFE D6.2.1 – City pilots planning and evaluation results (initial)
WP6 – City Pilot Planning and Evaluation © STREETLIFE Consortium Page 66 of 102
PHASE 2 WEEK 2 133 210 40 45 16 32 5 72 WEEK 3 103 177 24 34 21 20 7 71
PHASE 3 WEEK 4 295 422 59 75 24 66 37 161 WEEK 5 245 343 34 66 25 49 43 126
Figure 34: Number of legs for each mode of transport during ROV-EXP-1
Figure 35: Percentage of legs for each mode of transport during ROV-EXP-1
N° of KM
PHAS
E
WEEK
TRIPS
KM
CAR
BUS
TRAIN
BIKE
SHAR
ING
BIKE
WAL
K
PHASE 1 WEEK 1 113 985 486 188 234 25 5 47
PHASE 2 WEEK 2 133 1199 551 154 313 65 21 95 WEEK 3 103 946 168 116 492 61 39 70
PHASE 3 WEEK 4 295 1537 393 253 519 105 73 195 WEEK 5 245 1388 220 273 538 97 100 160
Figure 36: Length travelled for each mode of transport during ROV-EXP-1
10%
14%
14%
19%
25%
19%
18%
19%
21%
23%
7%
6%
12%
8%
7%
14%
16%
11%
15%
7%
13%
9%
4%
2%
2%
37%
38%
40%
34%
36%
WEEK 5
WEEK 4
WEEK 3
WEEK 2
WEEK 1
CAR BUS TRAIN BIKE SHARING BIKE WALK

FP7 - 608991 - STREETLIFE D6.2.1 – City pilots planning and evaluation results (initial)
WP6 – City Pilot Planning and Evaluation © STREETLIFE Consortium Page 67 of 102
Figure 37: Percentage of length travelled for each mode of transport during ROV-EXP-1
The following charts show detailed analysis for each mode of transport.
Car: The trend in car usage decreases during the experiment. This is true both for the percentage of legs in respect to the total number of legs, and for the percentage of kilometres travelled.
Figure 38: Number of legs travelled by car in each week and its percentage in relation to the total amount of legs.
16%
26%
18%
46%
49%
20%
16%
12%
13%
19%
39%
34%
52%
26%
24%
7%
7%
6%
5%
2%
7%
5%
4%
2%
1%
12%
13%
7%
8%
5%
WEEK 5
WEEK 4
WEEK 3
WEEK 2
WEEK 1
CAR BUS TRAIN BIKE SHARING BIKE WALK
40 40
24
59
34
25%
19%
14% 14%10%
0%
10%
20%
30%
40%
50%
60%
0
10
20
30
40
50
60
70
WEEK 1 WEEK 2 WEEK 3 WEEK 4 WEEK 5
PHASE 1 PHASE 2 PHASE 3
N°o
f LEG
S
%°o
f LEG
S

FP7 - 608991 - STREETLIFE D6.2.1 – City pilots planning and evaluation results (initial)
WP6 – City Pilot Planning and Evaluation © STREETLIFE Consortium Page 68 of 102
Figure 39: Length travelled by car in each week and its percentage in relation to the total amount of km.
Bus The utilization of bus grows as total number of legs and kilometres travelled, but the percentage remains stationary during the experiment.
Figure 40: Number of legs travelled by bus in each week and its percentage in relation to the total amount of legs.
486
551
168
393
220
49%46%
18%
26%
16%
0%
10%
20%
30%
40%
50%
60%
0
100
200
300
400
500
600
WEEK 1 WEEK 2 WEEK 3 WEEK 4 WEEK 5
PHASE 1 PHASE 2 PHASE 3
LENGT
H (km)
%°o
f LEN
GTH
38
45
34
75
66
23% 21%19% 18% 19%
0%
10%
20%
30%
40%
50%
60%
0
10
20
30
40
50
60
70
80
WEEK 1 WEEK 2 WEEK 3 WEEK 4 WEEK 5
PHASE 1 PHASE 2 PHASE 3
N°o
f LEG
S
%°o
f LEG
S

FP7 - 608991 - STREETLIFE D6.2.1 – City pilots planning and evaluation results (initial)
WP6 – City Pilot Planning and Evaluation © STREETLIFE Consortium Page 69 of 102
Figure 41: Length travelled by bus in each week and its percentage in relation to the total amount of km
Train Similarly to the utilization of bus, train usage grows as total number of legs and kilometres travelled; the percentage of legs is stationary during the three phases, indeed the percentage of kilometres travelled constantly grows up.
Figure 42: Number of legs travelled by train in each week and its percentage in relation to the total amount of legs.
188
154
116
253273
19%
13% 12%16%
20%
0%
10%
20%
30%
40%
50%
60%
0
50
100
150
200
250
300
WEEK 1 WEEK 2 WEEK 3 WEEK 4 WEEK 5
PHASE 1 PHASE 2 PHASE 3
LENGT
H (km)
%°o
f LEN
GTH
11
16
21
24 25
7% 8%12%
6% 7%0%
10%
20%
30%
40%
50%
60%
0
5
10
15
20
25
30
WEEK 1 WEEK 2 WEEK 3 WEEK 4 WEEK 5
PHASE 1 PHASE 2 PHASE 3
N°o
f LEG
S
%°o
f LEG
S

FP7 - 608991 - STREETLIFE D6.2.1 – City pilots planning and evaluation results (initial)
WP6 – City Pilot Planning and Evaluation © STREETLIFE Consortium Page 70 of 102
Figure 43: Length travelled by train in each week and its percentage in relation to the total amount of km.
Bike sharing The results obtained with bike sharing are positive, since the percentage of legs doubles from week 1 to week 5, and there is a significant increase also in the percentage of kilometres travelled.
Figure 44: Number of legs travelled by bike sharing in each week and its percentage in relation to the total amount of legs.
234
313
492519 538
24%26%
52%
34%39%
0%
10%
20%
30%
40%
50%
60%
0
100
200
300
400
500
600
WEEK 1 WEEK 2 WEEK 3 WEEK 4 WEEK 5
PHASE 1 PHASE 2 PHASE 3
LENGT
H (km)
%°o
f LEN
GTH
12
32
20
66
49
7%
15%11%
16% 14%
0%
10%
20%
30%
40%
50%
60%
0
10
20
30
40
50
60
70
WEEK 1 WEEK 2 WEEK 3 WEEK 4 WEEK 5
PHASE 1 PHASE 2 PHASE 3
N°o
f LEG
S
%°o
f LEG
S

FP7 - 608991 - STREETLIFE D6.2.1 – City pilots planning and evaluation results (initial)
WP6 – City Pilot Planning and Evaluation © STREETLIFE Consortium Page 71 of 102
Figure 45: Length travelled by bike sharing in each week and its percentage in relation to the total amount of km.
Bike Similarly to the findings related to bike sharing usage, the growth curves for bike usage are positive in both the categories analysed.
Figure 46: Number of legs travelled by bike in each week and its percentage in relation to the total amount of legs.
25
65 61
10597
2% 5% 6% 7% 7%0%
10%
20%
30%
40%
50%
60%
0
20
40
60
80
100
120
WEEK 1 WEEK 2 WEEK 3 WEEK 4 WEEK 5
PHASE 1 PHASE 2 PHASE 3
LENGT
H (km)
%°o
f LEN
GTH
35
7
37
43
2% 2% 4% 9%13%
0%
10%
20%
30%
40%
50%
60%
0
5
10
15
20
25
30
35
40
45
50
WEEK 1 WEEK 2 WEEK 3 WEEK 4 WEEK 5
PHASE 1 PHASE 2 PHASE 3
N°o
f LEG
S
%°o
f LEG
S

FP7 - 608991 - STREETLIFE D6.2.1 – City pilots planning and evaluation results (initial)
WP6 – City Pilot Planning and Evaluation © STREETLIFE Consortium Page 72 of 102
Figure 47: Length travelled by bike in each week and its percentage in relation to the total amount of km.
Walk Between phase 2 and phase 3 the number of legs and the amount of kilometres walked double. This tendency is shown also in the percentage of kilometres walked, but not in the percentage of legs that remains stationary.
Figure 48: Number of legs travelled walking in each week and its percentage in relation to the total amount of legs.
5
21
39
73
100
1%2% 4%
5%7%
0%
10%
20%
30%
40%
50%
60%
0
20
40
60
80
100
120
WEEK 1 WEEK 2 WEEK 3 WEEK 4 WEEK 5
PHASE 1 PHASE 2 PHASE 3
LENGT
H (km)
%°o
f LEN
GTH
5872 71
161
126
36% 34%40%
38% 37%
0%
10%
20%
30%
40%
50%
60%
0
20
40
60
80
100
120
140
160
180
WEEK 1 WEEK 2 WEEK 3 WEEK 4 WEEK 5
PHASE 1 PHASE 2 PHASE 3
N°o
f LEG
S
%°o
f LEG
S

FP7 - 608991 - STREETLIFE D6.2.1 – City pilots planning and evaluation results (initial)
WP6 – City Pilot Planning and Evaluation © STREETLIFE Consortium Page 73 of 102
Figure 49: Length travelled walking in each week and its percentage in relation to the total amount of km.
MOBILITY BEHAVIOUR CHANGE
Park&Ride
Since the second week of ROV-EXP-1, users were given the routing suggestion to park in P&R facilities, in order to travel the last part of their journey – especially towards the city centre - by a sustainable mode of transportation. As mentioned in Section 3.2.2, the P&R areas chosen for the experiment were the ex-Manifattura and Stadio Quercia parking lots.
As showed in Table 1, trips having a real “ride” leg are only 9 in the whole experiment. This figure reduced to 7 considering only P&R facilities identified for this experiment. This result is minimal and below expectations. One possible explanation is that the ex-Manifattura and Stadio Quercia parking lots do not have some key characteristics to be effective P&R facilities for the city of ROV. Even if these two selected areas have a bike sharing station and a bus stop, the bus service, especially in Stadio Quercia parking lot, is currently not frequent enough for a real P&R facility. This possible explanation is supported by the results on the opinion and inclination of ROV-EXP-1 participants to keep using P&R solutions, which are reported further below (see Figure 51).
However, an important facet of this result is that 6 out of 7 of the P&R trips were carried out during the third phase of ROV-EXP-1, while none was taken during the first phase; this result suggests a potential of ViaggiaRovereto, together with gamification, to direct users to the P&R facilities. This preliminary result will need to be confirmed and, if confirmed, potentiated with the help of the city Mobility Management.
Another important outcome of ROV-EXP-1 related to parking habits concerns the use of long-stay parking areas outside the city centre. Table 11 shows that the use of these facilities increased considerably during the experiment passing from 9 (1st week) to a peak of 27 (4th week). It has to be stressed that testers could have easily chosen instead on-street parking
47
95
70
195
160
5% 8% 7%
13% 12%
0%
10%
20%
30%
40%
50%
60%
0
50
100
150
200
250
WEEK 1 WEEK 2 WEEK 3 WEEK 4 WEEK 5
PHASE 1 PHASE 2 PHASE 3
LENGT
H (km)
%°o
f LEN
GTH

FP7 - 608991 - STREETLIFE D6.2.1 – City pilots planning and evaluation results (initial)
WP6 – City Pilot Planning and Evaluation © STREETLIFE Consortium Page 74 of 102
because they had already paid the annual fee required by the municipality. This result thus suggests that the experiment succeeded to reduce the pressure of on-street parking areas, and divert car drivers to long-stay parking lots outside city centre, in accord with the policies laid out in the Urban Mobility Plan and Urban Parking Plan of Rovereto municipality.
Table 11: Use of parking areas during ROV-EXP-1.
PHAS
E
WEEK SAVED TRIPS
INCLUDING LONG STAY PARKING
AREAS
SAVED TRIPS INCLUDING P&R SOLUTIONS
SAVED TRIPS INCLUDING LONG STAY PARKING
AREAS IN MANIFATTURA OR STADIO QUERCIA
SAVED TRIPS INCLUDING P&R SOLUTIONS IN MANIFATTURA OR STADIO QUERCIA
PHASE 1 WEEK 1 9 0 0 0
PHASE 2 WEEK 2 12 0 1 0 WEEK 3 9 1 2 1
PHASE 3 WEEK 4 27 5 14 4 WEEK 5 18 3 4 2
Figure 50 shows the total occupancy rate detected by traffic aides in the two P&R parking lots, which increased considerably both in Stadio Quercia and ex-Manifattura; data refer to the morning peak hour (from 10.00 till 12.00), which is the default period usually considered to evaluate occupancy rate in parking areas in ROV.
Figure 50: Occupancy rate of P&R area in the 3 phases of EXP1. Occupancy rate is the average occupancy during the peak hour (from 10.00 till 12.00).
72%
63%
90%
22%
32%
45%
0%
10%
20%
30%
40%
50%
60%
70%
80%
90%
100%
PHASE 1 PHASE 2 PHASE 3
EX-‐MANIFATTURA
STADIO QUERCIA

FP7 - 608991 - STREETLIFE D6.2.1 – City pilots planning and evaluation results (initial)
WP6 – City Pilot Planning and Evaluation © STREETLIFE Consortium Page 75 of 102
Figure 51: Inclination to use P&R (source: ROV-EXP-1 questionnaires)
The inclination of commuters to use P&R facilities was tested also through the questionnaire. Experiment 1 participants were asked if they would be willing to park outside the city centre and reach their destination by bus or bike. The overall inclination to use P&R remains steady in the ex-ante and ex-post answers, but the ex-post answers show greater awareness of the need of proper infrastructure for effective P&R: ex-ante 42% was absolutely willing to use P&R, after the experiment this percentage is reduced to 25%, while the percentage of user demanding for a potentiated bus and bike sharing service at P&R locations.
During the ROV-EXP-2, which involved only the Stadio Quercia parking lot, the average occupancy rate in the whole day was very high (over 50% with peaks of 72%) during the first two days, while it decreased noticeably in the other days. This result (displayed in Figure 52) must be related to the visitors’ flow registered in Rovereto during the same Christmas markets days, represented in figure 26 (displayed in Figure 53). Notice how the trend is very similar except for the last day (December, 27th), when even though the influx of visitors in the city was high, the occupancy rate of Stadio Quercia remained low, analogous to the levels of previous days.
42%
25%
8%
29%
25%
17% 4%
8%
4% 8%
17%
13%
0% 10% 20% 30% 40% 50% 60% 70% 80% 90% 100%
BASELINE
POST-‐EXPERIMENT
Yes, absolutely
Yes, if the park area is provided with bike sharing
Yes, if the area is provided with a bike sharing station and there is a bus every 15 min.
Yes, if there is a bus every 15 min
No, because the parking fee is not very high
No, I have a free parking space in my company
Other

FP7 - 608991 - STREETLIFE D6.2.1 – City pilots planning and evaluation results (initial)
WP6 – City Pilot Planning and Evaluation © STREETLIFE Consortium Page 76 of 102
Figure 52: Occupancy rate in Stadio Quercia during ROV-EXP-2 (source: Conta Parcheggi App).
Figure 53: Number of visitors registered in accommodations in Rovereto (source: Tourist Office)
The utilization of shuttle bus service, specifically implemented for the Christmas markets thanks to the STREETLIFE project is shown in Table 12. The total amount of shuttle bus users (calculated as described in Section 3.2.3) in the eight days considered were more than 550. Most of them were counted in the first day, when the shuttle bus was used by more than 300 people. This outcome highlights the efficiency of this service especially in relation to the tourist peak flow, when reaching the city centre by car is most difficult.
Table 12: Estimation of shuttle-bus service users (Source: ROV-EXP-2 questionnaire).
DATE SHUTTLE-‐BUS USERS
06/12/2014 305 13/12/2014 64 20/12/2014 55
72
56
3328 29
2215 15
0
10
20
30
40
50
60
70
8006/12/2014
07/12/2014
08/12/2014
09/12/2014
10/12/2014
11/12/2014
12/12/2014
13/12/2014
14/12/2014
15/12/2014
16/12/2014
17/12/2014
18/12/2014
19/12/2014
20/12/2014
21/12/2014
22/12/2014
23/12/2014
24/12/2014
25/12/2014
26/12/2014
27/12/2014
1052
764
481
259312
215 253
1062
0
200
400
600
800
1000
1200
06/12/2014
07/12/2014
08/12/2014
09/12/2014
10/12/2014
11/12/2014
12/12/2014
13/12/2014
14/12/2014
15/12/2014
16/12/2014
17/12/2014
18/12/2014
19/12/2014
20/12/2014
21/12/2014
22/12/2014
23/12/2014
24/12/2014
25/12/2014
26/12/2014
27/12/2014

FP7 - 608991 - STREETLIFE D6.2.1 – City pilots planning and evaluation results (initial)
WP6 – City Pilot Planning and Evaluation © STREETLIFE Consortium Page 77 of 102
21/12/2014 58 22/12/2014 18 23/12/2014 6 24/12/2014 28 27/12/2014 21
Moreover, 71 people walked from Stadio Quercia parking slot to the city centre, while none used the bike sharing service, probably because the registration procedure needed to access to the bike sharing service in Rovereto is not friendly for visitors or occasional users, and is instead oriented to servicing residents and regular users. In fact, this registration procedure takes some days.
According to questionnaires (as shown in Table 13), the willingness among Christmas markets visitors to use P&R facilities is quite high; 85% would again park in the P&R area if a shuttle bus service were regularly provided, while 62% considers sufficient even just a bike sharing station to utilize a P&R parking lot.
AVAILABILITY TO USE P&R YES NO
If the parking lot is provided with a shuttle-‐bus service 162 29
If the parking lot is provided with bike sharing station 117 72
Table 13: Availability to use P&R expressed by tourists (Source: ROV-EXP-2 questionnaire) Bike sharing
Participants in ROV-EXP-1 represented a significant percentage of the total users of the ROV bike sharing service. During the five weeks of the experiment, approximately 15% of the bikes retrieved in Rovereto were utilized by STREETLIFE users.
As shown already in Figure 44 and Figure 45, the use of bike sharing grew remarkably during the course of ROV-EXP-1. Data show an increase in between a phase and the following one. That outcome confirms the increase of bike sharing usage reported in the questionnaire. As reported in Figure 54, at the beginning of the experiment nearly none among testers was using the bike sharing service in their trip, at the end 68% had used it at least 1 time per week.
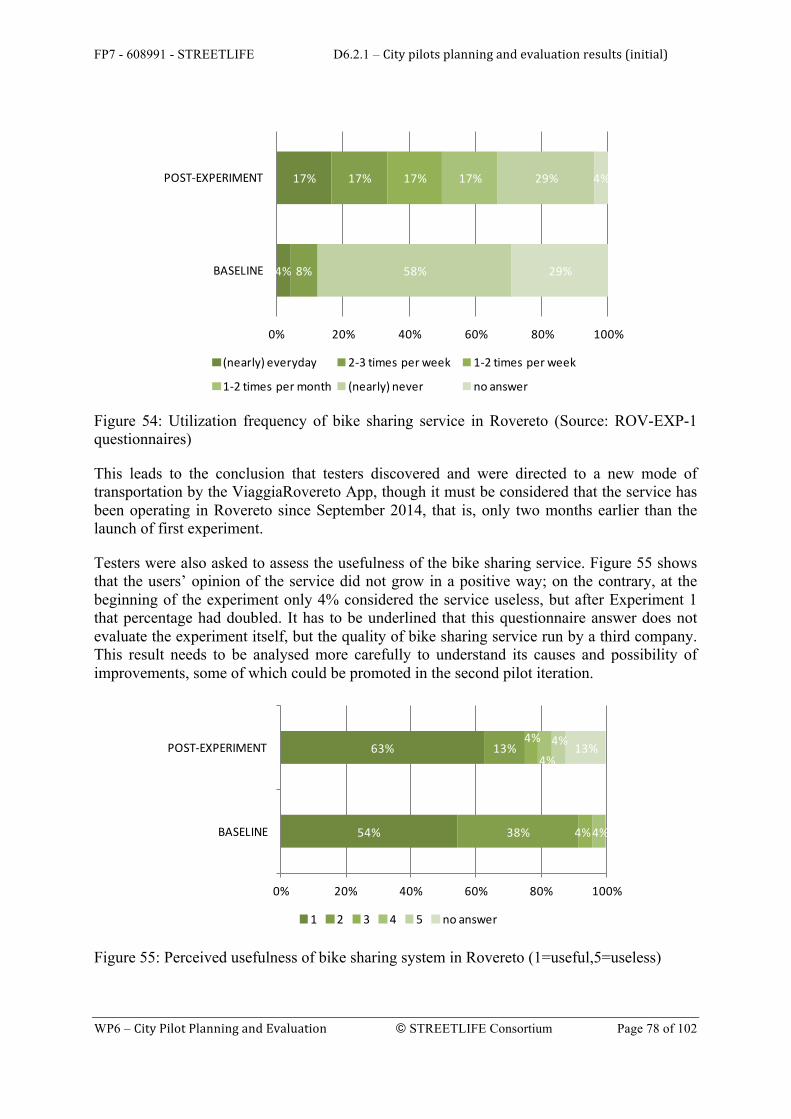
FP7 - 608991 - STREETLIFE D6.2.1 – City pilots planning and evaluation results (initial)
WP6 – City Pilot Planning and Evaluation © STREETLIFE Consortium Page 78 of 102
Figure 54: Utilization frequency of bike sharing service in Rovereto (Source: ROV-EXP-1 questionnaires)
This leads to the conclusion that testers discovered and were directed to a new mode of transportation by the ViaggiaRovereto App, though it must be considered that the service has been operating in Rovereto since September 2014, that is, only two months earlier than the launch of first experiment.
Testers were also asked to assess the usefulness of the bike sharing service. Figure 55 shows that the users’ opinion of the service did not grow in a positive way; on the contrary, at the beginning of the experiment only 4% considered the service useless, but after Experiment 1 that percentage had doubled. It has to be underlined that this questionnaire answer does not evaluate the experiment itself, but the quality of bike sharing service run by a third company. This result needs to be analysed more carefully to understand its causes and possibility of improvements, some of which could be promoted in the second pilot iteration.
Figure 55: Perceived usefulness of bike sharing system in Rovereto (1=useful,5=useless)
4%
17%
8%
17% 17% 17%
58%
29%
29%
4%
0% 20% 40% 60% 80% 100%
BASELINE
POST-‐EXPERIMENT
(nearly) everyday 2-‐3 times per week 1-‐2 times per week
1-‐2 times per month (nearly) never no answer
54%
63%
38%
13%
4%
4%
4%
4%4% 13%
0% 20% 40% 60% 80% 100%
BASELINE
POST-‐EXPERIMENT
1 2 3 4 5 no answer

FP7 - 608991 - STREETLIFE D6.2.1 – City pilots planning and evaluation results (initial)
WP6 – City Pilot Planning and Evaluation © STREETLIFE Consortium Page 79 of 102
Gamification effects on users’ mobility behaviour
The final design we have conceived for ROV-EXP-1, with its three phases, made possible to investigate whether the use of gamification with the introduction of Green Game with ViaggiaRovereto is conducive to modifying the habits of STREETLIFE users.
For that reason, we have added two gamification-specific hypotheses to our evaluation, to be explored by using the ViaggiaRovereto App data logged about the trips chosen by those users who decided to become players in the game. The hypotheses, which we had briefly introduced in Section 4.2.2, are the following:
• HY-GE1 Gamification increased App usage: this hypothesis addresses whether the introduction of a gamification element can incentivize the end users of STREETLIFE mobility solutions, in this case presented through the ViaggiaRovereto App, to use them more often.
• HY-GE2 Gamification changed user choices on the type of trips: this hypothesis addresses whether the introduction of a gamification element can incentivize the end users to choose those itineraries that are suggested by STREETLIFE as environmentally sustainable options.
INCREASED USAGE OF APP DURING THE GAME
Figure 56: Boxplot - distribution of saved trips per user during ROV-EXP-1.
To investigate HY-GE1, we compared the distribution of the number of trips per user that were selected saved by participants of ROV-EXP-1 on the ViaggiaRovereto App in each of

FP7 - 608991 - STREETLIFE D6.2.1 – City pilots planning and evaluation results (initial)
WP6 – City Pilot Planning and Evaluation © STREETLIFE Consortium Page 80 of 102
the five weeks of the experiment4. This type of data provides an indication of how often the App users consult the App and the STREETLIFE system for their mobility planning needs.
The boxplot chart in Figure 56 shows visually that the characteristics of this distribution have changed significantly in the last two weeks of Phase 3 of ROV-EXP-1, in which Green Game with ViaggiaRovereto was active, whereas they are rather similar when comparing the baseline week (Phase 1), with the two weeks of Phase 2 in which the game was not active.
To understand the statistical significance of this change, and since the distributions could not be considered normal, we have carried out a non-parametric Mann-Withney test of the difference of the distributions observed in the 5 weeks. The results are summarized in Table 14 below. In each cell, we tested whether the usage of the ViaggiaRovereto App in the week represented in the row is less frequent than the usage in the week represented in the column5.
Table 14: Difference in distribution of trips per user (W-score) with statistical significance (p-value).
Mann-Withney
test results
(Phase 1) (Phase 2) (Phase 3)
baseline NoGameW1 NoGameW2 GameW1 GameW2
(Phase 1) baseline n/a W = 275.5
p = 0.1748∗
W = 295.5
p = 0.1748∗
W = 72
p < 0.001
W = 171
p< 0.01
(Phase 2)
NoGameW1 n/a W = 331.5
p = 0.6489∗
W = 84
p< 0.001
W = 194
p < 0.05
NoGameW2 n/a W = 76
p< 0.001
W = 177.5
p < 0.05
(Phase 3) GameW1 n/a
∗W = 286
p = 0.0898
GameW2 n/a
From the table, we can see there is not a statistically significant difference between the users’ behaviour in the first three weeks with respect to frequency of usage of the ViaggiaRovereto App, as shown by the very high p-values of the Matt-Withney tests in the deep red cells of the
4 The statistical analysis of both the gamification hypotheses was carried out using the Open Source R statistical
software. See: R Core Team (2014). R: A language and environment for statistical computing. R Foundation for Statistical Computing, Vienna, Austria. http://www.R-project.org/
5 With the exception of Game Week 1 vs. Game Week 2 (whose cell is marked with *) where we tested whether the two distributions are different at all.

FP7 - 608991 - STREETLIFE D6.2.1 – City pilots planning and evaluation results (initial)
WP6 – City Pilot Planning and Evaluation © STREETLIFE Consortium Page 81 of 102
table. Instead, there is a very statistically significant difference– although not extreme in magnitude - between those three weeks and the first week of the game, with the p-value less than 0.001 in all cases. The difference in usage frequency is also quite significant between the baseline week and the second game week (p-value < 0.01). All of these results, contained in the bright green cells of the table, are consistent with the hypothesis that GreenGame with ViaggiaRovereto may have incentivized its players to make use of the ViaggiaRovereto App when planning their trips.
It is also interesting that the differences between the two weeks of Phase 2 (no game) vs. the second game week are only slightly significant (p-value < 0.05). When we compare those results (contained in the light green cells of Table 14) with the much more robust effect observed for the first game week (the bright green cells), that may be interpreted as a hint that the kind of gamification incentives that we designed into Green Game with ViaggiaRovereto were not self-sustained, and their efficacy might have had a tendency to taper off over the time of the game.
To further explore that, we have also tested whether the distribution of the App usage is statistically any different between the two game weeks. The difference is not statistically significant (p-value is about 0.9 – see the light red cell of Table 14), but starts to approach a slight significance if we ask the question whether the usage of the App in the first game week is greater than in the second game week (W-score=286, p-value=0.0449, only slightly below 0.05). We take this as a further hint that the game in the second week was not as effective as in the first week in incentivizing players to make of the ViaggiaRovereto App; we will therefore consider the concern of incentive efficacy over time in the design of new gamification solutions for mobility in the rest of the project.
CHANGE IN ITINERARY CHOICES DURING THE GAME
To investigate HY-GE2, we compared the distributions of the number of selected trips per user, which were suggested by the ViaggiaRovereto App as sustainable itinerary options.
This recommendation feature – which is displayed in Figure 2 - was turned on at the beginning of Phase 2 of ROV-EXP-1 (after the baseline week). During Phase 3 of the experiment, by choosing the recommended itineraries the game players had a better chance to earn game incentives (accumulate points and badges); therefore, by examining the difference in the distribution of the count of such choices, between Phase 2 and Phase 3, we check whether the game could be considered a factor that increased the choice of itineraries with sustainable mobility characteristics.
The boxplot chart in Figure 57 shows visually the characteristics of the distribution in Phase 2 vs. Phase 3 of ROV-EXP-1, which suggests that an increase indeed took place. In order to understand whether such increase is statistically significant, and since the distributions could not be considered normal, also in this case we have carried out a non-parametric Mann-Withney test of the difference of the two distributions. We tested whether the number of sustainable itineraries chosen by users in Phase 2 (game not active) was smaller than the name of sustainable itineraries chosen in Phase 3 (game active).

FP7 - 608991 - STREETLIFE D6.2.1 – City pilots planning and evaluation results (initial)
WP6 – City Pilot Planning and Evaluation © STREETLIFE Consortium Page 82 of 102
Figure 57: Boxplot - distribution of selected recommended sustainable trips per user in ROV-EXP-1 (Phase 2 vs. Phase 3). The results of this test, which are reported below,
W = 144.5, p-value < 0.01
indicate that there is indeed a difference, and that it is quite significant statistically (p-value < 0.01). We can conclude that the results of this test are consistent with the hypothesis that GreenGame with ViaggiaRovereto may have incentivized its players to pick sustainable itineraries for their mobility needs, as recommended by the STREETLIFE system.
This result is also reinforced by other observations that have been already reported in this same section, in particular observations about the number of km. and legs travelled by the participants to ROV-EXP-1 in the various available transport mode. Those observations also often point at an increase of km. or legs travelled with sustainable transportation options during the weeks in which the game was active.
4.3.5. Evaluation summary
The main findings originated from the evaluation of the data collected from the ROV pilot, which we have discussed in detail in this Section, are recapped below.
• The technical solution provided by ContaParcheggi App for crowdsourced input on parking occupancy is a useful instrument that helped traffic aides performing their job in a

FP7 - 608991 - STREETLIFE D6.2.1 – City pilots planning and evaluation results (initial)
WP6 – City Pilot Planning and Evaluation © STREETLIFE Consortium Page 83 of 102
simple and fast way. With some additional functionality, this tool could become a commercial solution.
• The routing app ViaggiaRovereto has been widely used and accepted from end users, and it helped enhancing their level of awareness with respect to sustainable mobility alternatives in ROV, and the environmental impact of users’ mobility choices. A higher level of information is a prerequisite to a change in mobility choices.
• The impact on mode transport choice was successful: the number and the distance of trips taken by car decreased during the course of the pilot, while bike and walking became more and more frequent
• Park & Ride results were below expectations, since most of the trips did not include a “ride” part after parking. There are not enough elements in the data collected, which can help establishing the detailed reasons for the lack of usage of public transportation and bike sharing from the designated Park & Ride parking lots. We will need to further investigate what may be the reasons, with the current hypothesis being that they may have to do with the urban configuration of Rovereto
• Thanks to the STREETLIFE pilot in Rovereto, bike sharing services have become more common and known to citizens
• The implementation of gamification had a successful impact. It led to statistically significant changes with respect to increasing the use of the STRETLIFE system (through the ViaggiaRovereto App), as well as to accepting its suggestions, therefore impacting favourably the environmental the choice of environmentally sustainable mobility solutions.
• The success of these technical solutions, coupled with a very considerable engagement effort led to a high level of participation to the pilot. Participation was very high also in the open field experiment of ROV-EXP=2, even though a more efficient method to collect questionnaire and survey data for the pilot needs to be implemented in the second iteration, to more accurately record user feedback and responses.
• The method adopted for pilot planning, organization execution and evaluation was largely successful. An important future step is to make sure the pilot can sustain interest and engagement for longer periods. Another challenge will be the integration of local enterprises as subjects in the pilot for the second iteration.
4.4. Evaluation results at TRE
4.4.1. Goals of evaluation
Goals of the evaluation can be grouped in follow themes. More detailed Tampere pilot evaluation research questions are describes in D8.1.1 Evaluation plan section 5.
1. Technical evaluation of the solutions deployed in Tampere
• Evaluate reliability of the service architecture

FP7 - 608991 - STREETLIFE D6.2.1 – City pilots planning and evaluation results (initial)
WP6 – City Pilot Planning and Evaluation © STREETLIFE Consortium Page 84 of 102
• Evaluate performance of the service architecture and integrations
• Evaluate ease of maintenance required by the service
• Evaluate the concept of real time data integration and Park & Ride
2. Evaluation of Tampere city-specific objectives supported by the technology solutions above
• Evaluation of user acceptance and willingness to use the solution frequently and change their mobility behaviour.
• Find out if STREETLIFE will provide a promising service development path for the city, providing enhanced information services (multimodal real time routing, park & ride) and hence making public transport more attractive compared to private cars
• Cost efficiency by integrating on existing data sources and IT systems, especially for future exploitation.
4.4.2. Questions addressed
The questions addressed can be grouped into three major themes:
• What is the general user opinion about the new service: are we on the right track?
o RQ-TRE-7 What is the level of satisfaction from the STREETLIFE users?
o RQ-TRE-8 What is the level of acceptance from the STREETLIFE users?
o RQ-TRE-4 How do situational variables (i.e. weather, day time etc.) have an effect regarding the mode change?
• Where to focus next on development in the 2nd iteration?
o RQ-TRE-1 Is there a significant change in the mode choice?
o RQ-TRE-2 Why do people change their mobility behaviour?
o RQ-TRE-3 Which type of commuters is most willing to change their mobility habits?
• Do we need to adjust the current system architecture and integrations?
o RQ-TRE-11 Will STREETLIFE integration to existing IT platforms lead to increased possibilities for further exploitation?
Based on this, the following hypotheses have been addressed in the view of 1st pilot iteration and work continues in the 2nd iteration:
• HY-501 The users will use the STREETLIFE system

FP7 - 608991 - STREETLIFE D6.2.1 – City pilots planning and evaluation results (initial)
WP6 – City Pilot Planning and Evaluation © STREETLIFE Consortium Page 85 of 102
• HY-502 The user will find the STREETLIFE system easy to use
• HY – TRE7 Users can understand a presented route in more comprehensive manner than with traditional interfaces
• HY – TRE6 Users find bus stops and identify buses easier and more accurately than from traditional interfaces
• HY – TRE1 Private car users will find Park & Ride useful
• HY – TRE4 STREETLIFE will stay in production after project has ended City management takes the pilot/parts of pilot into use
4.4.3. Data collected
The Tampere pilot collected data information from pre/post questionnaires, user feedback and usage statistics of the STREETLIFE Tampere pilot. Pre- and post-questionnaires used are shown in appendices. Data collection was done anonymously and planned privacy policies were used in data collection and handling. In addition, an interview with Tampere traffic planning department was held.
Table 15: types of evaluation data collected for the TRE pilot.
Data source Type of data Origin of data Detailed description of data
Usage statistics Usage of the app STREETLIFE App usage statistics
Data collected from web server logs and Google analytics
Performance statistics
Performance of the back-end system and integrations
Back-end system
Performance of the back-end system and integrations statistics, response times
Questionnaire (Focus test group and Public)
Closed-ended questions Pre- and post-experiment questionnaires
Comparison between pre and post questionnaires
User feedback about the app.
56 pre-questionnaires and 14 post-experiment questionnaires filled in
Users' feedback about STREETLIFE Pilot
Quality feedback Feedback form in the App.
Feedback sent by users in order to point out bugs, mistakes and possible improvement.

FP7 - 608991 - STREETLIFE D6.2.1 – City pilots planning and evaluation results (initial)
WP6 – City Pilot Planning and Evaluation © STREETLIFE Consortium Page 86 of 102
Interview Open questions Interview with Traffic planning department
(operations and management)
Interview of Tampere Traffic planning about their view on STREETLIFE pilot
N= 4 persons
4.4.4. Findings
Detailed findings information and charts
We present hereby early evaluation results - by means of charts – based on the analysis of the answers to the pre- and post-experiment questionnaires administered to either the focus test group (TRE-EXP-1) or to the general public who chose to participate in the public pilot (TRE-EXP-2). Whenever charts include post-study results – in case the the question and answer options were the same in the pre-study and post-study questionnaires - those are marked with Post.
TRE-EXP-1: Focus test group
• Pre-questionnaire survey results (N=16) , 13.11.2014
• Post-questionnaire results: integrated with public pilot’s post questionnaire.
TRE-EXP-2: Public pilot
• Pre-questionnaire survey results (N=56), 13.11.2014
• Post-questionnaire survey results (N=14), 24.2.2015
0 %
10 %
20 %
30 %
40 %
50 %
60 %
70 %
80 %
Walk Cycling Bus Car Train
What kind of transport mode you usually use for your trips?
FTG
Public

FP7 - 608991 - STREETLIFE D6.2.1 – City pilots planning and evaluation results (initial)
WP6 – City Pilot Planning and Evaluation © STREETLIFE Consortium Page 87 of 102
Figure 58: What kind of transport mode you usually use for your trips?
Figure 59: How long is your usual trip?
Figure 60: How often did you use trip planner navigation?
0 %
10 %
20 %
30 %
40 %
50 %
60 %
0-‐2km 2-‐5km 5-‐7km 7-‐10km 10-‐13km >13km
How long is your usual trip (in km)?
FTG
Public
Post
0 %
5 %
10 %
15 %
20 %
25 %
30 %
35 %
40 %
>daily daily 2-‐4 week once a week never
How o=en did you use trip planner, naviga@on, internet or mobile service for
planning in general?
FTG
Public

FP7 - 608991 - STREETLIFE D6.2.1 – City pilots planning and evaluation results (initial)
WP6 – City Pilot Planning and Evaluation © STREETLIFE Consortium Page 88 of 102
Figure 61: Which devices did you use to plan your trip?
Figure 62: Trip Planning importance
NOTE: In the post-study questionnaire the question in Figure 62 was phrased differently, i.e., “How frequently you would use this kind of system?”; see figure 64.
0 %
10 %
20 %
30 %
40 %
50 %
60 %
70 %
80 %
smartphone mobile
smartphone home
PC home tablet home tablet mobile other
Which of the following devices did you use mostly to plan your trip?
FTG
Public
Post
0 %
10 %
20 %
30 %
40 %
50 %
60 %
70 %
80 %
really important important partly unimportant really unimportant
Trip planning importance
FTG
Public

FP7 - 608991 - STREETLIFE D6.2.1 – City pilots planning and evaluation results (initial)
WP6 – City Pilot Planning and Evaluation © STREETLIFE Consortium Page 89 of 102
Figure 63:After using the STREETLIFE multimodal real time solution public users state they would change their mobility behaviour more than before the pilot. Solution provides easy access to information.
Post questionnaires and user acceptance
After using the STREETLIFE multimodal real time journey planner solution, users state they would use system frequently and that navigation is an important functionality.
Figure 64: Would you use STREETLIFE app frequently?
0 % 10 % 20 % 30 % 40 % 50 % 60 % 70 % 80 % 90 %
yes no no answer
Do you believe that easier accessed transport informa@on can contribute to
change your mobility behaviour?
FTG
Public
Post
0 %
10 %
20 %
30 %
40 %
50 %
60 %
70 %
strongly disagree disagree neither agree, nor disagree
agree strongly agree
I would use such a system frequently during my trips

FP7 - 608991 - STREETLIFE D6.2.1 – City pilots planning and evaluation results (initial)
WP6 – City Pilot Planning and Evaluation © STREETLIFE Consortium Page 90 of 102
Figure 65: What do you think about having navigation functionality?
Figure 66: Would you accept tracking?
0 %
10 %
20 %
30 %
40 %
50 %
60 %
strongly disagree disagree neutral agree strongly agree
What do you think about the idea of having a naviga@onal func@onality in the app?
0 %
5 %
10 %
15 %
20 %
25 %
30 %
35 %
40 %
strongly disagree disagree neutral agree strongly agree
Would you accept a tracking func@onality to get updated traffic and re-‐rou@ng
informa@on?

FP7 - 608991 - STREETLIFE D6.2.1 – City pilots planning and evaluation results (initial)
WP6 – City Pilot Planning and Evaluation © STREETLIFE Consortium Page 91 of 102
Figure 67: Do you like STREETLIFE travel assistance app?
Figure 68: How relevant was the information provided?
0 %
20 %
40 %
60 %
80 %
100 %
120 %
strongly disagree disagree neutral agree strongly agree
How do you like this kind of (public transporta@on) assistance in general?
0 %
10 %
20 %
30 %
40 %
50 %
60 %
70 %
not good li`le good moderately good rather good very good
How relevant is the informa@on provided?

FP7 - 608991 - STREETLIFE D6.2.1 – City pilots planning and evaluation results (initial)
WP6 – City Pilot Planning and Evaluation © STREETLIFE Consortium Page 92 of 102
Figure 69: Overall opinion about STREETLIFE app.
Feedback
General feedback received from users taking part in the public pilot:
- Great! I had been waiting for a journey planner version optimized for smartphone
- I hope this (real time journey planner) really works, it is really annoying to miss a bus which has been ahead of its schedule
- Had to update the page, but otherwise looks good!
- NysseDroid (third party app using the TRE API) has increased my Public transport usage a lot!
- Is there API’s for developer ecosystem? (STREETLIFE Tampere pilot has an open API.)
- And general feedback on Public Transportation, e.g., about challenges using public transport to take kids to day-care or not happy about changes in a bus route
Suggestions from the same users:
- Show the cost comparison of private car instead of CO2 emission
- Add more point of interest data making search easier
- I want just click my favorite journeys without search of start and end (STREETLIFE Tampere Pilot has this)
0 %
10 %
20 %
30 %
40 %
50 %
60 %
70 %
strongly disagree disagree neither agree, nor disagree
agree strongly agree
Overall, I find the STREETLIFE app useful

FP7 - 608991 - STREETLIFE D6.2.1 – City pilots planning and evaluation results (initial)
WP6 – City Pilot Planning and Evaluation © STREETLIFE Consortium Page 93 of 102
- I would like to see earlier/later departures easily
Usage of the Tampere pilot
TRE-EXP-1: Focus test group
• STREETLIFE app users in first month: 43 users, average time spend in app 3:02 min, 70% returning users
TRE-EXP-2: Public pilot
• STREETLIFE app users in first month: 3381 users, average time spend in app 1:20min, 56% returning
• STREETLIFE app users after 3 months: 4280 users, average time spend in app 1:33min, 63% returning
There was quite lot of marketing during launch of the STREELIFE app in November and on launch days usage was greatest, but it is more interesting to see how usage has stabilized or grown after the launch.
Figure 70: TRE-EXP-2 - Public pilot started 3.11.2014. Picture has user statistics for 1.1-28.2.2015.
Interview with Tampere traffic planning
There were interviews with the City of Tampere traffic planning operational staff and traffic planning management. The goal was to assess their view on STREETLIFE. The interview template was generated from the Tampere research questions as described in D8.1.1 Evaluation plan.

FP7 - 608991 - STREETLIFE D6.2.1 – City pilots planning and evaluation results (initial)
WP6 – City Pilot Planning and Evaluation © STREETLIFE Consortium Page 94 of 102
Table 16: Interview with Tampere traffic planning.
# Question Traffic planning interview response
Q1 Will STREETLIFE have impact on traffic?
STREETLIFE Mobile app is useful when travelling a trip user is not familiar with. Compared to old trip planner, STREETLIFE is regional including commuter trains and bus connection to airport, which are both good advantages. Currently is not known if solution has increased usage of Park & ride.
Q2 Will STREETLIFE have impact on mode choice?
When multiple real time information feeds are integrated into single easy to use reliable service, it will have impact on peoples travel. STREETLIFE is heading into right direction. Bigger effect would come if larger user base can be achieved. Follow up question from traffic planning for the project how the private car users have been reached?
Q3 Will STREETLIFE integration to existing IT platforms lead to increased possibilities for further exploitation?
Yes, it is key requirement from the city traffic planning point of view that STREETLIFE integrates into existing IT-systems using EU and industry standards.
Q4 Will STREETLIFE virtual mobility decrease the threshold for using greener means of travel?
For tourists solution looks like very interesting, users can learn in advance or orient themselves. This leads to improved comfort and security for the user. In the future the payment also should be included in the app.
Q5 Will STREETLIFE mixed reality interfaces improve perception of public transportation?
Real time and mixed reality makes learning the use of public transport network easier. It adds to users feeling that they know how the public transport works. Good quality service means also that users are takes seriously and their needs are catered, they are wanted customers. Important especially when there are changes in the main routes affecting lot of people, they could have view in advance (there is a new light rail planned in the city centre).
Q6 Will STREETLIFE enable Traffic Manager to manage passenger flows by
Idea is very interesting and leads the way to the future. There is couple location

FP7 - 608991 - STREETLIFE D6.2.1 – City pilots planning and evaluation results (initial)
WP6 – City Pilot Planning and Evaluation © STREETLIFE Consortium Page 95 of 102
varying stop goodness values? where this would be excellent to test. There is example need to improve loading time of rush hour bus in a narrow street. If people would walk a bit further, that would help congestion in that location. Also Park & ride can benefit from this model. When flows are managed, it is important that it is done equally.
Q7 Will STREETLIFE stay in production after the pilot project has ended?
Perhaps, technically there is no limit as solution uses EU- and industry standards interfaces, but more information about running costs are needed after the pilot. API and standard interfaces is important, there is always need continuous improvement and STREETLIFE enables new possibilities.
Q8 Will STREETLIFE have long term effects on sustainability?
Probably, but the IT systems and new traffic infrastructure investments play together, the information is part of a bigger traffic planning and management picture. Co-operation with big companies in the region might bring additional benefits.
Q9 Does STREETLIFE motivate using of greener means of travel?
Quality information is perquisite for informed decisions. It was discussed that sustainability (carbon footprint) might not be direct enough value for end user to make the mode change.
Q10 What incentives you see important? Euros are powerful incentive, time to find parking time and all the related costs to private cars should be taken into account.
Gamification and user participation are very interesting, especially can we affect younger generation and that could lead to mode choice. Draw back was seen how to keep users interested in games over long period of time, but learning how to use Public transport thorough achievements should be tested.

FP7 - 608991 - STREETLIFE D6.2.1 – City pilots planning and evaluation results (initial)
WP6 – City Pilot Planning and Evaluation © STREETLIFE Consortium Page 96 of 102
4.4.5. Evaluation summary
Generally speaking, the evaluation of the data collected from the pilot, in particular from the feedback and questionnaire survey shows we are on right track in STREETLIFE Tampere pilot. The main findings are recapped below for the reader’s convenience.
• Based on data collected after using the STREETLIFE app users see trip planning important and they are willing to use it frequently.
- How do you like this kind of assistance in general: 100% strongly agree
- After using the STREETLIFE app willingness to change mobility behaviour increased from 60% to 78%. We can say quite confidently that better information will lead to mobility behaviour change.
• Information provided matches user needs and the usability is good
- How relevant is the information provided: 71% rather/very good
- I find the STREETLIFE app useful: 64% either agree or strongly agree
- Most users access the service via mobile devices, and STREETLIFE received mostly favourable feedback. Service availability via mobile devices is essential
- Users immediately compare the test service to polished commercial Apps available in App stores, even if STREETLIFE is a research pilot. User experience is very important.
• Planned scenarios matches user needs
- The Tampere STREETLIFE Apps design concept that it remembers users past queries reduces need to type start and end location. This was also suggested by the public pilot user during the pilot.
• Developer community asks about open API which was seen as important scenario to establish new value-add services to commercial enterprises and other third parties. Open API is important for the third party developer ecosystem. Technical solution is stable, fast responsive and scales up.
- Integration of existing City of Tampere IT platforms is established
- Service has been running since 1. October 2014 without service breaks.
- Backend resource allocation succeeded well: service has been fast and responsive
Opinion of Tampere city traffic planning (via interview): As a part of the evaluation process, management and operational staff of the City of Tampere traffic planning department were interviewed. They see STREETLIFE value and potential to affect people's travel habits. The project gives them tools and methods that can be used in the future. To get long term effects,

FP7 - 608991 - STREETLIFE D6.2.1 – City pilots planning and evaluation results (initial)
WP6 – City Pilot Planning and Evaluation © STREETLIFE Consortium Page 97 of 102
focus on participation and getting more users seems logical as next step in Tampere pilot in their view.

FP7 - 608991 - STREETLIFE D6.2.1 – City pilots planning and evaluation results (initial)
WP6 – City Pilot Planning and Evaluation © STREETLIFE Consortium Page 98 of 102
5. CONCLUSION
The first iteration of the STREETLIFE pilots in the sites of BER, ROV and TRE has seen the execution of a number of experiments, and the collection of a wealth of data. In this Deliverable we are presenting the initial analysis and results of that data, which leads to an initial evaluation of: i) the effect that the STREETLIFE technologies deployed as enablers of the pilot experiments has had locally to the given pilot site, and its specific sustainable mobility concerns; and ii) the acceptance and effectiveness of the STREETLIFE technologies per se.
The evaluation process is only at the beginning; however, those preliminary evaluation results draw an overall encouraging picture of how – even at this initial stage - STREETLIFE has impacted all of the three pilot sites. The results so far, for BER, ROV and TRE respectively, have been described in Sections 4.2.4, 4.3.4, and 4.4.4 of this Deliverable, while the key findings and insights are summarized in Sections 4.2.5, 4.3.5, and 4.4.5.
Further and more in-depth analysis will continue within each pilot, with a multi-fold purpose: to guide the definition of the second iteration of the pilots; to provide feedback to the other STREETLIFE WPs that must provide the technologies for the enactments of the pilots; for dissemination of success stories and best practices originated from the pilot experiences; and as an input to the next stage of evaluation, that is, the assessment of the impact that these early versions of STREETLIFE technology and solutions can have on the three most important project macro-objectives, i.e., the reduction of carbon emission, the improvement of traffic situation, and the virtuous modification of the mobility habits of EU citizens.

FP7 - 608991 - STREETLIFE D6.2.1 – City pilots planning and evaluation results (initial)
WP6 – City Pilot Planning and Evaluation © STREETLIFE Consortium Page 99 of 102
APPENDIX A: TEMPLATE FOR THE PILOT PLANNING QUESTIONNAIRE
(referred to in Section 2 of this Deliverable) – Questionnaire text begins below:
In the remainder, we discuss the 4 phases of pilots and what information is necessary to have in order to create an effective work plan to guide WP6 and WP7 work in each of the three pilot sites.
When you answer to the 13 questions listed for the various phases, the pilot cluster and the project as a whole will gain an understanding on the level of readiness and preparation of each pilot, and what needs to do to complete it successfully.
This applies strongly to the successful completion of the current first iteration, but it is also going to be a valid work plan setting tool for the upcoming second one.
PILOTS PLANNING PHASE
There are two main questions that need to be solved about this
Q-plan-1: Which among the pilot scenarios (refer to D6.1) are going to be active in this iteration?
Q-plan-2: And which case studies within the active scenarios do you intend to pursue and experiment upon in this iteration?
Please respond to these planning questions, in order to move on to discussing the other phase.
PILOTS ENGAGEMENT PHASE
For each pilot, in each iteration, one requirement is to produce an engagement plan and then execute that plan. The goal of an engagement plan is to ensure that the pilots scenario are experimented with in an effective way, that is, a way that is conducive to be able to carry out their evaluation.
The engagement plan for each pilot will become an integral part of D6.2. Therefore, writing down the engagement plan to some level of formality will help in compiling D6.2
The engagement plan must involve groups of users of the STREETLIFE technology that is produced to satisfy the pilot scenarios and use cases. Users may be citizens (for use cases geared towards end users), as well as mobility management officers (for use cases geared towards mobility policy support).
To effectively carry out this phase, the following questions need to be resolved:

FP7 - 608991 - STREETLIFE D6.2.1 – City pilots planning and evaluation results (initial)
WP6 – City Pilot Planning and Evaluation © STREETLIFE Consortium Page 100 of 102
Q-engage-1: what are the types of stakeholders to be involved for each of the use cases that are active in this iteration? (should derive directly from D6.1)
Q-engage-2: what is the number of participants of each stakeholder type that is necessary to recruit for meaningful experimentation and evaluation of the corresponding pilot experiment?
Q-engage-3: what are the communities or groups (if any) to be targeted for recruiting the participants
Q-engage-4: what are the engagement strategies and promotion actions that the partners in the pilot cluster will carry out to effectively recruit the necessary number of pilot participants from those communities and groups?
Please respond to these engagement questions, in order to move on to discussing the other phase.
DEPLOYMENT PHASE
This phase has to do with collecting and organize the necessary technology for the pilot execution, as conceived in the planning phase.
To effectively carry out this phase, the following questions need to be resolved:
Q-depl-1: what SW components and data sources are needed to execute the scenarios and use cases selected for iteration? (this can be derived for example from D2.1 and D3.1, besides D6.1)
Q-depl-2: what among those SW components and data sources are ready to use for the purpose of the current pilot iteration, and already in the field?
Q-depl-3: what among those SW component and data sources need additional work, i.e., need to be customized, extended, implemented altogether, or deployed in the field. You should detail what kind of work is necessary (if you find a direct correspondence between the work to be done and any existing Work Item6, please indicate it; otherwise, please highlight that no existing Work Item matches the work that is deemed necessary.).
Please respond to these deployment questions, in order to move on to discussing the other phases.
6 Current Work Items list is available at: https://extsvnsrv.fokus.fraunhofer.de/cc/elan/streetlife/wiki/WorkItems1

FP7 - 608991 - STREETLIFE D6.2.1 – City pilots planning and evaluation results (initial)
WP6 – City Pilot Planning and Evaluation © STREETLIFE Consortium Page 101 of 102
EVALUATION PHASE
To ensure the ability to observe and evaluate the results of the pilot iteration, the following questions need to be resolved:
Q-eval-1: what city-level and project-level KPIs you intend to observe within the context of the experiments of this pilot iteration?
Q-eval-2: what metrics do you need to collect from the system and the engaged participants to be able to observe and analyse those KPIs?
Q-eval-3: by what data collection means and procedures will you be able to collect those metrics?
Q-eval-4: are those collection means ready to go, or do they need additional work that must be carried out on the system or with the participant? What is that work?
ROADMAP TO PILOT DEPLOYMENT
Step # Description Deadline STATUS* Estimated** completion date
1
…
In-progress
n Deployment complete Sep. 30, 2014 TBD Sep 30, 2014
*STATUS
Possible values for this column are:
• TBD: not yet started • In-progress • Completed (change the font of the corresponding row to strikethrough) • Delayed (likely not to be finished by deadline - must fill in the “Estimated completion
date”) • Late (when delayed and deadline is already passed - must fill in the “Estimated
completion date” column) **Estimated completion date:
This column becomes significant when a step is Delayed or Late, that is, the completion date is likely or certain to differ from the deadline.

FP7 - 608991 - STREETLIFE D6.2.1 – City pilots planning and evaluation results (initial)
WP6 – City Pilot Planning and Evaluation © STREETLIFE Consortium Page 102 of 102
APPENDIX B: PILOT EVALUATION QUESTIONNAIRES
We append here the following list of questionnaire forms used in surveys for pilot evaluation:
B-1. BER qualitative expert user survey - in German;
B-2. BER user acceptance and uptake survey: baseline version - in English;
B-3. BER user acceptance and uptake survey: treatment version - in English;
B-4. ROV-EXP-1 pre-experiment survey - in Italian;
B-5. ROV-EXP-1 post-experiment survey - in Italian;
B-6. ROV-EXP-2 shuttle riders survey – in Italian;
B-7. TRE pre-experiment survey – in English;
B-8. TRE post-experiment survey – in English.