street-smart or sheltered? trust types, behavior and
TRANSCRIPT

1
Street-Smart or Sheltered? Trust Types, Behavior and Choices of China’s Youth
Hongbin Li† Jaimie W. Lien‡ Qingqing Peng*
Current Version: February 27th, 2015 Initial Version: November 1st, 2013
Abstract:1
Social trust in China has declined substantially in recent years and is increasingly regarded as a major social concern. Research on the individual level correlates of social trust are typically limited to the standard generalized trust question (World Values Survey, General Social Survey) which may not capture trusting beliefs or behaviors in specific contexts. In the nationally representative Chinese College Student Survey (CCSS, 2011), we compare generalized trust responses to respondents’ answers on 1. How likely they would be to respond to a stranger approaching them to talk (stranger measure), and 2. Whether a friend’s lost wallet would be returned to them (wallet measure). A classification of trust types using individual gaps in trust levels across these three trust measures, is significantly associated with choices in a wide range of important life decisions. In particular, based on the responses to these trust questions, we classify two prevalent trust types in the population, which can arguably be described as “Street-smart” (53%) and “Sheltered” (23%) based on their significant observable behaviors. In addition to providing a recent report on the state of trust among educated young adults in China, our findings suggest that contextual survey-based measures of trust such as the wallet and stranger questions, may be useful predictors of individuals’ life decisions.
Keywords: trust, China, social capital, social mobility, behavioral heterogeneity, personality
JEL codes: D03, D62, J24
1 † Li: [email protected] ; Department of Economics, School of Economics and Management, Tsinghua University ‡ Lien: [email protected] ; Department of Decision Sciences and Managerial Economics, The Chinese University of Hong Kong ; Department of Economics, School of Economics and Management, Tsinghua University * Peng: [email protected] ; Department of Economics, School of Economics and Management, Tsinghua University We thank Xinzheng Shi and Yang Wang for their assistance and advice in the data preparation, and Lingsheng Meng, Xinzheng Shi and Binzhen Wu for their contributions to the Chinese College Student Survey (2011). For helpful comments and encouragement, we gratefully acknowledge Ozan Aksoy, Yvonne Chen, Ian Crawford, Vincent Crawford, Tony Fang, Jack Hou, Chengfang Liu, Elaine Liu, Tracy Xiao Liu, Alexis Medina, Shing-Yi Wang, Jing Zhang, Jie Zheng, and session participants in the Tsinghua SEM Applied Micro Reading Group, the Conference on Rural Issues and Development Economics (2014), the Chinese Economists Society Meeting (2014), and the Hong Kong Economics Association Meeting (2014). This research is supported by the China Data Center at Tsinghua University. All errors are our own.

2
The concept of trust, defined as the “assured reliance on the character, ability, strength or truth of someone or something,” has long been proposed as an important condition not only for fruitful economic interactions between individuals, but also for national economic growth (ex. Arrow, 1972; Fukuyama, 1995; Knack and Keefer, 1997; Zak and Knack, 2001). 2
In China, social trust is a critical concern for the quality of life of residents and the country’s future development. In recent years, some would argue that China has been experiencing a “trust crisis”, with official trust indices as well as popularly discussed anecdotes frequently pointing to disturbingly low levels and substantial declines in social trust.
Interpersonal trust is particularly important in developing countries, where it has the potential to improve interactions between individuals in situations where formal institutional procedures are underdeveloped.
3
In this paper, we survey a nationally representative sample of Chinese students in their final year of undergraduate study, eliciting their trust attitudes in different social contexts. We examine the relationship between these trust measures and their daily personal habits, academic performance, and their approach towards searching for employment. We find that interpersonal differences in self-reported trust attitudes along these different trust measures, significantly account for interpersonal differences in health behavior, study behavior, social life, academic performance, as well as job search initiative. Our analysis shows that contextual trust measures are a key component in better understanding the complexity of trust, consistent with the idea that “trust” may imply different things for different people in different contexts.
Given China’s current inter-connectedness and rising position among the world’s economies, social conditions and attitudes among the population is of global interest. In addition, since China experiences rapid growth and social change each year, periodic measures and enhanced understandings of social trust are necessary.
Our contributions are two-fold: First, our study provides a recent and in-depth analysis of the trust attitudes of Chinese soon-to-be young professionals, an influential subset of society in China’s future. A recent related study to ours is Cameron, Erkal, Gangadharan, and Meng (2013) which studies the effect of China’s one-child policy on individuals (“Little Emperors”) born before versus after the enforcement of the policy in 1979. Using a combination of experimental and survey methods, they measure individuals’ altruism, trust, trustworthiness, risk-taking and competitiveness. They find socially adverse effects of the one-child policy on all of these behavioral traits.
Our results are concerning in similar ways. In particular, our trust types analysis reveals that it is those “sheltered” individuals with generally little experience in the real world that are most likely aspire to the civil service, while “street-smart” individuals with broader experience in society have low aspirations for such influential careers in governance and leadership. Additionally, sheltered individuals receive more advice and assistance from the older generation in their educational choices, while street-smart individuals appear in the data, to largely fend for themselves. These findings raise questions about the acceptance of personality-trait diversity and social mobility within China’s meritocracy.
Secondly, in terms of methodology, we contribute to the literature on trust measurement by providing new contextual survey measures which have added predictive power for personal daily behavior and outcomes, when compared to the commonly used generalized trust measure.4
2 Definition from www.merriam-webster.com
We
3 “China’s social trust index declines in 2012”: http://english.peopledaily.com.cn/90882/8090290.html ; Only 65% of people said they would definitely help an elderly person who had fallen, with “fear of getting into trouble (blamed)” as the primary reason for not helping: http://english.peopledaily.com.cn/90882/7621574.html 4 In the General Social Survey (US) and the World Values Survey (cross-country), this is typically phrased, “Generally speaking, would you say that most people can be trusted, or that you can’t be too careful in dealing with people?”
3
focus on two questions in particular, focused on openness to strangers and property rights, respectively. Both factors are economically consequential indicators of a high-trust society. The first question asks respondents how likely they would be to talk to a stranger who is approaching them to talk (henceforth the stranger measure). This question is designed to measure how open an individual is to a random member of society approaching them for an unknown reason, where the propensity to interact with others has been previously found to have reliable psychometric properties in a trust inventory (Evans and Revelle, 2008). Our second question of focus asks respondents to imagine a scenario where they have lost their wallet (henceforth the wallet measure). They are asked how likely they think the wallet will be returned to them with its contents unaltered. This question is designed to gauge respondents’ perception about the likelihood that random members of society will take the moral action with respect to others’ property rights. This is a survey-based measure of the ‘envelope game’ in Glaeser, Laibson, Scheinkman and Soutter (2000).
Our study makes progress towards the objective of devising survey methods which can reliably elicit behavioral traits, as in the large literature on psychometric measures. Similarly to several recent studies attempting to bridge the gap and cross-validate survey work and field experiments (ex. Leland, Houser and Shachat, 2005; Holm and Nystedt, 2008), one of our motivations is to facilitate implementation of meaningful behavioral measures that do not require the high cost for training and monetary incentives that would be required by an incentivized field experiment of similar scale and sample size.5
We find patterns of trust heterogeneity and corresponding behaviors and life choices consistent with a stereo-typical labeling of “Street-smart” trust types and “Sheltered” trust types in Chinese society. The education literature discusses a distinction between street-smart and book-smart, raising the point that students’ intelligence may manifest itself not only in the classroom, but in the challenges of everyday life (Hatt, 2007). We find that street-smart individuals in our survey (those scoring high on stranger trust, but low on wallet trust), controlling for key personal and family characteristics such as family income, university quality, rural or urban origin, and other traits, have relatively worse academic performance, but are more self-reliant and proactive in job search, more likely to engage in risky health habits, and more focused on having a family. Street-smart individuals might be trusting because their wide variety of experiences in the real world, as observed through our survey data, leads them to have less apprehension about possible outcomes. While not necessarily the opposite of street-smart by definition, sheltered students have been largely protected from outside influences.
Indeed, we find that gaps in responses across the three different trust measures can significantly explain individual behavior and outcomes where Generalized Trust by itself does not. We do not attempt to infer a causal relationship between any of our variables of interest. Rather, our goal is to provide a descriptive snapshot of the current relation between our trust measures and the behaviors and choice of China’s educated youth.
6 Sheltered individuals in our survey (those scoring high on wallet trust and low on general trust), controlling for the same personal and family characteristics, are better in academics, less self-reliant and less active in job search, less likely to take health risks, and more likely to aspire to civil service. Sheltered individuals might be trusting because their lack of experience in the real world leads them to have interacted more exclusively with trustworthy subsets of the population.7
The remainder of the paper proceeds as follows: Section 2 discusses the data and survey-based trust questions, also providing summary statistics; Section 3 provides some general results on
5 For example, Glaeser, Laibson, Scheinkman and Soutter (2000) investigated the issue of whether such survey data are reliable by cross-checking responses with behavior in experimental trust games. 6 http://www.thefreedictionary.com/sheltered 7 Like Cameron, Erkal, Gangadharan, and Meng (2013), if one assumes that employment success, self-reliance, and social trust are desirable traits, our study implies some potential concerns about attitudes towards work, life, and social considerations among the current generation of youth.
4
demographic characteristics based on trust question responses; Section 4 describes our behavioral variables of interest, with special attention to the Chinese context; Section 5 provides basic relationships between behavioral and choice variables and trust measurements; Section 6 provides our main results on trust type classifications and the behavioral variables predicted by these classifications; Section 7 provides robustness checks; Section 8 provides descriptive statistics on the two main Trust Types; Section 9 concludes.
2. Chinese College Student Survey
Our data are from the 2011 version of the Chinese College Student Survey (CCSS), a nationally representative survey implemented by the China Data Center and the School of Higher Education of Tsinghua University. The CCSS collected a rich set of personal and background characteristics of respondents. The authors were directly involved in the survey design, implementation, and compilation of the original data.
The CCSS selected 100 universities nationwide using stratified random sampling method with college classification as the stratifying variable. For the 2011 survey, the sample included 61 colleges covering all 7 geographic areas (North, Northeast, East, South, Southeast, Southwest, and Central China), and 24 provinces in total. In terms of college rankings, 10 schools were in Project 985, 18 were in Project 211 and 29 were non-elite colleges (including 3 vocational schools, 1 private college and 2 independent schools).8
The survey was carefully designed with input by experts in sociology, education and economics, and was implemented under supervision from professionally trained survey data collectors. Research using the 2010 edition of CCSS includes Li, Meng, Shi and Wu (2012, 2013). Compared to the first round of CCSS conducted in 2010, the number of surveyed colleges increased, and the types of questions asked in the survey expanded in 2011 to include further individual characteristics, family background variables, academic performance, and activity choices during and after college. Respondents were also asked about trust, risk preferences, and personal satisfaction towards life. Since the survey is directed towards college seniors, it is a recurring cross-section of data, not a panel.
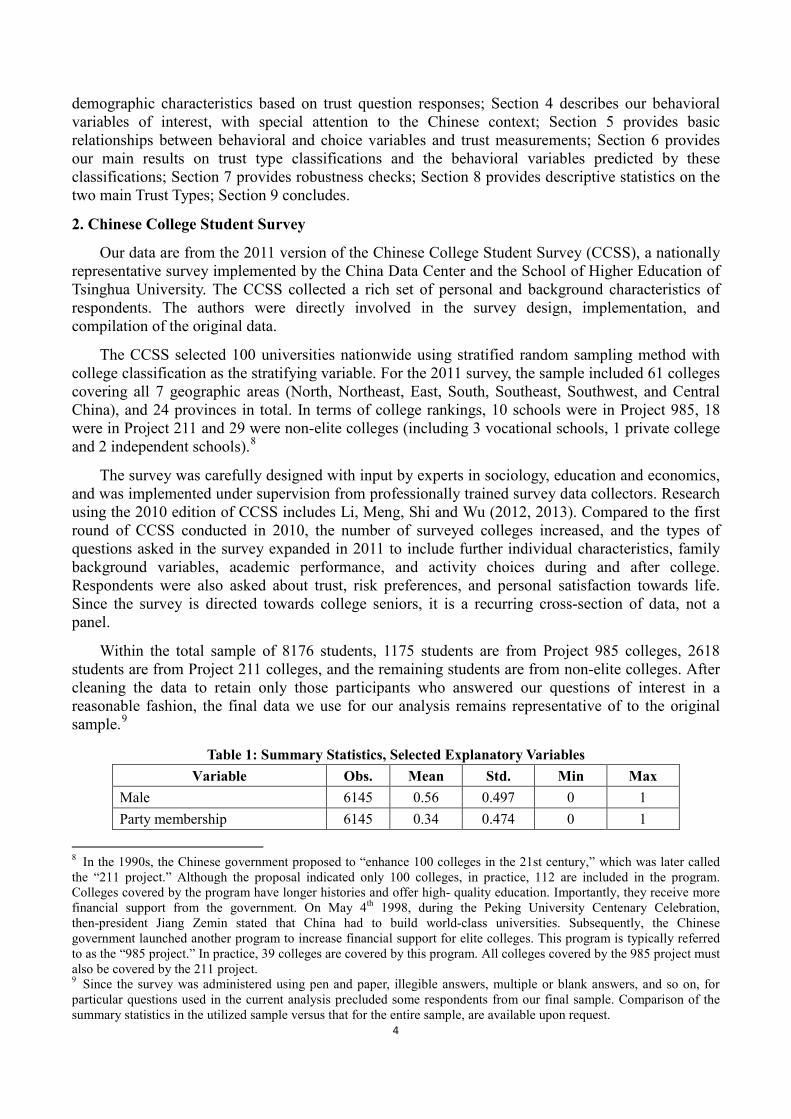
Within the total sample of 8176 students, 1175 students are from Project 985 colleges, 2618 students are from Project 211 colleges, and the remaining students are from non-elite colleges. After cleaning the data to retain only those participants who answered our questions of interest in a reasonable fashion, the final data we use for our analysis remains representative of to the original sample.9
Table 1: Summary Statistics, Selected Explanatory Variables
Variable Obs. Mean Std. Min Max Male 6145 0.56 0.497 0 1 Party membership 6145 0.34 0.474 0 1
8 In the 1990s, the Chinese government proposed to “enhance 100 colleges in the 21st century,” which was later called the “211 project.” Although the proposal indicated only 100 colleges, in practice, 112 are included in the program. Colleges covered by the program have longer histories and offer high- quality education. Importantly, they receive more financial support from the government. On May 4th 1998, during the Peking University Centenary Celebration, then-president Jiang Zemin stated that China had to build world-class universities. Subsequently, the Chinese government launched another program to increase financial support for elite colleges. This program is typically referred to as the “985 project.” In practice, 39 colleges are covered by this program. All colleges covered by the 985 project must also be covered by the 211 project. 9 Since the survey was administered using pen and paper, illegible answers, multiple or blank answers, and so on, for particular questions used in the current analysis precluded some respondents from our final sample. Comparison of the summary statistics in the utilized sample versus that for the entire sample, are available upon request.

5
Hometown in rural area 6145 0.42 0.494 0 1
Only child 6145 0.40 0.490 0 1 Household income 6145 59853 146012 100 5000000 Living expenditure during college 5670 796 717 50 20000 Rank in top 20% in college 5670 0.47 0.499 0 1 Failed at least one course during college
5670 0.41 0.491 0 1
Work-study on campus 5670 0.27 0.445 0 1 Work off campus 5670 0.48 0.500 0 1 Internship 5670 0.51 0.500 0 1 Dating someone currently 5670 0.39 0.487 0 1 Never smoked 5670 0.74 0.437 0 1 Took the civil service test 5670 0.15 0.358 0 1 Attempted to look for a job 5670 0.70 0.457 0 1
In order to capture different aspects of interpersonal trust among Chinese students, we incorporated three trust-related questions in the 2011 version of the CCSS. The first trust question is the widely utilized and accepted measure from the General Social Survey (US) and the World Values Survey (cross-country) asking “To what extent do you agree with the saying that ‘generally, people can be trusted’”? (1 - “strongly disagree”, 2 - “disagree”, 3 - “agree”, 4 - “strongly agree”)
In addition to the General Trust measure, we also asked students about their trust attitudes under two hypothetical contexts, targeted at measuring openness versus apprehension towards strangers, and belief in others’ respect for personal property.
The question aimed to measure attitudes towards strangers asks (translated) “While walking on the street, how likely is it that you will talk to a stranger who is approaching you”? [1 - “highly unlikely”, 2 - “unlikely”, 3 - “likely”, 4 - “highly likely”] We refer to this question throughout as the Stranger Trust measure. It is intuitive that the trust (and trustworthiness, in equilibrium) of individuals in society whom one is not acquainted with, can facilitate various economic and social interactions. Evans and Revelle (2008) find that in their Propensity to Trust Survey (PTS), the items “Retreat from others” and “Avoid contacts with others” had high negative factor loadings or associations with Trust.
In the questioned aimed to measure belief in others’ regard for personal property, which we refer to as the “wallet trust” measurement, respondents are asked (translated) “Suppose that one of your neighbors found his/her wallet missing after a shopping trip. With his/her address in the wallet, under what circumstance do you think the wallet would be returned”? 10
10 While we also solicited free-form numerical answers for respondents selecting option 2 in this question, the wide variety of answers given in the question make this particular variable less suitable for statistical testing in our current framework.
[1 - “No matter how much money inside, the wallet will not be returned”, 2 - “Whether it will be returned or not depends on the amount of money inside”, 3 - “No matter how much money inside, it will be returned”] In Glaeser, Laibson, Scheinkman and Soutter (2000), the authors implement an ‘envelope game’ in which experimental subjects’ willingness to pay for an envelope with $10 contained in it to be dropped in a particular location (with their name and address on it) is elicited. The idea is that individuals with higher trust in the envelope being returned to them, or in other words with higher social trust in the envelope’s

6
return, should have higher willingness to pay. Our wallet measure asks respondents about a similar issue, but as a survey question rather than as an experiment.
Table 2: Trust Measures Summary Statistics Variable Obs. Mean Std. Min Max
General Trust 6145 2.16 0.629 1 4 Stranger Trust 6145 2.94 0.600 1 4 Wallet Trust 6145 1.96 0.845 1 3
Table 2 provides summary statistics on these three trust measurements. We can see a moderately distrusting average of 2.16 on General Trust, with a relatively more positive average trust level for both the Wallet Trust and Stranger Trust measures.
3. General Results on Trust Measures
We first examine how the three trust measurements are related with students’ basic individual characteristics and family background, which serve as control variables in our analysis.
Gender and household income are two key control variables capturing basic demographic and economic factors influencing students’ personal development. Chinese Communist Party (CCP) membership serves as another measure of social status in the Chinese context. We also include a dummy variable for whether the student is originally from a rural area, and whether the student is the only child in the family, since trust levels may also systematically differ by these demographic factors.
Table 3: Ordered Logit Model; Dependent Variable: Trust Measurements Dependent Variable General Trust Stranger Trust Wallet Trust
Male -0.170*** (0.0510)
-0.161*** (0.0517)
1.000*** (0.0586)
1.008*** (0.0594)
0.113** (0.0473)
0.108** (0.0480)
Party membership 0.188*** (0.0559)
0.106** (0.0536)
0.279*** (0.0601)
0.0436 (0.0559)
-0.108** (0.0496)
-0.0769 (0.0504)
(Log) household income
-0.0228 (0.0258)
-0.0328 (0.0258)
-0.0156 (0.0273)
0.00360 (0.0277)
-0.00681 (0.0209)
-0.0146 (0.0216)
Home in rural area
0.176*** (0.0614)
0.224*** (0.0659)
-0.0341 (0.0553)
Only child
0.00185 (0.0596)
-0.151** (0.0640)
0.134** (0.0543)
Observations 6,358 6,263 6,349 6,255 6,256 6,162 Robust standard errors in parentheses; *significant at 10% level; **significant at 5% level;*** significant at 1% level;
The results in Table 3 show that the relationships between these basic demographic characteristics and trust levels, vary significantly based on the exact measure of trust in question. Trust levels vary significantly by gender, but the effect is opposite for General Trust compared to Stranger and Wallet Trust. Male college students show lower General Trust but higher Stranger Trust and Wallet Trust compared to female students.11
11 Previous literature examining gender differences in trust found that men tend to be more trusting while women are more trustworthy in investment games (Buchan, Croson and Solnick, 2008). Our findings suggest that men are less
Chinese Communist Party members tend to show

7
higher general trust and stranger trust but are more pessimistic in the wallet trust question. However, including dummy variables for rural origin and being an only child, largely accounts for the significance in coefficients on party membership for the Stranger and Wallet Trust measures. Students from rural areas are significantly more likely to display Stranger Trust, while only children were significantly less likely to do so. Only children are significantly more likely to display Wallet Trust. There is no apparent difference in Wallet Trust between urban and rural students. Students from rural areas were significantly more trusting in the General Trust measure compared to students from urban areas.
4. Students’ Behaviors and Choices
The CCSS asks a rich set of questions about students’ lifestyles and attitudes, including students’ social activities, academic performance, and future plans. These questions provide us with an understanding of the daily activities and life choices of the survey respondents. We use these variables to provide a snapshot of the personal and behavioral correlates of the trust measures. In this section, we briefly discuss these variables (henceforth referred to as ‘behavior variables’) and their context in the lives of China’s current young generation.
4.1 Academic Variables
The Chinese College Entrance Examination (CEE) is the main high-stakes test for Chinese high school students who would like to pursue a university degree. Students’ choices in the application process, in combination with their performance on the exam itself, have an enormous impact on their future. The college admissions system in China is a centralized matching process, in which decisions about which schools to apply for and in what rank ordering, and majors listed, is extremely important and is arguably as important as the CEE score itself in determining which school a student is placed into.12
Academic performance in college is also important for university level students, directly affecting their future employment and post-graduate schooling options. We include several variables in our analysis to measure academic performance, such as class ranking, grade point average (GPA), and whether they failed any course during their college years.
Entrance into an ‘elite’ university in China carries a wage premium as high as 26% (Li, Meng, Shi and Wu, 2012). In the survey, we also asked students to rank “parents”, “relatives”, “teachers”, “classmates or friends”, “consulting institutions”, and “self-will” according to the importance of each source of influence while making college choices (answers on a ranking scale from 0 - “no influence” to 6 - “most important”). We are particularly interested in whether trust is associated with stronger or weaker self-reliance on this important life decision. We generate variables describing the gap in influence rank between these various information resources.
4.2 Social Activity Variables
China has a long-standing cultural tradition in which education and studying is highly revered as a key pathway to future opportunities. Being employed during university enrollment may sometimes be seen as a distraction to a student’s academic pursuits, rather than as a complement to their classroom learning. The types of jobs available to college students are often limited to academic tutoring, advertising assistance or work-study (Jing, Wu and Zhao, 2006). We ask students about three of the most common kinds of working experience in Chinese colleges: work-study on campus, part-time job off-campus and internships. Work-study in Chinese universities are usually job opportunities provided for those students in financial need. Part-time off-campus jobs are often pursued for similar reasons. Internships serve a slightly different purpose in that students in some generally trusting, but are perhaps more willing to take risk in specific social contexts, compared to women. 12 See for example, Wu and Zhong (2012), and Lien, Zheng and Zhong (forthcoming) for detailed descriptions of the matching mechanisms and strategic approaches in the CEE admissions procedure.

8
schools or majors are encouraged, or even required to hold an internship as a possible path to post-graduation job opportunities.
We include two variables on dating and marriage as potential correlates of trust. Dating and marriage are usually taken seriously in Chinese society, and there is a strong social norm for marriage. However, young Chinese have typically been discouraged from dating during their high school years for fear of disrupting their studies (Tang and Zuo, 2000). We asked students in the survey whether they are currently dating someone, and include it as a potential correlate of trust in our analysis. We also include a variable which measures attitudes about home ownership as a prerequisite for marriage. Traditionally, home ownership has been considered a necessary condition for marriage, however this has become an issue in recent years due to rising house prices which exceed the affordability of most young people (Wei and Zhang, 2011).
Chinese students’ time allocation differs systematically from university students’ time allocation in the United States, for example. Comparing the time allocation of university students in the two countries, Chinese students spend substantially more time on educational activities. Based on the responses to our survey, students spent an average of almost 40 hours a week either in class or on studying. This compares to about 3.4 hours per weekday spent on academic activities for their US counterparts.13
Finally, to get a further sense of students’ lifestyles, we ask about their experience with smoking cigarettes, and their overall living expenditures during their college years.
Time spent on leisure and entertainment activities appear comparable across US and Chinese students. However, the time spend on labor supply is substantially different; Chinese students spent about 5.5 hours per week working, while US students spent about 13.5 hours per week working. To better understand students’ daily life we asked them to report on their time allocation, including time spent on “classes”, “independent studying”, “sports”, “internet surfing”, “entertainment (including games, movies, shopping, etc.)”, “working (including work-study, work off-campus, internship, etc.)”, each week during the previous school year. The variables we included in the regressions are time use percentages calculated taking 128 hours as a student’s total disposable time.
4.3 Variables Regarding Future Plans
Job choice after graduation is another important decision for university students. We explore how trust level might be correlated students’ future career plans. We use whether the student took the civil servant test and whether the student has attempted to find a job (of any type) as our two main variables of interest in the future employment domain. The civil servant test is highly popular and competitive in China. In the 2014 civil servant test, 1.52 million people participated, with a pass rate of only 1/77 to obtain a position in the government.14 The characteristics of students aspiring to a career in the public service, is a potentially important social indicator. China’s labor market has also become increasingly competitive at the university level. Whether a student has put effort into seeking a job is a potentially important indicator of students’ initiative in pursuing their career. In 2013, some sources estimate that the percentage of university students who had signed a job offer by graduation was just 35%, a 12% decrease from 2012.15
13 Time use statistics for US university students taken from Bureau of Labor Statistics, American Time Use Survey (2008 – 2012). The average hours spent per weekday by US full time university students is as follows: Sleeping (8.5), Leisure and sports (3.8), Educational activities (3.4), Working (2.7), Traveling (1.5), Eating and drinking (1.0), Grooming (0.7), and Other (2.3). The time use proportions for Chinese students in our sample were asked from a weekly basis, and are as follows in hours: In class (24.8), Studying (15), Sports (5.2), Internet (12.9), Entertainment (8.5), Working (5.6).
14 http://edu.sina.com.cn/official/2013-10-28/0741399452.shtml 15 http://news.xinhuanet.com/politics/2013-06/10/c_124841295.htm ; Note that the figure for the employment rate of current year college graduates 6 months from their graduation date is much higher at around 91%. However, this

9
In terms of their future life plans, today’s college graduates face a high likelihood of being able to have more than one child, if they so desire. We are interested in whether trust attitudes are associated with different envisioned family sizes. We examine the association between trust and desired family size by asking respondents how many children they would like to have in the future. Despite the fact that the long lasting One-Child Policy still applies to current generation, changes in related regulations in various provinces and districts are showing increasing flexibility in family planning policies.16
Finally, to measure students’ life satisfaction, we asked them to report how satisfied they are in various aspects of their life: “academic performance”, “social activities”, “interpersonal relationships”, and “college life overall” (1 - very dissatisfied to 5 - very satisfied).
5. Relationship between Behavior Variables and Trust Measures
In order to assess the correlation between trust measures and each of our aforementioned behavior and choice variables of interest, we run simple regression models (linear, logit or ordered logit) with the variable in question as the dependent variable, and the trust variable as the independent variable, plus the set of basic demographic controls from Table 3 as control variables. We use this as an intermediate step to the trust types classification in Section 6, although the results are mainly to understand the data, and are not necessary for the classification of types in the next section.
Our general estimation framework is:
i i i iY X Trustβ γ ε= ⋅ + ⋅ +
where i indexes respondents, iX are the demographic control variables in Table 3, and a separate regression is run for each of { , , }i i i iTrust general stranger wallet∈ . iY are the behavior variables of interest, and the format of the regression (linear, logit, ordered logit) depends on the exact data format of iY .
We are interested in whether (controlling for basic demographic characteristics), students’ trust levels in each measure were significantly negatively or positively associated with their particular tendencies in the academic and social realms, as well as in their attitudes for the future. Note that the precise interpretation of each coefficient shown depends specifically on the (behavior) dependent variable. Thus we mainly focus on whether each coefficient is significantly positive or negative, in our discussion of the results.
Table 4 shows the results and details of these regressions. For visual ease, we include only the coefficients on the trust measures which were statistically significant (a blank space indicates a coefficient no different from zero at the 10% level), and we omit the coefficients on the control variables here out of space concerns.
percentage could include attrition from the labor force. 16 In Nov, 2013, Chinese government issued 《中共中央关于全面深化改革若干重大问题的决定》 which mentioned about allowing “couples to have a second child if at least one parent is the only child”. As of March 2, 2014, seven provinces have announced the implementation of the policy including Beijing, which passed the regulation on 2014/2/21. Detailed information can be found at http://news.xinhuanet.com/politics/2013-11/15/c_118164235.htm and http://baby.sina.com.cn/news/2014-03-02/092963121.shtml .

10
Table 4: Coefficients of Trust Measures on Behavior Variables
Dependent Variable General
Trust Stranger
Trust Wallet Trust
Influential individuals while making college choice
Parents○b 0.0951*** Individual him/herself ○b -0.0832*** Rank(self, friend) – rank(others)○c, 17 0.0854** -0.113*** Rank(self) – rank(parents) ○c -0.171*** Rank(self) – rank(others) ○c 0.0944* -0.127***
Academic performance during college
Rank in top 20% in college ○a 0.118*** Rank in bottom 20% in college ○a -0.128* GPA ○c 0.0330*** Academic score (out of 100) ○c 0.363*** Failed at least one course during college ○a
0.146*** -0.120***
Working experience during college
Work-study on campus ○a -0.0850* 0.0866* Work off campus ○a 0.180*** Internship ○a 0.0988**
Attitudes towards relationship
Dating someone currently ○a -0.0840** -0.0834* -0.0852*** Housing before marriage is essential ○a
-0.147*** -0.113**
Time allocation during college (percentage)
Sports ○c 0.00215** 0.00140**
Internet surfing ○c -0.00548**
*
Entertainment ○c -0.00352**
* Habits and customs
Never smoked ○a 0.147*** 0.169*** Currently a smoker ○a -0.183***
Living expenditure during college ○c -28.98* Job choice after graduation
Took the civil servant test ○a 0.188*** 0.153*** Attempted to look for a job ○a 0.123** -0.105***
Attitude towards next generation
Do not want any children ○a -0.187** -0.273*** Want more than 2 children ○a 0.0937**
Satisfaction score on college life
Academic score ○b 0.159*** -0.0768* 0.0684** Social interaction ○b 0.214*** 0.0724** Interpersonal relationships ○b 0.159*** 0.0738* 0.0593** Overall ○b 0.316*** 0.107***
*significant at 10% level; **significant at 5% level;*** significant at 1% level; Notes: 1. We apply the appropriate model depending on the format of the dependent variable. For dependent variables which
are dummy variables, logit model is applied (marked as ○a), for ordered categorical variables, a ordered logit model 17 The set of resources students were asked to rank in terms of influence are “parents”, “relatives”, “teachers”, “school mates or friends”, “consulting institutions”, and “self-will”. Whenever the ranking of multiple sources were considered (ex. rank(others) or rank(self, friend)) the average rank score was taken.

11
is applied (marked as ○b), for continuous variables, a linear model is applied (marked as ○c) 2. All regressions control for gender of the student, party membership of the students (except for the regression on
party membership), ln household income, whether student’s home place is in rural area, and whether the student is the only child in the family.
3. We also tested students’ party membership, whether students’ Date is a student, whether student Drink liquor frequently, No. of CVs submitted, No. of interviews received, No. of interviews attended, No. of offers received, students’ Success rate1 (No. of interviews requested/ No. of CVs submitted), Success rate2 (No. of offer received/ No. of CVs submitted), ln wage of the best-offer-job, but none of the trust measurements show significant effects on these factors. From Table 4 we can see that trust is related with different behavior choices for college graduates
and that different trust measurements show different correlations with our variables of interest. We briefly discuss the results for each category.
5.1 Academics
When considering who is more influential in making college choice decisions, students with higher Wallet Trust tend to show higher reliance on parents and other external sources compared to self-reliance. On the other hand, students with higher Stranger Trust are significantly more self-reliant in their college decision.
In terms of academic performance in college, we observe that the Wallet Trust measure is positively related with good academic performance, while students with high Stranger Trust are more likely to have failed courses during college. There seems to be no difference in college ranking and scores for students who have different General Trust or Stranger Trust levels, implying that these variables which are often used to measure human capital, may have only limited ability to explain social capital aspects, of which interpersonal trust is an essential element.
5.2 Social Activities
Work experience may be one of the first opportunities for the college students to obtain significant experience in the real world outside of the academic context. We find that work experiences have a minimal relationship with General Trust or Wallet Trust, but do have significant positive correlation with Stranger Trust. In particular, we note that working off-campus is quite significantly and positively associated with Stranger Trust. The disparity in results across the different trust measures demonstrates the limitation of using only one simple general question to capture trust levels.
We found that in terms of students’ attitudes and experiences with personal relationships, dating experience is significantly negatively associated with all three of the trust measurements. The belief that it is necessary to own housing before marriage also has negative relationship with General Trust and Stranger Trust.
In terms of time use, students with high Wallet Trust spend more time on sports but less time on internet and entertainment. Students with high Wallet Trust and General Trust are also more likely to have never smoked.
Self-reported life satisfaction scores are generally positively associated with trust measurements. The exception is the slightly negative relation between satisfaction with academic performance and Stranger Trust, which is also consistent with the negative correlation between Stranger Trust and having failed a course before.
5.3 Future Plans
Examining students’ decision to attend the national civil servants exam is a potentially important social indicator given that these exam-takers may eventually become local or central government

12
officials. Their trust levels and personality characteristics might be influential in the development of social and policy decisions. We find that young people with higher General Trust and Wallet Trust are more willing to enter the public service system, and we further discuss the possible reasons for this in Section 6.
Job market initiative is a key factor we are interested in, since it is indicative of young peoples’ attitudes towards their careers. Table 4 indicates that students with higher Stranger Trust are more active in job search while students with higher Wallet Trust are less likely to actively search for employment. General Trust was not significant in either direction, with regard to the attempt to search for employment.
Recent discussions on the One-Child Policy and concerns about an aging population have drawn attention to young adults’ attitudes towards family planning. The results show that students with higher General Trust and Stranger Trust are less likely to prefer not having children, and students with high Stranger Trust are more likely to want more than two children. We discuss this gap further in Section 6.
Among the personal characteristics and behavior choices we analyzed, several variables show significant correlation with the General Trust measurement, but many behaviors were only significantly related to the contextual Wallet and Stranger trust measures. We often found completely opposite effects of the different trust measurements on several of the behavior variables. These patterns lead to our further analysis in the following section, classifying students based on the differences in their responses to the three different trust measures, compared to the average responses in the sample.
6. Trust Type Classifications
The previous section showed that the three trust measurements show inconsistencies with each other in terms of their relationship with students’ behaviors and choices. That is, there are systematic patterns in the different responses to the three trust questions across behaviors. Adopting from the literature on behavioral heterogeneity (see for example, El-Gamal and Grether, 1995; Crawford, Costa-Gomes, and Iriberri, 2013, and others) we construct “Trust Types” in order to better capture individual heterogeneity in reported trust, and the associated observable behaviors.
For each of the three trust measurements, we create dummy variables for (average to) above average answers labeling these (in relative terms) “high trust”, and labeling below average answers “low trust”. Thus each respondent’s trust type is constructed relative to the trust levels in the pool of university students in the CCSS. Considering each three of the trust measurements we pair each up in high/low combinations obtaining 6 pairs in total (see Table 5). In these regressions, each pair of trust measurements (“low general and high stranger”, “high general and low stranger”, etc.) are added as explanatory variables in each regression, such that students who show identical (high/low) relative trust levels across the specified pair of trust measures are the comparison group. Once again we implement a reduced-form approach to identifying which of the personal characteristics and behaviors from Section 4 are significantly associated with each of the six possible trust types.
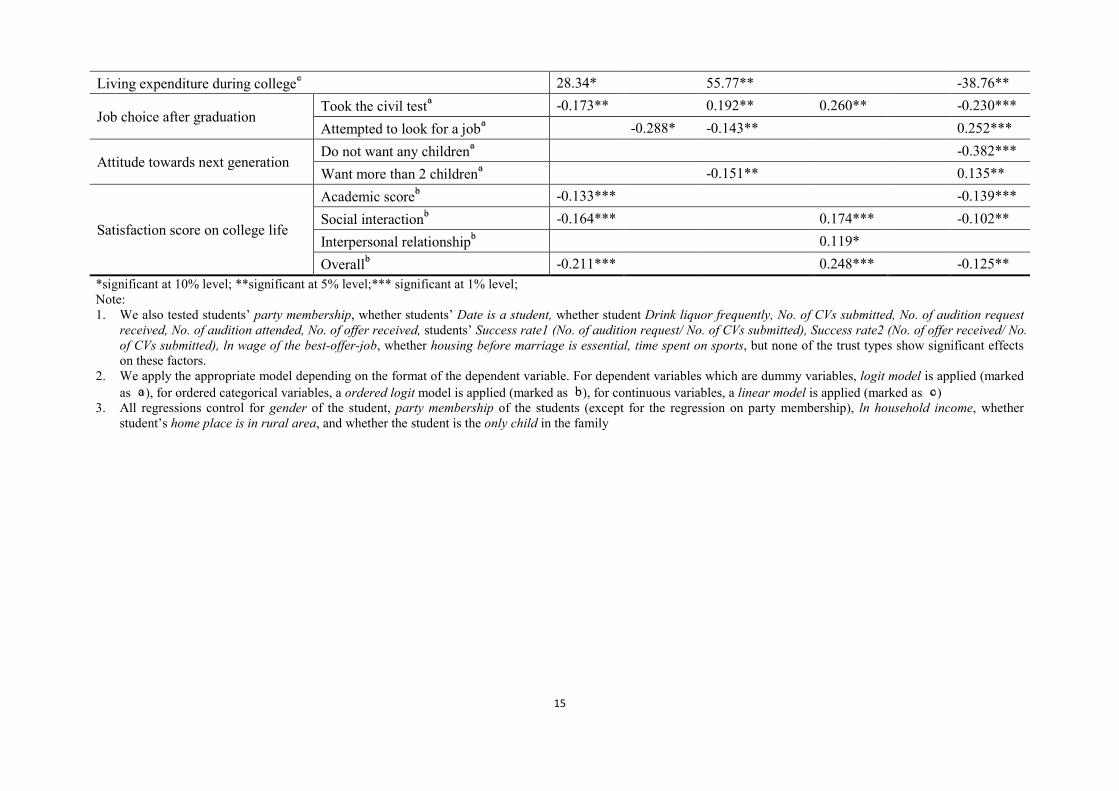
As in the previous section, we run regressions (ordinary least squares, logit or ordered logit) on students’ behaviors choices controlling for personal characteristics and family background. Only the coefficients of the trust types (trust gap combinations) are shown in Table 5. That is, each pair of cells in the table represents a separate regression, with the personal behavior variable of interest as the dependent variable, and the standard set of control variables, plus the relevant trust gaps/types as the explanatory variables. Thus, each coefficient in the table represents the relationship between that particular trust type and the relevant dependent variable, once again controlling for the basic demographic characteristics in Table 3. As in Table 4, due to the large number of coefficients
13
involved, we represent coefficients that were not significant at the 90% level with a blank space (or omitted from the table, if no Trust Type was significantly correlated with that dependent variable).
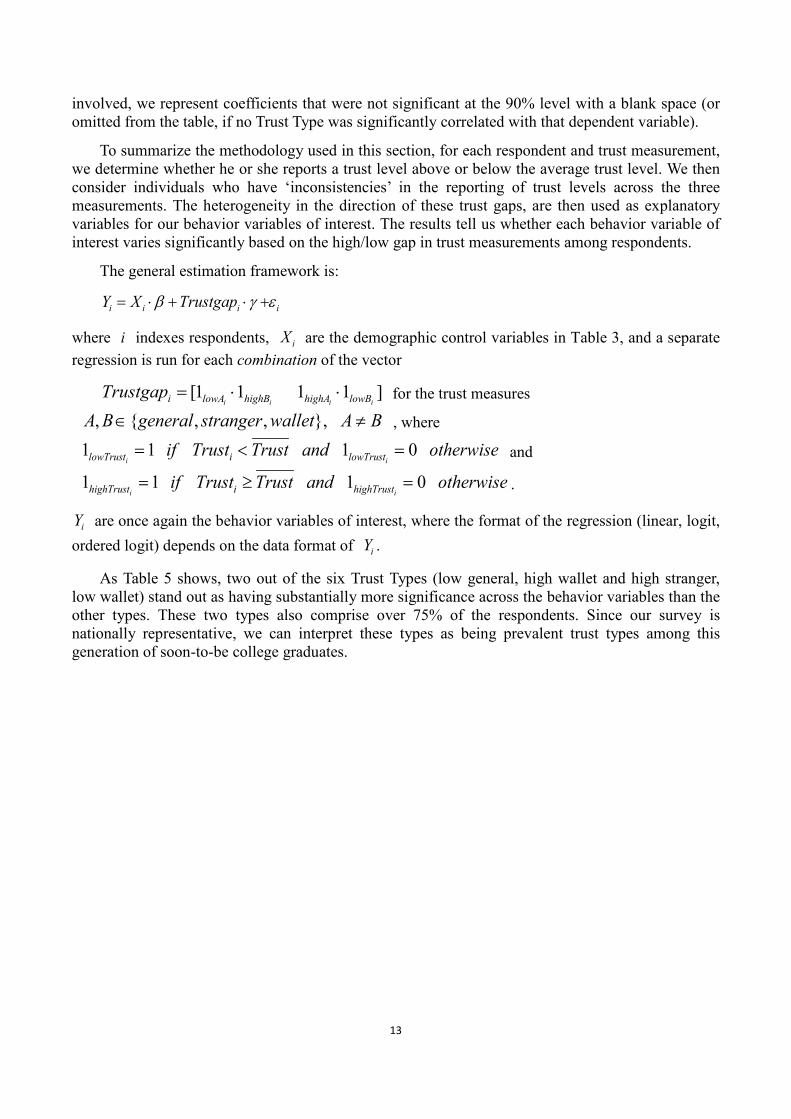
To summarize the methodology used in this section, for each respondent and trust measurement, we determine whether he or she reports a trust level above or below the average trust level. We then consider individuals who have ‘inconsistencies’ in the reporting of trust levels across the three measurements. The heterogeneity in the direction of these trust gaps, are then used as explanatory variables for our behavior variables of interest. The results tell us whether each behavior variable of interest varies significantly based on the high/low gap in trust measurements among respondents.
The general estimation framework is:
i i i iY X Trustgapβ γ ε= ⋅ + ⋅ +
where i indexes respondents, iX are the demographic control variables in Table 3, and a separate regression is run for each combination of the vector
[1 1 1 1 ]i i i ii lowA highB highA lowBTrustgap = ⋅ ⋅ for the trust measures
, { , , },A B general stranger wallet A B∈ ≠ , where
1 1 1 0i ilowTrust i lowTrustif Trust Trust and otherwise= < = and
1 1 1 0i ihighTrust i highTrustif Trust Trust and otherwise= ≥ = .
iY are once again the behavior variables of interest, where the format of the regression (linear, logit, ordered logit) depends on the data format of iY .
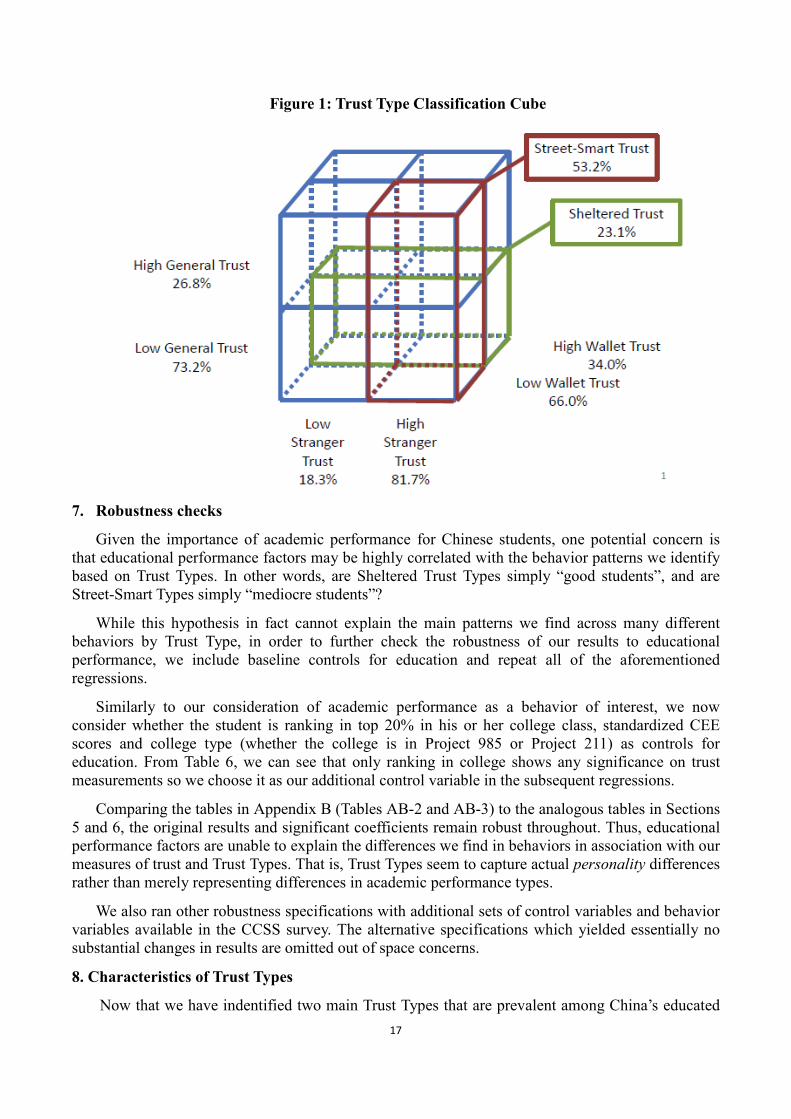
As Table 5 shows, two out of the six Trust Types (low general, high wallet and high stranger, low wallet) stand out as having substantially more significance across the behavior variables than the other types. These two types also comprise over 75% of the respondents. Since our survey is nationally representative, we can interpret these types as being prevalent trust types among this generation of soon-to-be college graduates.

14
Table 5: Coefficients of Trust Types on Students’ Behavior Variables
DEPENDENT VARIABLES
Trust Types low general high stranger
high general low stranger
low general high wallet
high general low wallet
low stranger high wallet
high stranger low wallet
“SHELTERED TRUST”
“STREET-SMART TRUST”
Influential individuals while making college choice
Parents○b
0.139** -0.156**
-0.137*** Individual him/herself○b
-0.108*
Rank(self, friend) – rank(others) ○c
-0.166***
0.148*** Rank(self) – rank(parents) ○c
-0.255***
0.219***
Rank(self) – rank(others) ○c
-0.157**
0.130**
Academic performance during college
Rank in top 20% in college○a 0.287* 0.158**
-0.144** Rank in bottom 20% in college○a
-0.313**
GPA○c
-0.0312** Academic score (out of 100) ○c
-0.389**
Failed at least one course during college○a
-0.292*
0.229***
Working experience during college Work-study on campus○a 0.108* 0.304*
Work off campus○a -0.359**
0.134** Internship○a -0.132** -0.321** 0.157**
Attitudes towards relationship Dating someone currently○a
-0.157**
0.0933* Time allocation during college (percentage)
Internet surfing○c
-0.00876***
entertainments○c
-0.00642***
0.00383*
Habits and customs Never smoked○a -0.157**
0.351* -0.259***
Smoking currently ○a
-0.549* 0.259***
15
Living expenditure during college○c 28.34*
55.77**
-38.76**
Job choice after graduation Took the civil test○a -0.173**
0.192** 0.260**
-0.230***
Attempted to look for a job○a -0.288* -0.143**
0.252***
Attitude towards next generation Do not want any children○a
-0.382***
Want more than 2 children○a
-0.151**
0.135**
Satisfaction score on college life
Academic score○b -0.133***
-0.139*** Social interaction○b -0.164***
0.174***
-0.102**
Interpersonal relationship○b
0.119*
Overall○b -0.211*** 0.248*** -0.125**
*significant at 10% level; **significant at 5% level;*** significant at 1% level; Note: 1. We also tested students’ party membership, whether students’ Date is a student, whether student Drink liquor frequently, No. of CVs submitted, No. of audition request
received, No. of audition attended, No. of offer received, students’ Success rate1 (No. of audition request/ No. of CVs submitted), Success rate2 (No. of offer received/ No. of CVs submitted), ln wage of the best-offer-job, whether housing before marriage is essential, time spent on sports, but none of the trust types show significant effects on these factors.
2. We apply the appropriate model depending on the format of the dependent variable. For dependent variables which are dummy variables, logit model is applied (marked as ○a), for ordered categorical variables, a ordered logit model is applied (marked as ○b), for continuous variables, a linear model is applied (marked as ○c)
3. All regressions control for gender of the student, party membership of the students (except for the regression on party membership), ln household income, whether student’s home place is in rural area, and whether the student is the only child in the family

16
From Table 5, we observe that classifying individuals based on the gaps in their trust between the different trust measures, significantly accounts for behavior and choice patterns across our variables of interest. We focus our discussion on the two specific Trust Types which stand out as having the most explanatory ability among students’ observable behaviors, based on the Table 5 results.
The first prevalent Trust Type in our data, are those respondents who show lower than average General Trust but higher than average Wallet Trust. Based on Table 5, this group of individuals, consisting of about 23% of our sample, tend to significantly rely more on their parents and the input of others while making decisions on college entrance, show better academic performance during college, be less likely to be dating someone during college, spend less time on internet and entertainments, and have higher daily life expenditure at college. This pattern could be characterized as pursuing the goals which most parents, believe are appropriate during college.
We refer to these respondents with low General Trust but high Wallet Trust as “Sheltered Trust Type”, due to our hypothesis that their interpersonal trust may be based on the relatively limited number of people and incidents they have had access to based on the data, thus leading them to be optimistic about the return of their lost wallet, despite having low trust of people in general. Regarding their future plans after graduation, they are more likely to attend the civil service test but less likely to search for work in the job market. They are more conservative in their family planning, being less likely to want more than two children in the future.
The other prevalent Trust Type in the data are those showing higher than average Stranger Trust but lower than average Wallet Trust, comprising over 53% of the sample. By contrast with the “Sheltered Trust Type”, these students are significantly more self-dependent in their college decisions. They have worse academic performance by virtually all measures, but more working experience in the outside world; they are more likely to be dating someone, more likely to have smoking experience, and they spend more time on entertainment.
Based on our observations about these individuals’ behaviors, their trust may be built on the numerous experiences they have had, and we characterize their trust as “Street-Smart Trust”. The street-smart label has been used in the education literature in describing the idea that students’ intelligence may be readily exemplified outside of the classroom setting (Wilson and Houghton, 1999; Hatt, 2007). In our “Street-smart” students’ choices regarding post-graduation future, they are less likely to have taken the civil servant exam, more likely to search for jobs in the labor market, less likely to want a childless family, and want more children in the future. However, there appear to be negative consequences for this type of trust as these individuals show significantly lower satisfaction scores in various aspects of their life.
Figure 1 illustrates our classification of the Trust Types, which applies to 76.3% of the sample in CCSS 2011.
17
Figure 1: Trust Type Classification Cube
7. Robustness checks
Given the importance of academic performance for Chinese students, one potential concern is that educational performance factors may be highly correlated with the behavior patterns we identify based on Trust Types. In other words, are Sheltered Trust Types simply “good students”, and are Street-Smart Types simply “mediocre students”?
While this hypothesis in fact cannot explain the main patterns we find across many different behaviors by Trust Type, in order to further check the robustness of our results to educational performance, we include baseline controls for education and repeat all of the aforementioned regressions.
Similarly to our consideration of academic performance as a behavior of interest, we now consider whether the student is ranking in top 20% in his or her college class, standardized CEE scores and college type (whether the college is in Project 985 or Project 211) as controls for education. From Table 6, we can see that only ranking in college shows any significance on trust measurements so we choose it as our additional control variable in the subsequent regressions.
Comparing the tables in Appendix B (Tables AB-2 and AB-3) to the analogous tables in Sections 5 and 6, the original results and significant coefficients remain robust throughout. Thus, educational performance factors are unable to explain the differences we find in behaviors in association with our measures of trust and Trust Types. That is, Trust Types seem to capture actual personality differences rather than merely representing differences in academic performance types.
We also ran other robustness specifications with additional sets of control variables and behavior variables available in the CCSS survey. The alternative specifications which yielded essentially no substantial changes in results are omitted out of space concerns.
8. Characteristics of Trust Types
Now that we have indentified two main Trust Types that are prevalent among China’s educated

18
youth, a follow-up question is whether there any interesting shared characteristics among the Trust Types. In this section, we tabulate the proportion of these prominent Trust Types across various demographic characteristics.
Table 6 breaks down the Trust Types by gender. Among males in our sample, about 53% of them were Street-Smart Types, while 24% of males were Sheltered Types. Among female students, the gap was less pronounced with 28% being Street-Smart Types, and 22% being Sheltered Types. The gender gap in the Stranger Trust measure, with males being more likely to be willing to talk to an approaching stranger, can account for much of this difference. An additional observation is that our two-type classification result explains an overall higher fraction of male respondents (81.5%) than female respondents (70%).
Table 6: Frequency of Trust Types by Gender
Gender Percentage of Students
Street-Smart Type Sheltered Trust Type
Male 57.3% 24.2%
Female 48.1% 21.9%
Next we consider the prevalence of each Trust Type by academic major. Table 7 shows the frequency of the Trust Types by each major in our sample, ordered from most frequently occurring to least frequently occurring. The Street-Smart types were most heavily represented in Medical Science, Engineering and pure Science, while being least represented in Law, Arts and Philosophy. For the Sheltered Type, Arts, Agronomy and Economics were most heavily representative, while Literature, History and Management were least representative of this Type.
Table 7: Frequency of Trust Types by Major (Excludes students majoring in military science due to limited frequency)
Street-Smart Type Sheltered Type
Medical Science 57.9% Arts 29.0% Engineering 56.5% Agronomy 27.4% Science 54.4% Economics 25.5% Literature 52.2% Law 25.3% Management 51.8% Science 24.9% Agronomy 51.6% Philosophy 24.4% Education 51.0% Education 23.7% Economics 50.3% Engineering 22.2% History 49.2% Medical Science 21.9% Law 49.1% Literature 21.3% Arts 42.1% History 20.6% Philosophy 37.8% Management 19.8%
Table 8 shows the representation of each Trust Type in various locations of students’ most attractive job offers. This was phrased in the survey as asking them to self-report the characteristics including location, of their ‘best’ offer in hand at the time of the survey. In the major three big cities,
19
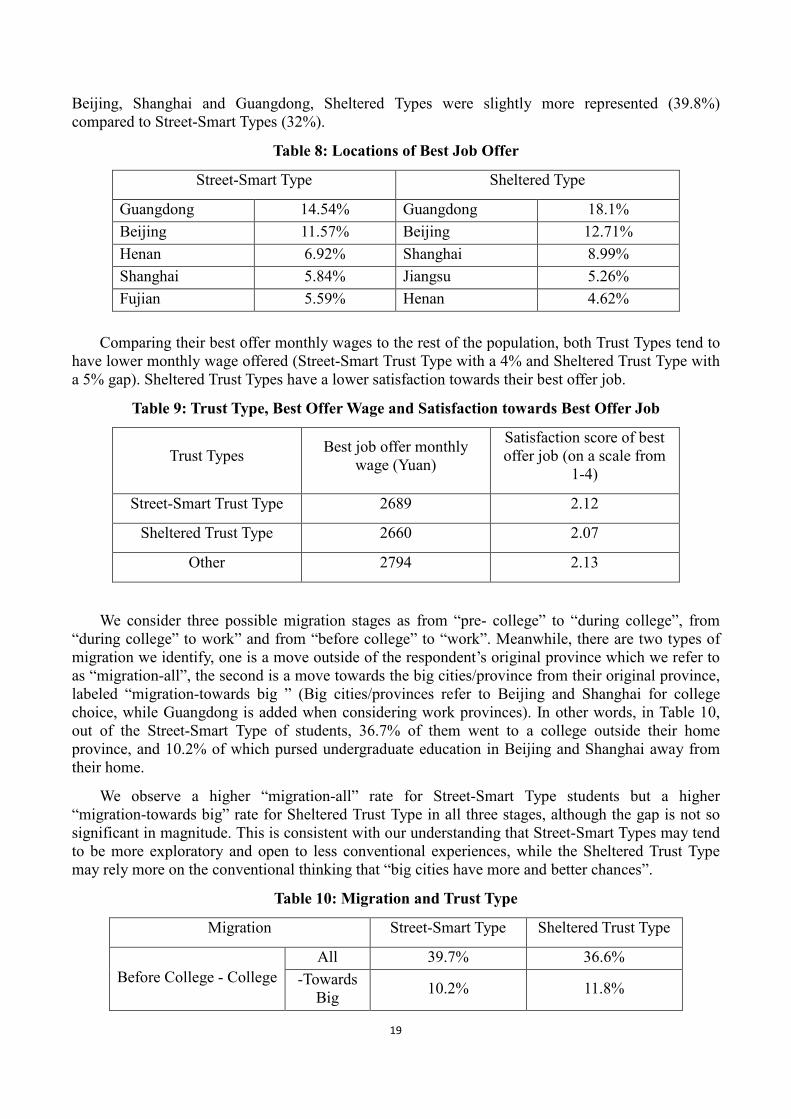
Beijing, Shanghai and Guangdong, Sheltered Types were slightly more represented (39.8%) compared to Street-Smart Types (32%).
Table 8: Locations of Best Job Offer
Street-Smart Type Sheltered Type
Guangdong 14.54% Guangdong 18.1% Beijing 11.57% Beijing 12.71% Henan 6.92% Shanghai 8.99% Shanghai 5.84% Jiangsu 5.26% Fujian 5.59% Henan 4.62%
Comparing their best offer monthly wages to the rest of the population, both Trust Types tend to
have lower monthly wage offered (Street-Smart Trust Type with a 4% and Sheltered Trust Type with a 5% gap). Sheltered Trust Types have a lower satisfaction towards their best offer job.
Table 9: Trust Type, Best Offer Wage and Satisfaction towards Best Offer Job
Trust Types Best job offer monthly wage (Yuan)
Satisfaction score of best offer job (on a scale from
1-4)
Street-Smart Trust Type 2689 2.12
Sheltered Trust Type 2660 2.07
Other 2794 2.13
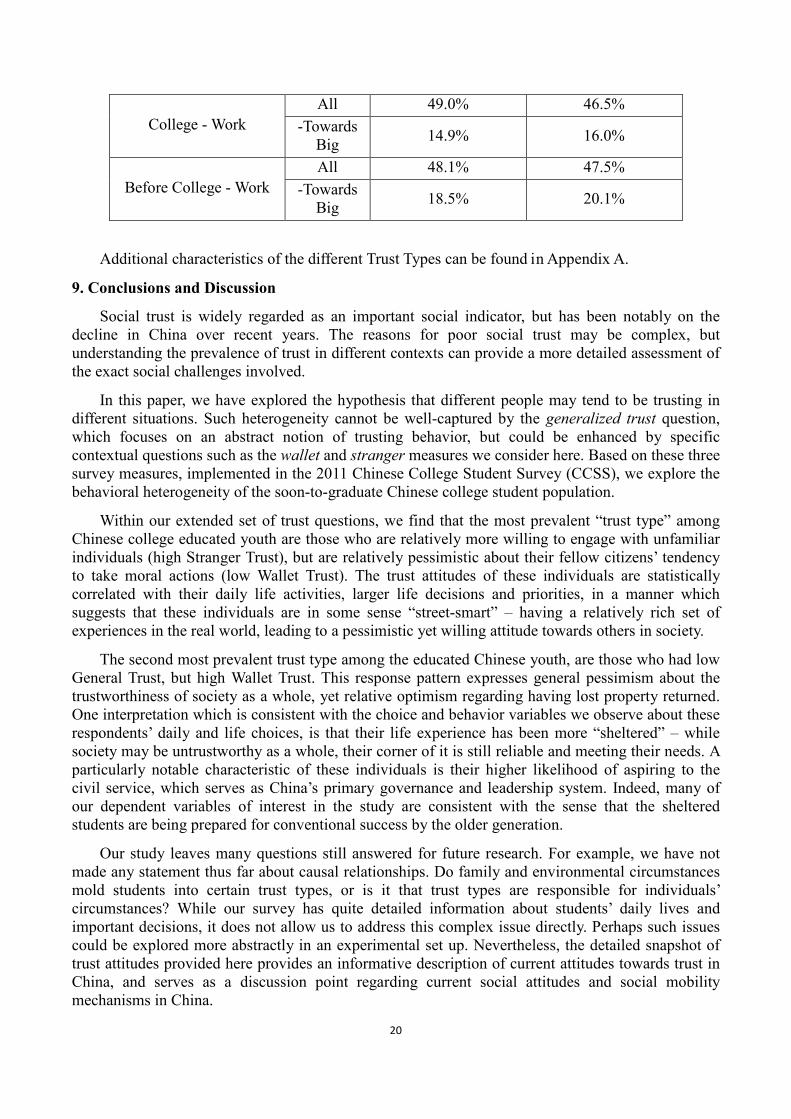
We consider three possible migration stages as from “pre- college” to “during college”, from “during college” to work” and from “before college” to “work”. Meanwhile, there are two types of migration we identify, one is a move outside of the respondent’s original province which we refer to as “migration-all”, the second is a move towards the big cities/province from their original province, labeled “migration-towards big ” (Big cities/provinces refer to Beijing and Shanghai for college choice, while Guangdong is added when considering work provinces). In other words, in Table 10, out of the Street-Smart Type of students, 36.7% of them went to a college outside their home province, and 10.2% of which pursed undergraduate education in Beijing and Shanghai away from their home.
We observe a higher “migration-all” rate for Street-Smart Type students but a higher “migration-towards big” rate for Sheltered Trust Type in all three stages, although the gap is not so significant in magnitude. This is consistent with our understanding that Street-Smart Types may tend to be more exploratory and open to less conventional experiences, while the Sheltered Trust Type may rely more on the conventional thinking that “big cities have more and better chances”.
Table 10: Migration and Trust Type
Migration Street-Smart Type Sheltered Trust Type
Before College - College All 39.7% 36.6%
-Towards Big 10.2% 11.8%
20
College - Work All 49.0% 46.5%
-Towards Big 14.9% 16.0%
Before College - Work All 48.1% 47.5%
-Towards Big 18.5% 20.1%
Additional characteristics of the different Trust Types can be found in Appendix A.
9. Conclusions and Discussion
Social trust is widely regarded as an important social indicator, but has been notably on the decline in China over recent years. The reasons for poor social trust may be complex, but understanding the prevalence of trust in different contexts can provide a more detailed assessment of the exact social challenges involved.
In this paper, we have explored the hypothesis that different people may tend to be trusting in different situations. Such heterogeneity cannot be well-captured by the generalized trust question, which focuses on an abstract notion of trusting behavior, but could be enhanced by specific contextual questions such as the wallet and stranger measures we consider here. Based on these three survey measures, implemented in the 2011 Chinese College Student Survey (CCSS), we explore the behavioral heterogeneity of the soon-to-graduate Chinese college student population.
Within our extended set of trust questions, we find that the most prevalent “trust type” among Chinese college educated youth are those who are relatively more willing to engage with unfamiliar individuals (high Stranger Trust), but are relatively pessimistic about their fellow citizens’ tendency to take moral actions (low Wallet Trust). The trust attitudes of these individuals are statistically correlated with their daily life activities, larger life decisions and priorities, in a manner which suggests that these individuals are in some sense “street-smart” – having a relatively rich set of experiences in the real world, leading to a pessimistic yet willing attitude towards others in society.
The second most prevalent trust type among the educated Chinese youth, are those who had low General Trust, but high Wallet Trust. This response pattern expresses general pessimism about the trustworthiness of society as a whole, yet relative optimism regarding having lost property returned. One interpretation which is consistent with the choice and behavior variables we observe about these respondents’ daily and life choices, is that their life experience has been more “sheltered” – while society may be untrustworthy as a whole, their corner of it is still reliable and meeting their needs. A particularly notable characteristic of these individuals is their higher likelihood of aspiring to the civil service, which serves as China’s primary governance and leadership system. Indeed, many of our dependent variables of interest in the study are consistent with the sense that the sheltered students are being prepared for conventional success by the older generation.
Our study leaves many questions still answered for future research. For example, we have not made any statement thus far about causal relationships. Do family and environmental circumstances mold students into certain trust types, or is it that trust types are responsible for individuals’ circumstances? While our survey has quite detailed information about students’ daily lives and important decisions, it does not allow us to address this complex issue directly. Perhaps such issues could be explored more abstractly in an experimental set up. Nevertheless, the detailed snapshot of trust attitudes provided here provides an informative description of current attitudes towards trust in China, and serves as a discussion point regarding current social attitudes and social mobility mechanisms in China.

21
From a methodological perspective, we find that implementing survey-based contextual questions can reveal details about respondents’ trust attitudes, which would be overlooked by studying only the generalized trust question. Our approach borrows strongly from the psychometric literature in examining individual differences in respondents’ answers to a uniform set of questions, and analyzing accordingly. Using regression analysis, we find that this approach indeed has statistical explanatory ability in respondents’ decisions as well as intuitive interpretations, from smaller decisions such as daily time use, to highly consequential career decisions. Based on this Trust Type classification approach, we are able to obtain a better understanding of the complexity of trust concepts in current Chinese society, and some possible consequences for future generations.
22
References:
Arrow, K. J. (1972). Gifts and exchanges. Philosophy & Public Affairs, 1(4), 343-362.
Berggren, N., & Bjørnskov, C. (2011). Is the importance of religion in daily life related to social trust? Cross-country and cross-state comparisons. Journal of Economic Behavior & Organization, 80(3), 459-480.
Buchan, N. R., Croson, R. T., & Solnick, S. (2008). Trust and gender: An examination of behavior and beliefs in the Investment Game. Journal of Economic Behavior & Organization, 68(3), 466-476.
Burney, E. (2009). Making people behave: Anti-social behaviour, politics and policy: Routledge.
Cameron, L., Erkal, N., Gangadharan, L., & Meng, X. (2013). Little Emperors: Behavioral Impacts of China's One-Child Policy. Science, 339(6122), 953-957.
Chaudhuri, A., Paichayontvijit, T., & Shen, L. (2012). Gender differences in trust and trustworthiness: Individuals, single sex and mixed sex groups. Journal of Economic Psychology.
Crawford, V.P., Costa-Gomes, M.A., and Iriberri, N., Structural Models of Nonequilibrium Strategic Thinking: Theory Evidence and Applications. Journal of Economic Literature, Vol. 51 (2013), No. 1, p. 5 – 62.
Dunning, D., Fetchenhauer, D., & Schlösser, T. M. (2012). Trust as a social and emotional act: Noneconomic considerations in trust behavior. Journal of Economic Psychology, 33(3), 686-694.
El-Gamal, M.A. and Grether, D.M., Are People Bayesian? Uncovering Behavioral Strategies. Journal of the American Statistical Association, Vol. 90 (1995), No. 432, p. 1137 – 1145.
Evans, A.M. and Revelle W., Survey and behavioral measures of interpersonal trust. Journal of Research in Personality, Vol. 42 (2008), p. 1585 – 1593.
Fukuyama, F. (1995). Social capital and the global economy. Foreign affairs, 89-103.
Gächter, S., Herrmann, B., & Thöni, C. (2004). Trust, voluntary cooperation, and socio-economic background: survey and experimental evidence. Journal of Economic Behavior & Organization, 55(4), 505-531.
Glaeser, E. L., Laibson, D. I., Scheinkman, J. A., & Soutter, C. L. (2000). Measuring trust. The Quarterly Journal of Economics, 115(3), 811-846.
Hatt, B., Street Smarts vs. Book Smarts: The Figured World of Smartness in the Lives of Marginalized, Urban Youth. Urban Review: Issues and Ideas in Public Education, Vol. 39 (2007), No. 2, p. 145 – 166.
Holm, H., & Nystedt, P. (2008). Trust in surveys and games–A methodological contribution on the influence of money and location. Journal of Economic Psychology, 29(4), 522-542.
Knack, S., & Keefer, P. (1997). Does social capital have an economic payoff? A cross-country investigation. The Quarterly Journal of Economics, 112(4), 1251-1288.
Leland, J, Houser, D., and Shachat, J. “Measuring Trust and Trustworthiness”, Trust and Entrepreneurship: A West-East Perspective, ex. H.H.Hohmann and F.Welter (2005), p. 87 – 96.

23
Li, H., Meng, L., Shi, X., & Wu, B. Poverty in China's Colleges and the Targeting of Financial Aid. The China Quarterly, 1-23.
Li, H., Meng, L., Shi, X., & Wu, B. (2012). Does attending elite colleges pay in China? Journal of Comparative Economics, 40(1), 78-88.
Li, H., Meng, L., Shi, X., & Wu, B. (2012). Does having a cadre parent pay? Evidence from the first job offers of Chinese college graduates. Journal of Development Economics, 99(2), 513-520.
Lien, J.W., Zheng, J., and X. Zhong. Preference Submission Timing in School Choice Matching: Testing Fairness and Efficiency in the Laboratory. Experimental Economics, forthcoming.
Özcan, B., & Bjørnskov, C. (2011). Social trust and human development. Journal of Socio-Economics, 40(6), 753-762.
Prochaska, J. O., Velicer, W. F., Rossi, J. S., Goldstein, M. G., Marcus, B. H., Rakowski, W., Rosenbloom, D. (1994). Stages of change and decisional balance for 12 problem behaviors. Health Psychology, 13(1), 39.
Siegmann, A. W. (1966). Father absence during early childhood and anti-social behavior. Journal of Abnormal Psychology, 71(1), 71.
Tang, S. and Zuo, J. (2000). Dating Attitudes and Behaviors of American and Chinese College Students. The Social Science Journal, Vol. 37, No. 1, p. 67 – 78.
Wei, S., and Zhang, X., (2011). The Competitive Saving Motive: Evidence from Rising Sex Ratios and Savings Rates in China, Journal of Political Economy, Vol.119, No. 3, p. 511 – 564.
Wilson, M. and Houghton, A. (1999). A Different Kind of Smart: A Study of the Educational Obstacles Confronting Homeless Youth in New England. New England Network for Child, Youth and Family Services Research Report, Sept. 1999, 75 pages.
Zak, P. J., & Knack, S. (2001). Trust and growth. The Economic Journal, 111(470), 295-321.
何珊珊. (2007). 关于我国在校大学生兼职动机的思考. 中国劳动关系学院学报, 21(3), 116-118. (English citation: He, S., (2007). On University Students’ Motivation of Having Part-time Job in China, Journal of China Institute of Industrial Relations, 21(3), 116-118.)
经素, 吴亚子, & 赵燕. (2006). 大学生兼职情况调查报告——以南京地区高校为例. 青年研究(10), 21-25. (English citation: Jing, S., Wu, Y., & Zhao, Y. (2006). Survey Report on University Students’ Part-time Job, Youth Studies(10), 21-25.)
聂海峰. (2007). 考得好不如报得好么? 南方经济(7). (English citation: Nie, H., (2007). Is High Score Enough? ----An Analysis of Strategy under College Admission Mechanism, South China Journal of Economics(7))
吴斌珍, & 钟笑寒. (2012). 高考志愿填报机制与大学招生质量 (一个基于择校机制理论的经验
研究. 经济学 (季刊), 11(2), 769-804. (English citation: Wu, B., & Zhong, X., (2012), Preference Submission Mechanisms and Matching Qualities: An Empirical Study on China’s College Entrance Examination System, China Economic Quarterly, 11(2), 769-804.)

24
Appendix A: Additional Results on Trust Type Characteristics
This section reports on additional characteristics of the Trust Types, continuing from Section 8.
As Table AA-1 shows, the more developed provinces like Jiangsu, Beijing, Guangdong and Shanghai tend to have the lowest proportion of students marked as Street-Smart Trust Type, and a comparatively higher percentage of Sheltered Trust Type for Guangdong and Shanghai. On the other hand, provinces located in the west of China like Guizhou, Sichuan and Shanxi account for a high proportion of the Street-Smart Type college students, and a low percentage of the Sheltered Type Students.
Table AA-1: Top & Bottom 5 Hometown Provinces Street-Smart Type Sheltered Type
Guizhou 65.4% Qinghai 33.3% Shaanxi 61.6% Hainan 33.3% Sichuan 60.3% Jilin 29.0% Yunnan 60.3% Guangdong 28.6% Guangxi 60.2% Shanghai 27.6% Jiangsu 47.6% Anhui 19.9% Beijing 47.6% Hubei 19.8% Guangdong 44.3% Shaanxi 18.0% Heilongjiang 43.3% Hunan 17.7% Shanghai 42.8% Guizhou 16.2%
Students from Xizang province (Tibet) excluded due to limited sample
Provinces which are generally thought to have comparatively high education levels like Shandong, Jiangsu and Guangdong have low percentage of students marked as Street-Smart Type and high percentages of students of the Sheltered Type.
Table AA-2: Top & Bottom 5 School Provinces
Street-Smart Type Sheltered Type
Guangxi 64.3% Guangdong 29.2% Yunnan 62.8% Heilongjiang 27.9% Anhui 62.4% Jiangsu 27.3% Gansu 61.9% Jilin 26.5% Xinjiang 60.9% Sichuan 26.3% Shandong 47.4% Hunan 18.5% Shanghai 47.0% Anhui 17.6% Guangdong 44.2% Gansu 16.2% Heilongjiang 39.4% Yunnan 15.3% Jiangsu 37.9% Guangxi 14.3%
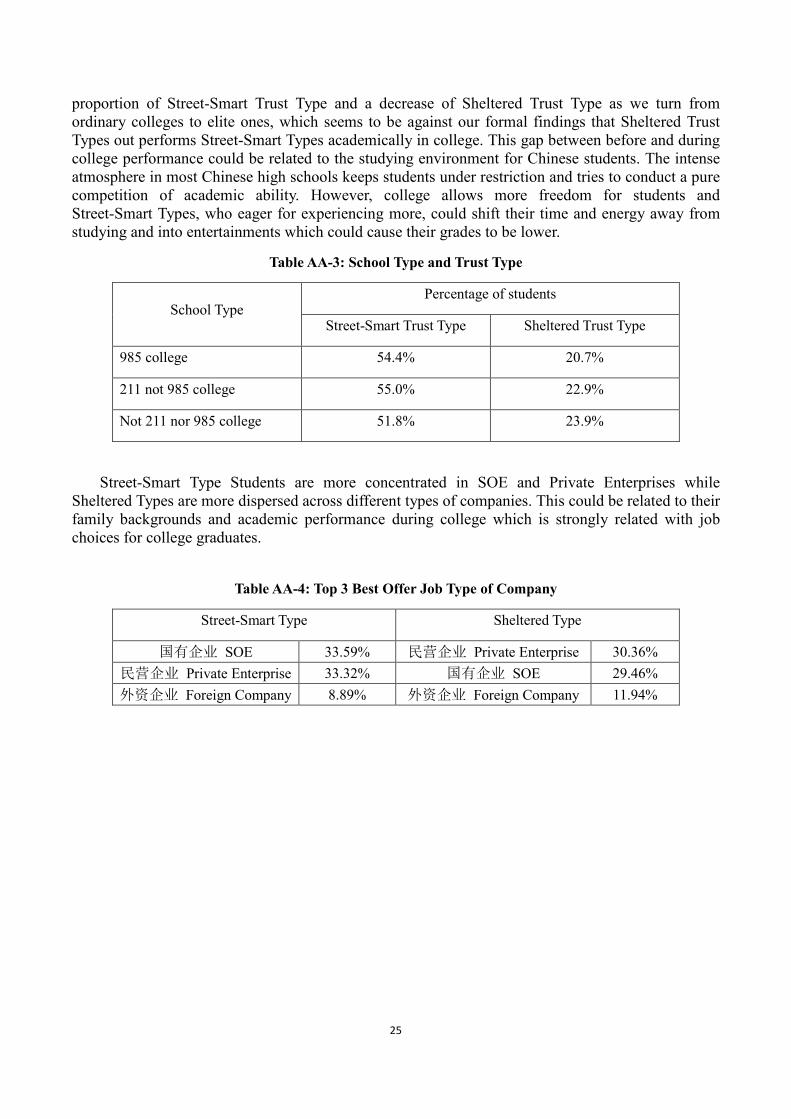
Considering the type of the school the students entered, we find a slight increase in the
25
proportion of Street-Smart Trust Type and a decrease of Sheltered Trust Type as we turn from ordinary colleges to elite ones, which seems to be against our formal findings that Sheltered Trust Types out performs Street-Smart Types academically in college. This gap between before and during college performance could be related to the studying environment for Chinese students. The intense atmosphere in most Chinese high schools keeps students under restriction and tries to conduct a pure competition of academic ability. However, college allows more freedom for students and Street-Smart Types, who eager for experiencing more, could shift their time and energy away from studying and into entertainments which could cause their grades to be lower.
Table AA-3: School Type and Trust Type
School Type Percentage of students
Street-Smart Trust Type Sheltered Trust Type
985 college 54.4% 20.7%
211 not 985 college 55.0% 22.9%
Not 211 nor 985 college 51.8% 23.9%
Street-Smart Type Students are more concentrated in SOE and Private Enterprises while Sheltered Types are more dispersed across different types of companies. This could be related to their family backgrounds and academic performance during college which is strongly related with job choices for college graduates.
Table AA-4: Top 3 Best Offer Job Type of Company
Street-Smart Type Sheltered Type
国有企业 SOE 33.59% 民营企业 Private Enterprise 30.36% 民营企业 Private Enterprise 33.32% 国有企业 SOE 29.46% 外资企业 Foreign Company 8.89% 外资企业 Foreign Company 11.94%

26
Appendix B: Empirical Robustness Checks
The following Tables AB-1 through AB-3 repeat the main analysis, while including educational performance control variables. The main results for trust measures as well as Trust Types remain robust.
Table AB-1: Ordered Logit Model with education controls; Dependent Variable: Trust Measurements
Dependent Variable General Trust Stranger Trust Wallet Trust
Male -0.181*** (0.0536)
-0.169*** (0.0549)
-0.160*** (0.0519)
-0.179*** (0.0537)
1.014*** (0.0615)
1.025*** (0.0633)
1.009*** (0.0594)
1.016*** (0.0615)
0.148*** (0.0494)
0.110** (0.0505)
0.111** (0.0482)
0.149*** (0.0495)
Party membership
0.110** (0.0558)
0.114** (0.0561)
0.109** (0.0541)
0.112** (0.0565)
0.0443 (0.0594)
0.0115 (0.0592)
0.0450 (0.0564)
0.0416 (0.0601)
-0.121** (0.0527)
-0.0896* (0.0526)
-0.0693 (0.0508)
-0.114** (0.0532)
ln household income
0.181*** (0.0620)
0.173*** (0.0643)
0.176*** (0.0614)
0.181*** (0.0620)
0.217*** (0.0664)
0.197*** (0.0690)
0.224*** (0.0659)
0.218*** (0.0665)
-0.0303 (0.0559)
-0.0288 (0.0577)
-0.0352 (0.0554)
-0.0312 (0.0560)
Home in rural area
-0.0347 (0.0261)
-0.0328 (0.0277)
-0.0328 (0.0258)
-0.0347 (0.0261)
-0.00748 (0.0280)
0.00254 (0.0291)
0.00350 (0.0277)
-0.00781 (0.0279)
-0.00723 (0.0219)
-0.00651 (0.0235)
-0.0136 (0.0216)
-0.00670 (0.0219)
Only child -0.00187 (0.0603)
-0.0213 (0.0629)
0.000329 (0.0597)
-0.00391 (0.0603)
-0.146** (0.0646)
-0.186*** (0.0679)
-0.154** (0.0641)
-0.149** (0.0647)
0.133** (0.0548)
0.139** (0.0576)
0.135** (0.0544)
0.134** (0.0549)
Top 20% in college
-0.0178 (0.0546)
-0.0167 (0.0550)
-0.0248 (0.0594)
-0.0208 (0.0595)
0.183*** (0.0505)
0.178*** (0.0507)
CEE score 0.0102 (0.0279)
0.0421 (0.0289)
0.00970 (0.0251)
985 schools 0.0255 (0.0735)
0.0393 (0.0744)
0.0691 (0.0792)
0.0865 (0.0803)
-0.0958 (0.0684)
-0.0753 (0.0691)
211 non 985 schools
-0.0441 (0.0573)
-0.0484 (0.0581)
-0.0515 (0.0605)
-0.0309 (0.0611)
-0.0315 (0.0524)
-0.0176 (0.0531)
Observations 6,136 5,671 6,263 6,136 6,129 5,666 6,255 6,129 6,043 5,584 6,162 6,043 Robust standard errors in parentheses; *significant at 10% level; **significant at 5% level;*** significant at 1% level;

27
Table AB-2: Coefficients of Trust Measures on Students’ Characteristics (with education controls)
Dependent Variable General
Trust Stranger
Trust Wallet Trust
Influential individuals while making college choice
parents○b 0.0986*** Individual him/herself○b -0.0798*** Rank(self, friend) – rank(others) ○c 0.0847** -0.110*** Rank(self) – rank(parents) ○c -0.174*** Rank(self) – rank(others) ○c 0.0922* -0.126***
Academic performance during college
Rank in top 20% in college○a Rank in bottom 20% in college○a GPA○c 0.0239* 0.0188** Academic score (out of 100) ○c Failed at least one course during college○a
0.129** -0.0860**
Working experience during college
Work-study on campus○a 0.0972* Work off campus○a 0.182*** Internship○a 0.0695* 0.0857*
Attitudes towards relationship
Dating someone currently○a -0.0806* -0.0777* -0.0839*** Housing before marriage is essential○a -0.141*** -0.107** -0.0532*
Time allocation during college (percentage)
Sports○c 0.00205* 0.00147**
Internet surfing○c -0.00479***
Entertainments○c -0.00273** Habits and customs
Never smoke○a 0.138*** 0.139*** Smoking currently ○a -0.148***
Living expenditure during college○c -29.22* 17.64* Job choice after graduation
Attendance at civil test○a 0.191*** 0.154*** Attempted to look for a job○a 0.108** -0.0865**
Attitude towards next generation
Do not want any children○a -0.204** -0.257*** Want more than 2 children○a 0.0896*
Satisfaction score on college life
Academic score○b 0.177*** Social interaction○b 0.221*** 0.0585** Interpersonal relationships○b 0.161*** 0.0514* Overall○b 0.323*** 0.0815***
*significant at 10% level; **significant at 5% level;*** significant at 1% level; Notes: 1. We apply the appropriate model depending on the format of the dependent variable. For dependent variables which are dummy variables, logit model is applied (marked as ○a), for ordered categorical variables, a ordered logit model is applied (marked as ○b), for continuous variables, a linear model is applied (marked as ○c) 2. All regressions control for gender of the student, party membership of the students (except for the regression on party membership), ln household income, whether student’s home place is in rural area, whether the student is the only child in the family, and whether student ranked in the top 20% in college (see Table AB-1).

28
Table AB-3: Coefficients of Trust Types on Students’ Characteristics (with education controls)
DEPENDENT VARIABLES
Trust Types low general high stranger
high general low stranger
low general high wallet
high general low wallet
low stranger high wallet
high stranger low wallet
SHELTERED TRUST
STREET-SMART TRUST
Influential individuals while making college choice
Parents○b 0.144** -0.149** -0.130*** Individual him/herself○b -0.110* Rank(self, friend) – rank(others) ○c -0.164*** 0.141*** Rank(self) – rank(parents) ○c -0.262*** 0.207*** Rank(self) – rank(others) ○c -0.159** 0.122*
Academic performance during college
Rank in top 20% in college○a Rank in bottom 20% in college○a -0.278* GPA○c -0.106** Academic score (out of 100) ○c Failed at least one course during college○a 0.183***
Working experience during college
Work-study on campus○a Work off campus○a -0.326** 0.125** Internship○a -0.139** -0.316** 0.165**
Attitudes towards relationship
Dating someone currently○a -0.164** 0.102*
Time allocation during college (percentage)
Internet surfing○c -0.00796** Entertainments○c -0.00530**
Habits and customs Never smoke○a -0.135* -0.213*** Smoking currently ○a -0.527* 0.200**
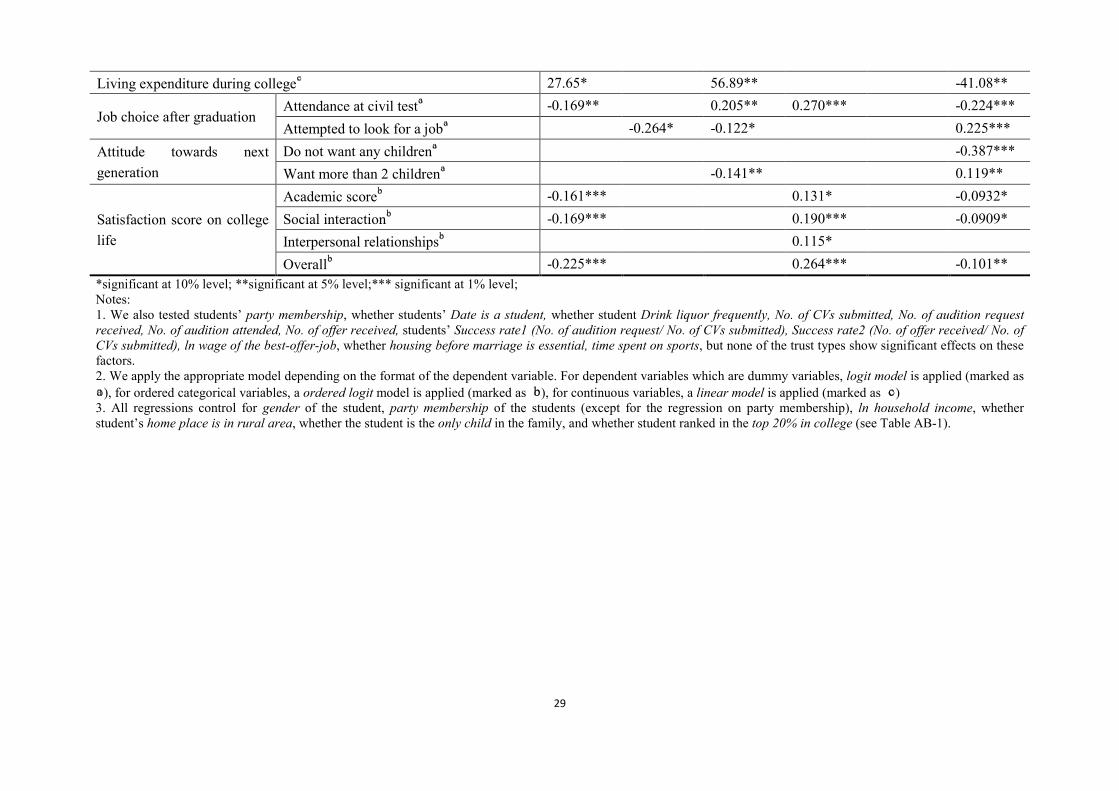
29
Living expenditure during college○c 27.65* 56.89** -41.08**
Job choice after graduation Attendance at civil test○a -0.169** 0.205** 0.270*** -0.224*** Attempted to look for a job○a -0.264* -0.122* 0.225***
Attitude towards next generation
Do not want any children○a -0.387*** Want more than 2 children○a -0.141** 0.119**
Satisfaction score on college life
Academic score○b -0.161*** 0.131* -0.0932* Social interaction○b -0.169*** 0.190*** -0.0909* Interpersonal relationships○b 0.115* Overall○b -0.225*** 0.264*** -0.101**
*significant at 10% level; **significant at 5% level;*** significant at 1% level; Notes: 1. We also tested students’ party membership, whether students’ Date is a student, whether student Drink liquor frequently, No. of CVs submitted, No. of audition request received, No. of audition attended, No. of offer received, students’ Success rate1 (No. of audition request/ No. of CVs submitted), Success rate2 (No. of offer received/ No. of CVs submitted), ln wage of the best-offer-job, whether housing before marriage is essential, time spent on sports, but none of the trust types show significant effects on these factors. 2. We apply the appropriate model depending on the format of the dependent variable. For dependent variables which are dummy variables, logit model is applied (marked as ○a), for ordered categorical variables, a ordered logit model is applied (marked as ○b), for continuous variables, a linear model is applied (marked as ○c) 3. All regressions control for gender of the student, party membership of the students (except for the regression on party membership), ln household income, whether student’s home place is in rural area, whether the student is the only child in the family, and whether student ranked in the top 20% in college (see Table AB-1).