street damage restoration fee study - los angeles
TRANSCRIPT

Street Damage Restoration Fee Study
Testing Portion
City of Los Angeles
Department of General Services
Bureau of Street Services
Shahin and Associates
March 2017

Forrn GS STD 91 i CITY OF LOS A'-/GELES
DEPARTMENT OF GENERAL SERVICES
Lab No.: 17-702-1703 to 1780 17-741-031 to 264
Rec·d: 10/03/16 Rcp'd: 03/ 24/17
Mr. Nazario Sauceda. Director
STANDARDS DIVISION 2319 DORRIS PLACE
LOS ANGELES, CA 90031 (213) 485-2242
FAX (213) 485-5075
Public Works/ Bureau of Street Services
Attn: Keith Mozee, Assistant Director Cc: Steve Chan, BSS Pavement Management
Dr. Mo Shahin. BSS Consultant Dr. James Crovetti
Test Report of Los Angeles Street Damage Restoration Fee (SDRF) Update Study
At the request of the Bureau of Street Services. Standards Division of the Department of General Services conducted pavement testing, analysis and overlay designs for the Los Angeles Street Damage Restoration Fee Update Study. The project was developed and conducted under the guidance of Dr. Mo Shahin, an Engineering Consultant retained by the Bureau of Street Services. Testing was performed on trenched street sections as provided by Dr. Shahin. Seventy-eight (78) sections were qualified for the study from a total of one hundred and twenty-two ( 122) street sections analyzed.
The Falling Weight Deflcctometer (FWD), Geoprobe equipment and a core cutter were used to complete the testing portion for this study. The FWD was used to determine both the deflections of the existing asphalt concrete pavement of the street sections tested and the extent of damage caused by the utility trench to the surrounding area. The Geoprobe equipment was used to conduct a soil investigation of the subgrade in order to determine soil type and penetration resistance. A core cutter was used to cut pavement cores to determine asphalt concrete (J\C) pavement.thickness of the street sections.
The AC overlay thickness designs and the total flexible pavement structures were then calculated for the patched and non-patched areas.
Included in this report are the testing data and related analysis for the study.
If you have any questions. please contact me or Mr. Ricardo Villacorta of my staff at (213) 485-2242.
Gener 1 Serviccs/Standar
Rl!S/RV:

Table of Contents
• Introduction ................................................................................................ l
• Trench Study Location Map ...................................................................... 2
• Procedure .................................................................................................... 3
• Pavement Deflections (FWD) .................................................................... 5
• Existing Pavement Thickness (Coring) ..................................................... 8
• Piezocone Penetration Testing ................................................................ 11
• Overlay Thickness Designs Required ...................................................... 13
• Area of Influence ...................................................................................... t 6
• Conclusion ................................................................................................ 18
Appendices
Appendix A: Overlay Thickness Design ...................................................... 19
Total Asphalt Concrete Thickness Design ............................. 28
Appendix B: Falling Weight Deflectometer Test Data ................................ 37
Determination of Area of Influence ..................................... 194
Appendix C: Piezocone Penetration Testing Data ..................................... 235

Introduction
At the request of the Bureau of Street Services of the Department of Public Works,
Standards Division of the Department of General Services has conducted testing research,
overlay design, and analysis for the Los Angeles Street Damage Restoration Fee update
study.
The project was developed and conducted under the guidance of Dr. Mo Shahin, an
engineering consultant retained by the Bureau of Street Services. The study was performed on
Select (high traffic) and Local (low traffic) streets. One-hundred and twenty two possible
sections (each section includes: utility-trenches & respective control areas) were chosen for
testing and from this total, seventy eight sections (thirty local and forty-eight select sections)
were qualified for the study.
The conditions of the qualified streets were essentially surveyed through two methods: A)
Pavement Condition Index (PCI) & B) Pavement Evaluation Testing. PCI (part A) was carried
out by Prof. Shahin' s team and Standards Division conducted all the testing required (part B) for
the study and detennined the overlay desi!:,JJlS for all the sections analyzed. In addition, attached
are conclusive graphs of the data collected during the update study.
The testing and analysis utilized during the study are as follows:
• The Falling Weight Deflectometer (FWD) was used to determine the deflections
of each trench (patched) and control (non-patched) areas. In addition, the FWD
also determined the extent of damage caused by the utility trench to the
surrounding area.
• Pavement cores were cut to determine the existing pavement structural thickness
in both areas.
• Piezocone Penetration Testing (CPTU) was perfonned to estimate the SPT (N60 )
values, pore pressure and type of soil underneath of each patched and non-patched
area.
• Overlay Thickness designs (DAR Win Pavement Design Program) were
performed for all sections including the utility trench and control area.
Included also is the approximate location of all the Local and Select SDRF sites in a City of LA
map. Please see below the location map ( Figure l ).

W.0.# SI 7 A0003
Legend 0 Local Site • = Select Site
SDRF Sites Location Map
Project Title:
City of Los Angeles Department of General
Services
Standards Division
STREET DAMAGE RESTORATION FEE
Figure l
2
March 2017

Procedure:
Before testing the designated locations, the PC] surveyor detennined two areas: A) The
control area and B) The trench area that comprised the utility-trench. Each area was no less than
1500 ft2• The control area did not have any trench inside of the determined area and was at least
l O ft. away from any other trench. The control area also met the following requirements:
a. All selected sections were flexible pavements (PCC pavements are excluded) and
both areas (trench & control) consisted of the same pavement structure, same
thickness, mix, and age.
h. Trench and control areas had the same traffic flow (same lane).
c. The control area was located as close as possible to the trench area and when it was
viable the control area was located immediately adjacent to trench area.
Cores were obtained with the following criteria:
a. Pavement thickness was determined: i) In the trench, ii) Outside the trench, and iii) In
the contro 1 area.
b. Cores in each site were located at equal distance from the curb face.
c. The difference in total pavement thickness between the control and outside trench
cores should be less than I in.
d. As many cores as necessary (minimum 2 cores) were cut in the "Control FWD testing
area'· to verify thickness consistency.
e. The pavement structure was similar in both areas including base.
Falling Weight Dcflectometer (FWD) criteria:
a. A minimum of eight deflections were measured on the joint around the trench. The
measurements were obtained by positioning the FWD loading plate so that the edge
of the plate was no more than 0.5 in. away from the joint of the trench. On 95% of
the locations the sensors fell parallel to this joint on very narrow streets; the sensors
fell perpendicular to the joint. It was noted that trench comers usually showed the
highest deflection.
b. One additional deflection was measured in the center of the trench for trench repair
evaluation purposes.
c. Eight deflections were measured in the control area along the same line as the coring
locations. The spacing between deflections depended on the size of the control area.
3

Deflection readings were taken at equal distance apart on control pavement area that
showed consistent pavement thickness with the tested trench area. If no consistency
of thickness was established, the tested control area was discarded and relocated.
Figure 2: Shows both Trench and Control area (S37)
Figure 3: Shows FWD to be measured in a control area with consistent Asphalt thickness structure.
4

Pavement Deflections (FWD)
A total of 2323 pavement deflection tests were perfonned during the project. Pavement
deflection is one of the required parameters necessary for pavement evaluation to determine the
pavement structural capacity and to calculate the pavement and overlay design. Deflections,
measured in thousandths of an inch (mils), were directly measured using a truck mounted Falling
Weight Deflectometer.
A truck mounted Foundation Mechanics model Jils 20T Falling Weight Deflectometer
(FWD) with an equivalent load of 9,000 pounds was used to measure the pavement surface
deflections of the existing asphalt concrete pavements in the trench (patched) and control (non
patched) areas. The FWD is a load-deflection device that applies an impulse load by dropping a
mass onto a circular load plate of 6 inches radius placed on the pavement surface to simulate a
moving wheel load. This device uses deflection transducers that measure the resulting pavement
deflections in the "deflection basin." One transducer is located at the center of the loading plate,
with the remaining six transducers spaced at intervals of 8, 12, 18, 24, 36, and 60 inches from the
center of the plate.
The FWD survey was perfonned by measuring nine (9) pavement deflections in each
trench area ( one inside the trench and eight at the outside edge of the trench) and eight (8)
deflections in the corresponding control area. The pavement deflection measurements were
determined in accordance with ASTM Designation: D 4695 03.
The measurements obtained are presented in Appendix B. All deflection measurements
were normalized to 9 kips and 68° F using AASHTO Guide for Design of Pavement Structures
1993, AC Temperature Adjustment Factor Table (Figure 5.6, pg. 111-99).
Accumulated deflection, Do (Normalized to 9 Kips and 68° F) of Local Trenches and
respective Controls clearly shows higher accumulated deflection on trenches than controls. The
values are 560 mils and 398 mils, correspondingly. The same observation is seen in Select
Trenches vs. Controls where the values are 504 mils and 334 mils, respectively (See Figure 4).
The average nonnalized deflection (Do) of Local Trenches was 41 % higher than their
corresponding Control. The average nonnalized deflection (00) of Select Trenches was also 51 %)
higher than their corresponding Control (See Figure 5). This shows that the pavement
surrounding each trench has been weakened more than the rest of the pavement section, thereby
accelerating pavement failure under traffic. It was also observed that the damage was higher
among select streets than local streets. 5

,_ ~ .E ,_, .. 0 c
.S: -"' " C
" 0 "'O
" -!! ::i E ::i ..... <;,;
~
,-.
.: ... = -Q c:: .: -(.I Q;
C Q;
Q Q; 01 = i.. Q; ;.. <
Accumulated Normalized Deflection, D0 (mils) for Local & Select Sites
600 ~-----~
soo
400
300
200
0
1111 Select. Control • Select. Trench • Local. Control 1111 Local. Trench
LocaL Trench
Local. Control 397 89
Figure 4
Average Normalized Deflection, D0 (mils) for Local & Select Sites
20
18
16
J.l
I 2
10
8
6
.J
., -
() Control
Local
18.68
Trench
Figure 5
6
Control
Select
10.50
Tr~nch
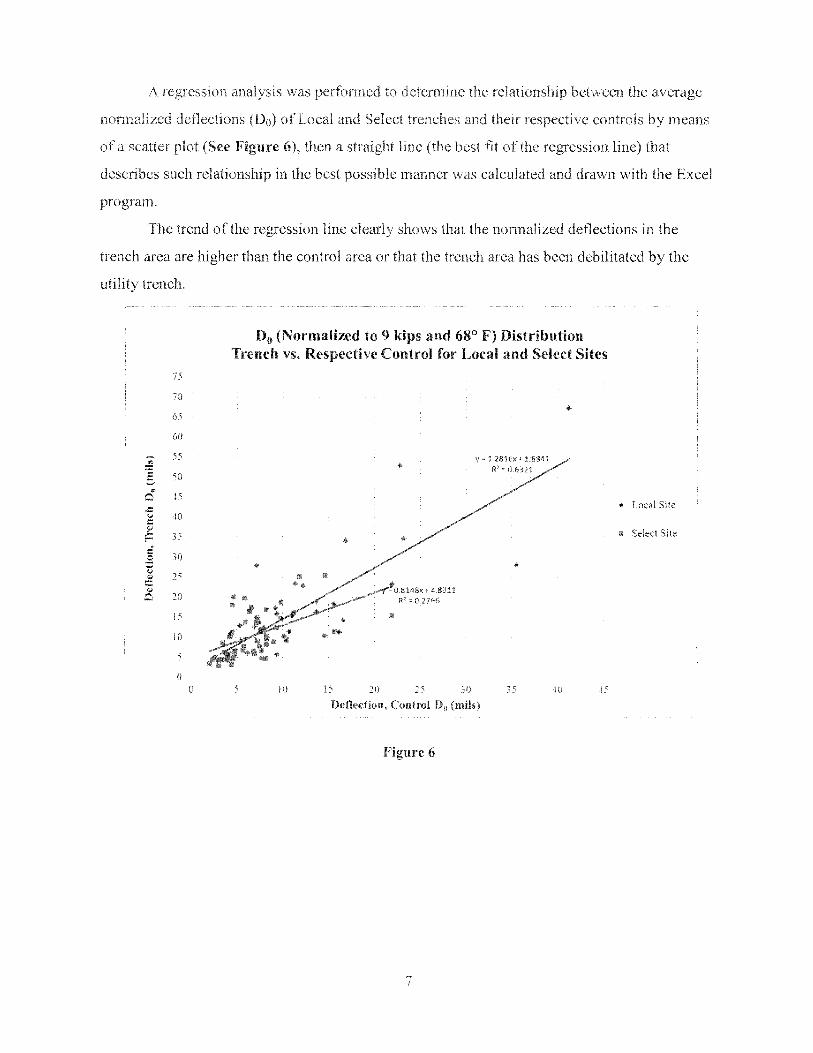
A regression analysis was performed to detennine the relationship between the average
nonnalized deflections (D0) of Local and Select trenches and their respective controls by means
of a scatter plot (See Figure 6 ), then a straight line (the best fit of the re6,ression line) that
describes such relationship in the best possible manner was calculated and drawn with the Excel
program.
The trend of the regression line clearly shows that the normalized deflections in the
trench area are higher than the control area or that the trench area has been debilitated by the
utility trench.
7,
70
6'
60
'"' ~ 55
·e ,o --• 0 15 .t::.
"' -IO C l:::
35 E-r:
30 -E "' 25 "' C i;,
0 20
I~
10
' ()
0
D0 (Normalized to 9 kips and 68° F) Distribution Trench vs. Respective Control for Local and Select Sites
•
JO i' 20 ,o lO t5
Ddle1:tion, Control D0 (mils)
Figure 6
7
• Local Site
• Select Site
Existing Pavement Thickness (Coring)
Existing structural pavement thickness was also determined in order to find out if utility
trenches were properly overlaid to match the original pavement thickness structure and to
calculate the overlay thickness design for both areas. The pavement thickness for each trench
and respective control was determined by coring and are shown in Appendices B & C.
A total of four-hundred-eighteen ( 418) cores were cut for this entire investigation. Pavement
cores were cut using an Acker Model PT-22 truck-mounted core cutter with an eight-inch core
bit and Geoprobe Model 6600.
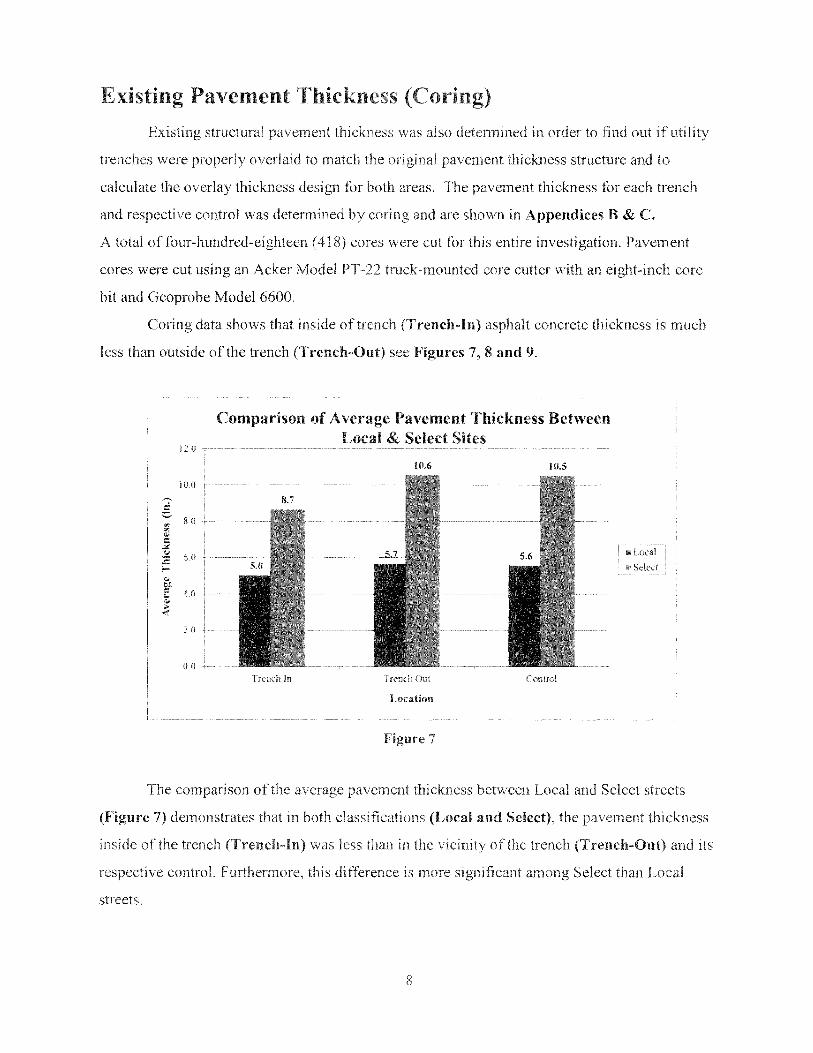
Coring data shows that inside of trench (Trench-In) asphalt concrete thickness is much
less than outside of the trench (Trench-Out) see Figures 7, 8 and 9.
12 u
JOO ,_ C: ._,
80 "' ., 0 C: ~ .: 60 . ~ 0 CL
£! '0 0
~ 2 0
00 ~
Comparison of Average Pavement Thickness Between Local & Select Sites
8.7
Trench In
10.6
Trench Out
Location
Figure 7
10.S
Control
f 1111.ocal
• Sdect
The comparison of the average pavement thickness between Local and Select streets
(Figure 7) demonstrates that in both classifications (Local and Select), the pavement thickness
inside of the trench (Trench-In) was less than in the vicinity of the trench (Trench-Out) and its
respective control. Furthermore, this difference is more significant among Select than Local
streets.
8

,_
= ._,
"' "' "' C ~ y
:c r-u < -= 0 ---= --= <;> C <;> ...
f,-
AC Thickness Distribution Trench In & Trench Out vs. Respective Control for Local Sites
10
9
8
6
~
•
:; •
2 •
2 '
• ...
•
•
• •
•
•
•
6
Control AC Thickness (in.)
Hgure 8
! U3-4c~,~009'q R: (:9Jj,;l
:, O -l96to, · 2 -'~0~ R- £11L~~
•
s 9
• Lorn! Sik, 1 rend, In ,,, Control
• Local Sit.:, 1reuch Out ,,, Control
-1.incar (I ncal Site, T'rcrn:h 111 , , Comro!J
-LinC'ar /L<ll:al Site, Trend10ut vs Co111ro!)
The simple linear regression analysis of pavement thickness distribution among inside of
trench (Trench-In), out of the trench (Trench-Out) and respective control area (Figures 8 & 9),
displays basically a relationship of l to 1 thickness between Trench-Out and Control area for
both classifications (Local and Select). However the regression analysis between Trench-In and
Control in both classifications are not conclusive due to the inconsistency of the trench repair,
which indicates that utility trenches were not properly restored to match the original pavement
thickness structure.
9

20
~18 .5 -"' "' ~ 16
.:,;: ,:.,;
:a f--14 -= 0J ,... ~ 12 > c,:: ~
"'; 10
0 --= -.c 8 ,:.,; C 0J
r= 6
4 l
Pavement Thickness Distribution Trench In & Trench Out vs. Respective Control for Select Sites
6
•
•
y 0.9553•, 0.4635 R1 0.8'l5'l
•
y 0.297x• ~.3431 R' • 0.0847
• • ••• ••
• •
8 10 12 11 16
Control Pa,·ement Thickness (in.)
Figure 9
18
<11 Select Site. Trench In YS Control
.1. Select Sit<? . Trench Out \'S Control
-Linear (Select Site. Trench In \'S Control)
-Linear (Select Site . Trench Out \'S Control)
Figure IO: Existing pavement thickness detennination Trench-in & Trench-out.
10

Piezocone Penetration Testing
Two hundred- thirty- four (234) CPTU Piezocone Penetration Test soundings were
performed and data was collected to a depth of two (2) feet unless refusal depth was reached
(See Appendix C). The CPTU soundings were conducted using a truck-mounted Geoprobe
Model 6600 and a 20 ton capacity cone with a base area of l O cm2 and a friction sleeve of 150
cm2 located above the Piezocone.
N60 is a parameter classically determined from SPT blow counts and provides an
indication of the relative density and strength of the soil. In this study, N60 is a calculation
resulting from pushing a Piezocone, or cone penetrometer with pore pressure measurement
through the undisturbed soil underneath the pavement and recording data with a computer
program. A comparison average of N60 values for Local and Select trenches and respective
controls are presented in Figure 11.
Comparison of Average N60 for Local and Select Sites
35
32
30 28 28 • Local.
Trench !Jl • Local.
<:., ;s Trench Out ~ Ill Local. '$ Control ~ 20 • Selc:ct. "' z. Trench In
'-' Ill Sekel. ~ 1~)
I.. Trench ()m '-' II Select. .. ~ 10 Control
,,
()
Trench Trench Comrol Trench Trench Contro
Local Select
Figure 11
In this comparison, both classifications exhibit the Control N60 values higher than the
Trench-Out which indicates that the utility trench disturbed and debilitated the strength of the
soil under the adjacent pavement. Furthermore, it was determined that 30% of Local and 25% of
Select trenches were treated with liquefied soil cement slurry, consequently improving the
average of the N60 Trench-In values compared with their respective Controls.
11

Additional parameters in this dynamic procedure includes measurement of tip resistance
(qc). sleeve friction (fs), and pore water pressure (U2), These measurements determine soil
stratigraphy and corrected SPT energy ratio N60 values. This is all done by operating the
computer programs CPT-log and CPT-pro. On a few occasions, the trench is backfilled with
cemented sand, which is extremely hard. While we are unable to penetrate this layer with the
cone, we were able to penetrate the subgrade below the outside edge of the trench. We found
that N60 values of the subgrade below the outside edge of the trench are lower than the N60 values
of the suhgrade in the control. This means that the disturbance of the soil caused by the
excavation of the trench has weakened the surrounding sub grade, which will cause premature
failure of the pavement adjacent the trench.
The Piezocone takes measurements at 2 cm intervals of bearing resistance ( qc), unit
sleeve friction resistance (fs), and pore pressure behind cone (U2). All CPTU soundings were
performed in accordance to ASTM D-5778 Standard Test Method for Performing Electronic
Friction Piezocone Penetration Testing of Soils.
All CPTU data was collected by a wireless CPTU cone (serial No. 4130, calibrated on
07/22/2016, traceable to NIST) manufactured by Geotech AB Company. Soil classification is
based on Rf ( friction ratio) and qt ( corrected cone resistance), Robertson 1986, using CPT-pro
software by Geosoft company.
The measurements that we obtained are presented in Appendix B, with their
corresponding graphical CPTU test results.
Below is a summarized table with percentages of different classification of soils
encountered under pavement structures in both groups.
Table J
Local Streets
Classification Sand Silty-Sand Sandy-Silt Clayey- Sensitive
Silt Fine-Grained
Sites 8 5 4 2 11
Percentage 27 17 13 7 37
Select Streets
Classification Sand Silty-Sand Sandy-Silt Clayey- Sensitive
Silt Fine-Grained
Sites 15 14 9 0 10
Percentage 31 29 19 0 21
12
Total
30
100
Total
48
100

Overlay Thickness Designs Required
A total of one-hundred-fifty-six ( 156) overlay thickness designs and ( l 56) Flexible
Pavement designs were calculated. Overlay thickness design is the required addition of
compacted Hot Mix Asphalt (HMA) to an existing pavement in order to sustain predicted
repeated structural loading from traffic over the design life of the pavement.
The overlay and pavement designs were detennined utilizing the 1993 AASHTO Guide
for Design of Pavement Structures, AASHTOWare DARWin 3.l Pavement Design, Analysis
& Rehabilitation for Windows computer sofhvare. The average mid-depth temperature was
calculated based on BELLS3 (Routine testing methods) by using a computer program in which
the computer source code is provided by FHW A.
Accumulated Owrlay Thickness Design for Local and Select Sites
201.9
,. :; ,: ltAI ~ .,,. .... ._. .. ,
!m.9
0
toral Sites Sckct Sites
Figure 12
The accumulated overlay thickness design, in inches, for Local and Select trenches and
their respective control areas are presented in Figure 12. In both street classifications, the
accumulated required thickness design is significantly higher in the Trench area than the Control
area (98% higher for Local & 79% higher for Select).
13

In addition, the average overlay thickness design has also been calculated to illustrate how the
weakness inflicted in the pavement by the utility trench has to be restored with ""additional
thickness structure'· to meet traffic demands when compared with the control average overlay
thickness design required to meet such demands (see Figure 13). Using this figure we conclude
that the Local trench areas require an average of 0.84 inches more structure than its respective
control and an average of l.86 inches more structure is required for the Select trench area than its
respective control. This means that the trench's surrounding pavement has been negatively
affected by the excavation of the trench, and the effects are very significant and costly in order to
remediate the damage caused by the trench in bringing the structure back to its original capacity.
A\'erage Overla~· Thickness Design Required For Local & Select Sites
4,:U I ,o
--C: I 00 -C: ~, ' '0 7.
" C , 011 ;,I!; ::it;
" ,.. ~ '0 :2 -
J! 1.70 .:
~ on ;~ ;: l ~tJ ... .,. ..... - I 00
" S! C 0 ,,, ;:,
"' .,,,, II Oil
(t,.•11d1 ( \1nth,I ! 1~·1,ch ( oHtr,,I
l.ocal Sites Select Sill's
Figure 13
14
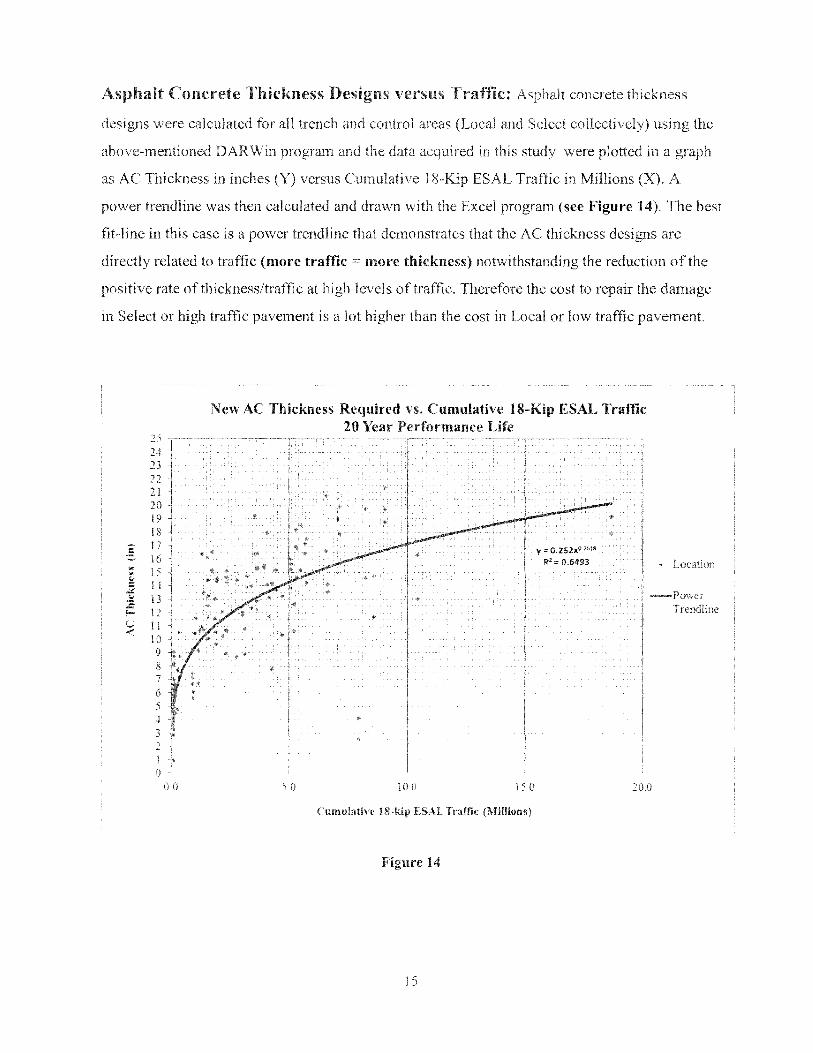
Asphalt Concrete Thickness Designs versus Traffic: Asphalt concrete thickness
designs were calculated for all trench and control areas (Local and Select collectively) using the
above-mentioned DARWin program and the data acquired in this study were plotted in a graph
as AC Thickness in inches (Y) versus Cumulative 18-Kip ESAL Traffic in Millions (X). A
power trendline was then calculated and drawn with the Excel program (see Figure 14). The best
fit-line in this case is a power trendline that demonstrates that the AC thickness designs are
directly related to traffic (more traffic= more thickness) notwithstanding the reduction of the
positive rate of thickness/traffic at high levels of traffic. Therefore the cost to repair the damage
in Select or high traffic pavement is a lot higher than the cost in Local or low traffic pavement.
2" 2~ 1' ~·' n 21 20 19 18
g 17 16
"' 15 "' ,:; C l.t
:.& .Si: 13 .:::: ,.. 12 w l I ~
10 9 8 7 6 • . 5 .j
3 2 I i
I
0 I
()()
New AC Thickness Required vs. Cumulative 18-Kip ESAL Traffic 20 Year Performance Life
. • • .. • .
" • • •
• • • ... .,, V = 0.2S2x0·2618
R' 0.6493 ...
• •
.. • .
.. • •
.. .
10.0
Cumulative 18-kip ESAL Traffic (.\ii!lions)
Figure 14
15
• Location
I -Power Trendline
20 0

Area of Influence
A few trenches were also selected for Area of Influence determination. Starting at the
edge of each trench, deflections were measured one foot apart, moving away from the edge until
the change in deflection from the previous deflection reached near-zero. The purpose of this
testing was to detennine the distance away from each trench where the subgrade was found to be
unaffected by the utility cut. The area from the edge of the trench to where change in deflection
is near-zero is called the Area of Influence. It was determined that the area of influence
fluctuates between 8 to no more than l O feet. (See figures 15, 16, 17, and 18)
Figure 15: Area ofinfluence Select Trench No. 74
16

Trench
1.:
II
j(l
9
0
Deflection Do (Normalized to 9 kips & 68°F) vs. Distance from Trench
Pavement
I>lstanc~ from lrench (fl.)
J(I
Figure 16 Determinations of ·'Area oflnfluence'· for Select Trenches No. 8 & 37
Sub-grade
Figure 17: Sketch of Area of Influence under pavement.
17

10'
S.b-grad~ I
I OldT<L J
Owrlapplng Area JI of IaOaeace
L_ ,--~··-·-··
I
I
I
I I I I
I
\ I ~e~-~r~~~~J
10'
Figure 18: Sketch of Overlapping Area oflnfluence under pavement.
Fi,brures 17 & 18 show that regardless of the life of asphalt concrete pavement, utility cuts
weaken the underlying sub grade of the pavement thus requiring a thicker overlay.
Conclusion
Based on all the tests and analysis performed in this study, it is evident that there is
significant damage inflicted by utility trenches to the adjacent pavement structures and
underlying sub grade. Regardless of the age of the asphalt concrete pavement, the damage to the
underlying subgrade of the pavement adjacent to the utility cuts remains significant;
consequently, the overlay thickness design to repair such damage practically doubled the overlay
thickness design required on the non-patched area as intended for future trafiic in the same
section.
Furthermore, the study indicated that utility trenches were not properly restored to match
the original pavement condition. It is also evident that the damage and the repairs on higher
traffic streets (Select) due to utility trenches are higher and therefore, costlier than low traffic
streets (Local).
Appendices
18