streams tributary to onondaga lake biological assessment
TRANSCRIPT
Division of Water
Streams Tributary to Onondaga Lake Biological Assessment
2008 Survey
New York State Department of Environmental Conservation
From the digital collections of the New York State Library.

From the digital collections of the New York State Library.
BIOLOGICAL STREAM ASSESSMENT
Streams Tributary to Onondaga Lake Onondaga County, New York
Seneca-Oneida-Oswego River Basin
Survey date: June 24-26, 2008 Report date: January 1, 2010
Alexander J. Smith Lawrence E. Abele Diana L. Heitzman
Brian Duffy
Stream Biomonitoring Unit Bureau of Water Assessment and Management
Division of Water NYS Department of Environmental Conservation
Albany, New York
From the digital collections of the New York State Library.

From the digital collections of the New York State Library.
Table of Contents
Background ..................................................................................................................................... 1 Results and Conclusions ................................................................................................................. 1 Discussion ....................................................................................................................................... 2
Onondaga Creek .......................................................................................................................... 2 Sawmill Creek ............................................................................................................................. 4 Ninemile Creek ........................................................................................................................... 4 Geddes Brook ..............................................................................................................................5 Ley Creek .................................................................................................................................... 6 Harbor Brook .............................................................................................................................. 6 Bloody Brook .............................................................................................................................. 7
References ....................................................................................................................................... 7 Table 1. Station Locations .............................................................................................................. 9 Figure 1. Overview Map, sampling locations on Onondaga Creek .............................................. 12 Figure 1a-f. Station Maps, Onondaga Creek ................................................................................ 13 Figure 2. Overview Map, sampling locations on streams tributary to Onondaga Lake ............... 19 Figure 2a-e. Station Maps, sampling locations on streams tributary to Onondaga Lake ............. 20 Figure 3. Biological Assessment Profile (BAP) of Index Values ................................................. 25 Table 2. Overview of Field Data................................................................................................... 26 Table 3. Impact Source Determination (ISD) ............................................................................... 27 Figure 4. Results of Substrate Pebble Counts for Onondaga Creek ............................................. 28 Table 4. Macroinvertebrate Data Reports (MDR) ........................................................................ 29 Table 5. Laboratory Data Summary .............................................................................................. 43 Table 6. Field Data Summary ....................................................................................................... 46 Appendix I. Biological Methods for Kick Sampling .................................................................... 49 Appendix II. Macroinvertebrate Community Parameters ............................................................. 50 Appendix III. Levels of Water Quality Impact in Streams ............................................................51 Appendix IV-A. Biological Assessment Profile: Conversion of Index Values to a 0-10 Scale ... 52 Appendix IV-B. Biological Assessment Profile: Plotting Values ................................................ 53 Appendix V. Water Quality Assessment Criteria ......................................................................... 54 Appendix VI. The Traveling Kick Sample ................................................................................... 55 Appendix VII-A. Aquatic Macroinvertebrates Usually Indicative of Good Water Quality ......... 56 Appendix VII-B. Aquatic Macroinvertebrates Usually Indicative of Poor Water Quality .......... 57 Appendix VIII. The Rationale of Biological Monitoring ............................................................. 58 Appendix IX. Glossary ................................................................................................................. 59 Appendix X. Methods for Calculation of the Nutrient Biotic Index ............................................ 61 Appendix XI. Impact Source Determination Methods and Community Models ......................... 64 Appendix XII. Biological Impacts of Waters with High Conductivity ........................................ 70 Appendix XIII. Methods for Collecting Biological Samples and Assessing Water Quality Using Net Jabs in Slow, Sandy Streams .................................................................................................. 71
From the digital collections of the New York State Library.

From the digital collections of the New York State Library.
1
Streams: Onondaga Creek, Sawmill Creek, Ninemile Creek, Ley Creek, Harbor Brook, Geddes Brook, and Bloody Brook River Basin: Seneca-Oneida-Oswego Reach: Multiple, in the vicinity of Syracuse, NY Background
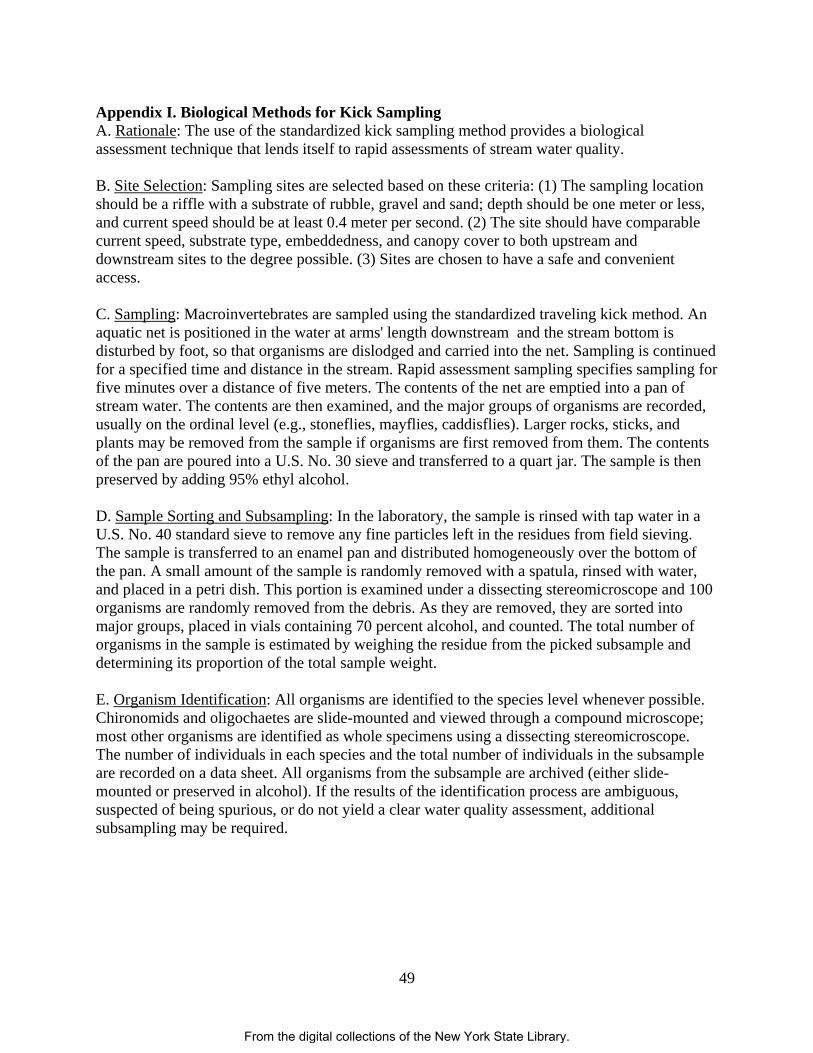
The Stream Biomonitoring Unit (SBU) sampled seven streams tributary to Onondaga Lake, Onondaga County, New York, on June 24 - 26, 2008. Sampling was conducted to assess current water quality conditions and compare findings to historical surveys, documenting changes in water quality. To characterize water quality based on benthic macroinvertebrate communities, either a traveling-kick or net-jab sample was collected, depending on habitat, at each of fourteen sites on seven streams (Onondaga Creek, Sawmill Creek, Ninemile Creek, Ley Creek, Harbor Brook, Geddes Brook, and Bloody Brook). Methods used are described in the Quality Assurance Work Plan for Biological Stream Monitoring in New York State (Bode et al. 2002) and summarized in Appendix I. Each sample was field-inspected to determine major groups of organisms present, and then preserved in alcohol for laboratory inspection of 100-specimen subsamples from each site. Macroinvertebrate community parameters used to determine water quality included: species richness, biotic index, EPT richness, and, for traveling-kick samples, percent model affinity. The parameter non-Chironomidae/Oligochaete richness replaced percent model affinity for net-jab samples (see Appendices II and III). The expected variability of results is stated in Smith and Bode 2004. Table 1 provides a listing of sampling sites, and Tables 4a - 4n provide a listing of all species collected at each sampling location in the present survey. This is followed by field and laboratory data summaries, including raw data from each site. Results and Conclusions
1. Water quality in streams tributary to Onondaga Lake ranged from slightly impacted to moderately impacted; historical sources of pollution still affect the biological community.
2. In Onondaga Creek, water quality is affected by nutrients, siltation from the Tully Valley
Mud Boils, and urban runoff, including sewage. 3. Water quality in the remaining tributaries reflects the urban nature of the drainages.
Sources of impact are likely a complex mixture of urban runoff, including municipal and industrial sources. Some improvements in water quality were noted compared to historical surveys.
From the digital collections of the New York State Library.
2
Discussion
Pollution in streams tributary to Onondaga Lake, Syracuse, NY, and its effects on lake water quality, have long been of concern to the New York State Department of Environmental Conservation (NYSDEC) Division of Water (Cooper et al. 1974, Simpson 1981, Bode et al. 1989, Bode et al. 2004, Mueller and Estabrooks 2006). Currently, several portions of Onondaga Lake tributaries–Ley Creek, Geddes Brook, Ninemile Creek, and Harbor Brook–are listed as Superfund sites in a 2005 Record of Decision (ROD) published by NYSDEC and the United States Environmental Protection Agency (USEPA). The ROD outlines specific plans for cleanup of Superfund sites in and around the lake (NYSDEC 2005a; NYSDEC 2005b). These plans are designed to reduce or eliminate exposure to chemicals in the lake, such as polychlorinated biphenyls (PCBs), polycyclic aromatic hydrocarbons (PAHs), and mercury, many of which originate in its tributaries (NYSDEC 2005b). In addition to NYSDEC and USEPA, many other organizations are working to improve water-quality conditions throughout the Onondaga Lake watershed, and cleanup efforts continue to be highly visible.
This biological survey was conducted to assess current water-quality conditions and compare them to historical NYSDEC surveys (Cooper et al. 1974, Simpson 1981, Bode et al. 1989, Bode et al. 2004), documenting any changes in water quality. In addition, the data collected will provide a baseline of comparison to conditions that exist after remedial actions are carried out by NYSDEC and its partners.
Unlike historical surveys, this survey collected net-jab samples at stream locations with habitat that was unsuitable for collecting kick samples. In order to properly analyze benthic macroinvertebrate communities, the sample collection method, water-quality metrics and water-quality scales used in sample analysis should be specific to the dominant stream habitat. Kick samples should only be collected from riffle habitats. In slow sandy streams, where riffle habitats do not exist, invertebrate fauna are different from those in riffles. As a result, using measures applicable to riffles will often reduce the accuracy of a water-quality analysis on a sample from a slow sandy stream.
Therefore, at streams where current was slow and substrates were primarily sand, silt and clay, a net jab was used for the collection of invertebrates, and “sandy streams” water-quality criteria were applied (Appendix XIII). Community metrics and water-quality scales applied differ from those used to analyze riffle habitats, resulting in more appropriate and realistic community and water-quality assessment information.
This change in sampling and assessment methods was applied to samples collected at Ninemile Creek Station 02, Geddes Brook Station 01, Ley Creek Station 02, Harbor Brook Station 02, and Bloody Brook Station 06.
Onondaga Creek
Onondaga Creek is one of the largest tributaries to Onondaga Lake. At approximately 285 km2 in drainage area, it flows 48 km northwest from the Tully Valley until it reaches Onondaga Lake in the City of Syracuse. It enters Onondaga Lake at the southeastern end via a channelized canal. Although Onondaga Creek flows directly through Syracuse 54% of its watershed area is forested. Water quality in the lower and middle reaches, including minor tributaries of the stream (mouth to Nedrow, NY) are impaired by combined sewer overflows (CSOs), urban runoff, and past industrial operations (NYSDEC 2008). Upstream of Nedrow, water quality in Onondaga Creek and its tributaries are only slightly impacted. In this reach, silt/sediment loads and high specific conductance from mud boils and historical salt-brine mining operations contribute to water-quality impacts (NYSDEC 2008).
From the digital collections of the New York State Library.
3
Remediation plans for impaired segments of Onondaga Creek are being implemented or are currently in development. NYSDEC has issued consent orders with Onondaga County and other municipalities to address the impact of CSOs and to clean up hazardous waste sites, among other restoration projects. Impacts from mud boils and salt mining are being addressed by the NYS Attorney General, as well as actions taken by the United States Geological Survey (USGS) and the Onondaga Lake Partnership (OLP) (NYSDEC 2008).
The SBU first surveyed the stream at four sites in 1981 to investigate turbidity problems in its upper reaches near Tully, NY. The source of the turbidity was known to be a “mud vent,” currently known as the Tully Mud Boils, which release highly turbid groundwater into the stream. The Tully Mud Boils were first observed during the late 1890s, the result of artesian pressure moving water and sediment to the surface from below ground aquifers laden with silt and clay (USGS 1998).
Some have speculated that solution mining for salt in the area has exacerbated the activity of the mud boils (OLP 2010). Although the mud boils are a significant source of suspended sediment to Onondaga Creek, invertebrate fauna downstream from them was not severely altered (Simpson 1981). Three of the sites sampled in 1981 were repeated in 2008; stations 01 (Tully Farms), 02 (Tully Valley), and 03 (Cardiff) (Figures 1a, 1b, and 1d).
Two of the sites sampled in 1989 were repeated in 2008; stations 02B (Cardiff) and 05 (Syracuse) (Figures 1c and 1f). Water quality was assessed as slightly impacted at Station 02B and severely impacted at Station 05 in 1989 (Bode et al. 1989). During the 1989 survey, impacts were attributed to sedimentation from the mud boils at Station 02B and sewage effluent at Station 05.
Sampling was also conducted at stations 02B and 05 in 1990, 1995 and 2001 as part of the NYSDEC Rotating Integrated Basin Studies program (RIBS) (Bode et al. 2004). Results indicated a decline in 2001 at Station 02B (moderately impacted) compared to 1990 and 1995 (slightly impacted). Water quality continued to be assessed as severely impacted (1990, 1995, and 2001) at Station 05. Based on historical descriptions, present day sources of impact appear consistent with the 1989 survey.
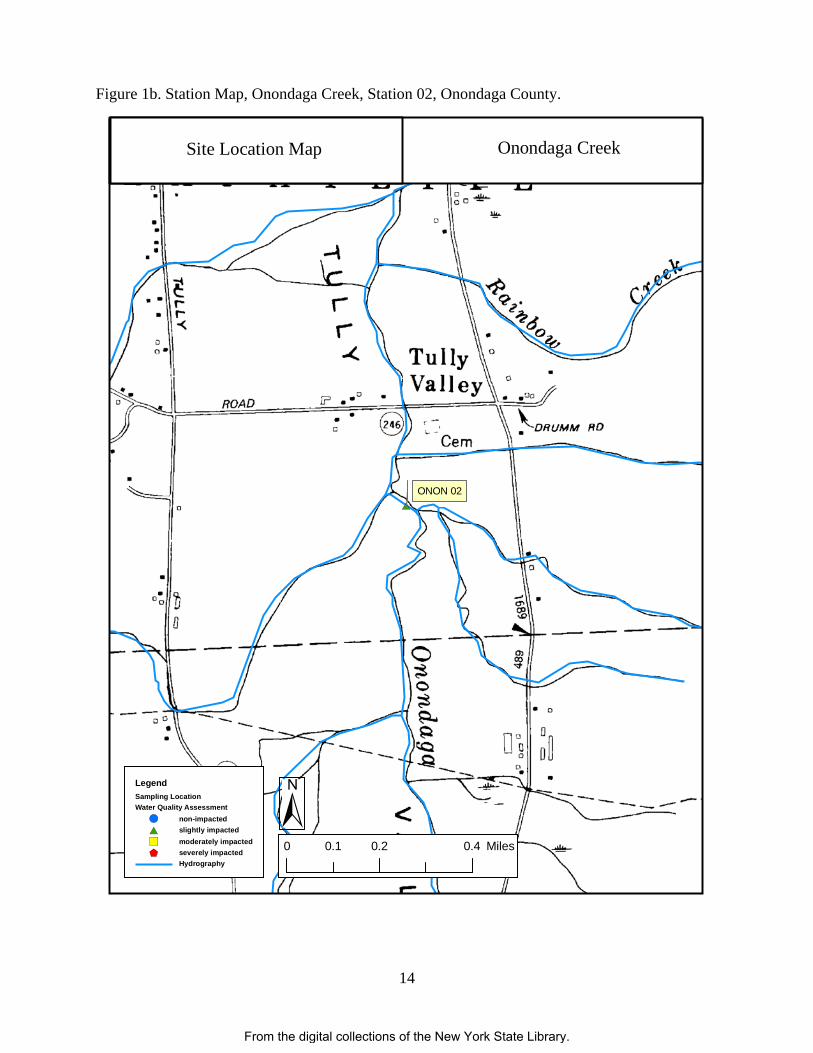
At the six stations surveyed in 2008 (Table 1, Figures 1 and 1a-f), water quality ranged from slightly impacted to moderately impacted (Figure 3). Upstream of the mud boils at stations 01 and 02 water quality was assessed as slightly impacted. Both samples were dominated by facultative taxa indicative of nutrient enrichment such as the riffle beetle, Optioservus fastiditus (Tables 4a and 4b).
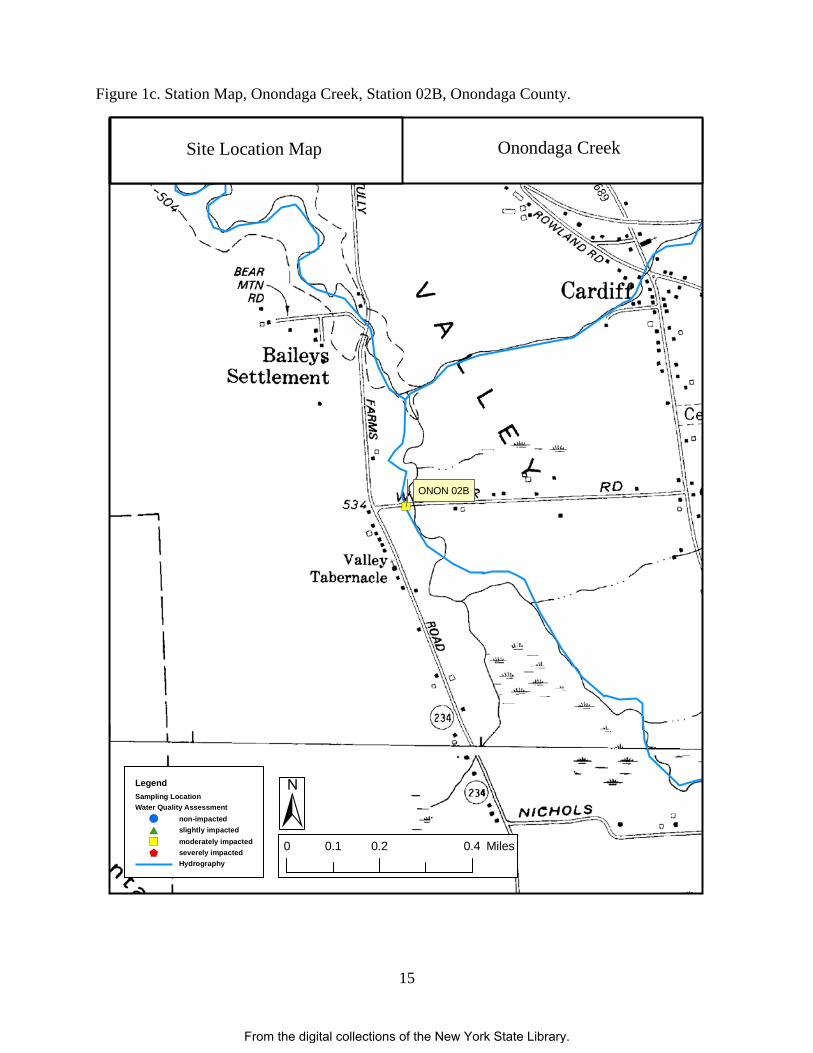
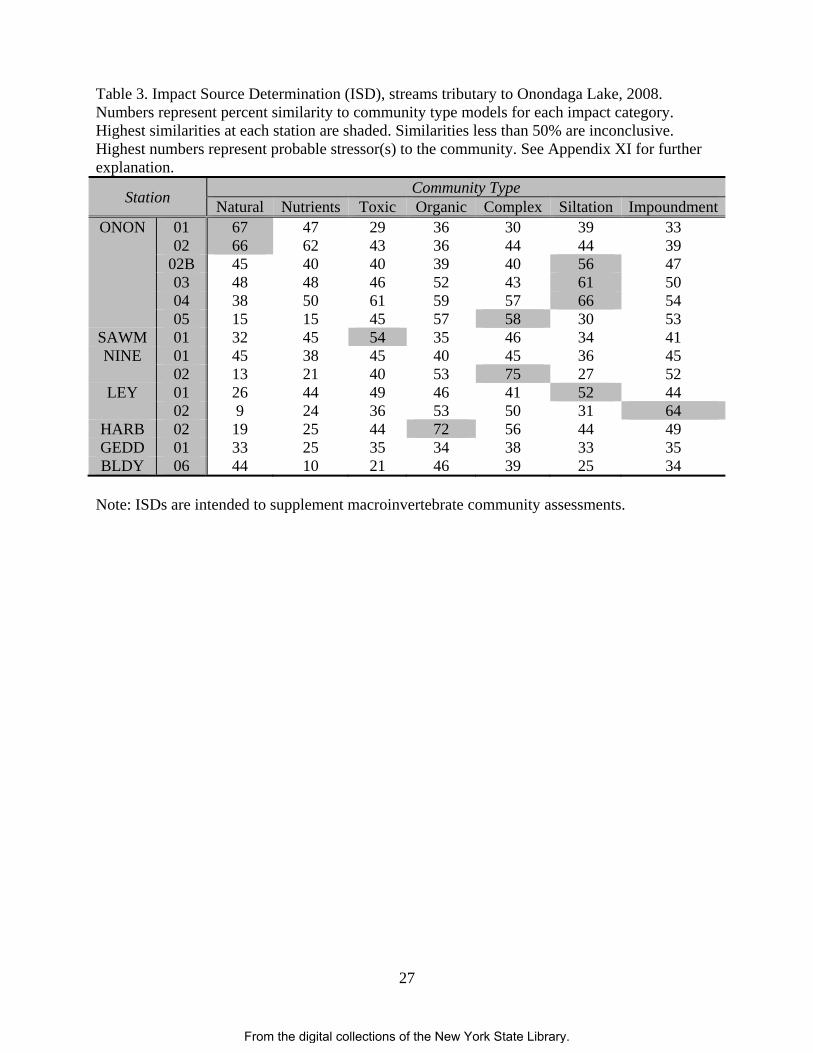
Water quality at Station 02B downstream of the mud boils was assessed as moderately impacted. This is consistent with the last 2001 RIBS survey (Figure 3). Sedimentation and high specific conductance as a result of the turbid groundwater discharges remain the source of impact as indicated by an impact source determination (ISD) analysis (Table 3).
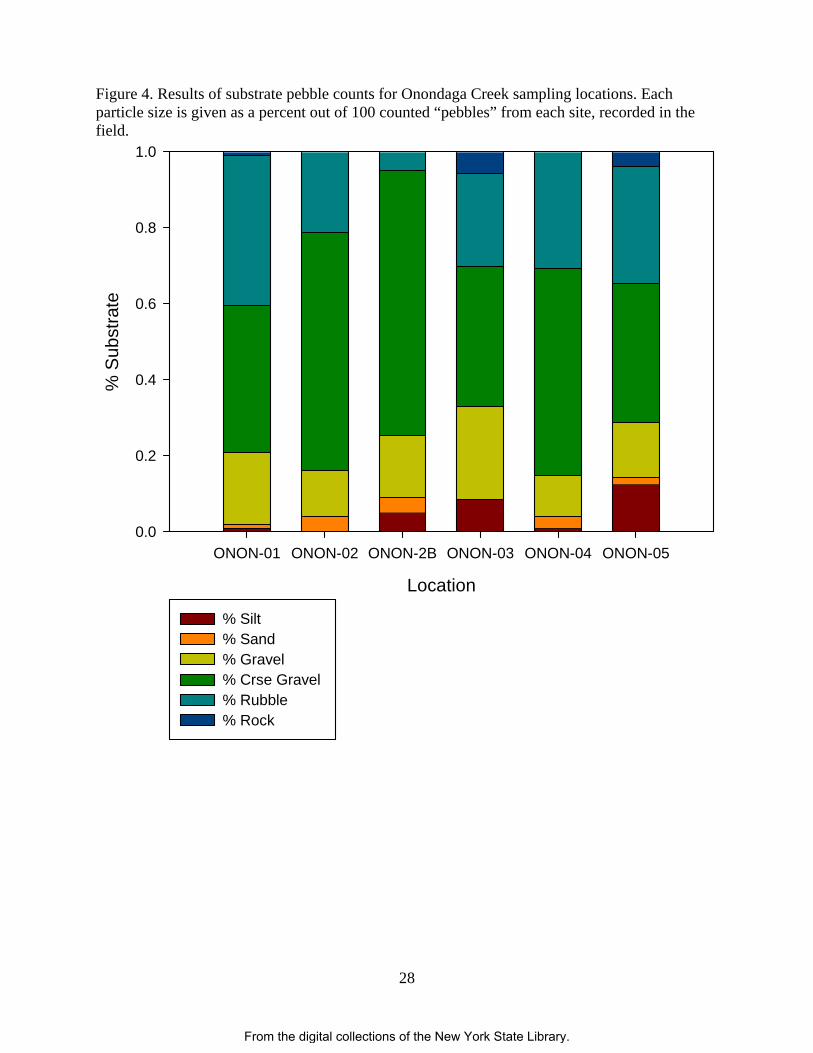
Substrate characterization conducted on the day of the survey showed an increase from upstream sites in the percentage of silt at Station 02B (Figure 4), as well as in substrate embeddedness (Table 2). The embeddedness results indicate a loss of important habitat for colonization of the invertebrate community at this site. Increased sedimentation embeds and covers coarse substrates essential to the survival and reproduction of many aquatic organisms (Berkman and Rabeni 1987, Vondracek et al. 2005, Asmus et al. 2009) and can decrease macroinvertebrate density (Lenat et al. 1981, Asmus et al. 2009).
In addition to increased sediment, specific conductance shows a dramatic increase from 492 μmhos/cm at Station 01 to 1,619 μmhos/cm at Station 02B (Table 2). Data from throughout New York State suggests biological communities begin to show detrimental impacts when specific conductance exceeds 800 μmhos/cm (Appendix XII). Specific conductance at every site
From the digital collections of the New York State Library.
4
below the mud boils was twice this amount, some of which may be related to the natural composition of upwelling groundwater (Table 2).
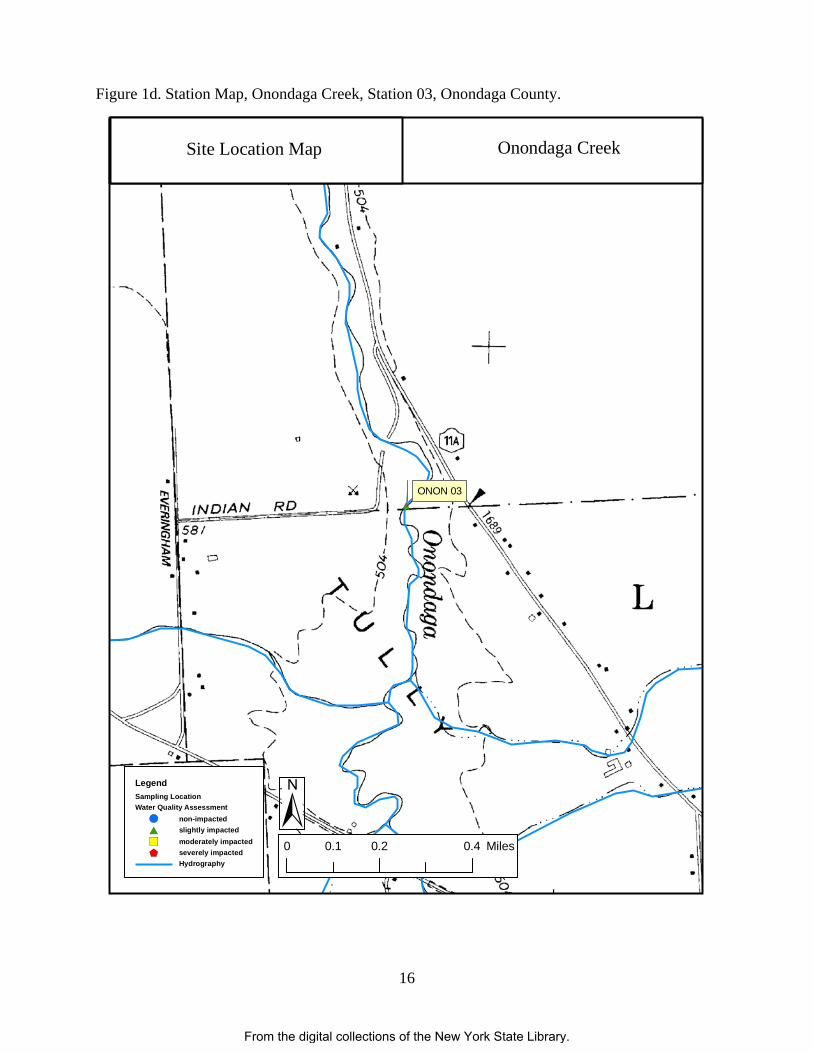
Water-quality conditions at Cardiff (Station 03) improved to slightly impacted, which was likely the result of several factors. Substrate composition continued to show signs of siltation but larger rock material was also present. Embeddedness decreased, meaning some habitat was regained. In addition, field notes suggest improved water clarity as several tributaries combine with the creek between stations 02B and 03. The added volume of water from the tributaries combined with the larger substrate material may reduce the overall effect of sedimentation.
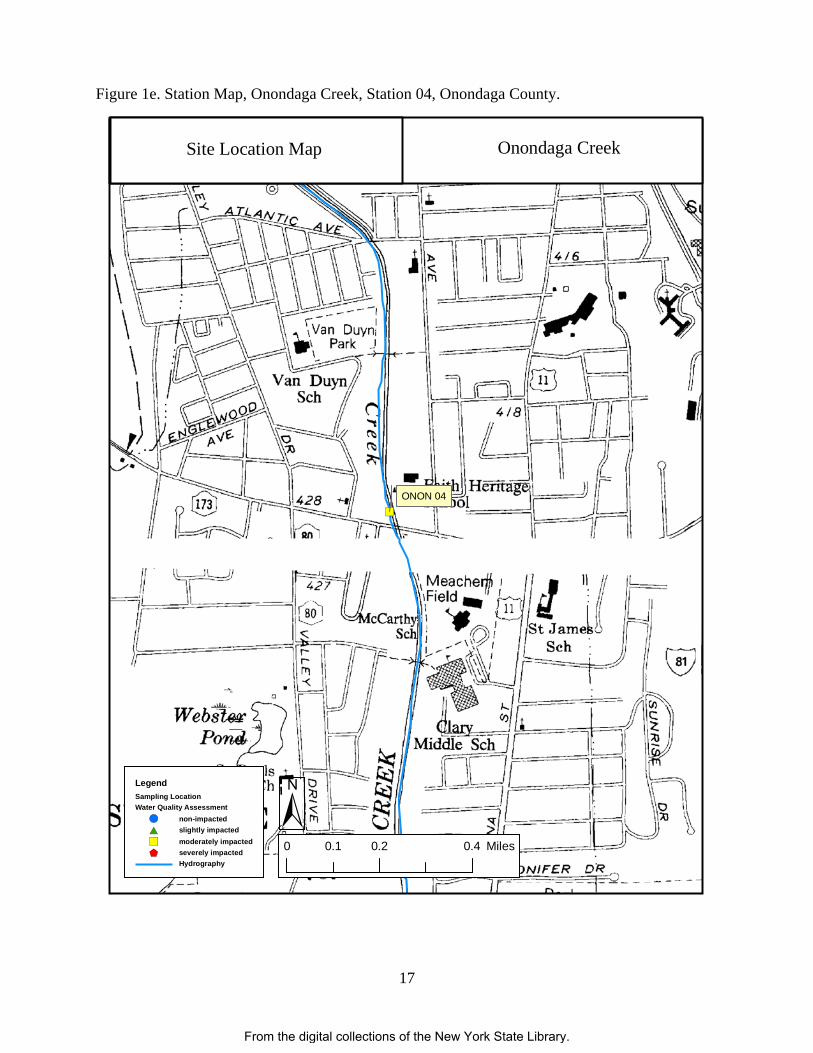
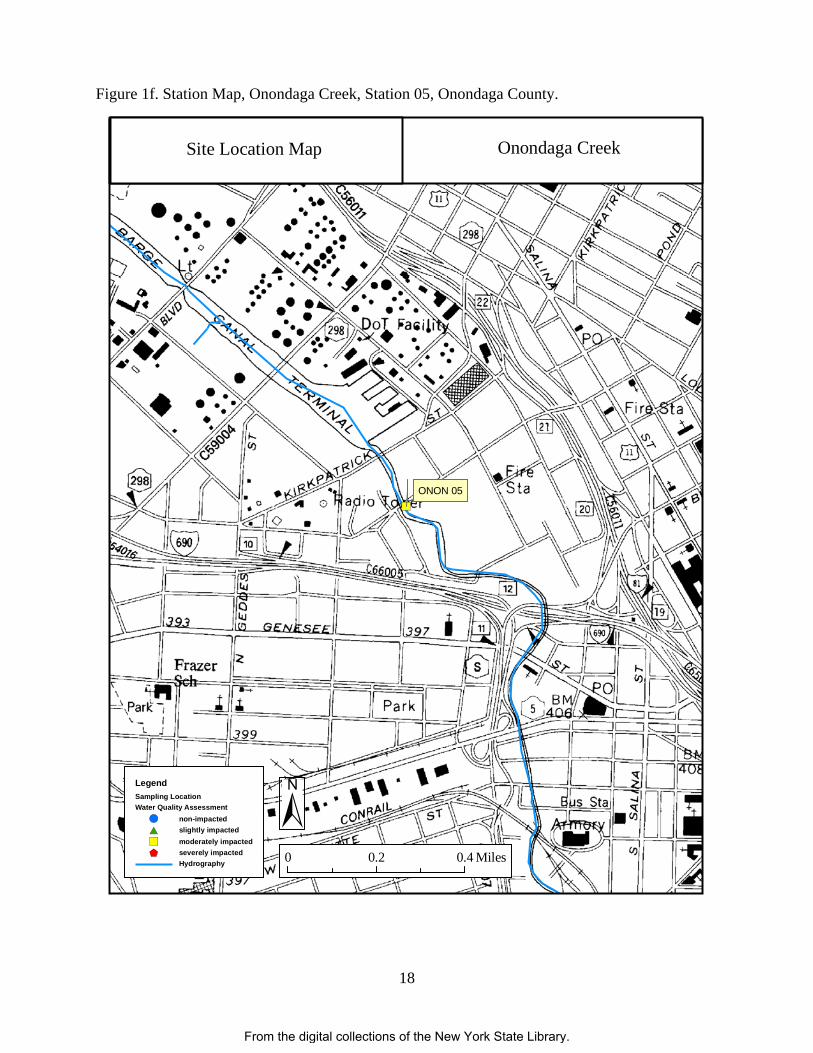
Downstream of Cardiff, Onondaga Creek enters the City of Syracuse where it is heavily channelized and receives input from CSOs and other discharges. Water quality in Syracuse (stations 04 and 05) was assessed as moderately impacted (Figure 3). ISD continues to suggest siltation as a source of impairment at Station 04 and identifies complex, municipal/industrial wastes as the source of impairment at Station 05 (Table 3).
Although both sites were assessed as moderately impacted, there is a dramatic difference in the composition of their invertebrate communities (Tables 4e and 4f). Station 04 is dominated by the facultative riffle beetle Stenelmis crenata, filter feeding caddisflies (Hydropsychidae), and the midge Polypedilum flavum. Riffle beetles and caddisflies are absent from Station 05, and the community is made up of highly tolerant oligochaetes (Nais communis, Enchytraeidae, and Limnodrilus hoffmeisteri), and a midge (Cricotopus bicinctus) indicative of toxic effluents contamination.
The dominance of the oligochaete taxa indicates the presence of organic wastes in the stream (Simpson 1981) and is consistent with 1989, 1990, 1995 and 2001 results (Bode et al. 1989, Bode et al. 2004). The source of organic wastes is likely the combined presence of a heavily urbanized area and the multiple combined sewer basins that discharge to the stream. Containment of these CSOs is underway to reduce their influence on the lower reaches of Onondaga Creek and Onondaga Lake. Sawmill Creek
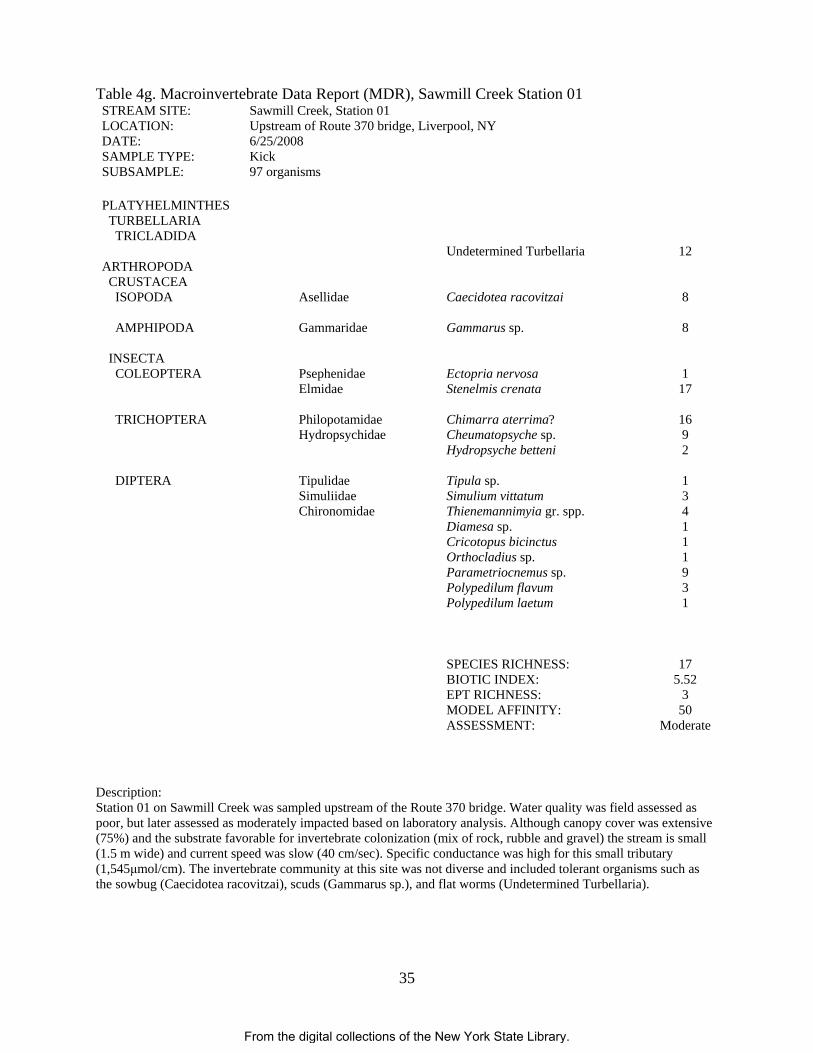
Sawmill Creek is a small tributary to Onondaga Lake with a drainage area of 6.9 km2. It enters the lake at the northern end near the western edge of Liverpool, NY and just east of the Seneca River (Figure 2). Approximately 45 percent of the Sawmill Creek drainage is classified as developed. The sampling location in Liverpool (Station 01), has remained the same since the 1980s (Table 1, Figures 2 and 2a). This site was assessed as moderately impacted in 1989, 1995 and 2001 (Bode et al. 1989, Bode et al. 2004). Suspected sources of impairment are CSO and other sewer discharges, industrial activities and urban runoff. Various remediation activities to address these discharges are underway (NYSDEC 2008).
During the current survey, the biological community was again assessed as moderately impacted (Figure 3). Although some improvements were noted in several of the individual community metric scores and the overall water-quality score (Figure 3), the taxa dominating the sample showed little difference from1989. The community still contained high numbers of pollution tolerant sow bugs (Caecidotea racovitzai) and scuds (Gammarus sp.), and was dominated by the riffle beetle Stenelmis crenata. ISD again pointed to toxic and industrial wastes, along with sewage as the sources of impact (Table 3). Ninemile Creek
Ninemile Creek is the largest tributary to Onondaga Lake with an approximate drainage area of 503 km2. It enters the lake from the west after it is joined by Geddes Brook, and flows
From the digital collections of the New York State Library.
5
past the New York State Fairgrounds near Lakeland/Solvay, NY (Figure 2). Although it is close to Syracuse, a considerable amount (45 percent) of the land area within the Ninemile Creek watershed is forested. The stream is the outlet of Otisco Lake, which has only minor impacts due to increased nutrients (NYSDEC 2008).
A biological assessment of Ninemile Creek from Otisco Lake to Onondaga Lake was conducted by the NYSDEC Avon Pollution Investigation Unit in July, 1974 (Cooper et al. 1974). In this study, water quality was determined to range from “good” to “moderately” impacted, equivalent to what the SBU now refers to as slightly too severely impacted. Two stations were in the same approximate locations as the sites sampled in 2008, Station 01 (Cooper et al. 1974, Station 07) and Station 02 (Cooper et al. 1974, Station 09). Water quality in 1974 at these two sites was slightly impacted (Station 01) and severely impacted (Station 02). At Station 02, there was only one organism observed in the sample due to pollution from the Solvay Plant of Allied Chemical Co. (Cooper et al. 1974).
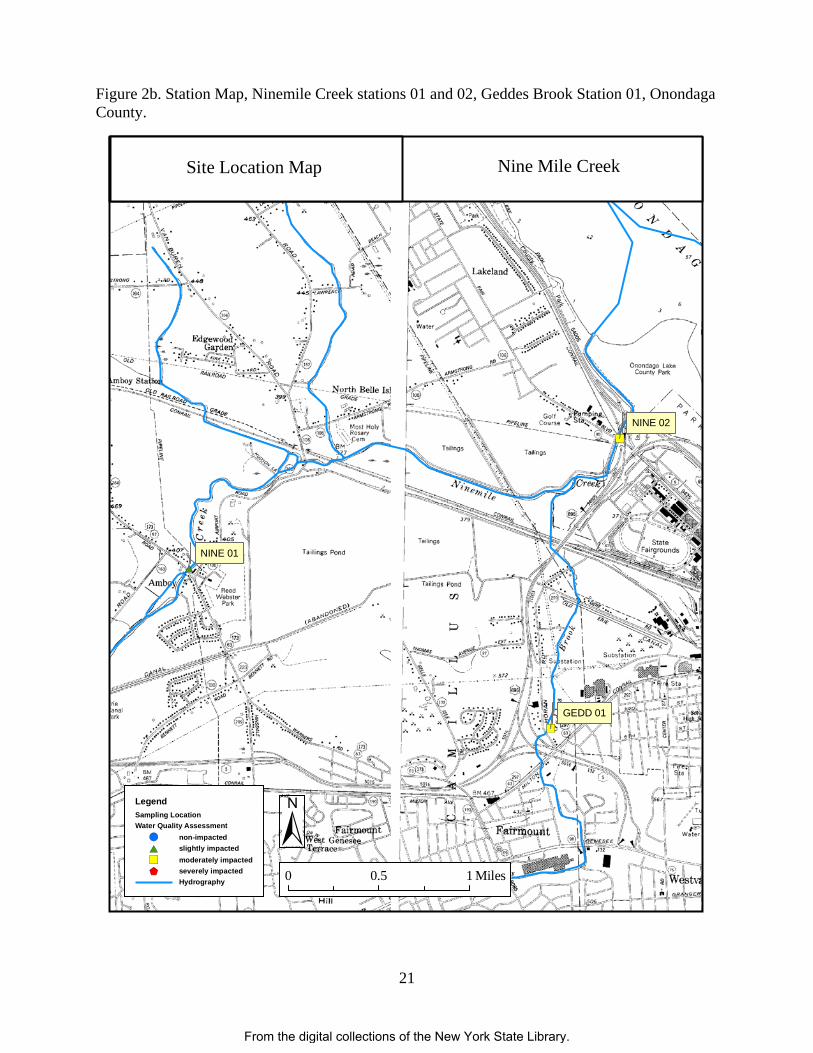
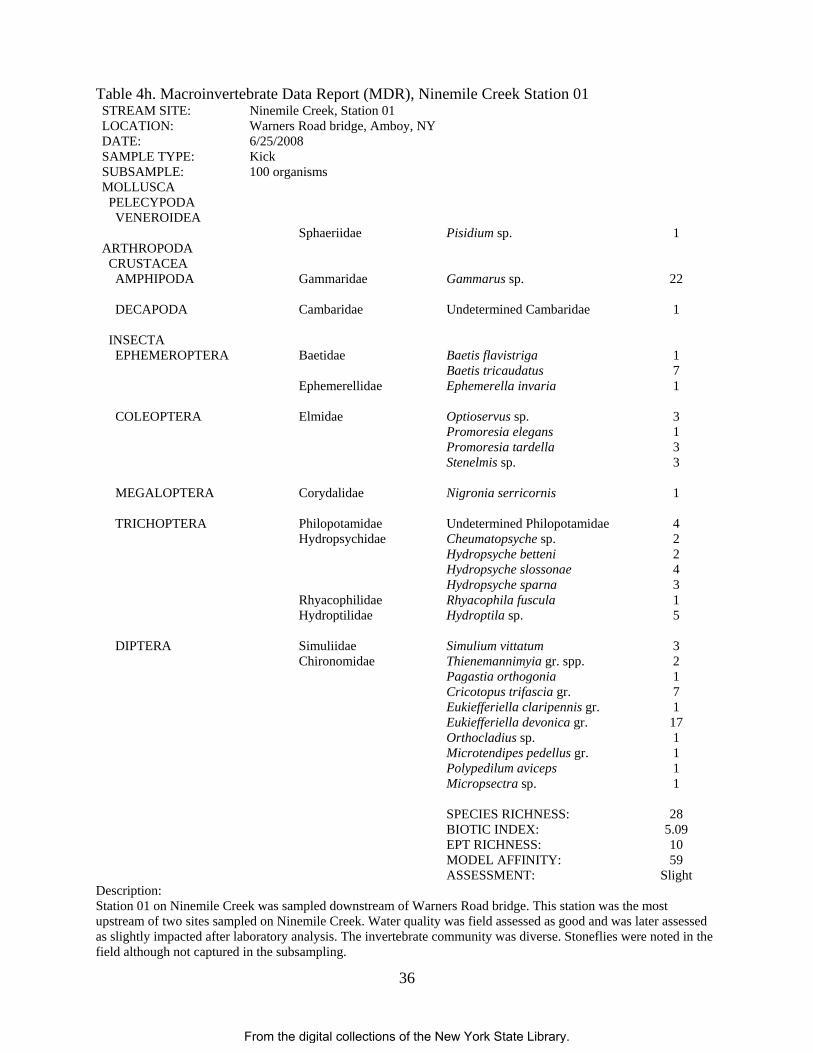
Two sites on Ninemile Creek were sampled during the 2008 survey, one upstream in the Town of Amboy (Station 01), and one downstream near Lakeland/Solvay (Station 02) (Table 1) (Figures 2 and 2b). Both sites are located in the lower reach of Ninemile Creek listed as an impaired segment by NYSDEC due to CSOs, urban runoff, and industrial activities (NYSDEC 2008).
Water quality was assessed as slightly impacted at Station 01 and moderately impacted at Station 02. Current assessments suggest considerable improvement in water quality conditions at Station 01 compared to sampling conducted in 1989 when the site was assessed as severely impacted (Bode et al. 1989, Bode et al. 2004). The invertebrate community at this site was diverse with 28 different taxa present, although most were facultative. Gammarus sp. was present in high numbers, suggesting a stressed community with high specific conductance. However, several species of mayfly were present, along with various net-spinning caddisfly taxa (Table 4h).
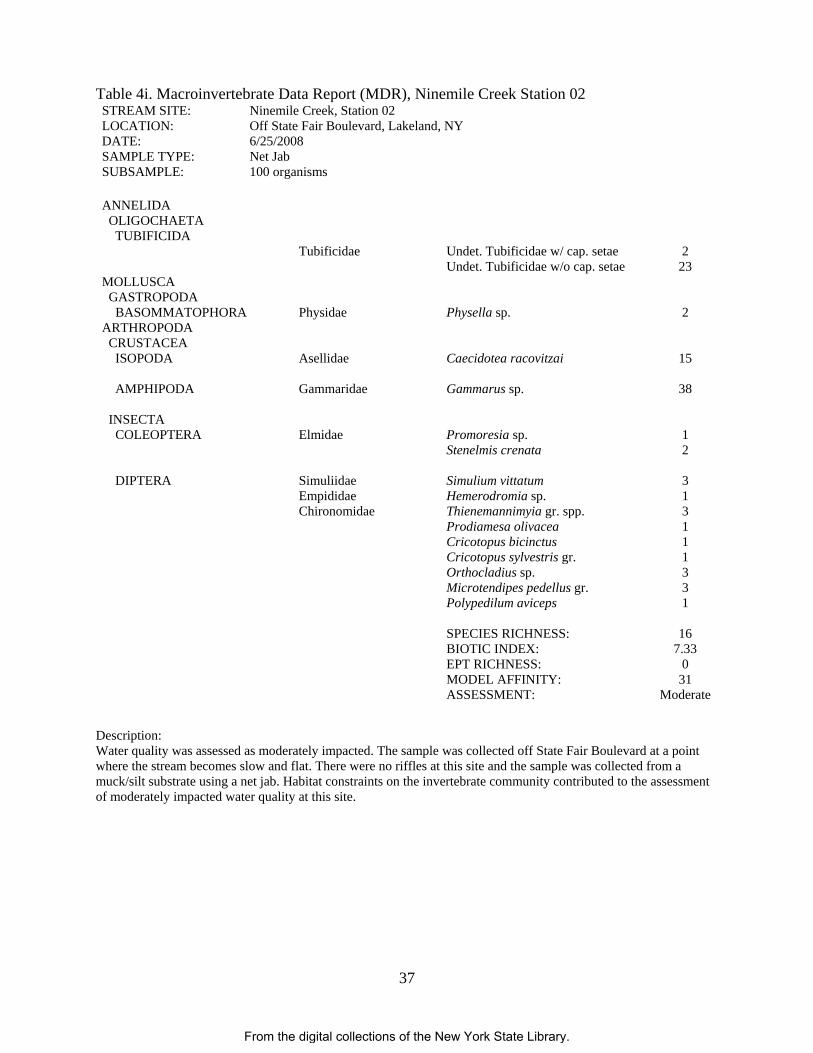
Results at Station 02 suggest moderate water-quality impact. Previously, this site was assessed as severely impacted in 1989, 1990, 1995 and 2001 (Bode et al. 1989, Bode et al. 2004) (Figure 3). Some of the improvement over previous years may be attributable to the difference in sampling methods and the application of sandy streams assessment criteria as discussed earlier (Appendix XIII). Using the ISD method, complex municipal/industrial wastes were identified as the likely source of contaminants (Table 3). The invertebrate community was limited and dominated by tolerant organisms such as oligochaetes in the family Tubificidae, C. racovitzai and the Gammarus sp., all of which indicate the presence of polluted runoff and organic wastes.
Geddes Brook
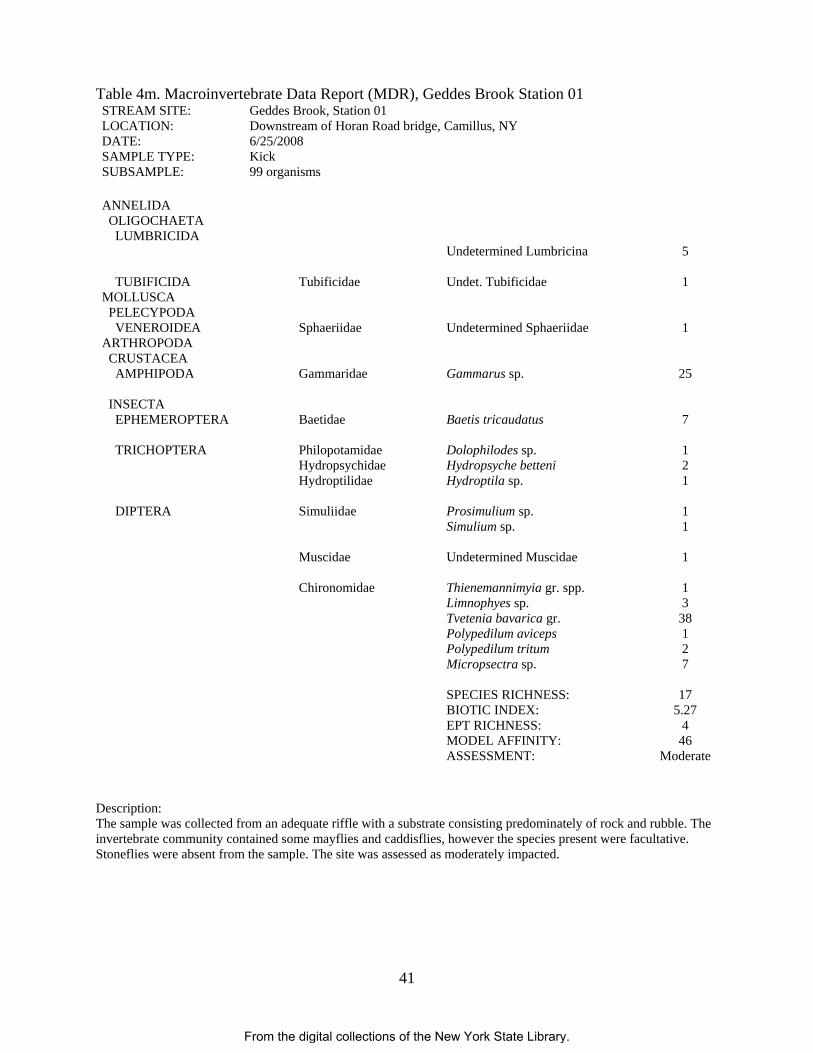
Geddes Brook is a small tributary (27.9 km2) to Ninemile Creek that originates in the area of Fairmount, NY, joining Ninemile Creek just west of the NYS Fairgrounds. Thirty-four percent of the watershed area is considered urban. Historical surveys of this site indicated moderately (1989) and slightly (2001 and 2006) impacted water quality (Bode et al. 1989, Bode et al. 2004). Using sandy streams assessment criteria during the present survey, instead of riffle streams assessment criteria as in previous surveys, slightly impacted water quality was found.
Species data shows that a shift in the dominant macroinvertebrate taxa within the community has occurred since 1989, suggesting improvements to water quality. In 1989, the macroinvertebrate community was dominated by pollution-tolerant oligochaetes Nais elinguis and undetermined enchytraeids, along with the sowbug Caecidotea. racovitzai (Bode et al. 1989). Current data suggests the community is now dominated by various species of Chironomidae, freshwater scuds, mayflies and caddisflies. Similar communities were noted in
From the digital collections of the New York State Library.
6
2001 and 2006. Even though water quality at this site has improved since 1989, problems still exist.
Ley Creek
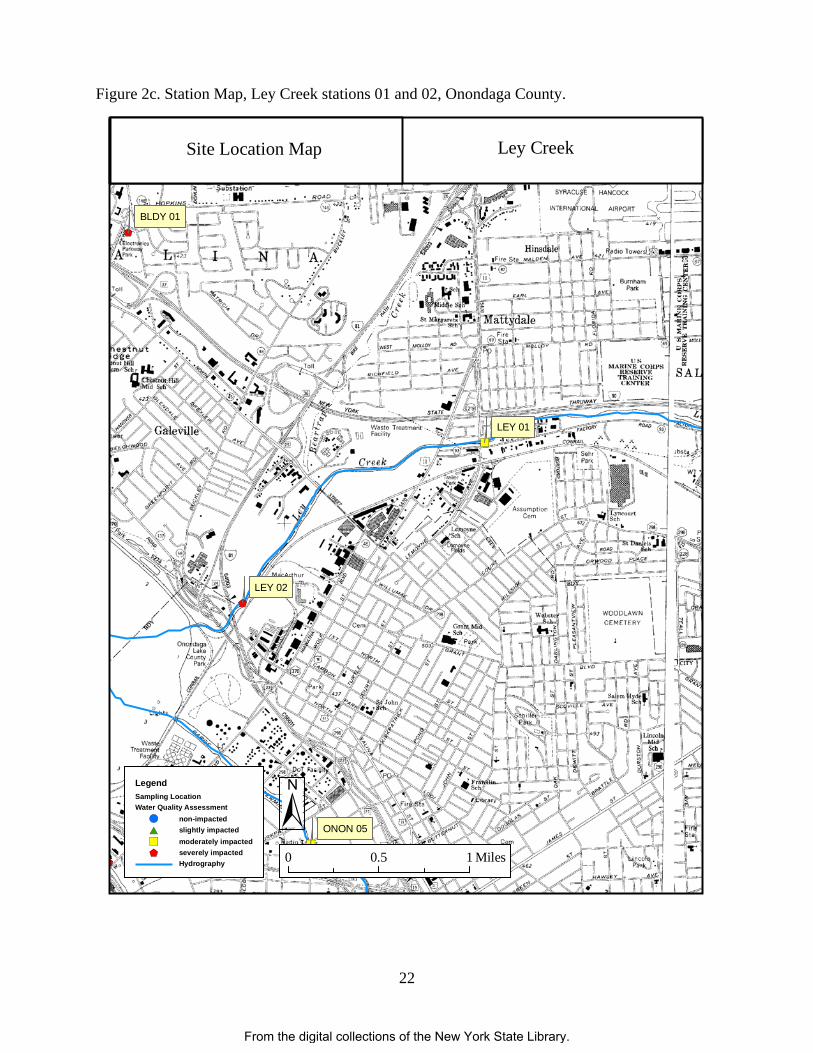
Ley Creek is a large tributary to Onondaga Lake draining about 79 km2 of land in northern Syracuse. It enters Onondaga Lake at the south end just north of Onondaga Creek (Figure 2). More than half (57%) of its drainage area is classified as developed. The two sites that were sampled (stations 01 and 02) in 2008 corresponded with historical sampling locations (Figure 2c).
The upstream site, Station 01 in Mattydale, was surveyed in 1989 (Bode et al. 1989), 1990, 1995, 2001, (Bode et al. 2004) 2006 and 2007. Water-quality assessments from these surveys ranged from severely impacted in 1989 and 1990 to moderately impacted in 1995, 2001, 2006 and 2007.
Surveys at the downstream site, Station 02 in Syracuse, were conducted in 1989 (Bode et al. 1989), 1990, 2001 (Bode et al. 2004), and 2007. Water quality has consistently been assessed as severely impacted at Station 02 (Figure 3).
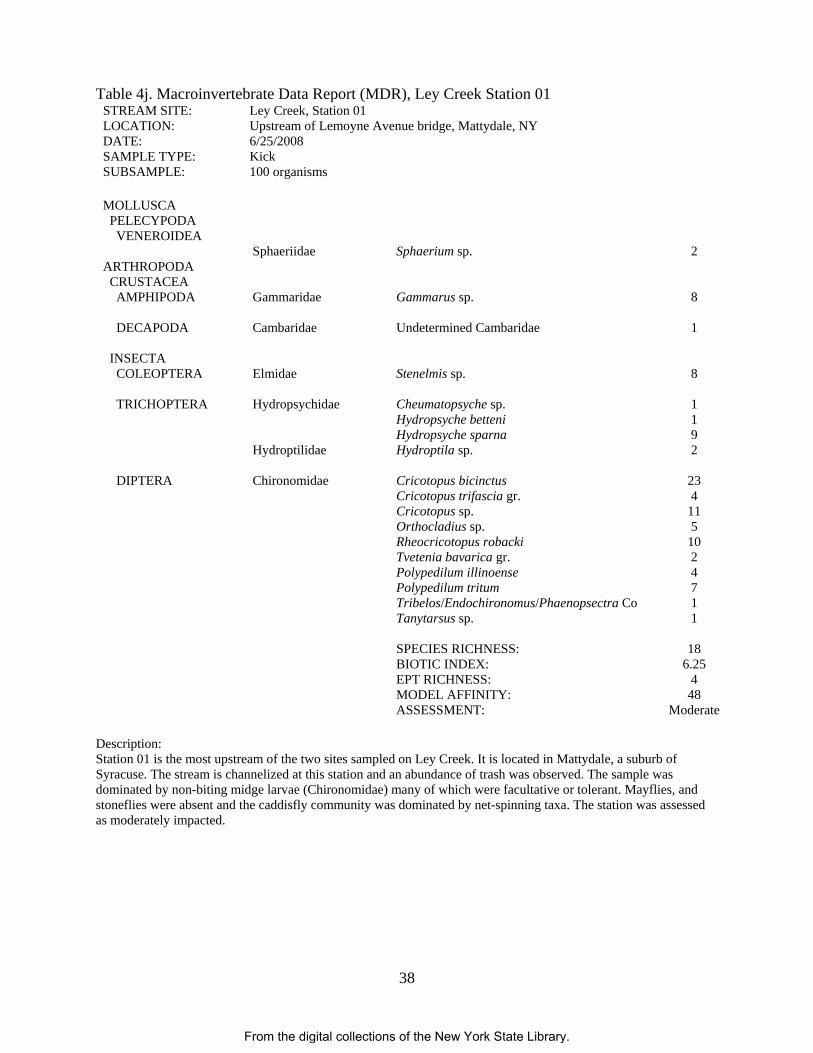
Results from the 2008 sampling of Station 01 in Mattydale suggest that moderately impacted conditions persist (Figure 3). An ISD analysis identified siltation as the major source of impact to this site. A mixture of urban pollutant sources including municipal/industrial wastes, toxics and sewage, are the underlying problems (Table 3). The entire stream and its tributaries are currently listed as impaired due to CSOs, urban runoff, industrial activities, and runoff from the Syracuse International Airport and a municipal landfill (NYSDEC 2008). These sources of pollutants are reflected in the condition of the aquatic community.
In 1989, the macroinvertebrate community at Station 01 was limited and dominated by the sowbug Caecidotea racovitzai (84%). Mayflies, stoneflies, and caddisflies were absent. By 2008 the community had dramatically shifted to one dominated by various species of Chironomidae and several species of caddisflies (Table 4j). The presence of caddisflies signifies major improvement, but water quality is still substantially altered from its natural condition.
Sampling at Station 02 in 2008 was conducted using sandy streams criteria and suggests moderately impacted water quality as well. The invertebrate community in 1989 was dominated by L. hoffmeisteri (67%). This species still dominates the community today, although in less abundance (Table 4k).
Due to the lack of any major shift in the invertebrate community in the current survey compared to historical data, the apparent improvement in the assessment at this site is likely due to the use of sandy streams instead of riffle streams criteria in the assessment methods. An ISD analysis indicates impoundment effects influencing the invertebrate community (Table 3). This is likely the result of the slow moving, pooling characteristics of this reach of the stream. Harbor Brook
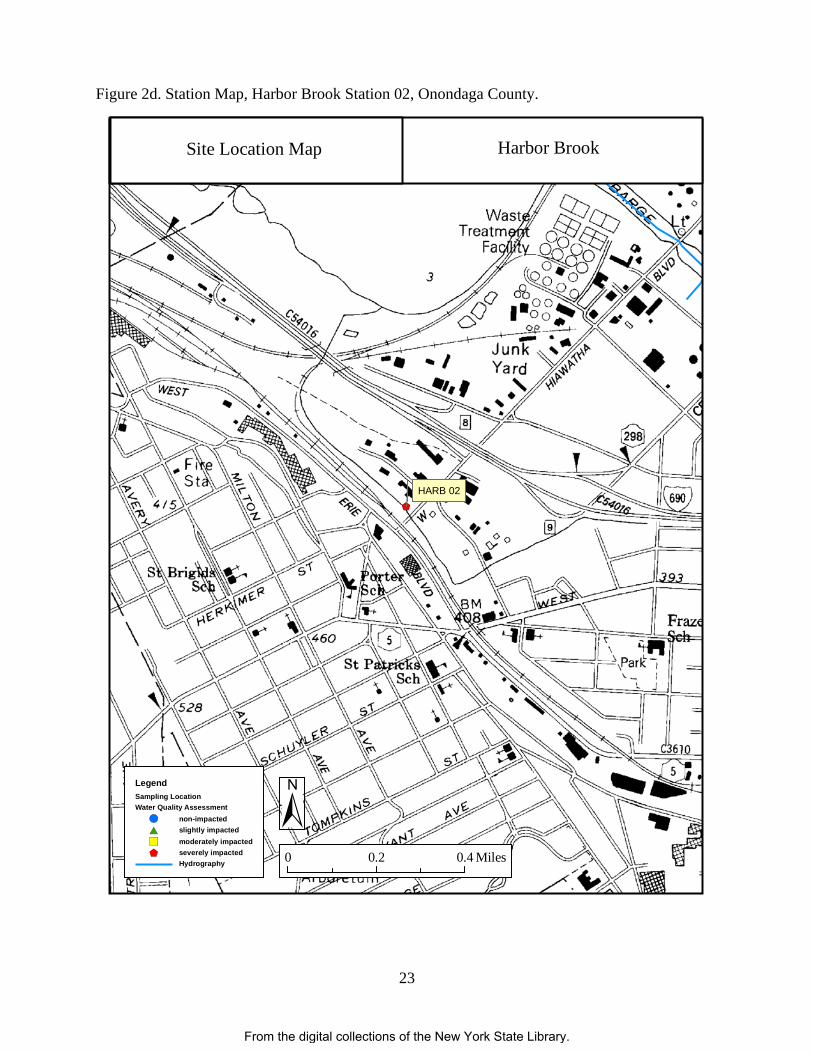
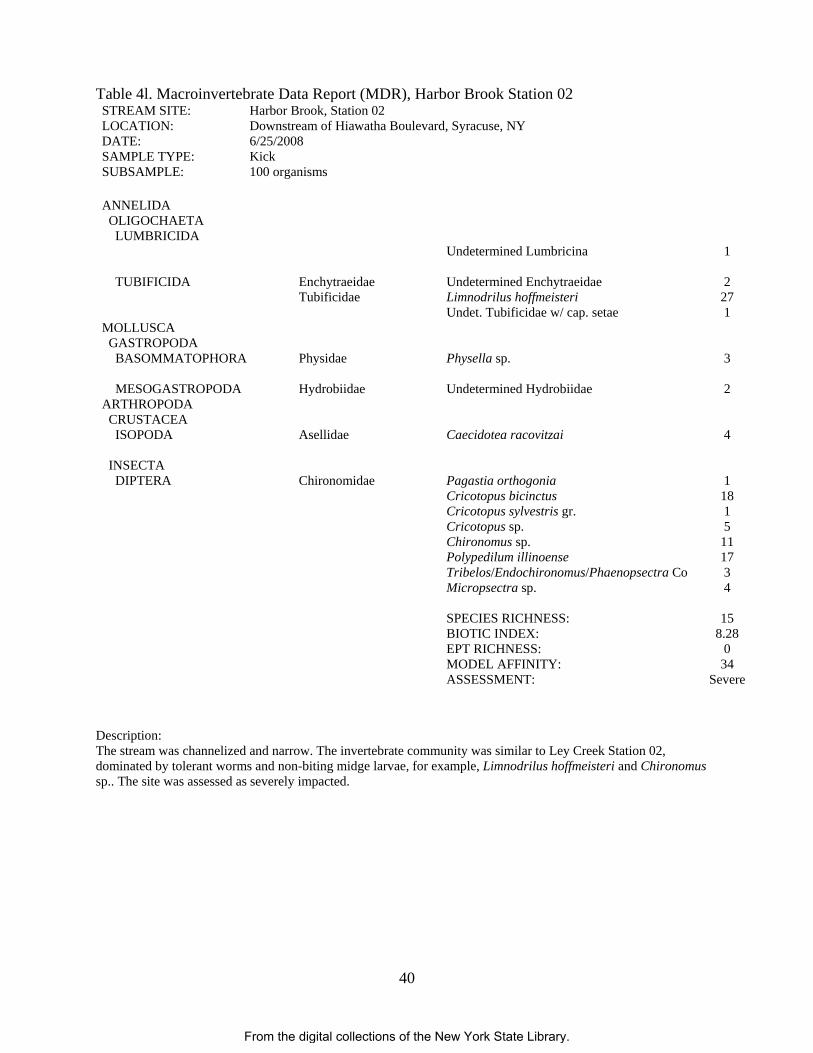
Harbor Brook enters Onondaga Lake at its southern end, just south of Onondaga Creek in the area of Solvay, NY (Figure 2). Harbor Brook is the fourth largest tributary to Onondaga Lake (35 km2). The section of stream surveyed is currently listed as impaired due to CSOs, urban runoff, and industrial activities (NYSDEC 2008). Remediation activities are underway to alleviate many of the sources of impact, including work on CSOs and cleanup of contaminated waste sites (NYSDEC 2008).
One site in Syracuse (Station 02) was sampled during this survey (Figure 2d). This location was also sampled in 1989 (Bode et al. 1989), 1995 and 2001 (Bode et al. 2004). Water quality has been assessed either as severely or moderately impacted in the past, although the
From the digital collections of the New York State Library.
7
change in invertebrate community structure was small. Results from the 2008 sampling using sandy streams criteria indicate moderately impacted conditions (Figure 3). An ISD analysis indicated sewage as the source of impact to the biological community (Table 3). The invertebrate community was dominated by the worm, Limnodrilus hoffmeisteri and appeared similar to the community present in 1989 (Table 4l). Bloody Brook
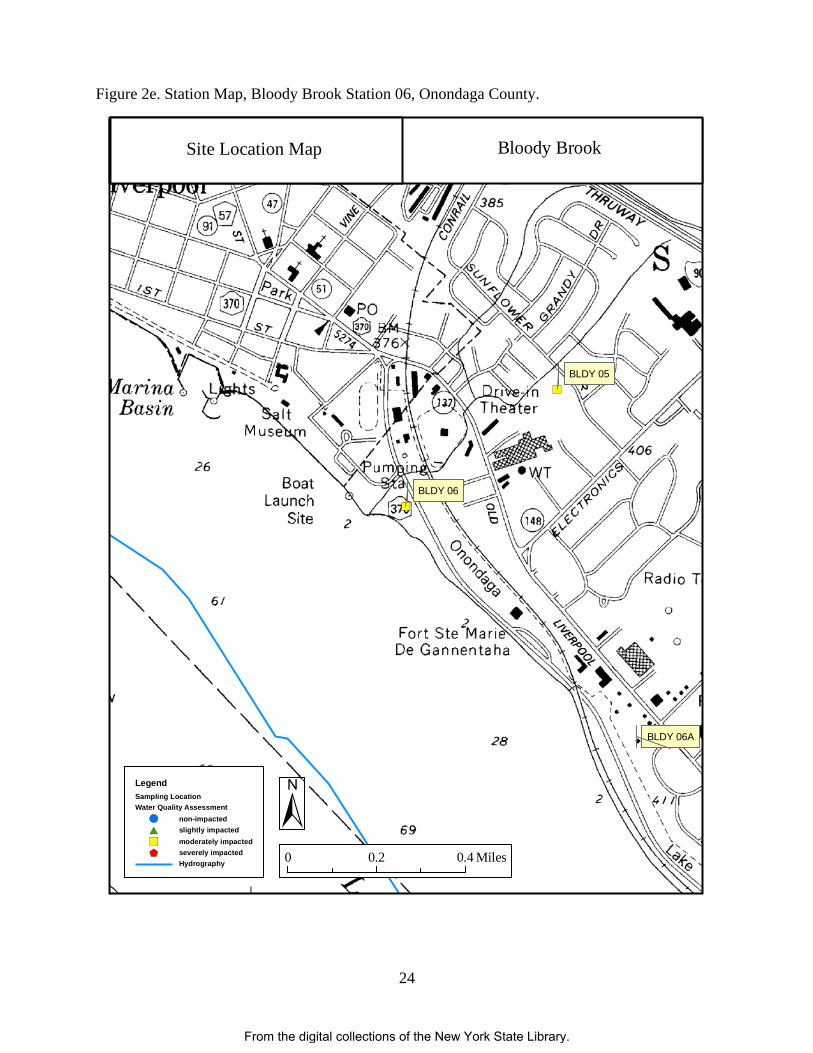
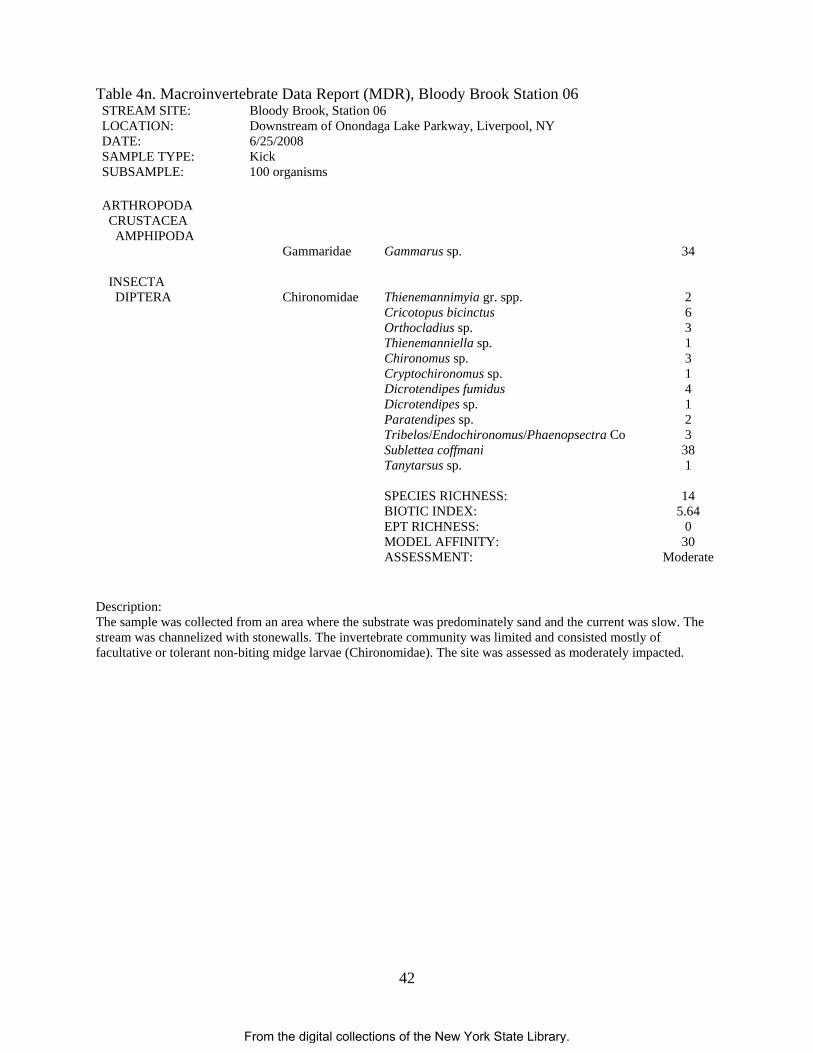
Bloody Brook is one of the smallest tributaries to Onondaga Lake with a drainage area of about 9 km2. It enters Onondaga Lake from the east, near Liverpool, NY (Figure 2). Its watershed is approximately 70% urban. The entire stream and its tributaries are impaired due to pathogens and other pollutants from urban runoff and historical industrial uses (NYSDEC 2008).
Historical surveys at this site in 1989 (Bode et al. 1989), 1994, 1995, 2001(Bode et al. 2004), and 2006 indicated moderately impacted water quality. Municipal/industrial and urban runoff were consistently identified as the sources of impact in these surveys.
Results of the current water-quality assessment using sandy streams criteria indicate moderately impacted conditions (Figure 3). An ISD analysis was inconclusive, but suggests sewage and municipal/industrial pollutants as the sources of impact (Table 3). The invertebrate community was similar to previous years, dominated by facultative to tolerant Chironomidae and freshwater scuds. Poor riffle habitat, channelization and general physical stream-habitat alteration are a concern on this stream and likely negatively affect the invertebrate community. References ASMUS, B., J. MAGNER, B. VONDRACEK and J. PERRY. 2009. Physical integrity: The missing link
in biological monitoring and TMDLS. Environmental Monitoring and Assessment 159:443-463.
BERKMAN, H. and C. RABENI. 1987. Effect of siltation on stream fish communities. Environmental Biology of Fishes 18:285-294.
BODE, R. W., M. A. NOVAK and L. E. ABELE. 1989. Biological stream assessment: Streams tributary to Onondaga Lake, Onondaga County, New York. New York State Department of Environmental Conservation, Albany, NY. Technical Report, 29 pages.
BODE, R. W., M. A. NOVAK, L. E. ABELE, D. L. HEITZMAN and A. J. SMITH. 2004. 30 year trends in water quality of rivers and streams in New York State based on macroinvertebrate data. New York State Department of Environmental Conservation, Albany, NY. Technical Report, 384 pages.
COOPER, A. L., M. J. TRACY and G. N. NEUDERFER. 1974. A macroinvertebrate study of Ninemile Creek. New York State Department of Environmental Conservation, Albany, NY. Technical Report, 33 pages.LENAT, D. R., D. L. PENROSE and K. W. EAGLESON. 1981. Variable effects of sediment addition on stream benthos. Hydrobiologia 79:187-194.
MUELLER, S. and F. ESTABROOKS. 2006. New York status and trends report for freshwater and marine sediments. New York State Department of Environmental Conservation, Albany, NY. Technical Report,
NYSDEC. 2005a. Record of Decision Issued for the Onondaga Lake Bottom Site. New York State Department of Environmental Conservation, Albany, NY. Fact Sheet, 3 pages.
From the digital collections of the New York State Library.
8
NYSDEC. 2005b. Record of Decision Onondaga Lake Bottom Subsite of the Onondaga Lake Superfund Site Town of Geddes and Salina, Villages of Solvay and Liverpool, and City of Syracuse, Onondaga County, New York. New York State Department of Environmental Conservation, Albany, NY. Technical Report, 115 pages.
NYSDEC. 2008. The Oswego River Finger Lakes basin waterbody inventory and priority waterbodies list. New York State Department of Environmental Conservation, Division of Water, Bureau of Watershed Assessment and Management, Albany, NY.
OLP. 2010. Pollutants and Onondaga Lake. Website of the Onondaga Lake Partnership. www.onlakepartners.org/lake_quality_pollutants.htm
SIMPSON, K. W. 1981. Biological survey of Onondaga Creek. New York State Department of Environmental Conservation,Albany, NY. Technical Report, 28 pages.
SMITH, A. J. and R. W. BODE. 2004. Analysis of variability in New York State benthic macroinvertebrate samples. New York State Department of Environmental Conservation, Stream Biomonitoring Unit, Albany, NY. Technical Report 43 pages.
SMITH, A. J., D. L. HEITZMAN and B. T. DUFFY. 2009. Standard operating procedure: Biological monitoring of surface waters in New York State. New York State Department of Environmental Conservation, Stream Biomonitoring Unit, Albany, NY. Technical Report, 159 pages.
USGS. 1998. Remediation of Mudboil Discharges in the Tully Valley of Central New York. United States Geological Survey, United States Department of the Interior. Fact Sheet FS 143-97.
VONDRACEK, B., K. BLANN, C. COX, J. NERBONNE, K. MUMFORD, B. NERBONNE, L. SOVELL and J. ZIMMERMAN. 2005. Land use, spatial scale, and stream systems: Lessons from an agricultural region. Environmental Management 36:775-791.
From the digital collections of the New York State Library.
9
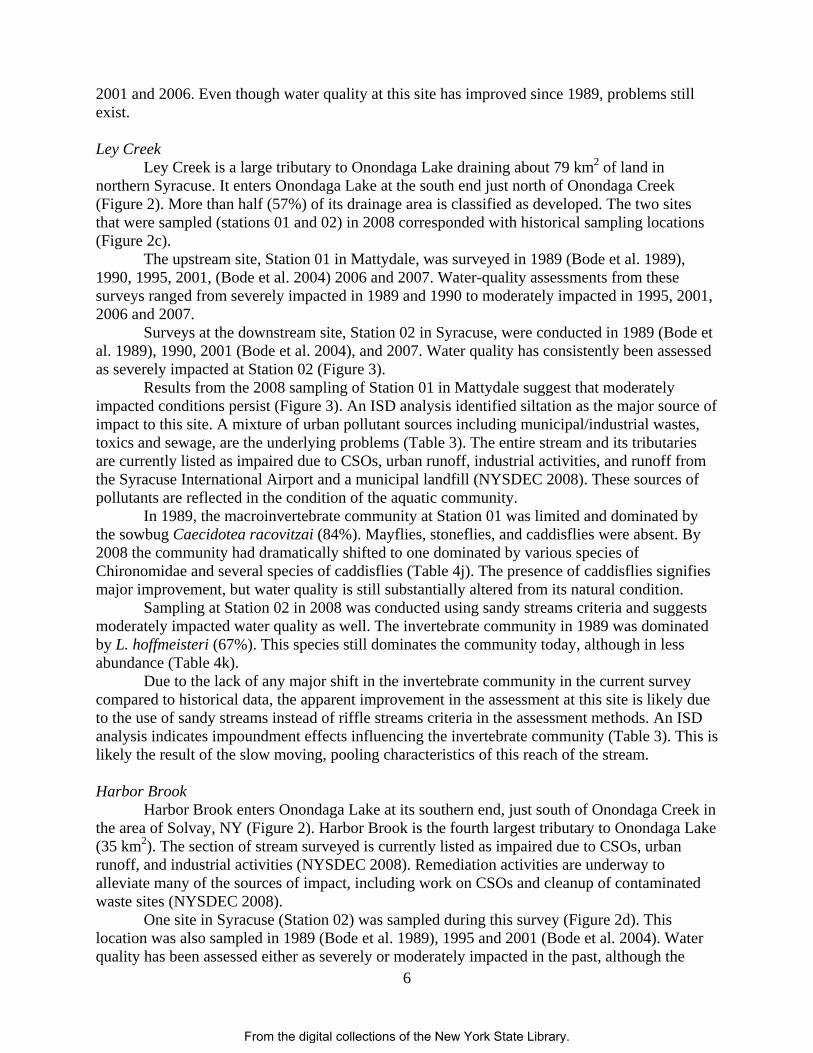
Table 1. Station Locations, streams tributary to Onondaga Lake, Onondaga County, NY, 2008. Site photographs, if available, follow each description. Station Location___ ONON-01 Tully Farms Onondaga Creek Tully Farms Road crossing Latitude: 42.82478
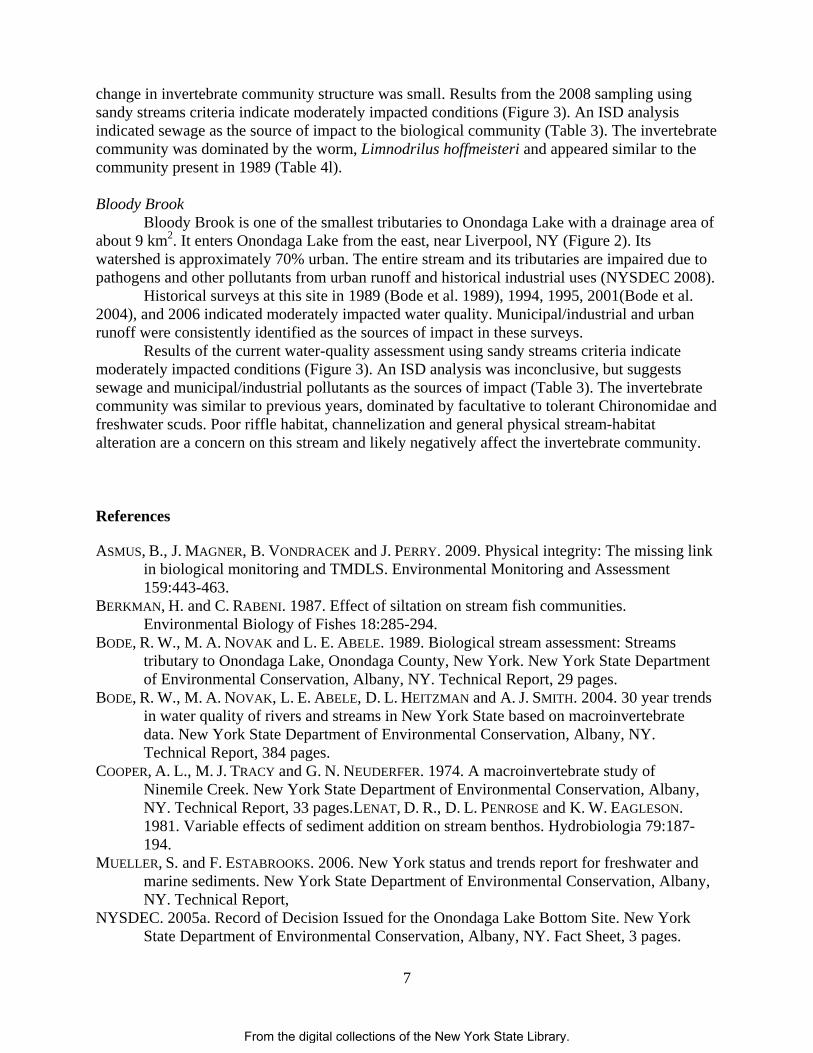
Longitude: -76.14327 ONON-02 Tully Valley Onondaga Creek Immediately upstream of mud boils at
Otisco Road Latitude: 42.85563
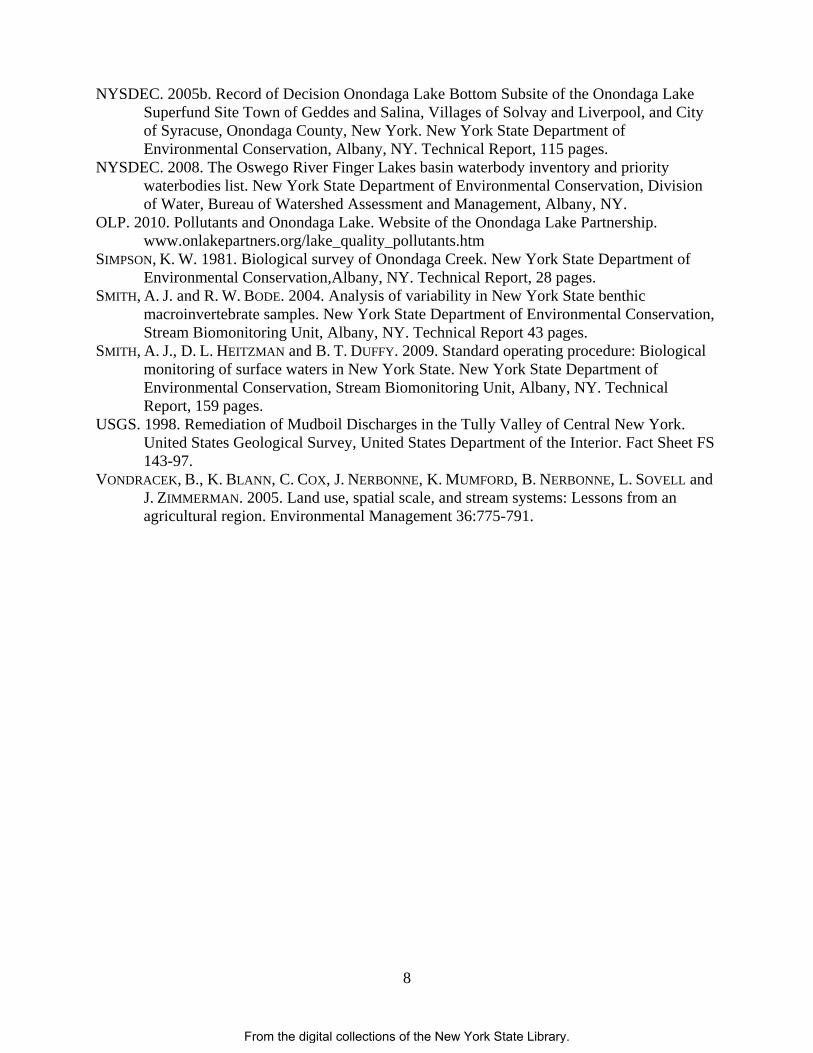
Longitude: -76.13839 ONON-02B Cardiff Onondaga Creek Downstream of Webster Road crossing Latitude: 42.88303
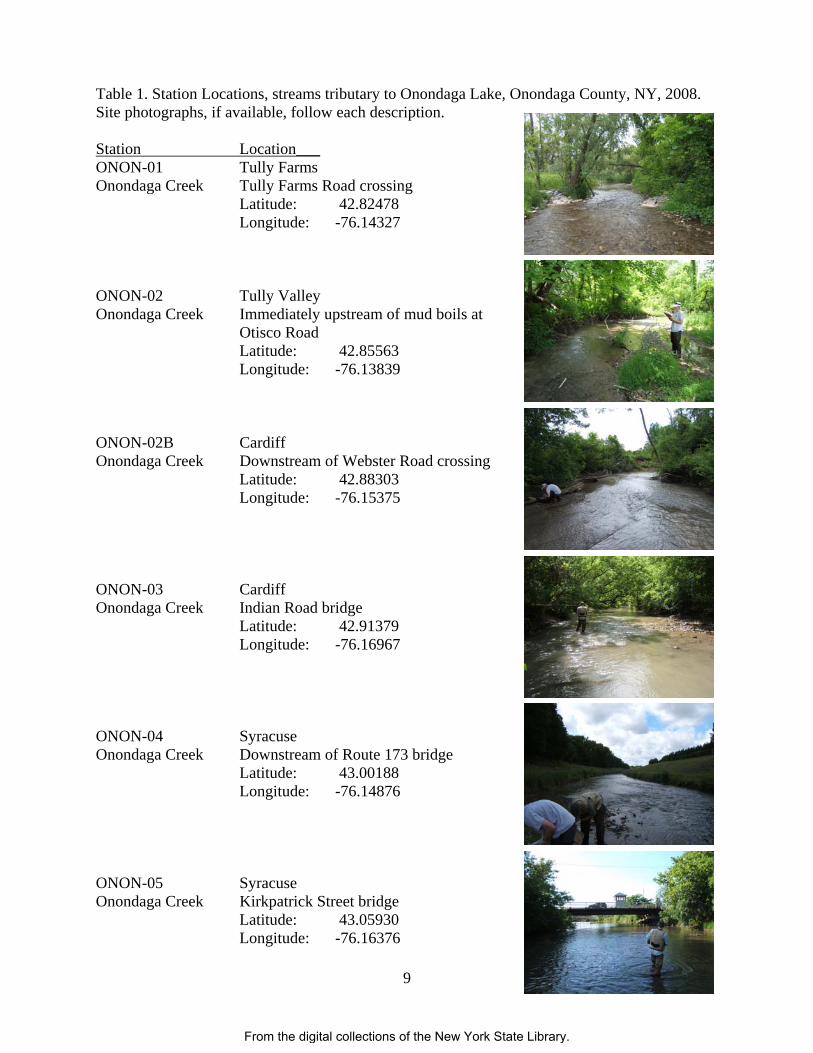
Longitude: -76.15375 ONON-03 Cardiff Onondaga Creek Indian Road bridge Latitude: 42.91379
Longitude: -76.16967 ONON-04 Syracuse Onondaga Creek Downstream of Route 173 bridge Latitude: 43.00188
Longitude: -76.14876
ONON-05 Syracuse Onondaga Creek Kirkpatrick Street bridge Latitude: 43.05930
Longitude: -76.16376
From the digital collections of the New York State Library.
10
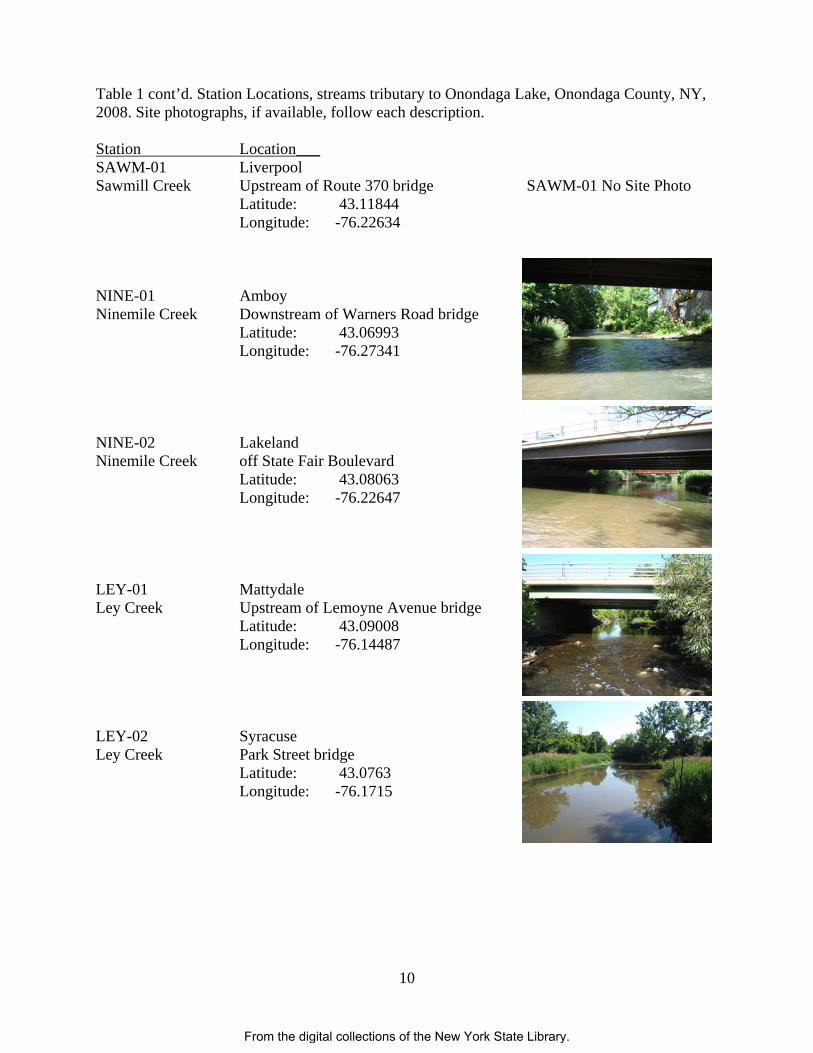
Table 1 cont’d. Station Locations, streams tributary to Onondaga Lake, Onondaga County, NY, 2008. Site photographs, if available, follow each description. Station Location___ SAWM-01 Liverpool Sawmill Creek Upstream of Route 370 bridge SAWM-01 No Site Photo Latitude: 43.11844
Longitude: -76.22634
NINE-01 Amboy Ninemile Creek Downstream of Warners Road bridge Latitude: 43.06993
Longitude: -76.27341
NINE-02 Lakeland Ninemile Creek off State Fair Boulevard Latitude: 43.08063
Longitude: -76.22647
LEY-01 Mattydale Ley Creek Upstream of Lemoyne Avenue bridge Latitude: 43.09008
Longitude: -76.14487
LEY-02 Syracuse Ley Creek Park Street bridge Latitude: 43.0763
Longitude: -76.1715
From the digital collections of the New York State Library.
11
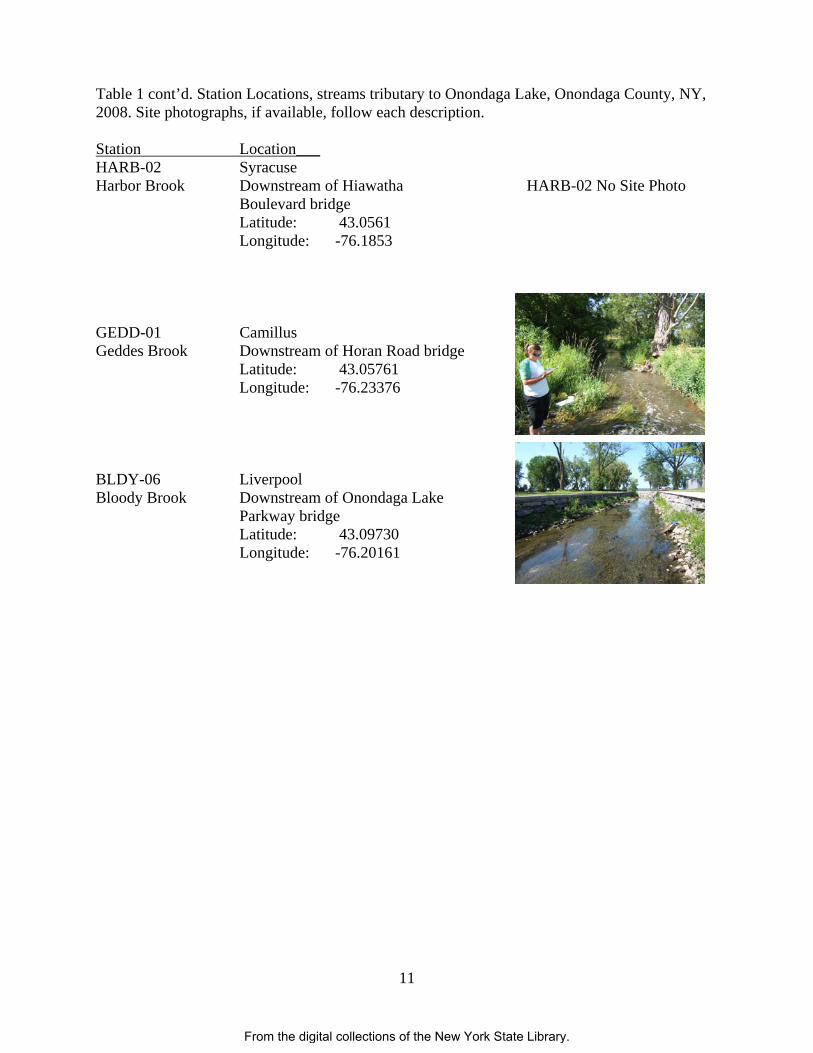
Table 1 cont’d. Station Locations, streams tributary to Onondaga Lake, Onondaga County, NY, 2008. Site photographs, if available, follow each description. Station Location___ HARB-02 Syracuse Harbor Brook Downstream of Hiawatha HARB-02 No Site Photo
Boulevard bridge Latitude: 43.0561
Longitude: -76.1853
GEDD-01 Camillus Geddes Brook Downstream of Horan Road bridge Latitude: 43.05761
Longitude: -76.23376
BLDY-06 Liverpool Bloody Brook Downstream of Onondaga Lake
Parkway bridge Latitude: 43.09730
Longitude: -76.20161
From the digital collections of the New York State Library.
12
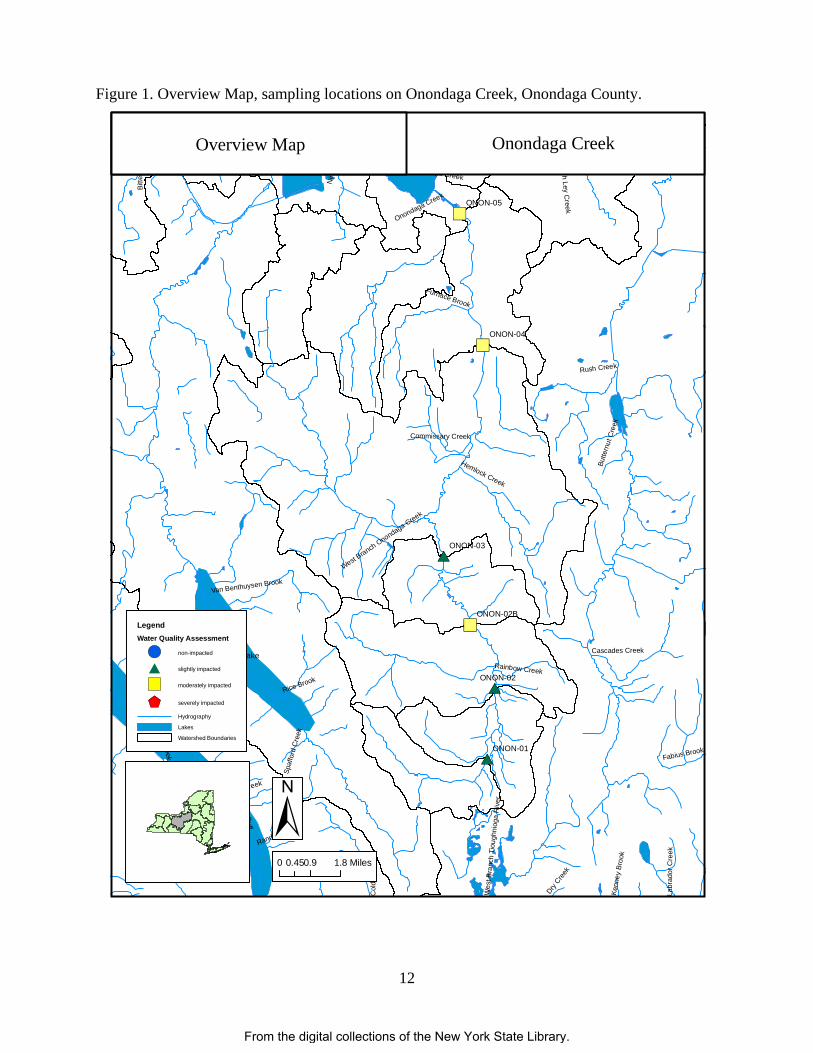
Figure 1. Overview Map, sampling locations on Onondaga Creek, Onondaga County.
")")
$+")
")
")
#
#
#
")
$+
")")
")
")
")
")
#*
#*
#*Skaneateles Lake
Otisco Lake
Onondaga LakeButternut Creek
Onondaga Creek
Nin
emile
Cre
ek
Spaf
ford
Cre
ek
Rush Creek
Hemlock Creek
Col
d B
rook
Bitte
r Bro
ok
Bear Swam
p Creek
Furnace Brook
West Branch Onondaga Creek
Cascades Creek
Rice Brook
Van Benthuysen Brook
Rainbow Creek
South Branch Ley Creek
Commissary Creek
Labr
ado r
Cr e
e k
Randall Gulf
Fabius Brook
Hall Creek
Barber Gulf
Wes
t Bra
nch
Tiou
ghni
oga
Riv
er
Dry Cre
ek
North Branch Ley Creek
Kenn
ey B
rook
Butte
rnut
Cre
ek
Onondaga Creek
ONON-01
ONON-02
ONON-03
LEY-01
ONON-04
ONON-05
NINE-02
BLDY-06
ONON-02B
LEY-02
±0 0.9 1.80.45 Miles
LegendWater Quality Assessment
!( non-impacted
# slightly impacted
") moderately impacted
$+ severely impacted
Hydrography
Lakes
Watershed Boundaries
Overview Map Onondaga Creek
From the digital collections of the New York State Library.
13
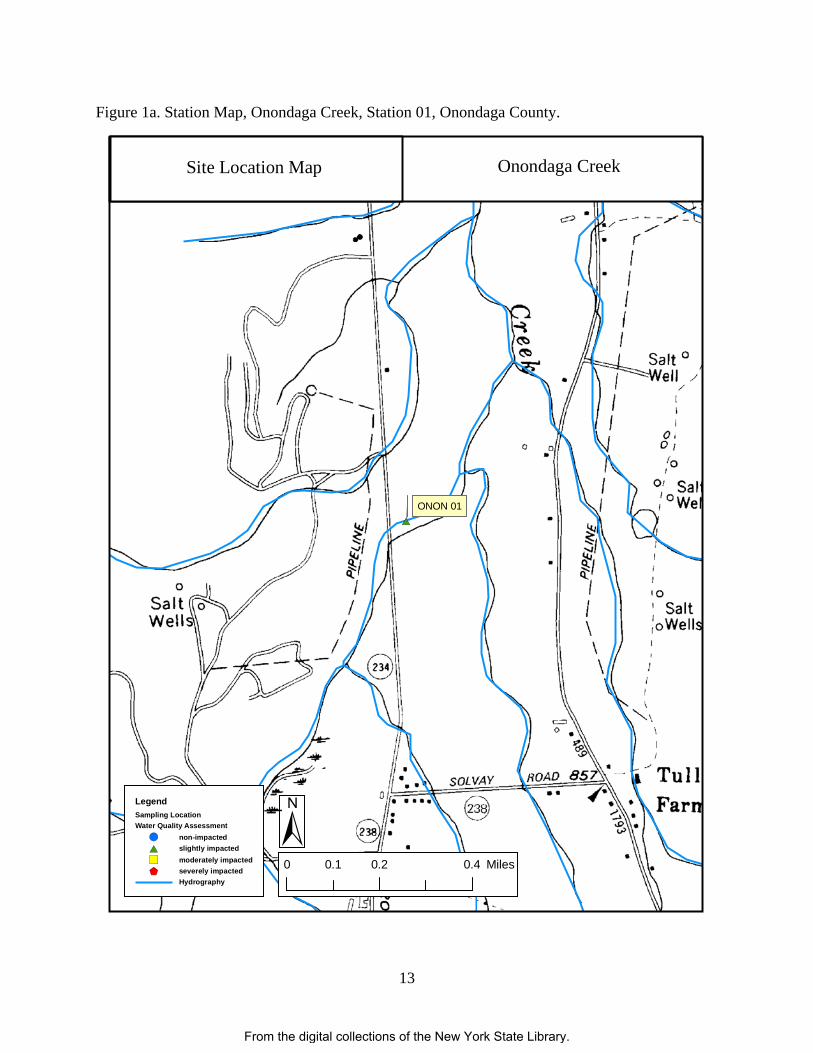
Figure 1a. Station Map, Onondaga Creek, Station 01, Onondaga County.
#*
ONON 01
LegendSampling LocationWater Quality Assessment
!( non-impacted#* slightly impacted
") moderately impacted$+ severely impacted
Hydrography
±0 0.2 0.40.1 Miles
Site Location Map Onondaga Creek
From the digital collections of the New York State Library.
14
Figure 1b. Station Map, Onondaga Creek, Station 02, Onondaga County.
#*
ONON 02
LegendSampling LocationWater Quality Assessment
!( non-impacted#* slightly impacted
") moderately impacted$+ severely impacted
Hydrography
±0 0.2 0.40.1 Miles
Site Location Map Onondaga Creek
From the digital collections of the New York State Library.
15
Figure 1c. Station Map, Onondaga Creek, Station 02B, Onondaga County.
")
ONON 02B
LegendSampling LocationWater Quality Assessment
!( non-impacted#* slightly impacted
") moderately impacted$+ severely impacted
Hydrography
±0 0.2 0.40.1 Miles
Site Location Map Onondaga Creek
From the digital collections of the New York State Library.
16
Figure 1d. Station Map, Onondaga Creek, Station 03, Onondaga County.
#*
ONON 03
LegendSampling LocationWater Quality Assessment
!( non-impacted#* slightly impacted
") moderately impacted$+ severely impacted
Hydrography
±0 0.2 0.40.1 Miles
Site Location Map Onondaga Creek
From the digital collections of the New York State Library.
17
Figure 1e. Station Map, Onondaga Creek, Station 04, Onondaga County.
")
ONON 04
LegendSampling LocationWater Quality Assessment
!( non-impacted#* slightly impacted
") moderately impacted$+ severely impacted
Hydrography
±0 0.2 0.40.1 Miles
Site Location Map Onondaga Creek
From the digital collections of the New York State Library.
18
Figure 1f. Station Map, Onondaga Creek, Station 05, Onondaga County.
")
ONON 05
LegendSampling LocationWater Quality Assessment
!( non-impacted#* slightly impacted
") moderately impacted$+ severely impacted
Hydrography
±0 0.2 0.4 Miles
Site Location Map Onondaga Creek
From the digital collections of the New York State Library.
19
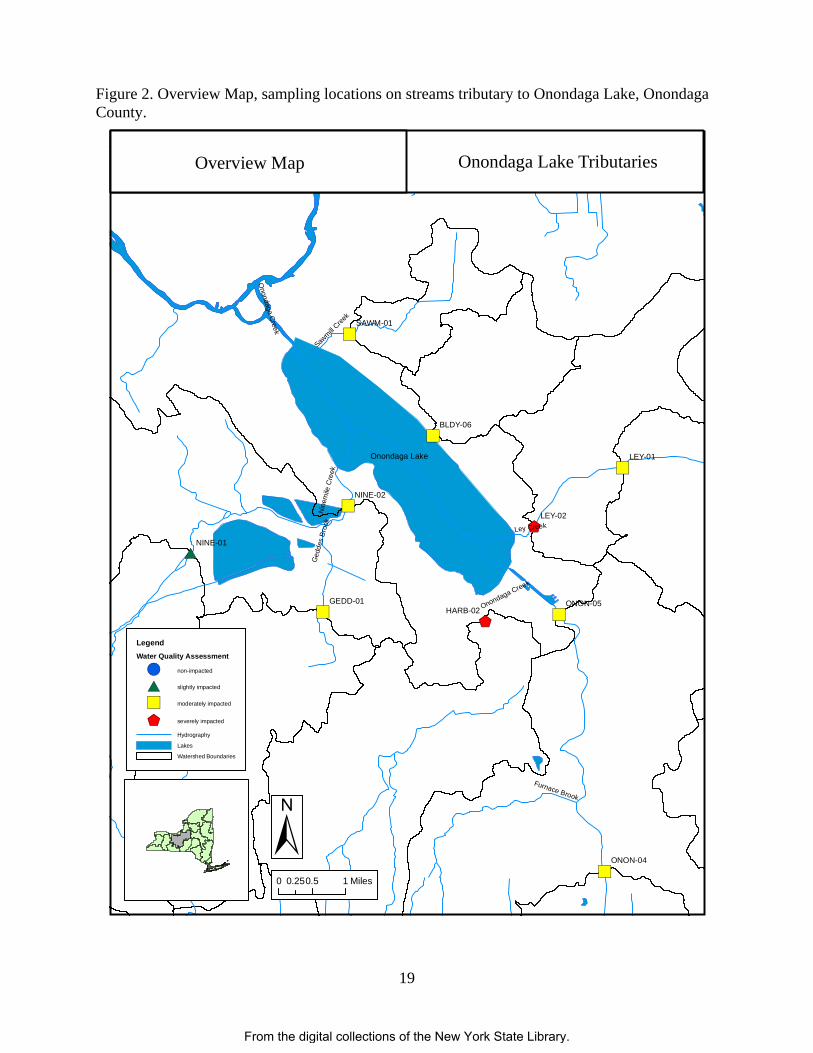
Figure 2. Overview Map, sampling locations on streams tributary to Onondaga Lake, Onondaga County.
")
")$+
")
$+
#*
")
")
")
")
Onondaga Lake
Onondaga C
reekLey Creek
Nin
emile
Cre
ek
Sawmill
Creek
Furnace Brook
Ged
des
Broo
k
Onondaga Creek
LEY-02
LEY-01
ONON-04
SAWM-01
ONON-05
NINE-02
NINE-01
HARB-02GEDD-01
BLDY-06
±0 0.5 10.25 Miles
LegendWater Quality Assessment
!( non-impacted
#* slightly impacted
") moderately impacted
$+ severely impacted
Hydrography
Lakes
Watershed Boundaries
Overview Map Onondaga Lake Tributaries
From the digital collections of the New York State Library.

20
Figure 2a. Station Map, Sawmill Creek Station 01, Onondaga County.
")
SAWM 01
LegendSampling LocationWater Quality Assessment
!( non-impacted#* slightly impacted
") moderately impacted$+ severely impacted
Hydrography
±0 0.2 0.4 Miles
Site Location Map Sawmill Creek
From the digital collections of the New York State Library.
21
Figure 2b. Station Map, Ninemile Creek stations 01 and 02, Geddes Brook Station 01, Onondaga County.
")
#*
")
NINE 02
NINE 01
GEDD 01
LegendSampling LocationWater Quality Assessment
!( non-impacted#* slightly impacted
") moderately impacted$+ severely impacted
Hydrography
±0 0.5 1 Miles
Site Location Map Nine Mile Creek
From the digital collections of the New York State Library.
22
Figure 2c. Station Map, Ley Creek stations 01 and 02, Onondaga County.
$+
$+
")
$+
")
LEY 02
LEY 01
ONON 05
BLDY 01
LegendSampling LocationWater Quality Assessment
!( non-impacted#* slightly impacted
") moderately impacted$+ severely impacted
Hydrography
±0 0.5 1 Miles
Site Location Map Ley Creek
From the digital collections of the New York State Library.
23
Figure 2d. Station Map, Harbor Brook Station 02, Onondaga County.
$+
HARB 02
LegendSampling LocationWater Quality Assessment
!( non-impacted#* slightly impacted
") moderately impacted$+ severely impacted
Hydrography
±0 0.2 0.4 Miles
Site Location Map Harbor Brook
From the digital collections of the New York State Library.
24
Figure 2e. Station Map, Bloody Brook Station 06, Onondaga County.
")
")
")
BLDY 06
BLDY 05
BLDY 04
BLDY 06A
LegendSampling LocationWater Quality Assessment
!( non-impacted#* slightly impacted
") moderately impacted$+ severely impacted
Hydrography
±0 0.2 0.4 Miles
Site Location Map Bloody Brook
From the digital collections of the New York State Library.
25
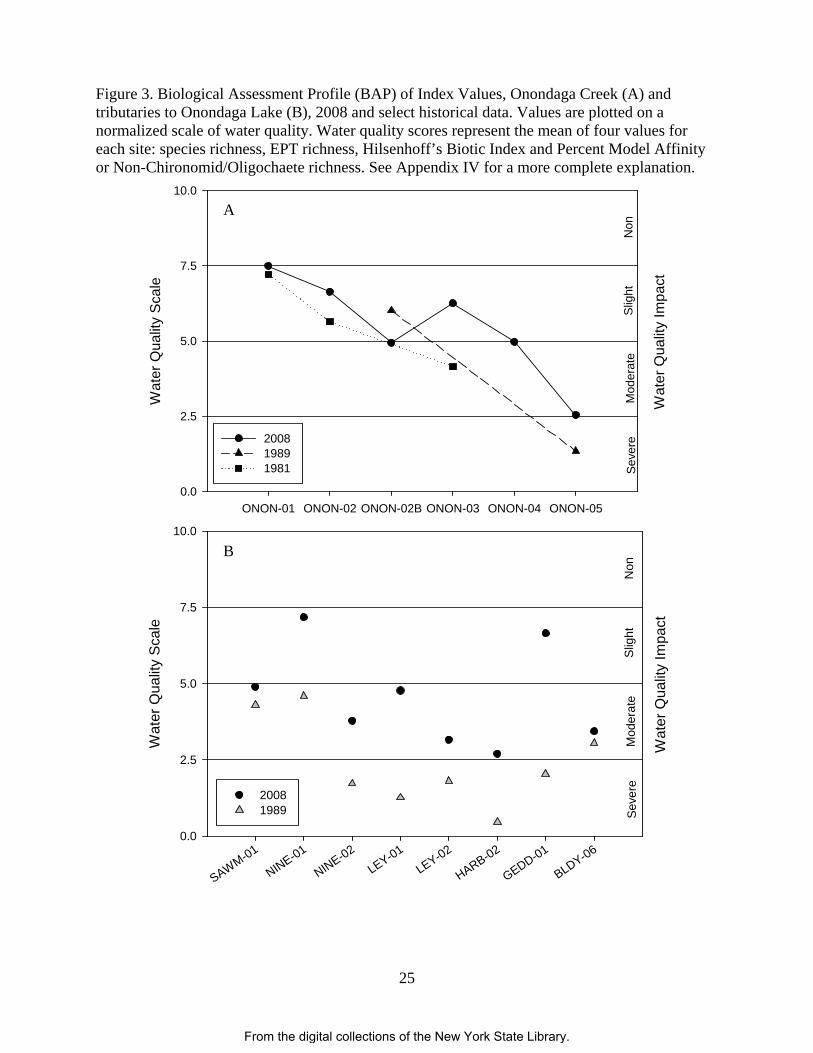
Figure 3. Biological Assessment Profile (BAP) of Index Values, Onondaga Creek (A) and tributaries to Onondaga Lake (B), 2008 and select historical data. Values are plotted on a normalized scale of water quality. Water quality scores represent the mean of four values for each site: species richness, EPT richness, Hilsenhoff’s Biotic Index and Percent Model Affinity or Non-Chironomid/Oligochaete richness. See Appendix IV for a more complete explanation.
Non
Slig
htM
oder
ate
Seve
re
ONON-01 ONON-02 ONON-02B ONON-03 ONON-04 ONON-05
Wat
er Q
ualit
y S
cale
0.0
2.5
5.0
7.5
10.0
2008 1989 1981
Non
Slig
htM
oder
ate
Seve
re
Wat
er Q
ualit
y Im
pact
SAWM-01
NINE-01
NINE-02LEY-01
LEY-02
HARB-02
GEDD-01
BLDY-06
Wat
er Q
ualit
y S
cale
0.0
2.5
5.0
7.5
10.0
2008 1989
Non
Slig
htM
oder
ate
Seve
re
Wat
er Q
ualit
y Im
pact
A
B
From the digital collections of the New York State Library.
26
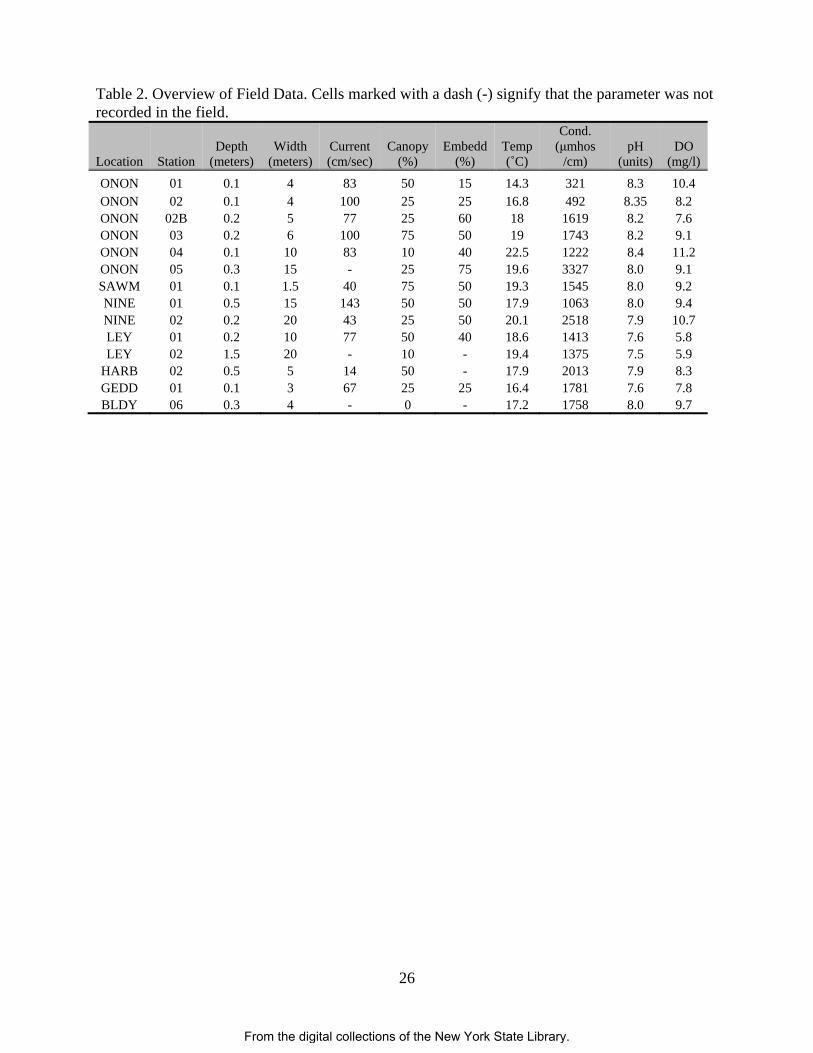
Table 2. Overview of Field Data. Cells marked with a dash (-) signify that the parameter was not recorded in the field.
Location Station Depth
(meters) Width
(meters) Current (cm/sec)
Canopy (%)
Embedd (%)
Temp (˚C)
Cond. (μmhos
/cm) pH
(units) DO
(mg/l)
ONON 01 0.1 4 83 50 15 14.3 321 8.3 10.4 ONON 02 0.1 4 100 25 25 16.8 492 8.35 8.2 ONON 02B 0.2 5 77 25 60 18 1619 8.2 7.6 ONON 03 0.2 6 100 75 50 19 1743 8.2 9.1 ONON 04 0.1 10 83 10 40 22.5 1222 8.4 11.2 ONON 05 0.3 15 - 25 75 19.6 3327 8.0 9.1 SAWM 01 0.1 1.5 40 75 50 19.3 1545 8.0 9.2 NINE 01 0.5 15 143 50 50 17.9 1063 8.0 9.4 NINE 02 0.2 20 43 25 50 20.1 2518 7.9 10.7 LEY 01 0.2 10 77 50 40 18.6 1413 7.6 5.8 LEY 02 1.5 20 - 10 - 19.4 1375 7.5 5.9
HARB 02 0.5 5 14 50 - 17.9 2013 7.9 8.3 GEDD 01 0.1 3 67 25 25 16.4 1781 7.6 7.8 BLDY 06 0.3 4 - 0 - 17.2 1758 8.0 9.7
From the digital collections of the New York State Library.
27
Table 3. Impact Source Determination (ISD), streams tributary to Onondaga Lake, 2008. Numbers represent percent similarity to community type models for each impact category. Highest similarities at each station are shaded. Similarities less than 50% are inconclusive. Highest numbers represent probable stressor(s) to the community. See Appendix XI for further explanation.
Station Community Type Natural Nutrients Toxic Organic Complex Siltation Impoundment
ONON 01 67 47 29 36 30 39 33 02 66 62 43 36 44 44 39
02B 45 40 40 39 40 56 47 03 48 48 46 52 43 61 50 04 38 50 61 59 57 66 54 05 15 15 45 57 58 30 53
SAWM 01 32 45 54 35 46 34 41 NINE 01 45 38 45 40 45 36 45
02 13 21 40 53 75 27 52 LEY 01 26 44 49 46 41 52 44
02 9 24 36 53 50 31 64 HARB 02 19 25 44 72 56 44 49 GEDD 01 33 25 35 34 38 33 35 BLDY 06 44 10 21 46 39 25 34
Note: ISDs are intended to supplement macroinvertebrate community assessments.
From the digital collections of the New York State Library.
28
Figure 4. Results of substrate pebble counts for Onondaga Creek sampling locations. Each particle size is given as a percent out of 100 counted “pebbles” from each site, recorded in the field.
Location
ONON-01 ONON-02 ONON-2B ONON-03 ONON-04 ONON-05
% S
ubst
rate
0.0
0.2
0.4
0.6
0.8
1.0
% Silt % Sand % Gravel % Crse Gravel % Rubble % Rock
From the digital collections of the New York State Library.
29
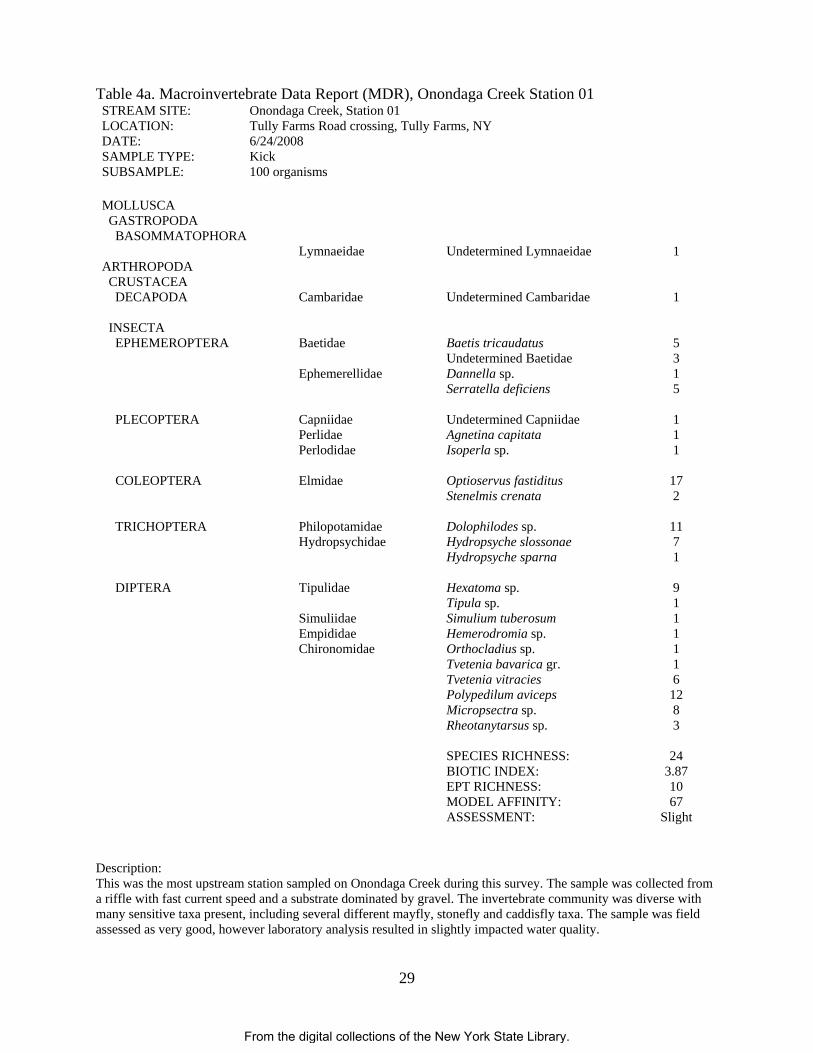
Table 4a. Macroinvertebrate Data Report (MDR), Onondaga Creek Station 01 STREAM SITE: LOCATION: DATE: SAMPLE TYPE: SUBSAMPLE:
Onondaga Creek, Station 01 Tully Farms Road crossing, Tully Farms, NY 6/24/2008 Kick 100 organisms
MOLLUSCA GASTROPODA BASOMMATOPHORA ARTHROPODA CRUSTACEA DECAPODA INSECTA EPHEMEROPTERA PLECOPTERA COLEOPTERA TRICHOPTERA DIPTERA
Lymnaeidae Cambaridae Baetidae Ephemerellidae Capniidae Perlidae Perlodidae Elmidae Philopotamidae Hydropsychidae Tipulidae Simuliidae Empididae Chironomidae
Undetermined Lymnaeidae Undetermined Cambaridae Baetis tricaudatus Undetermined Baetidae Dannella sp. Serratella deficiens Undetermined Capniidae Agnetina capitata Isoperla sp. Optioservus fastiditus Stenelmis crenata Dolophilodes sp. Hydropsyche slossonae Hydropsyche sparna Hexatoma sp. Tipula sp. Simulium tuberosum Hemerodromia sp. Orthocladius sp. Tvetenia bavarica gr. Tvetenia vitracies Polypedilum aviceps Micropsectra sp. Rheotanytarsus sp. SPECIES RICHNESS: BIOTIC INDEX: EPT RICHNESS: MODEL AFFINITY: ASSESSMENT:
1
1
5 3 1 5
1 1 1
17 2
11 7 1
9 1 1 1 1 1 6
12 8 3
24 3.87 10 67
Slight
Description: This was the most upstream station sampled on Onondaga Creek during this survey. The sample was collected from a riffle with fast current speed and a substrate dominated by gravel. The invertebrate community was diverse with many sensitive taxa present, including several different mayfly, stonefly and caddisfly taxa. The sample was field assessed as very good, however laboratory analysis resulted in slightly impacted water quality.
From the digital collections of the New York State Library.
30
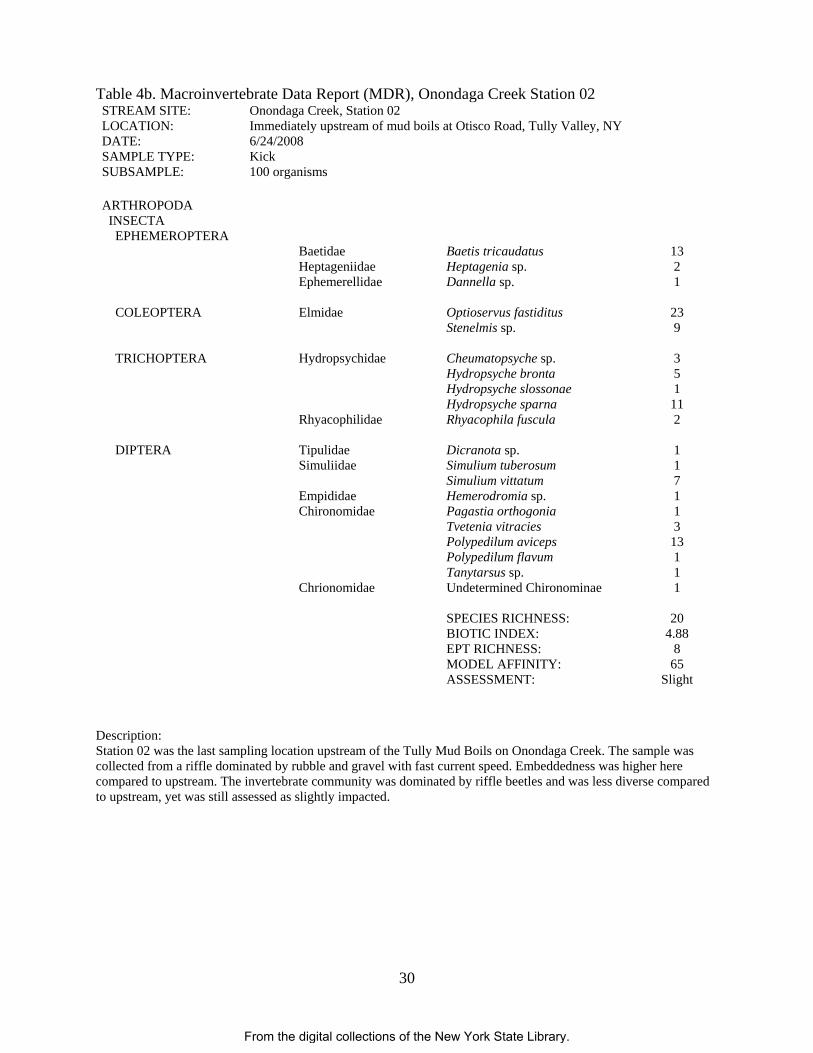
Table 4b. Macroinvertebrate Data Report (MDR), Onondaga Creek Station 02 STREAM SITE: LOCATION: DATE: SAMPLE TYPE: SUBSAMPLE:
Onondaga Creek, Station 02 Immediately upstream of mud boils at Otisco Road, Tully Valley, NY 6/24/2008 Kick 100 organisms
ARTHROPODA INSECTA EPHEMEROPTERA COLEOPTERA TRICHOPTERA DIPTERA
Baetidae Heptageniidae Ephemerellidae Elmidae Hydropsychidae Rhyacophilidae Tipulidae Simuliidae Empididae Chironomidae Chrionomidae
Baetis tricaudatus Heptagenia sp. Dannella sp. Optioservus fastiditus Stenelmis sp. Cheumatopsyche sp. Hydropsyche bronta Hydropsyche slossonae Hydropsyche sparna Rhyacophila fuscula Dicranota sp. Simulium tuberosum Simulium vittatum Hemerodromia sp. Pagastia orthogonia Tvetenia vitracies Polypedilum aviceps Polypedilum flavum Tanytarsus sp. Undetermined Chironominae SPECIES RICHNESS: BIOTIC INDEX: EPT RICHNESS: MODEL AFFINITY: ASSESSMENT:
13 2 1
23 9 3 5 1
11 2 1 1 7 1 1 3
13 1 1 1
20 4.88
8 65
Slight
Description: Station 02 was the last sampling location upstream of the Tully Mud Boils on Onondaga Creek. The sample was collected from a riffle dominated by rubble and gravel with fast current speed. Embeddedness was higher here compared to upstream. The invertebrate community was dominated by riffle beetles and was less diverse compared to upstream, yet was still assessed as slightly impacted.
From the digital collections of the New York State Library.
31
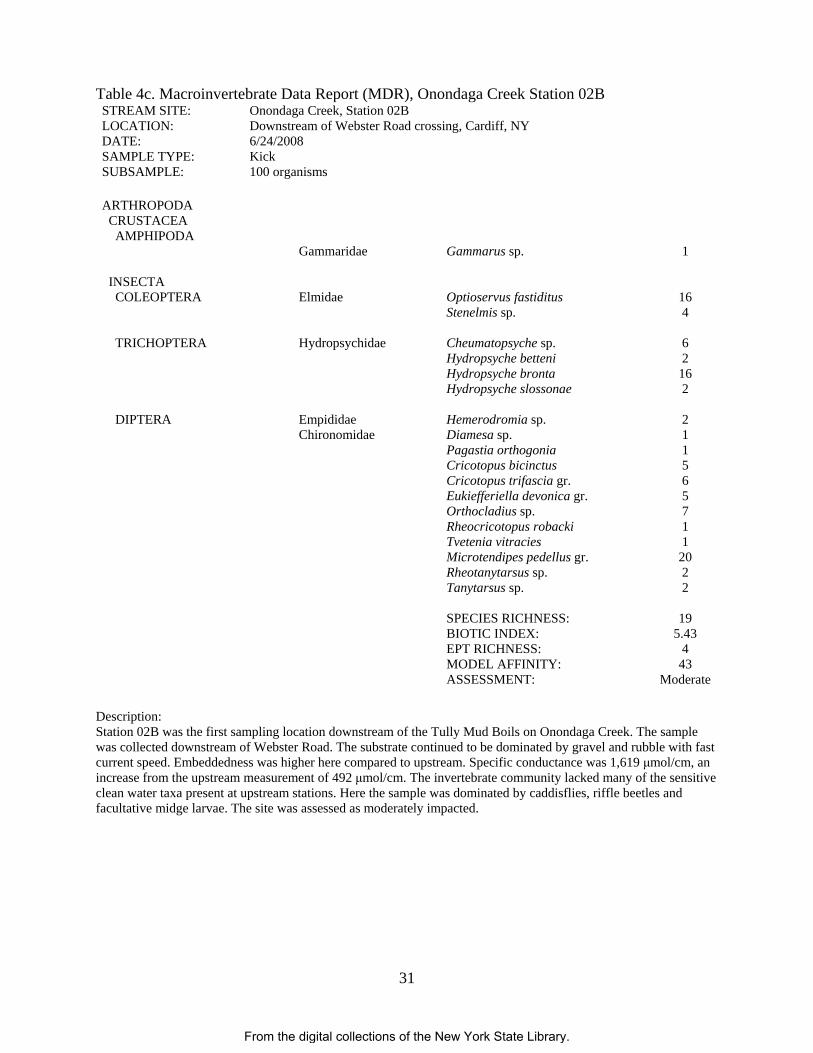
Table 4c. Macroinvertebrate Data Report (MDR), Onondaga Creek Station 02B STREAM SITE: LOCATION: DATE: SAMPLE TYPE: SUBSAMPLE:
Onondaga Creek, Station 02B Downstream of Webster Road crossing, Cardiff, NY 6/24/2008 Kick 100 organisms
ARTHROPODA CRUSTACEA AMPHIPODA INSECTA COLEOPTERA TRICHOPTERA DIPTERA
Gammaridae Elmidae Hydropsychidae Empididae Chironomidae
Gammarus sp. Optioservus fastiditus Stenelmis sp. Cheumatopsyche sp. Hydropsyche betteni Hydropsyche bronta Hydropsyche slossonae Hemerodromia sp. Diamesa sp. Pagastia orthogonia Cricotopus bicinctus Cricotopus trifascia gr. Eukiefferiella devonica gr. Orthocladius sp. Rheocricotopus robacki Tvetenia vitracies Microtendipes pedellus gr. Rheotanytarsus sp. Tanytarsus sp. SPECIES RICHNESS: BIOTIC INDEX: EPT RICHNESS: MODEL AFFINITY: ASSESSMENT:
1
16 4 6 2
16 2 2 1 1 5 6 5 7 1 1
20 2 2
19 5.43
4 43
Moderate
Description: Station 02B was the first sampling location downstream of the Tully Mud Boils on Onondaga Creek. The sample was collected downstream of Webster Road. The substrate continued to be dominated by gravel and rubble with fast current speed. Embeddedness was higher here compared to upstream. Specific conductance was 1,619 μmol/cm, an increase from the upstream measurement of 492 μmol/cm. The invertebrate community lacked many of the sensitive clean water taxa present at upstream stations. Here the sample was dominated by caddisflies, riffle beetles and facultative midge larvae. The site was assessed as moderately impacted.
From the digital collections of the New York State Library.
32
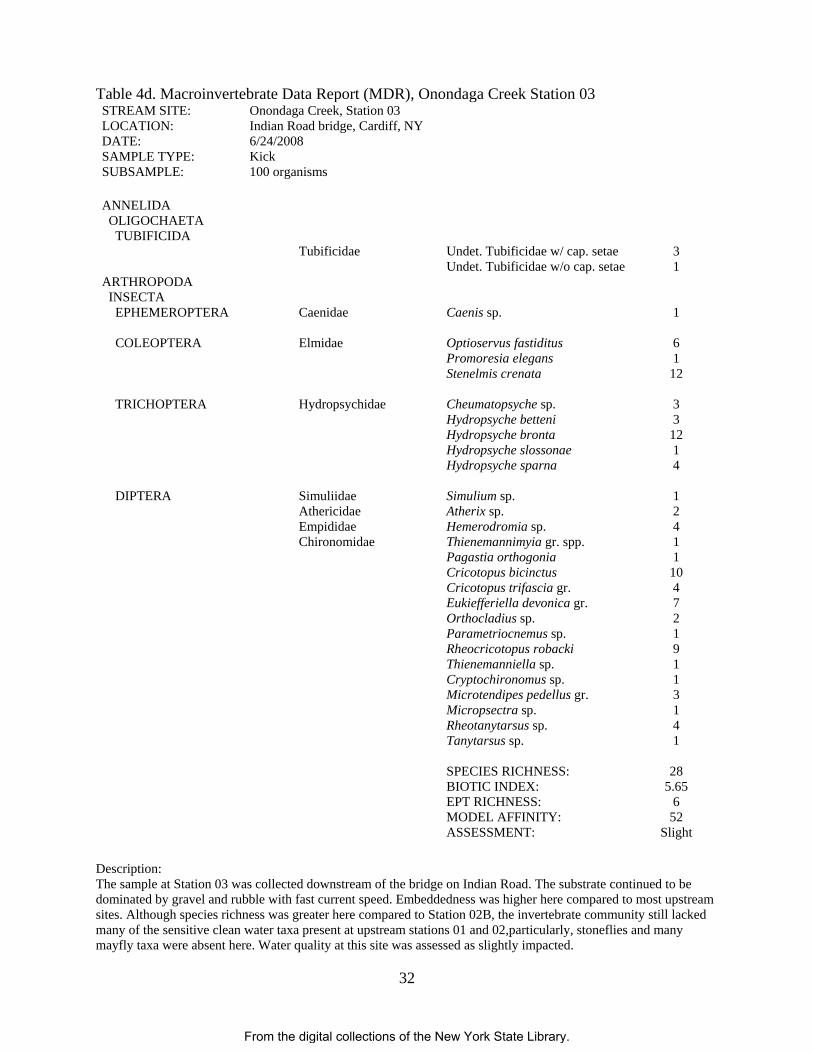
Table 4d. Macroinvertebrate Data Report (MDR), Onondaga Creek Station 03 STREAM SITE: LOCATION: DATE: SAMPLE TYPE: SUBSAMPLE:
Onondaga Creek, Station 03 Indian Road bridge, Cardiff, NY 6/24/2008 Kick 100 organisms
ANNELIDA OLIGOCHAETA TUBIFICIDA ARTHROPODA INSECTA EPHEMEROPTERA COLEOPTERA TRICHOPTERA DIPTERA
Tubificidae Caenidae Elmidae Hydropsychidae Simuliidae Athericidae Empididae Chironomidae
Undet. Tubificidae w/ cap. setae Undet. Tubificidae w/o cap. setae Caenis sp. Optioservus fastiditus Promoresia elegans Stenelmis crenata Cheumatopsyche sp. Hydropsyche betteni Hydropsyche bronta Hydropsyche slossonae Hydropsyche sparna Simulium sp. Atherix sp. Hemerodromia sp. Thienemannimyia gr. spp. Pagastia orthogonia Cricotopus bicinctus Cricotopus trifascia gr. Eukiefferiella devonica gr. Orthocladius sp. Parametriocnemus sp. Rheocricotopus robacki Thienemanniella sp. Cryptochironomus sp. Microtendipes pedellus gr. Micropsectra sp. Rheotanytarsus sp. Tanytarsus sp. SPECIES RICHNESS: BIOTIC INDEX: EPT RICHNESS: MODEL AFFINITY: ASSESSMENT:
3 1
1
6 1
12
3 3
12 1 4
1 2 4 1 1
10 4 7 2 1 9 1 1 3 1 4 1
28 5.65
6 52
Slight
Description: The sample at Station 03 was collected downstream of the bridge on Indian Road. The substrate continued to be dominated by gravel and rubble with fast current speed. Embeddedness was higher here compared to most upstream sites. Although species richness was greater here compared to Station 02B, the invertebrate community still lacked many of the sensitive clean water taxa present at upstream stations 01 and 02,particularly, stoneflies and many mayfly taxa were absent here. Water quality at this site was assessed as slightly impacted.
From the digital collections of the New York State Library.
33
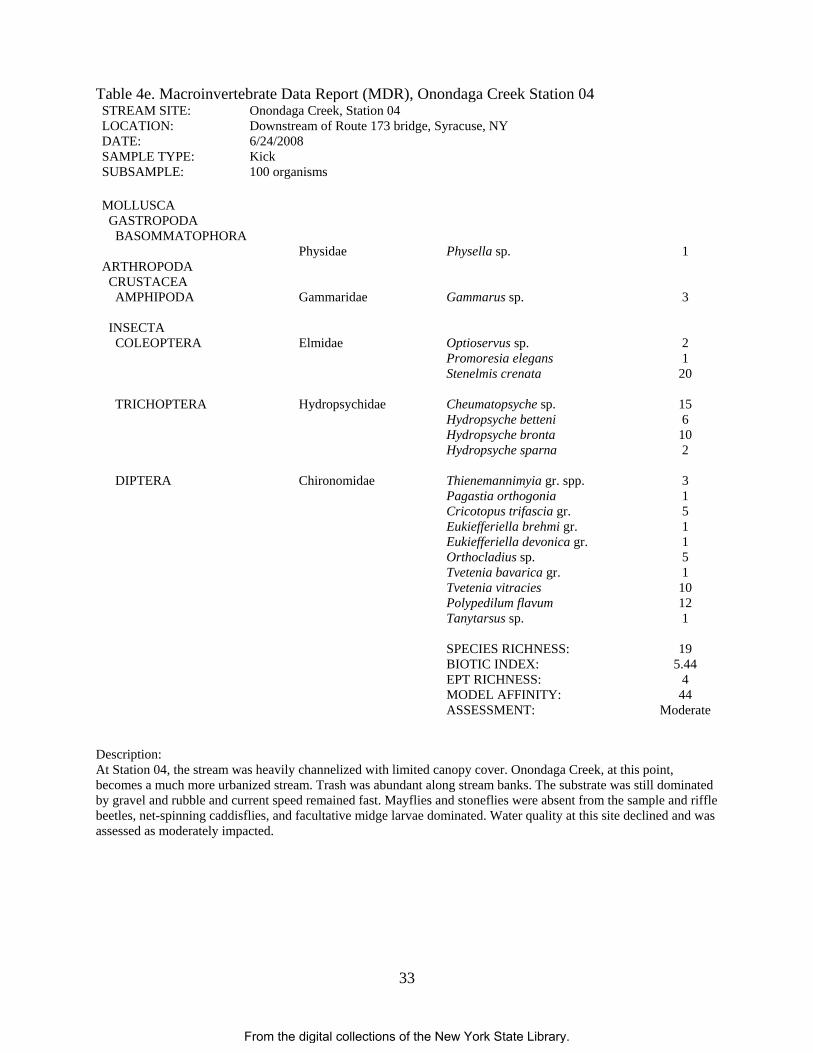
Table 4e. Macroinvertebrate Data Report (MDR), Onondaga Creek Station 04 STREAM SITE: LOCATION: DATE: SAMPLE TYPE: SUBSAMPLE:
Onondaga Creek, Station 04 Downstream of Route 173 bridge, Syracuse, NY 6/24/2008 Kick 100 organisms
MOLLUSCA GASTROPODA BASOMMATOPHORA ARTHROPODA CRUSTACEA AMPHIPODA INSECTA COLEOPTERA TRICHOPTERA DIPTERA
Physidae Gammaridae Elmidae Hydropsychidae Chironomidae
Physella sp. Gammarus sp. Optioservus sp. Promoresia elegans Stenelmis crenata Cheumatopsyche sp. Hydropsyche betteni Hydropsyche bronta Hydropsyche sparna Thienemannimyia gr. spp. Pagastia orthogonia Cricotopus trifascia gr. Eukiefferiella brehmi gr. Eukiefferiella devonica gr. Orthocladius sp. Tvetenia bavarica gr. Tvetenia vitracies Polypedilum flavum Tanytarsus sp. SPECIES RICHNESS: BIOTIC INDEX: EPT RICHNESS: MODEL AFFINITY: ASSESSMENT:
1 3 2 1
20
15 6
10 2 3 1 5 1 1 5 1
10 12 1
19 5.44
4 44
Moderate
Description: At Station 04, the stream was heavily channelized with limited canopy cover. Onondaga Creek, at this point, becomes a much more urbanized stream. Trash was abundant along stream banks. The substrate was still dominated by gravel and rubble and current speed remained fast. Mayflies and stoneflies were absent from the sample and riffle beetles, net-spinning caddisflies, and facultative midge larvae dominated. Water quality at this site declined and was assessed as moderately impacted.
From the digital collections of the New York State Library.
34
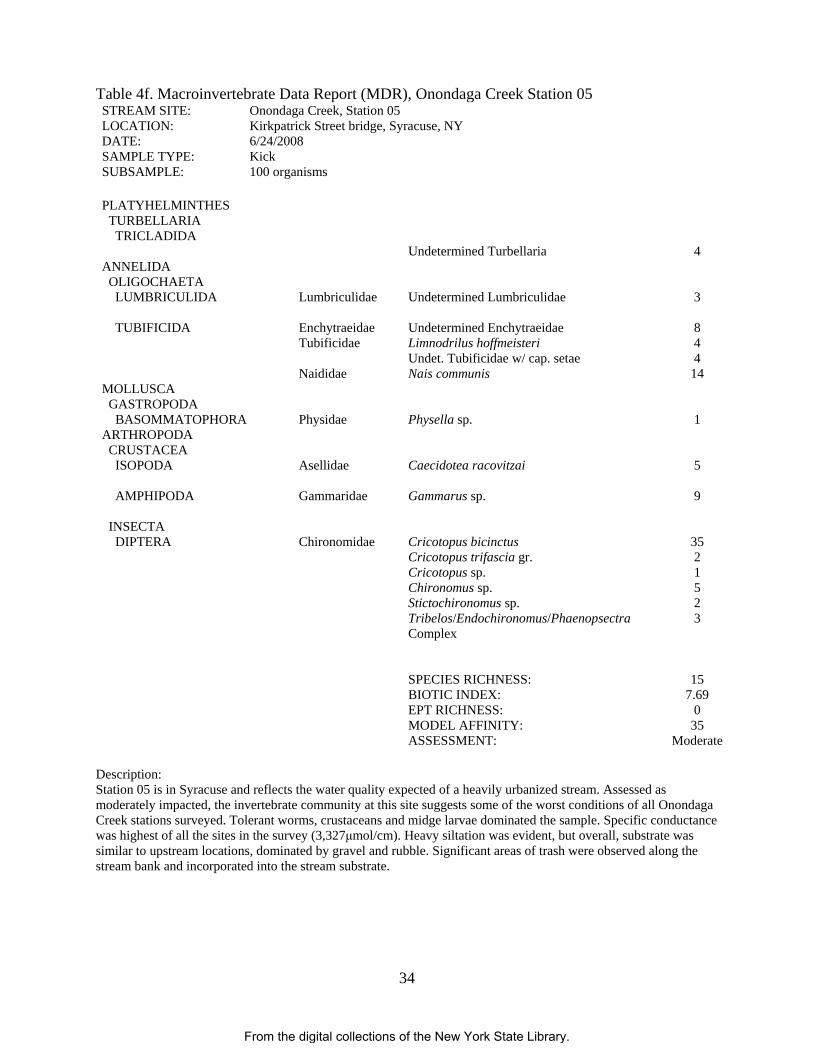
Table 4f. Macroinvertebrate Data Report (MDR), Onondaga Creek Station 05 STREAM SITE: LOCATION: DATE: SAMPLE TYPE: SUBSAMPLE:
Onondaga Creek, Station 05 Kirkpatrick Street bridge, Syracuse, NY 6/24/2008 Kick 100 organisms
PLATYHELMINTHES TURBELLARIA TRICLADIDA ANNELIDA OLIGOCHAETA LUMBRICULIDA TUBIFICIDA MOLLUSCA GASTROPODA BASOMMATOPHORA ARTHROPODA CRUSTACEA ISOPODA AMPHIPODA INSECTA DIPTERA
Lumbriculidae Enchytraeidae Tubificidae Naididae Physidae Asellidae Gammaridae Chironomidae
Undetermined Turbellaria Undetermined Lumbriculidae Undetermined Enchytraeidae Limnodrilus hoffmeisteri Undet. Tubificidae w/ cap. setae Nais communis Physella sp. Caecidotea racovitzai Gammarus sp. Cricotopus bicinctus Cricotopus trifascia gr. Cricotopus sp. Chironomus sp. Stictochironomus sp. Tribelos/Endochironomus/Phaenopsectra Complex SPECIES RICHNESS: BIOTIC INDEX: EPT RICHNESS: MODEL AFFINITY: ASSESSMENT:
4 3 8 4 4
14 1 5 9
35 2 1 5 2 3
15 7.69
0 35
Moderate Description: Station 05 is in Syracuse and reflects the water quality expected of a heavily urbanized stream. Assessed as moderately impacted, the invertebrate community at this site suggests some of the worst conditions of all Onondaga Creek stations surveyed. Tolerant worms, crustaceans and midge larvae dominated the sample. Specific conductance was highest of all the sites in the survey (3,327μmol/cm). Heavy siltation was evident, but overall, substrate was similar to upstream locations, dominated by gravel and rubble. Significant areas of trash were observed along the stream bank and incorporated into the stream substrate.
From the digital collections of the New York State Library.
35
Table 4g. Macroinvertebrate Data Report (MDR), Sawmill Creek Station 01 STREAM SITE: LOCATION: DATE: SAMPLE TYPE: SUBSAMPLE:
Sawmill Creek, Station 01 Upstream of Route 370 bridge, Liverpool, NY 6/25/2008 Kick 97 organisms
PLATYHELMINTHES TURBELLARIA TRICLADIDA ARTHROPODA CRUSTACEA ISOPODA AMPHIPODA INSECTA COLEOPTERA TRICHOPTERA DIPTERA
Asellidae Gammaridae Psephenidae Elmidae Philopotamidae Hydropsychidae Tipulidae Simuliidae Chironomidae
Undetermined Turbellaria Caecidotea racovitzai Gammarus sp. Ectopria nervosa Stenelmis crenata Chimarra aterrima? Cheumatopsyche sp. Hydropsyche betteni Tipula sp. Simulium vittatum Thienemannimyia gr. spp. Diamesa sp. Cricotopus bicinctus Orthocladius sp. Parametriocnemus sp. Polypedilum flavum Polypedilum laetum SPECIES RICHNESS: BIOTIC INDEX: EPT RICHNESS: MODEL AFFINITY: ASSESSMENT:
12 8 8 1
17
16 9 2 1 3 4 1 1 1 9 3 1
17 5.52
3 50
Moderate
Description: Station 01 on Sawmill Creek was sampled upstream of the Route 370 bridge. Water quality was field assessed as poor, but later assessed as moderately impacted based on laboratory analysis. Although canopy cover was extensive (75%) and the substrate favorable for invertebrate colonization (mix of rock, rubble and gravel) the stream is small (1.5 m wide) and current speed was slow (40 cm/sec). Specific conductance was high for this small tributary (1,545μmol/cm). The invertebrate community at this site was not diverse and included tolerant organisms such as the sowbug (Caecidotea racovitzai), scuds (Gammarus sp.), and flat worms (Undetermined Turbellaria).
From the digital collections of the New York State Library.
36
Table 4h. Macroinvertebrate Data Report (MDR), Ninemile Creek Station 01 STREAM SITE: LOCATION: DATE: SAMPLE TYPE: SUBSAMPLE:
Ninemile Creek, Station 01 Warners Road bridge, Amboy, NY 6/25/2008 Kick 100 organisms
MOLLUSCA PELECYPODA VENEROIDEA ARTHROPODA CRUSTACEA AMPHIPODA DECAPODA INSECTA EPHEMEROPTERA COLEOPTERA MEGALOPTERA TRICHOPTERA DIPTERA
Sphaeriidae Gammaridae Cambaridae Baetidae Ephemerellidae Elmidae Corydalidae Philopotamidae Hydropsychidae Rhyacophilidae Hydroptilidae Simuliidae Chironomidae
Pisidium sp. Gammarus sp. Undetermined Cambaridae Baetis flavistriga Baetis tricaudatus Ephemerella invaria Optioservus sp. Promoresia elegans Promoresia tardella Stenelmis sp. Nigronia serricornis Undetermined Philopotamidae Cheumatopsyche sp. Hydropsyche betteni Hydropsyche slossonae Hydropsyche sparna Rhyacophila fuscula Hydroptila sp. Simulium vittatum Thienemannimyia gr. spp. Pagastia orthogonia Cricotopus trifascia gr. Eukiefferiella claripennis gr. Eukiefferiella devonica gr. Orthocladius sp. Microtendipes pedellus gr. Polypedilum aviceps Micropsectra sp. SPECIES RICHNESS: BIOTIC INDEX: EPT RICHNESS: MODEL AFFINITY: ASSESSMENT:
1
22
1
1 7 1
3 1 3 3
1
4 2 2 4 3 1 5
3 2 1 7 1
17 1 1 1 1
28 5.09 10 59
Slight
Description: Station 01 on Ninemile Creek was sampled downstream of Warners Road bridge. This station was the most upstream of two sites sampled on Ninemile Creek. Water quality was field assessed as good and was later assessed as slightly impacted after laboratory analysis. The invertebrate community was diverse. Stoneflies were noted in the field although not captured in the subsampling.
From the digital collections of the New York State Library.
37
Table 4i. Macroinvertebrate Data Report (MDR), Ninemile Creek Station 02 STREAM SITE: LOCATION: DATE: SAMPLE TYPE: SUBSAMPLE:
Ninemile Creek, Station 02 Off State Fair Boulevard, Lakeland, NY 6/25/2008 Net Jab 100 organisms
ANNELIDA OLIGOCHAETA TUBIFICIDA MOLLUSCA GASTROPODA BASOMMATOPHORA ARTHROPODA CRUSTACEA ISOPODA AMPHIPODA INSECTA COLEOPTERA DIPTERA
Tubificidae Physidae Asellidae Gammaridae Elmidae Simuliidae Empididae Chironomidae
Undet. Tubificidae w/ cap. setae Undet. Tubificidae w/o cap. setae Physella sp. Caecidotea racovitzai Gammarus sp. Promoresia sp. Stenelmis crenata Simulium vittatum Hemerodromia sp. Thienemannimyia gr. spp. Prodiamesa olivacea Cricotopus bicinctus Cricotopus sylvestris gr. Orthocladius sp. Microtendipes pedellus gr. Polypedilum aviceps SPECIES RICHNESS: BIOTIC INDEX: EPT RICHNESS: MODEL AFFINITY: ASSESSMENT:
2
23 2
15
38 1 2 3 1 3 1 1 1 3 3 1
16 7.33
0 31
Moderate
Description: Water quality was assessed as moderately impacted. The sample was collected off State Fair Boulevard at a point where the stream becomes slow and flat. There were no riffles at this site and the sample was collected from a muck/silt substrate using a net jab. Habitat constraints on the invertebrate community contributed to the assessment of moderately impacted water quality at this site.
From the digital collections of the New York State Library.
38
Table 4j. Macroinvertebrate Data Report (MDR), Ley Creek Station 01 STREAM SITE: LOCATION: DATE: SAMPLE TYPE: SUBSAMPLE:
Ley Creek, Station 01 Upstream of Lemoyne Avenue bridge, Mattydale, NY 6/25/2008 Kick 100 organisms
MOLLUSCA PELECYPODA VENEROIDEA ARTHROPODA CRUSTACEA AMPHIPODA DECAPODA INSECTA COLEOPTERA TRICHOPTERA DIPTERA
Sphaeriidae Gammaridae Cambaridae Elmidae Hydropsychidae Hydroptilidae Chironomidae
Sphaerium sp. Gammarus sp. Undetermined Cambaridae Stenelmis sp. Cheumatopsyche sp. Hydropsyche betteni Hydropsyche sparna Hydroptila sp. Cricotopus bicinctus Cricotopus trifascia gr. Cricotopus sp. Orthocladius sp. Rheocricotopus robacki Tvetenia bavarica gr. Polypedilum illinoense Polypedilum tritum Tribelos/Endochironomus/Phaenopsectra Co Tanytarsus sp. SPECIES RICHNESS: BIOTIC INDEX: EPT RICHNESS: MODEL AFFINITY: ASSESSMENT:
2
8
1
8
1 1 9 2
23 4
11 5
10 2 4 7 1 1
18 6.25
4 48
Moderate Description: Station 01 is the most upstream of the two sites sampled on Ley Creek. It is located in Mattydale, a suburb of Syracuse. The stream is channelized at this station and an abundance of trash was observed. The sample was dominated by non-biting midge larvae (Chironomidae) many of which were facultative or tolerant. Mayflies, and stoneflies were absent and the caddisfly community was dominated by net-spinning taxa. The station was assessed as moderately impacted.
From the digital collections of the New York State Library.

39
Table 4k. Macroinvertebrate Data Report (MDR), Ley Creek Station 02 STREAM SITE: LOCATION: DATE: SAMPLE TYPE: SUBSAMPLE:
Ley Creek, Station 02 Park Street bridge, Syracuse, NY 6/25/2008 Net Jab 100 organisms
PLATYHELMINTHES TURBELLARIA TRICLADIDA ANNELIDA OLIGOCHAETA TUBIFICIDA MOLLUSCA GASTROPODA BASOMMATOPHORA MESOGASTROPODA PELECYPODA VENEROIDEA ARTHROPODA CRUSTACEA AMPHIPODA INSECTA ODONATA DIPTERA
Tubificidae Naididae Physidae Hydrobiidae Sphaeriidae Gammaridae Coenagrionidae Chironomidae
Undetermined Turbellaria Aulodrilus piqueti Limnodrilus hoffmeisteri Undet. Tubificidae w/ cap. setae Dero digitata Physella sp. Undetermined Hydrobiidae Pisidium sp. Gammarus sp. Enallagma sp. Procladius sp. Cricotopus bicinctus Cricotopus sylvestris gr. Chironomus sp. Polypedilum illinoense Micropsectra sp. SPECIES RICHNESS: BIOTIC INDEX: EPT RICHNESS: MODEL AFFINITY: ASSESSMENT:
1 3
38 1 6 9
10 1
13 1 2 1 1 4 7 2
16 8.56
0 32
Severe
Description: The sample at Ley Creek Station 02 was collected using a net jab. This station was slow and sandy compared to the upstream station. The invertebrate community consisted of many worms and was dominated by the very pollution tolerant worm Limnodrilus hoffmeisteri. Mayflies, stoneflies, and caddisflies were absent entirely from the sample. The site was assessed as severely impacted.
From the digital collections of the New York State Library.
40
Table 4l. Macroinvertebrate Data Report (MDR), Harbor Brook Station 02 STREAM SITE: LOCATION: DATE: SAMPLE TYPE: SUBSAMPLE:
Harbor Brook, Station 02 Downstream of Hiawatha Boulevard, Syracuse, NY 6/25/2008 Kick 100 organisms
ANNELIDA OLIGOCHAETA LUMBRICIDA TUBIFICIDA MOLLUSCA GASTROPODA BASOMMATOPHORA MESOGASTROPODA ARTHROPODA CRUSTACEA ISOPODA INSECTA DIPTERA
Enchytraeidae Tubificidae Physidae Hydrobiidae Asellidae Chironomidae
Undetermined Lumbricina Undetermined Enchytraeidae Limnodrilus hoffmeisteri Undet. Tubificidae w/ cap. setae Physella sp. Undetermined Hydrobiidae Caecidotea racovitzai Pagastia orthogonia Cricotopus bicinctus Cricotopus sylvestris gr. Cricotopus sp. Chironomus sp. Polypedilum illinoense Tribelos/Endochironomus/Phaenopsectra Co Micropsectra sp. SPECIES RICHNESS: BIOTIC INDEX: EPT RICHNESS: MODEL AFFINITY: ASSESSMENT:
1 2
27 1 3 2 4 1
18 1 5
11 17 3 4
15 8.28
0 34
Severe
Description: The stream was channelized and narrow. The invertebrate community was similar to Ley Creek Station 02, dominated by tolerant worms and non-biting midge larvae, for example, Limnodrilus hoffmeisteri and Chironomus sp.. The site was assessed as severely impacted.
From the digital collections of the New York State Library.
41
Table 4m. Macroinvertebrate Data Report (MDR), Geddes Brook Station 01 STREAM SITE: LOCATION: DATE: SAMPLE TYPE: SUBSAMPLE:
Geddes Brook, Station 01 Downstream of Horan Road bridge, Camillus, NY 6/25/2008 Kick 99 organisms
ANNELIDA OLIGOCHAETA LUMBRICIDA TUBIFICIDA MOLLUSCA PELECYPODA VENEROIDEA ARTHROPODA CRUSTACEA AMPHIPODA INSECTA EPHEMEROPTERA TRICHOPTERA DIPTERA
Tubificidae Sphaeriidae Gammaridae Baetidae Philopotamidae Hydropsychidae Hydroptilidae Simuliidae Muscidae Chironomidae
Undetermined Lumbricina Undet. Tubificidae Undetermined Sphaeriidae Gammarus sp. Baetis tricaudatus Dolophilodes sp. Hydropsyche betteni Hydroptila sp. Prosimulium sp. Simulium sp. Undetermined Muscidae Thienemannimyia gr. spp. Limnophyes sp. Tvetenia bavarica gr. Polypedilum aviceps Polypedilum tritum Micropsectra sp. SPECIES RICHNESS: BIOTIC INDEX: EPT RICHNESS: MODEL AFFINITY: ASSESSMENT:
5 1 1
25 7 1 2 1 1 1 1 1 3
38 1 2 7
17 5.27
4 46
Moderate
Description: The sample was collected from an adequate riffle with a substrate consisting predominately of rock and rubble. The invertebrate community contained some mayflies and caddisflies, however the species present were facultative. Stoneflies were absent from the sample. The site was assessed as moderately impacted.
From the digital collections of the New York State Library.
42
Table 4n. Macroinvertebrate Data Report (MDR), Bloody Brook Station 06 STREAM SITE: LOCATION: DATE: SAMPLE TYPE: SUBSAMPLE:
Bloody Brook, Station 06 Downstream of Onondaga Lake Parkway, Liverpool, NY 6/25/2008 Kick 100 organisms
ARTHROPODA CRUSTACEA AMPHIPODA INSECTA DIPTERA
Gammaridae Chironomidae
Gammarus sp. Thienemannimyia gr. spp. Cricotopus bicinctus Orthocladius sp. Thienemanniella sp. Chironomus sp. Cryptochironomus sp. Dicrotendipes fumidus Dicrotendipes sp. Paratendipes sp. Tribelos/Endochironomus/Phaenopsectra Co Sublettea coffmani Tanytarsus sp. SPECIES RICHNESS: BIOTIC INDEX: EPT RICHNESS: MODEL AFFINITY: ASSESSMENT:
34
2 6 3 1 3 1 4 1 2 3
38 1
14 5.64
0 30
Moderate
Description: The sample was collected from an area where the substrate was predominately sand and the current was slow. The stream was channelized with stonewalls. The invertebrate community was limited and consisted mostly of facultative or tolerant non-biting midge larvae (Chironomidae). The site was assessed as moderately impacted.
From the digital collections of the New York State Library.
43
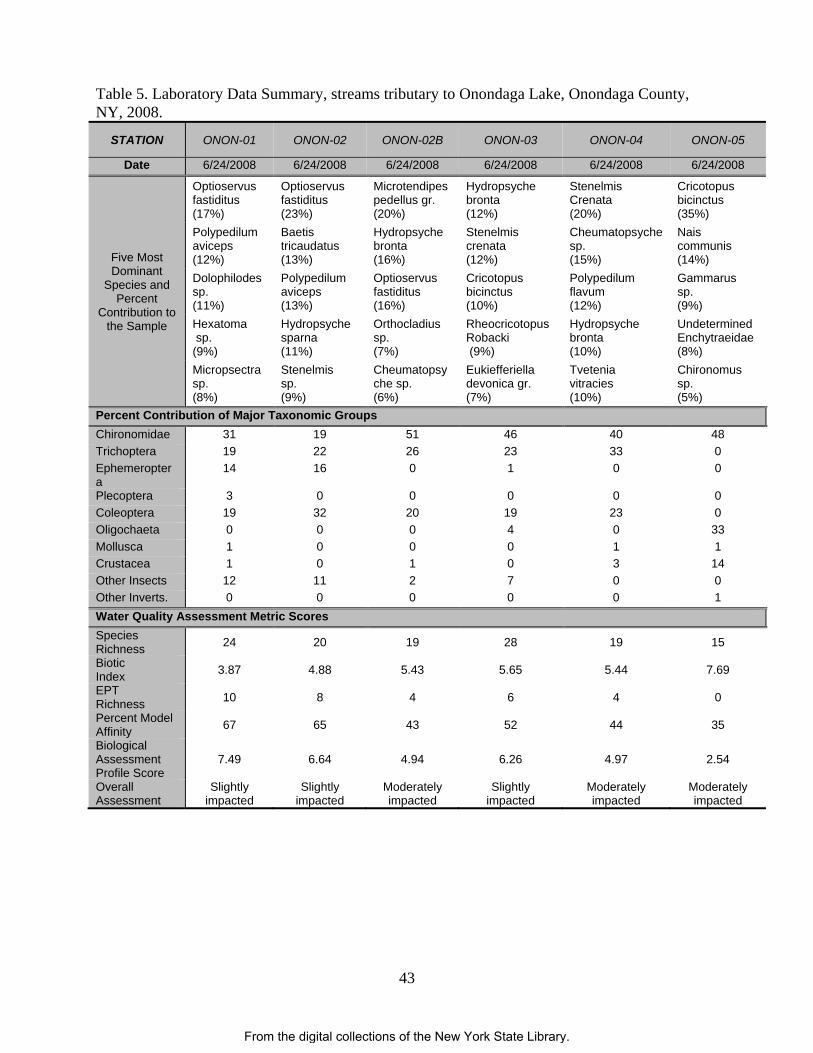
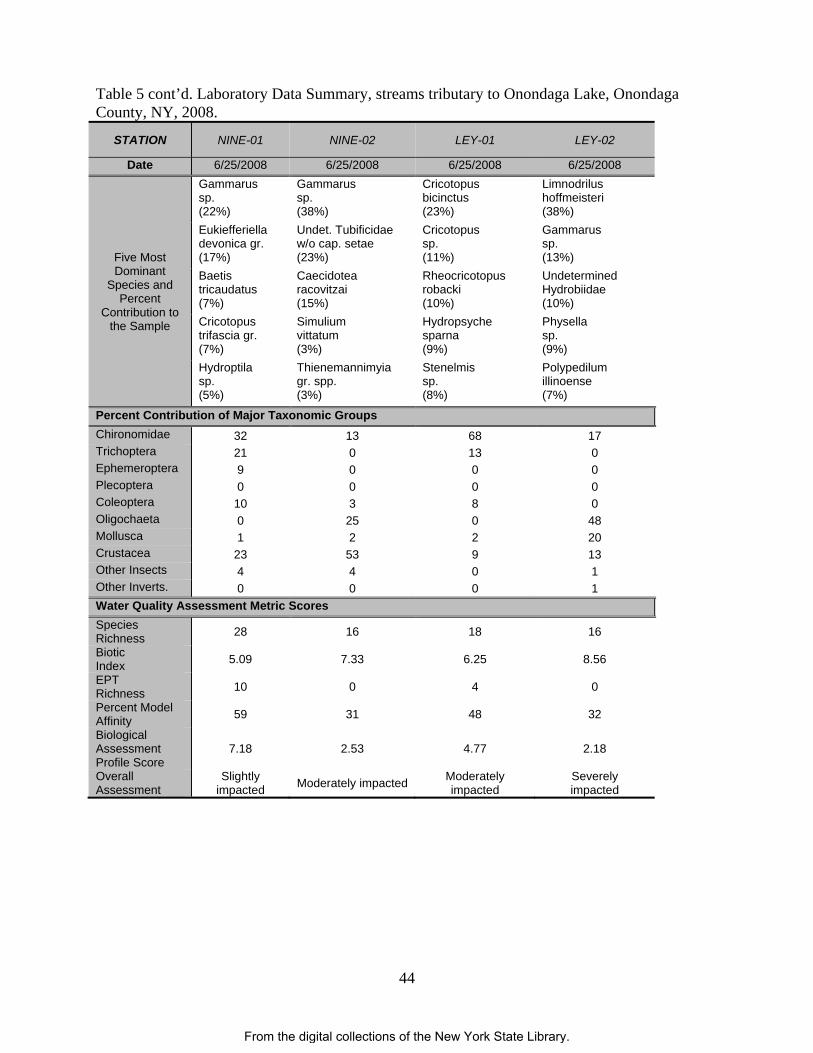
Table 5. Laboratory Data Summary, streams tributary to Onondaga Lake, Onondaga County, NY, 2008.
STATION ONON-01 ONON-02 ONON-02B ONON-03 ONON-04 ONON-05
Date 6/24/2008 6/24/2008 6/24/2008 6/24/2008 6/24/2008 6/24/2008
Five Most Dominant
Species and Percent
Contribution to the Sample
Optioservus fastiditus (17%)
Optioservus fastiditus (23%)
Microtendipes pedellus gr. (20%)
Hydropsyche bronta (12%)
Stenelmis Crenata (20%)
Cricotopus bicinctus (35%)
Polypedilum aviceps (12%)
Baetis tricaudatus (13%)
Hydropsyche bronta (16%)
Stenelmis crenata (12%)
Cheumatopsyche sp. (15%)
Nais communis (14%)
Dolophilodes sp. (11%)
Polypedilum aviceps (13%)
Optioservus fastiditus (16%)
Cricotopus bicinctus (10%)
Polypedilum flavum (12%)
Gammarus sp. (9%)
Hexatoma sp. (9%)
Hydropsyche sparna (11%)
Orthocladius sp. (7%)
Rheocricotopus Robacki (9%)
Hydropsyche bronta (10%)
Undetermined Enchytraeidae (8%)
Micropsectra sp. (8%)
Stenelmis sp. (9%)
Cheumatopsyche sp. (6%)
Eukiefferiella devonica gr. (7%)
Tvetenia vitracies (10%)
Chironomus sp. (5%)
Percent Contribution of Major Taxonomic GroupsChironomidae 31 19 51 46 40 48 Trichoptera 19 22 26 23 33 0 Ephemeroptera
14 16 0 1 0 0
Plecoptera 3 0 0 0 0 0 Coleoptera 19 32 20 19 23 0 Oligochaeta 0 0 0 4 0 33 Mollusca 1 0 0 0 1 1 Crustacea 1 0 1 0 3 14 Other Insects 12 11 2 7 0 0 Other Inverts. 0 0 0 0 0 1 Water Quality Assessment Metric ScoresSpecies Richness 24 20 19 28 19 15
Biotic Index 3.87 4.88 5.43 5.65 5.44 7.69
EPT Richness 10 8 4 6 4 0
Percent Model Affinity 67 65 43 52 44 35
Biological Assessment Profile Score
7.49 6.64 4.94 6.26 4.97 2.54
Overall Assessment
Slightly impacted
Slightly impacted
Moderately impacted
Slightly impacted
Moderately impacted
Moderately impacted
From the digital collections of the New York State Library.
44
Table 5 cont’d. Laboratory Data Summary, streams tributary to Onondaga Lake, Onondaga County, NY, 2008.
STATION NINE-01 NINE-02 LEY-01 LEY-02
Date 6/25/2008 6/25/2008 6/25/2008 6/25/2008
Five Most Dominant
Species and Percent
Contribution to the Sample
Gammarus sp. (22%)
Gammarus sp. (38%)
Cricotopus bicinctus (23%)
Limnodrilus hoffmeisteri (38%)
Eukiefferiella devonica gr. (17%)
Undet. Tubificidae w/o cap. setae (23%)
Cricotopus sp. (11%)
Gammarus sp. (13%)
Baetis tricaudatus (7%)
Caecidotea racovitzai (15%)
Rheocricotopus robacki (10%)
Undetermined Hydrobiidae (10%)
Cricotopus trifascia gr. (7%)
Simulium vittatum (3%)
Hydropsyche sparna (9%)
Physella sp. (9%)
Hydroptila sp. (5%)
Thienemannimyia gr. spp. (3%)
Stenelmis sp. (8%)
Polypedilum illinoense (7%)
Percent Contribution of Major Taxonomic GroupsChironomidae 32 13 68 17 Trichoptera 21 0 13 0 Ephemeroptera 9 0 0 0 Plecoptera 0 0 0 0 Coleoptera 10 3 8 0 Oligochaeta 0 25 0 48 Mollusca 1 2 2 20 Crustacea 23 53 9 13 Other Insects 4 4 0 1 Other Inverts. 0 0 0 1 Water Quality Assessment Metric ScoresSpecies Richness 28 16 18 16
Biotic Index 5.09 7.33 6.25 8.56
EPT Richness 10 0 4 0
Percent Model Affinity 59 31 48 32
Biological Assessment Profile Score
7.18 2.53 4.77 2.18
Overall Assessment
Slightly impacted Moderately impacted Moderately
impacted Severely impacted
From the digital collections of the New York State Library.
45
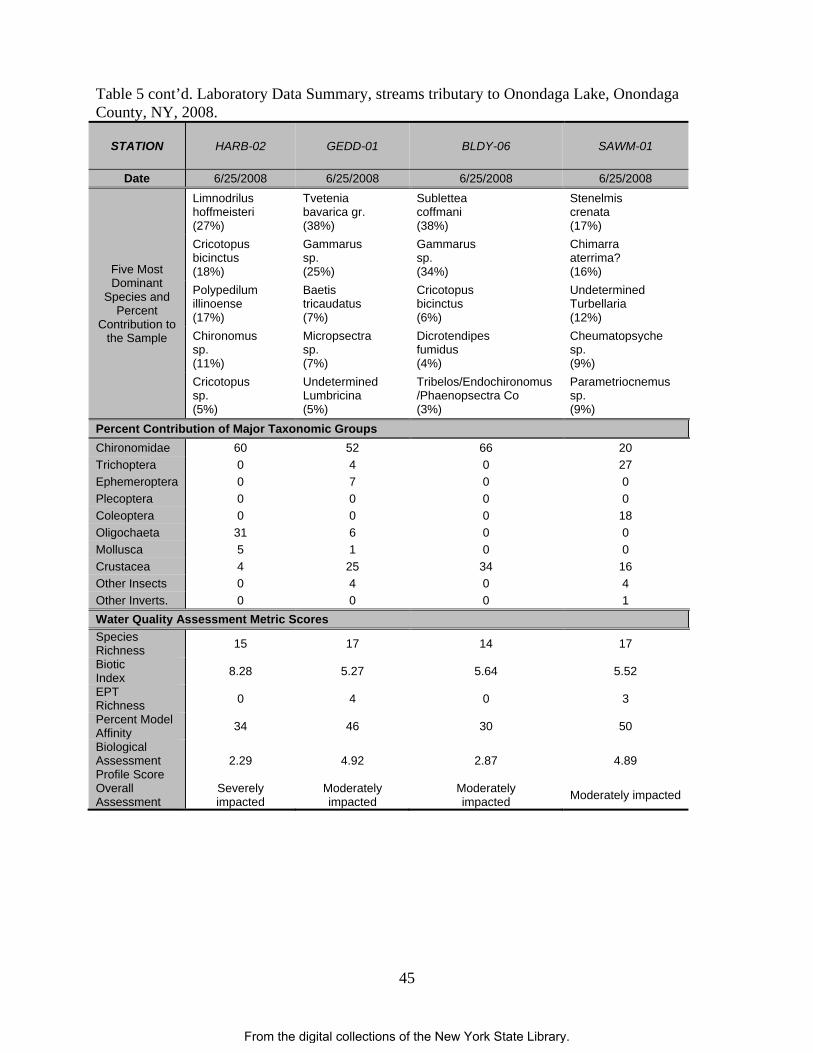
Table 5 cont’d. Laboratory Data Summary, streams tributary to Onondaga Lake, Onondaga County, NY, 2008.
STATION HARB-02 GEDD-01 BLDY-06 SAWM-01
Date 6/25/2008 6/25/2008 6/25/2008 6/25/2008
Five Most Dominant
Species and Percent
Contribution to the Sample
Limnodrilus hoffmeisteri (27%)
Tvetenia bavarica gr. (38%)
Sublettea coffmani (38%)
Stenelmis crenata (17%)
Cricotopus bicinctus (18%)
Gammarus sp. (25%)
Gammarus sp. (34%)
Chimarra aterrima? (16%)
Polypedilum illinoense (17%)
Baetis tricaudatus (7%)
Cricotopus bicinctus (6%)
Undetermined Turbellaria (12%)
Chironomus sp. (11%)
Micropsectra sp. (7%)
Dicrotendipes fumidus (4%)
Cheumatopsyche sp. (9%)
Cricotopus sp. (5%)
Undetermined Lumbricina (5%)
Tribelos/Endochironomus /Phaenopsectra Co (3%)
Parametriocnemus sp. (9%)
Percent Contribution of Major Taxonomic Groups Chironomidae 60 52 66 20 Trichoptera 0 4 0 27 Ephemeroptera 0 7 0 0 Plecoptera 0 0 0 0 Coleoptera 0 0 0 18 Oligochaeta 31 6 0 0 Mollusca 5 1 0 0 Crustacea 4 25 34 16 Other Insects 0 4 0 4 Other Inverts. 0 0 0 1 Water Quality Assessment Metric Scores Species Richness 15 17 14 17
Biotic Index 8.28 5.27 5.64 5.52
EPT Richness 0 4 0 3
Percent Model Affinity 34 46 30 50
Biological Assessment Profile Score
2.29 4.92 2.87 4.89
Overall Assessment
Severely impacted
Moderately impacted
Moderately impacted Moderately impacted
From the digital collections of the New York State Library.
46
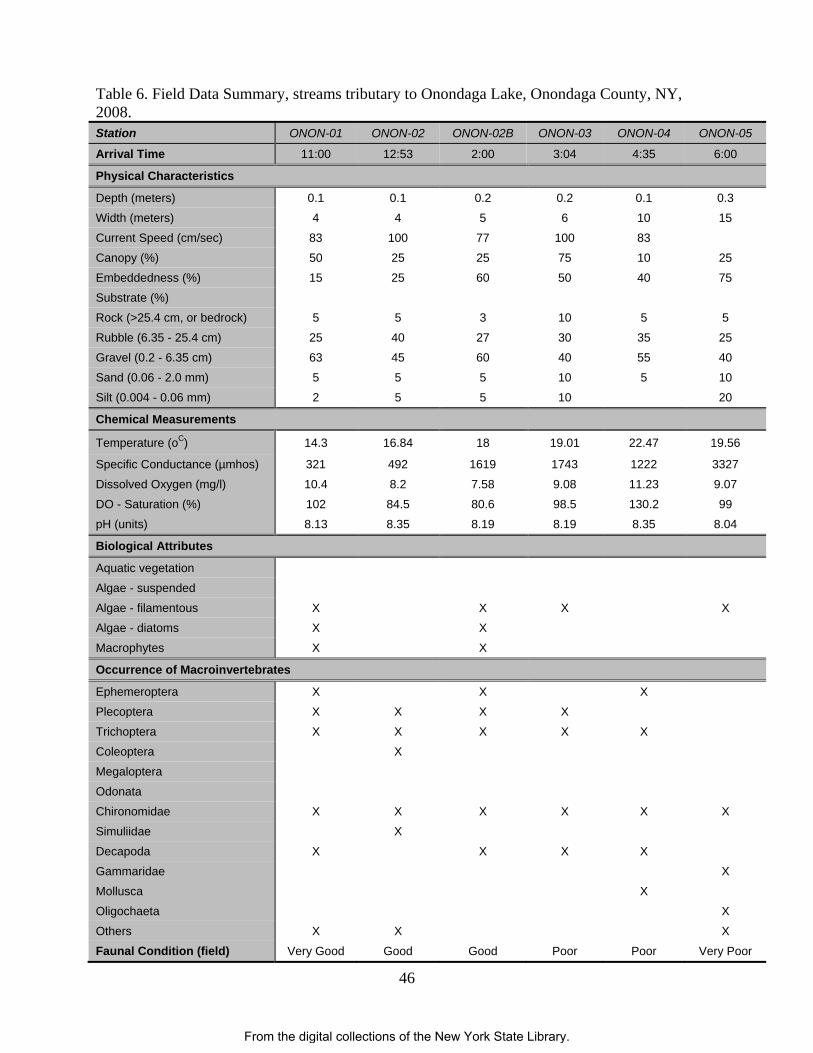
Table 6. Field Data Summary, streams tributary to Onondaga Lake, Onondaga County, NY, 2008. Station ONON-01 ONON-02 ONON-02B ONON-03 ONON-04 ONON-05
Arrival Time 11:00 12:53 2:00 3:04 4:35 6:00
Physical Characteristics
Depth (meters) 0.1 0.1 0.2 0.2 0.1 0.3
Width (meters) 4 4 5 6 10 15
Current Speed (cm/sec) 83 100 77 100 83
Canopy (%) 50 25 25 75 10 25
Embeddedness (%) 15 25 60 50 40 75
Substrate (%)
Rock (>25.4 cm, or bedrock) 5 5 3 10 5 5
Rubble (6.35 - 25.4 cm) 25 40 27 30 35 25
Gravel (0.2 - 6.35 cm) 63 45 60 40 55 40
Sand (0.06 - 2.0 mm) 5 5 5 10 5 10
Silt (0.004 - 0.06 mm) 2 5 5 10 20
Chemical Measurements
Temperature (oC) 14.3 16.84 18 19.01 22.47 19.56
Specific Conductance (µmhos) 321 492 1619 1743 1222 3327
Dissolved Oxygen (mg/l) 10.4 8.2 7.58 9.08 11.23 9.07
DO - Saturation (%) 102 84.5 80.6 98.5 130.2 99
pH (units) 8.13 8.35 8.19 8.19 8.35 8.04
Biological Attributes
Aquatic vegetation
Algae - suspended
Algae - filamentous X X X X
Algae - diatoms X X
Macrophytes X X
Occurrence of Macroinvertebrates
Ephemeroptera X X X
Plecoptera X X X X
Trichoptera X X X X X
Coleoptera X
Megaloptera
Odonata
Chironomidae X X X X X X
Simuliidae X
Decapoda X X X X
Gammaridae X
Mollusca X
Oligochaeta X
Others X X X Faunal Condition (field) Very Good Good Good Poor Poor Very Poor
From the digital collections of the New York State Library.
47
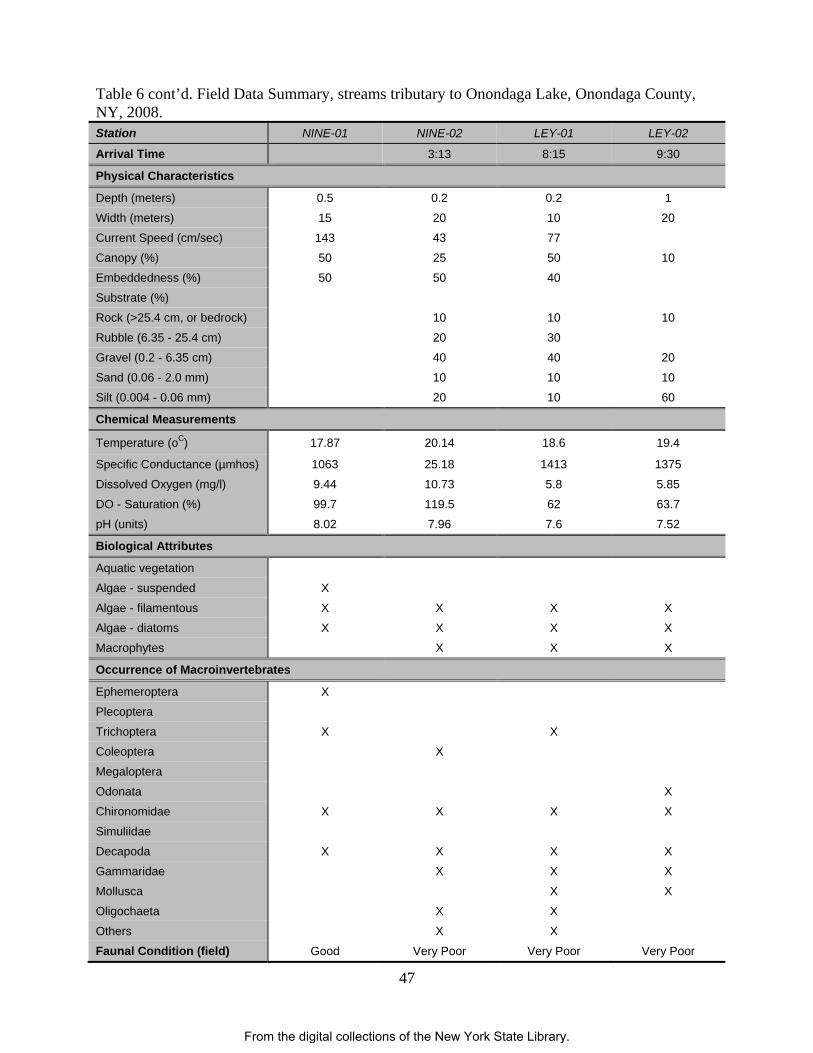
Table 6 cont’d. Field Data Summary, streams tributary to Onondaga Lake, Onondaga County, NY, 2008. Station NINE-01 NINE-02 LEY-01 LEY-02
Arrival Time 3:13 8:15 9:30
Physical Characteristics
Depth (meters) 0.5 0.2 0.2 1
Width (meters) 15 20 10 20
Current Speed (cm/sec) 143 43 77
Canopy (%) 50 25 50 10
Embeddedness (%) 50 50 40
Substrate (%)
Rock (>25.4 cm, or bedrock) 10 10 10
Rubble (6.35 - 25.4 cm) 20 30
Gravel (0.2 - 6.35 cm) 40 40 20
Sand (0.06 - 2.0 mm) 10 10 10
Silt (0.004 - 0.06 mm) 20 10 60
Chemical Measurements
Temperature (oC) 17.87 20.14 18.6 19.4
Specific Conductance (µmhos) 1063 25.18 1413 1375
Dissolved Oxygen (mg/l) 9.44 10.73 5.8 5.85
DO - Saturation (%) 99.7 119.5 62 63.7
pH (units) 8.02 7.96 7.6 7.52
Biological Attributes
Aquatic vegetation
Algae - suspended X
Algae - filamentous X X X X
Algae - diatoms X X X X
Macrophytes X X X
Occurrence of Macroinvertebrates
Ephemeroptera X
Plecoptera
Trichoptera X X
Coleoptera X
Megaloptera
Odonata X
Chironomidae X X X X
Simuliidae
Decapoda X X X X
Gammaridae X X X
Mollusca X X
Oligochaeta X X
Others X X Faunal Condition (field) Good Very Poor Very Poor Very Poor
From the digital collections of the New York State Library.
48
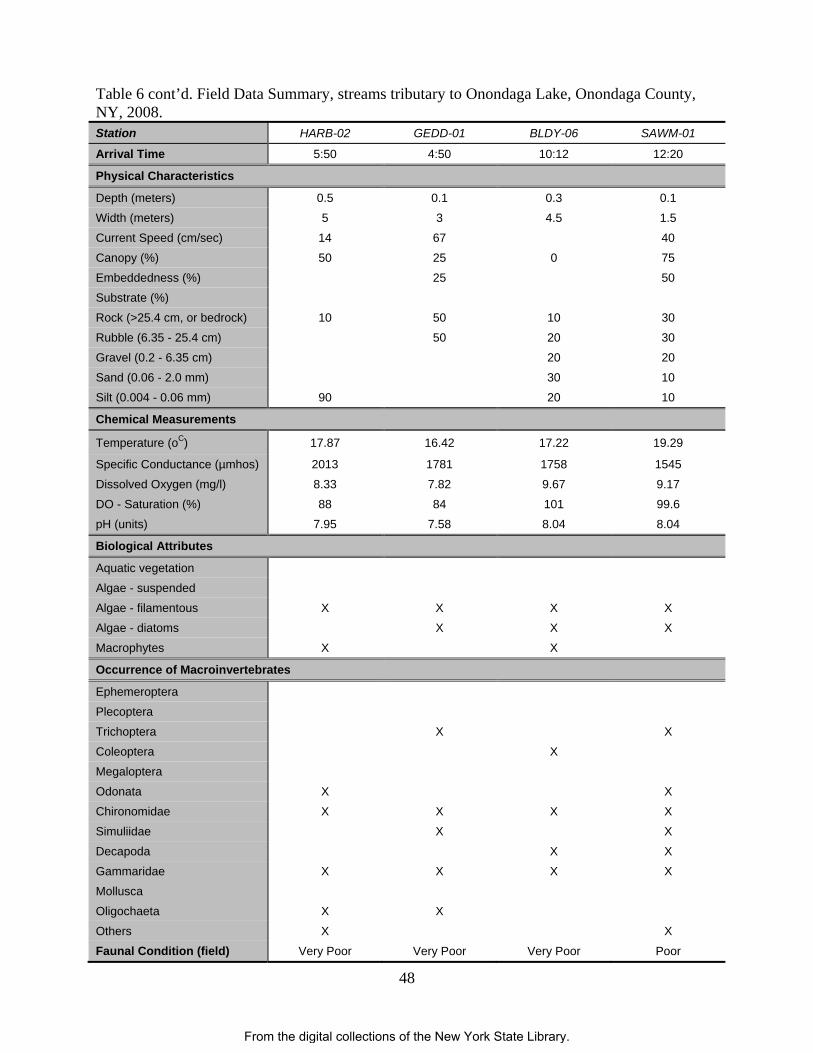
Table 6 cont’d. Field Data Summary, streams tributary to Onondaga Lake, Onondaga County, NY, 2008. Station HARB-02 GEDD-01 BLDY-06 SAWM-01
Arrival Time 5:50 4:50 10:12 12:20
Physical Characteristics
Depth (meters) 0.5 0.1 0.3 0.1
Width (meters) 5 3 4.5 1.5
Current Speed (cm/sec) 14 67 40
Canopy (%) 50 25 0 75
Embeddedness (%) 25 50
Substrate (%)
Rock (>25.4 cm, or bedrock) 10 50 10 30
Rubble (6.35 - 25.4 cm) 50 20 30
Gravel (0.2 - 6.35 cm) 20 20
Sand (0.06 - 2.0 mm) 30 10
Silt (0.004 - 0.06 mm) 90 20 10
Chemical Measurements
Temperature (oC) 17.87 16.42 17.22 19.29
Specific Conductance (µmhos) 2013 1781 1758 1545
Dissolved Oxygen (mg/l) 8.33 7.82 9.67 9.17
DO - Saturation (%) 88 84 101 99.6
pH (units) 7.95 7.58 8.04 8.04
Biological Attributes
Aquatic vegetation
Algae - suspended
Algae - filamentous X X X X
Algae - diatoms X X X
Macrophytes X X
Occurrence of Macroinvertebrates
Ephemeroptera
Plecoptera
Trichoptera X X
Coleoptera X
Megaloptera
Odonata X X
Chironomidae X X X X
Simuliidae X X
Decapoda X X
Gammaridae X X X X
Mollusca
Oligochaeta X X
Others X X Faunal Condition (field) Very Poor Very Poor Very Poor Poor
From the digital collections of the New York State Library.
49
Appendix I. Biological Methods for Kick Sampling A. Rationale: The use of the standardized kick sampling method provides a biological assessment technique that lends itself to rapid assessments of stream water quality. B. Site Selection: Sampling sites are selected based on these criteria: (1) The sampling location should be a riffle with a substrate of rubble, gravel and sand; depth should be one meter or less, and current speed should be at least 0.4 meter per second. (2) The site should have comparable current speed, substrate type, embeddedness, and canopy cover to both upstream and downstream sites to the degree possible. (3) Sites are chosen to have a safe and convenient access. C. Sampling: Macroinvertebrates are sampled using the standardized traveling kick method. An aquatic net is positioned in the water at arms' length downstream and the stream bottom is disturbed by foot, so that organisms are dislodged and carried into the net. Sampling is continued for a specified time and distance in the stream. Rapid assessment sampling specifies sampling for five minutes over a distance of five meters. The contents of the net are emptied into a pan of stream water. The contents are then examined, and the major groups of organisms are recorded, usually on the ordinal level (e.g., stoneflies, mayflies, caddisflies). Larger rocks, sticks, and plants may be removed from the sample if organisms are first removed from them. The contents of the pan are poured into a U.S. No. 30 sieve and transferred to a quart jar. The sample is then preserved by adding 95% ethyl alcohol. D. Sample Sorting and Subsampling: In the laboratory, the sample is rinsed with tap water in a U.S. No. 40 standard sieve to remove any fine particles left in the residues from field sieving. The sample is transferred to an enamel pan and distributed homogeneously over the bottom of the pan. A small amount of the sample is randomly removed with a spatula, rinsed with water, and placed in a petri dish. This portion is examined under a dissecting stereomicroscope and 100 organisms are randomly removed from the debris. As they are removed, they are sorted into major groups, placed in vials containing 70 percent alcohol, and counted. The total number of organisms in the sample is estimated by weighing the residue from the picked subsample and determining its proportion of the total sample weight. E. Organism Identification: All organisms are identified to the species level whenever possible. Chironomids and oligochaetes are slide-mounted and viewed through a compound microscope; most other organisms are identified as whole specimens using a dissecting stereomicroscope. The number of individuals in each species and the total number of individuals in the subsample are recorded on a data sheet. All organisms from the subsample are archived (either slide-mounted or preserved in alcohol). If the results of the identification process are ambiguous, suspected of being spurious, or do not yield a clear water quality assessment, additional subsampling may be required.
From the digital collections of the New York State Library.
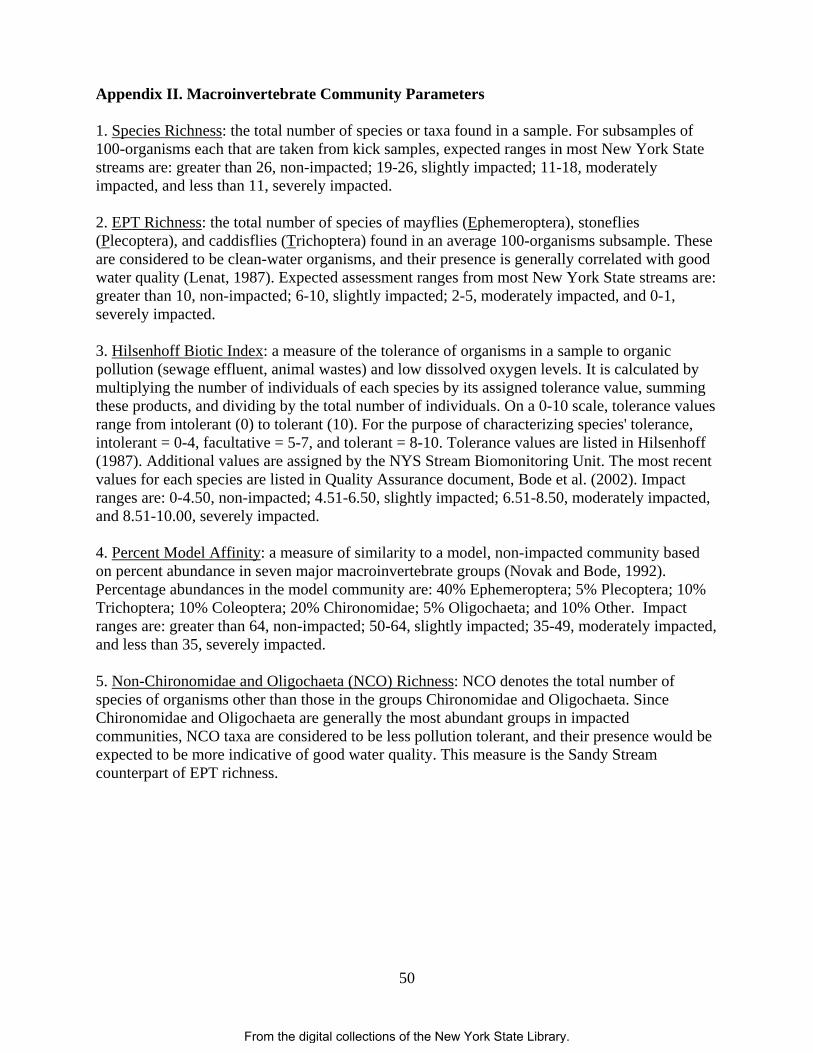
50
Appendix II. Macroinvertebrate Community Parameters 1. Species Richness: the total number of species or taxa found in a sample. For subsamples of 100-organisms each that are taken from kick samples, expected ranges in most New York State streams are: greater than 26, non-impacted; 19-26, slightly impacted; 11-18, moderately impacted, and less than 11, severely impacted. 2. EPT Richness: the total number of species of mayflies (Ephemeroptera), stoneflies (Plecoptera), and caddisflies (Trichoptera) found in an average 100-organisms subsample. These are considered to be clean-water organisms, and their presence is generally correlated with good water quality (Lenat, 1987). Expected assessment ranges from most New York State streams are: greater than 10, non-impacted; 6-10, slightly impacted; 2-5, moderately impacted, and 0-1, severely impacted. 3. Hilsenhoff Biotic Index: a measure of the tolerance of organisms in a sample to organic pollution (sewage effluent, animal wastes) and low dissolved oxygen levels. It is calculated by multiplying the number of individuals of each species by its assigned tolerance value, summing these products, and dividing by the total number of individuals. On a 0-10 scale, tolerance values range from intolerant (0) to tolerant (10). For the purpose of characterizing species' tolerance, intolerant = 0-4, facultative = 5-7, and tolerant = 8-10. Tolerance values are listed in Hilsenhoff (1987). Additional values are assigned by the NYS Stream Biomonitoring Unit. The most recent values for each species are listed in Quality Assurance document, Bode et al. (2002). Impact ranges are: 0-4.50, non-impacted; 4.51-6.50, slightly impacted; 6.51-8.50, moderately impacted, and 8.51-10.00, severely impacted. 4. Percent Model Affinity: a measure of similarity to a model, non-impacted community based on percent abundance in seven major macroinvertebrate groups (Novak and Bode, 1992). Percentage abundances in the model community are: 40% Ephemeroptera; 5% Plecoptera; 10% Trichoptera; 10% Coleoptera; 20% Chironomidae; 5% Oligochaeta; and 10% Other. Impact ranges are: greater than 64, non-impacted; 50-64, slightly impacted; 35-49, moderately impacted, and less than 35, severely impacted. 5. Non-Chironomidae and Oligochaeta (NCO) Richness: NCO denotes the total number of species of organisms other than those in the groups Chironomidae and Oligochaeta. Since Chironomidae and Oligochaeta are generally the most abundant groups in impacted communities, NCO taxa are considered to be less pollution tolerant, and their presence would be expected to be more indicative of good water quality. This measure is the Sandy Stream counterpart of EPT richness.
From the digital collections of the New York State Library.
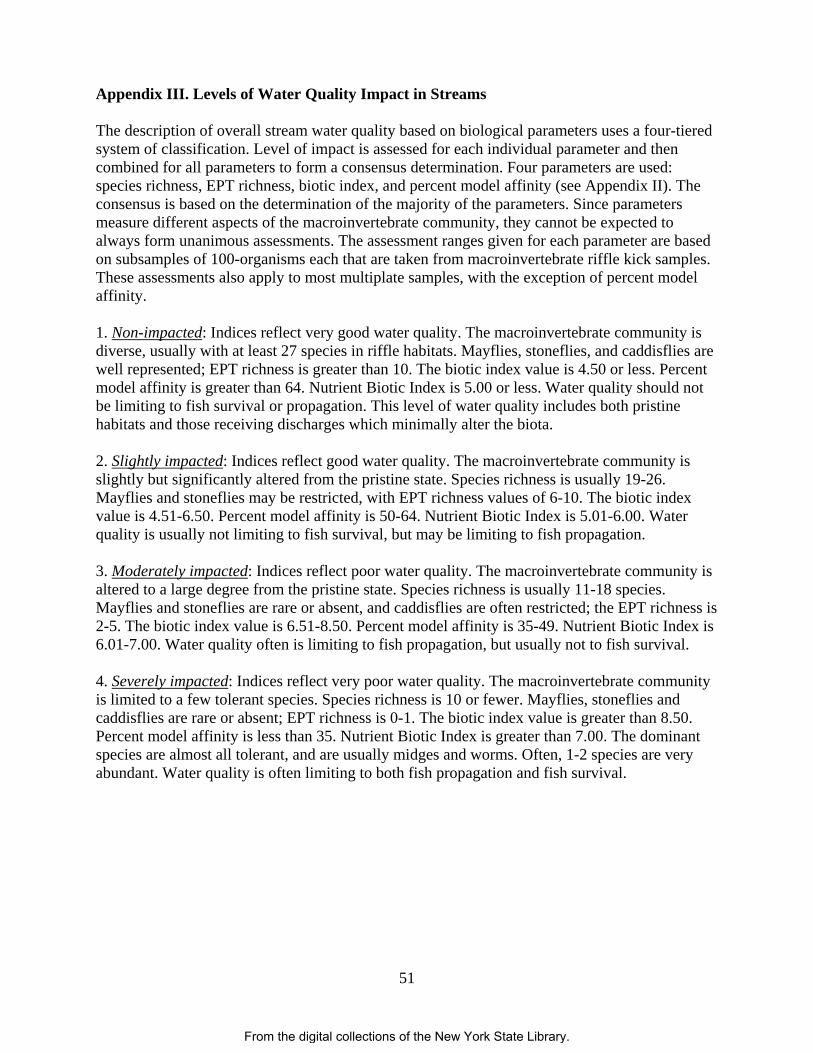
51
Appendix III. Levels of Water Quality Impact in Streams The description of overall stream water quality based on biological parameters uses a four-tiered system of classification. Level of impact is assessed for each individual parameter and then combined for all parameters to form a consensus determination. Four parameters are used: species richness, EPT richness, biotic index, and percent model affinity (see Appendix II). The consensus is based on the determination of the majority of the parameters. Since parameters measure different aspects of the macroinvertebrate community, they cannot be expected to always form unanimous assessments. The assessment ranges given for each parameter are based on subsamples of 100-organisms each that are taken from macroinvertebrate riffle kick samples. These assessments also apply to most multiplate samples, with the exception of percent model affinity. 1. Non-impacted: Indices reflect very good water quality. The macroinvertebrate community is diverse, usually with at least 27 species in riffle habitats. Mayflies, stoneflies, and caddisflies are well represented; EPT richness is greater than 10. The biotic index value is 4.50 or less. Percent model affinity is greater than 64. Nutrient Biotic Index is 5.00 or less. Water quality should not be limiting to fish survival or propagation. This level of water quality includes both pristine habitats and those receiving discharges which minimally alter the biota. 2. Slightly impacted: Indices reflect good water quality. The macroinvertebrate community is slightly but significantly altered from the pristine state. Species richness is usually 19-26. Mayflies and stoneflies may be restricted, with EPT richness values of 6-10. The biotic index value is 4.51-6.50. Percent model affinity is 50-64. Nutrient Biotic Index is 5.01-6.00. Water quality is usually not limiting to fish survival, but may be limiting to fish propagation. 3. Moderately impacted: Indices reflect poor water quality. The macroinvertebrate community is altered to a large degree from the pristine state. Species richness is usually 11-18 species. Mayflies and stoneflies are rare or absent, and caddisflies are often restricted; the EPT richness is 2-5. The biotic index value is 6.51-8.50. Percent model affinity is 35-49. Nutrient Biotic Index is 6.01-7.00. Water quality often is limiting to fish propagation, but usually not to fish survival. 4. Severely impacted: Indices reflect very poor water quality. The macroinvertebrate community is limited to a few tolerant species. Species richness is 10 or fewer. Mayflies, stoneflies and caddisflies are rare or absent; EPT richness is 0-1. The biotic index value is greater than 8.50. Percent model affinity is less than 35. Nutrient Biotic Index is greater than 7.00. The dominant species are almost all tolerant, and are usually midges and worms. Often, 1-2 species are very abundant. Water quality is often limiting to both fish propagation and fish survival.
From the digital collections of the New York State Library.
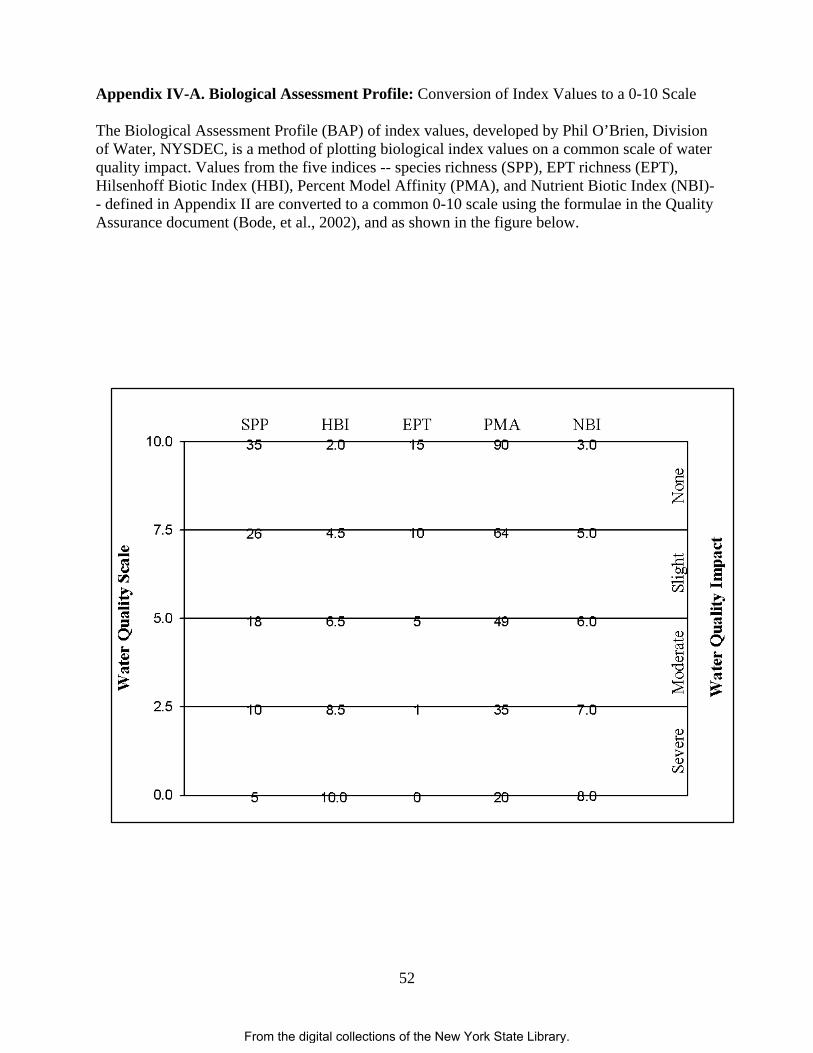
52
Appendix IV-A. Biological Assessment Profile: Conversion of Index Values to a 0-10 Scale The Biological Assessment Profile (BAP) of index values, developed by Phil O’Brien, Division of Water, NYSDEC, is a method of plotting biological index values on a common scale of water quality impact. Values from the five indices -- species richness (SPP), EPT richness (EPT), Hilsenhoff Biotic Index (HBI), Percent Model Affinity (PMA), and Nutrient Biotic Index (NBI)-- defined in Appendix II are converted to a common 0-10 scale using the formulae in the Quality Assurance document (Bode, et al., 2002), and as shown in the figure below.
From the digital collections of the New York State Library.
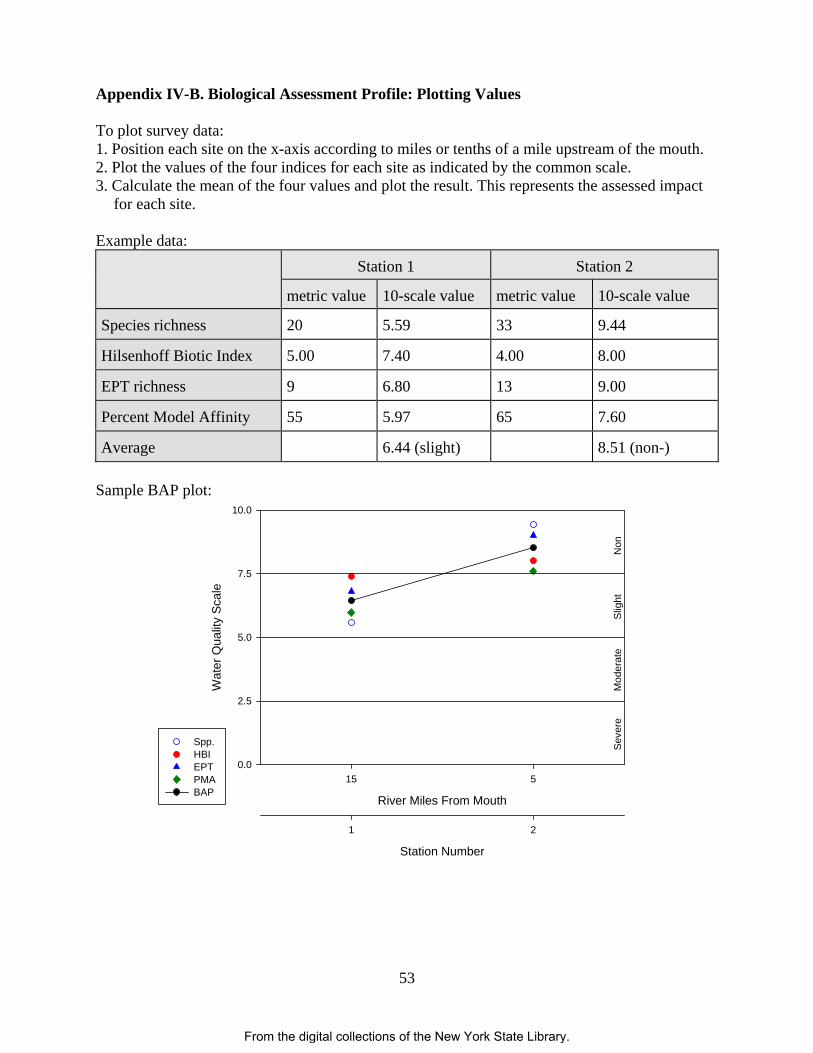
53
Appendix IV-B. Biological Assessment Profile: Plotting Values To plot survey data: 1. Position each site on the x-axis according to miles or tenths of a mile upstream of the mouth. 2. Plot the values of the four indices for each site as indicated by the common scale. 3. Calculate the mean of the four values and plot the result. This represents the assessed impact
for each site. Example data: Station 1 Station 2
metric value 10-scale value metric value 10-scale value
Species richness 20 5.59 33 9.44
Hilsenhoff Biotic Index 5.00 7.40 4.00 8.00
EPT richness 9 6.80 13 9.00
Percent Model Affinity 55 5.97 65 7.60
Average 6.44 (slight) 8.51 (non-) Sample BAP plot:
River Miles From Mouth
15 5
Wat
er Q
ualit
y Sc
ale
0.0
2.5
5.0
7.5
10.0
Station Number
1 2
Spp. HBI EPT PMA BAP
Sev
ere
Mod
erat
eS
light
Non
From the digital collections of the New York State Library.
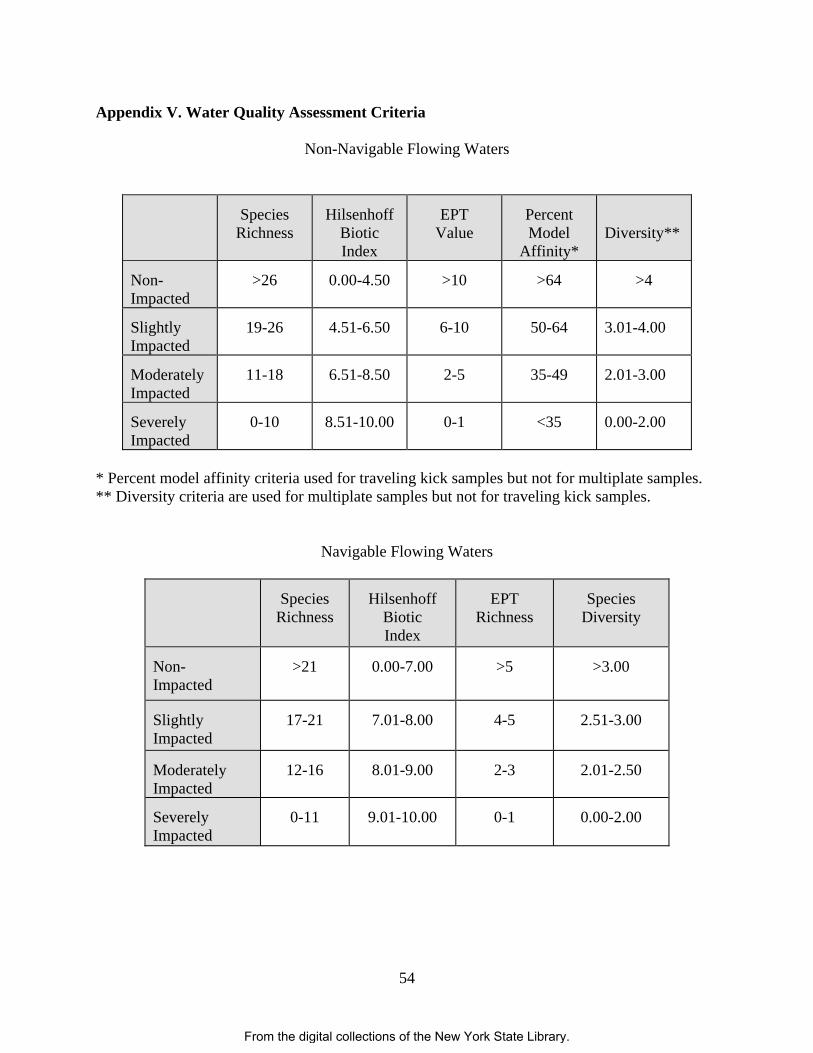
54
Appendix V. Water Quality Assessment Criteria
Non-Navigable Flowing Waters
Species Richness
Hilsenhoff Biotic Index
EPT Value
Percent Model
Affinity*
Diversity**
Non- Impacted
>26 0.00-4.50 >10 >64 >4
Slightly Impacted
19-26 4.51-6.50 6-10 50-64 3.01-4.00
Moderately Impacted
11-18 6.51-8.50 2-5 35-49 2.01-3.00
Severely Impacted
0-10 8.51-10.00 0-1 <35 0.00-2.00
* Percent model affinity criteria used for traveling kick samples but not for multiplate samples. ** Diversity criteria are used for multiplate samples but not for traveling kick samples.
Navigable Flowing Waters
Species Richness
Hilsenhoff Biotic Index
EPT Richness
Species Diversity
Non- Impacted
>21 0.00-7.00 >5 >3.00
Slightly Impacted
17-21 7.01-8.00 4-5 2.51-3.00
Moderately Impacted
12-16 8.01-9.00 2-3 2.01-2.50
Severely Impacted
0-11 9.01-10.00 0-1 0.00-2.00
From the digital collections of the New York State Library.
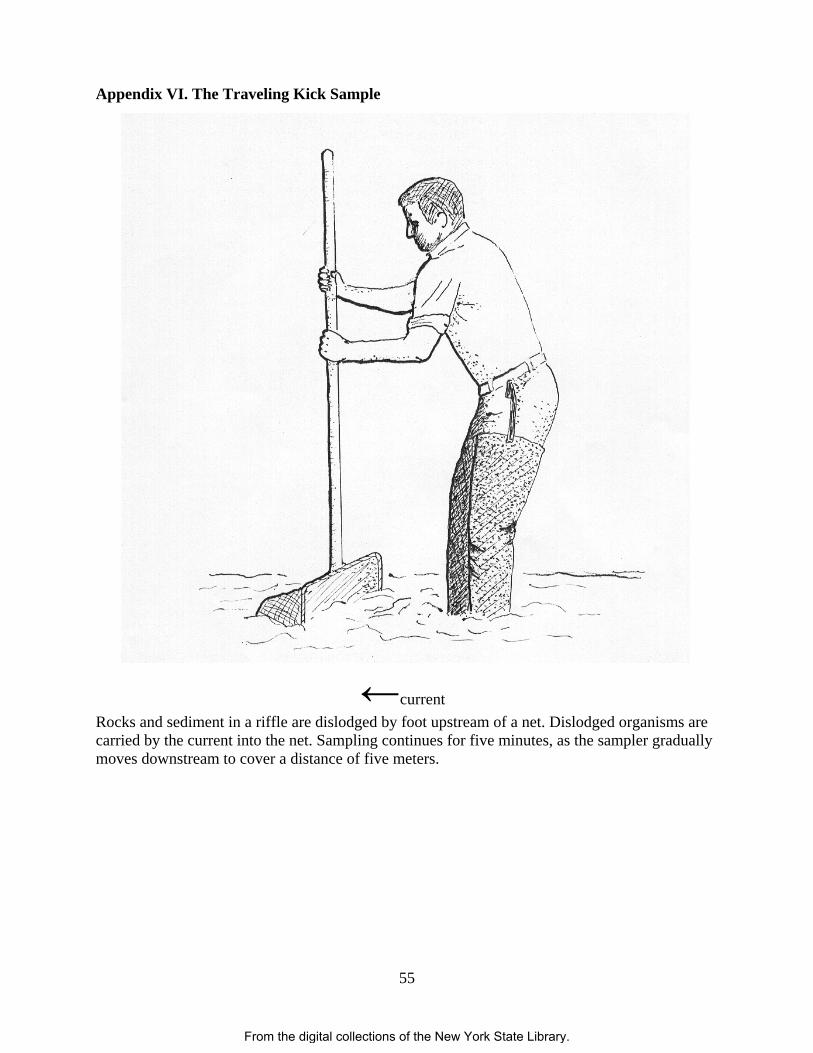
55
Appendix VI. The Traveling Kick Sample
Rocks and sediment in a riffle are dislodged by foot upstream of a net. Dislodged organisms are carried by the current into the net. Sampling continues for five minutes, as the sampler gradually moves downstream to cover a distance of five meters.
←current
From the digital collections of the New York State Library.
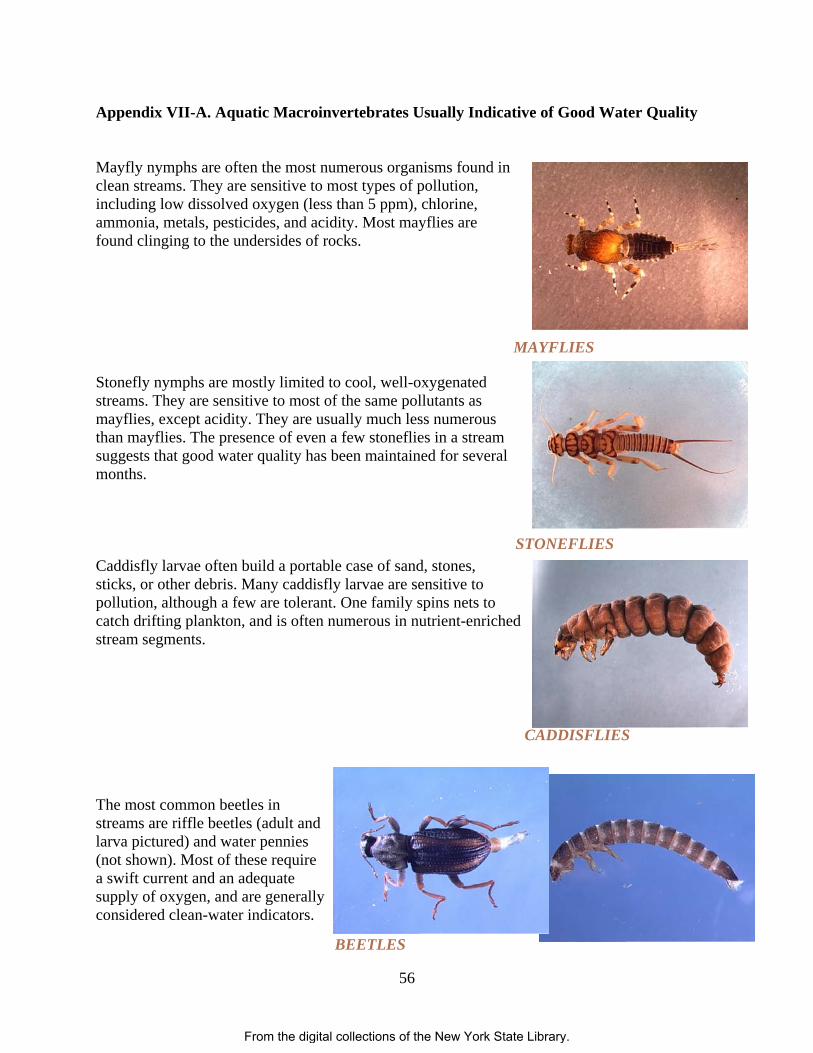
56
Appendix VII-A. Aquatic Macroinvertebrates Usually Indicative of Good Water Quality Mayfly nymphs are often the most numerous organisms found in clean streams. They are sensitive to most types of pollution, including low dissolved oxygen (less than 5 ppm), chlorine, ammonia, metals, pesticides, and acidity. Most mayflies are found clinging to the undersides of rocks.
Stonefly nymphs are mostly limited to cool, well-oxygenated streams. They are sensitive to most of the same pollutants as mayflies, except acidity. They are usually much less numerous than mayflies. The presence of even a few stoneflies in a stream suggests that good water quality has been maintained for several months. Caddisfly larvae often build a portable case of sand, stones, sticks, or other debris. Many caddisfly larvae are sensitive to pollution, although a few are tolerant. One family spins nets to catch drifting plankton, and is often numerous in nutrient-enriched stream segments. The most common beetles in streams are riffle beetles (adult and larva pictured) and water pennies (not shown). Most of these require a swift current and an adequate supply of oxygen, and are generally considered clean-water indicators.
MAYFLIES
STONEFLIES
CADDISFLIES
BEETLES
From the digital collections of the New York State Library.
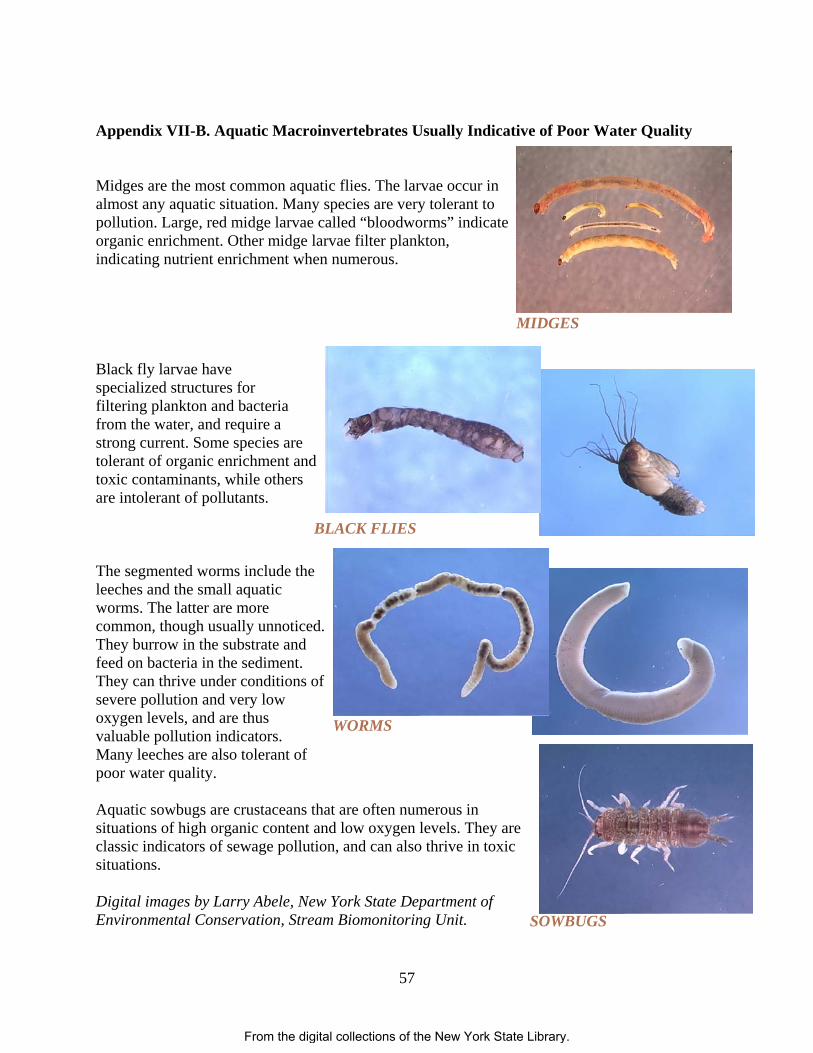
57
Appendix VII-B. Aquatic Macroinvertebrates Usually Indicative of Poor Water Quality Midges are the most common aquatic flies. The larvae occur in almost any aquatic situation. Many species are very tolerant to pollution. Large, red midge larvae called “bloodworms” indicate organic enrichment. Other midge larvae filter plankton, indicating nutrient enrichment when numerous. Black fly larvae have specialized structures for filtering plankton and bacteria from the water, and require a strong current. Some species are tolerant of organic enrichment and toxic contaminants, while others are intolerant of pollutants. The segmented worms include the leeches and the small aquatic worms. The latter are more common, though usually unnoticed. They burrow in the substrate and feed on bacteria in the sediment. They can thrive under conditions of severe pollution and very low oxygen levels, and are thus valuable pollution indicators. Many leeches are also tolerant of poor water quality. Aquatic sowbugs are crustaceans that are often numerous in situations of high organic content and low oxygen levels. They are classic indicators of sewage pollution, and can also thrive in toxic situations. Digital images by Larry Abele, New York State Department of Environmental Conservation, Stream Biomonitoring Unit.
MIDGES
BLACK FLIES
WORMS
SOWBUGS
From the digital collections of the New York State Library.
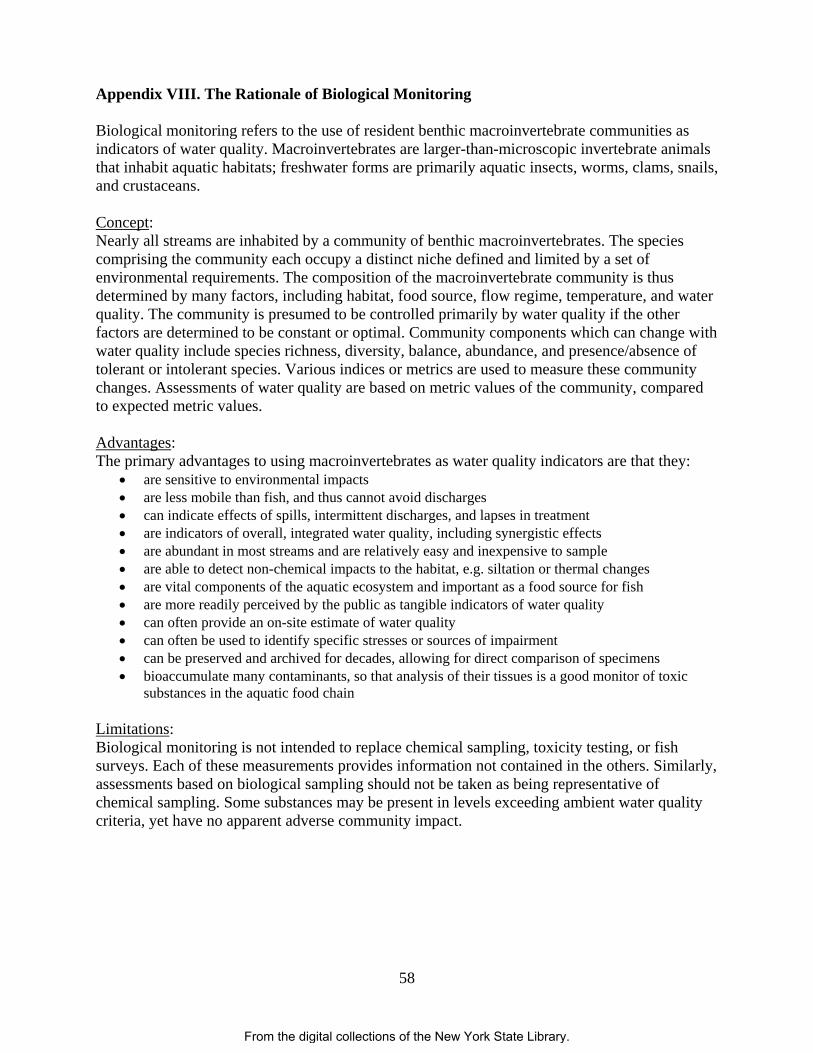
58
Appendix VIII. The Rationale of Biological Monitoring Biological monitoring refers to the use of resident benthic macroinvertebrate communities as indicators of water quality. Macroinvertebrates are larger-than-microscopic invertebrate animals that inhabit aquatic habitats; freshwater forms are primarily aquatic insects, worms, clams, snails, and crustaceans. Concept: Nearly all streams are inhabited by a community of benthic macroinvertebrates. The species comprising the community each occupy a distinct niche defined and limited by a set of environmental requirements. The composition of the macroinvertebrate community is thus determined by many factors, including habitat, food source, flow regime, temperature, and water quality. The community is presumed to be controlled primarily by water quality if the other factors are determined to be constant or optimal. Community components which can change with water quality include species richness, diversity, balance, abundance, and presence/absence of tolerant or intolerant species. Various indices or metrics are used to measure these community changes. Assessments of water quality are based on metric values of the community, compared to expected metric values. Advantages: The primary advantages to using macroinvertebrates as water quality indicators are that they:
• are sensitive to environmental impacts • are less mobile than fish, and thus cannot avoid discharges • can indicate effects of spills, intermittent discharges, and lapses in treatment • are indicators of overall, integrated water quality, including synergistic effects • are abundant in most streams and are relatively easy and inexpensive to sample • are able to detect non-chemical impacts to the habitat, e.g. siltation or thermal changes • are vital components of the aquatic ecosystem and important as a food source for fish • are more readily perceived by the public as tangible indicators of water quality • can often provide an on-site estimate of water quality • can often be used to identify specific stresses or sources of impairment • can be preserved and archived for decades, allowing for direct comparison of specimens • bioaccumulate many contaminants, so that analysis of their tissues is a good monitor of toxic
substances in the aquatic food chain Limitations: Biological monitoring is not intended to replace chemical sampling, toxicity testing, or fish surveys. Each of these measurements provides information not contained in the others. Similarly, assessments based on biological sampling should not be taken as being representative of chemical sampling. Some substances may be present in levels exceeding ambient water quality criteria, yet have no apparent adverse community impact.
From the digital collections of the New York State Library.
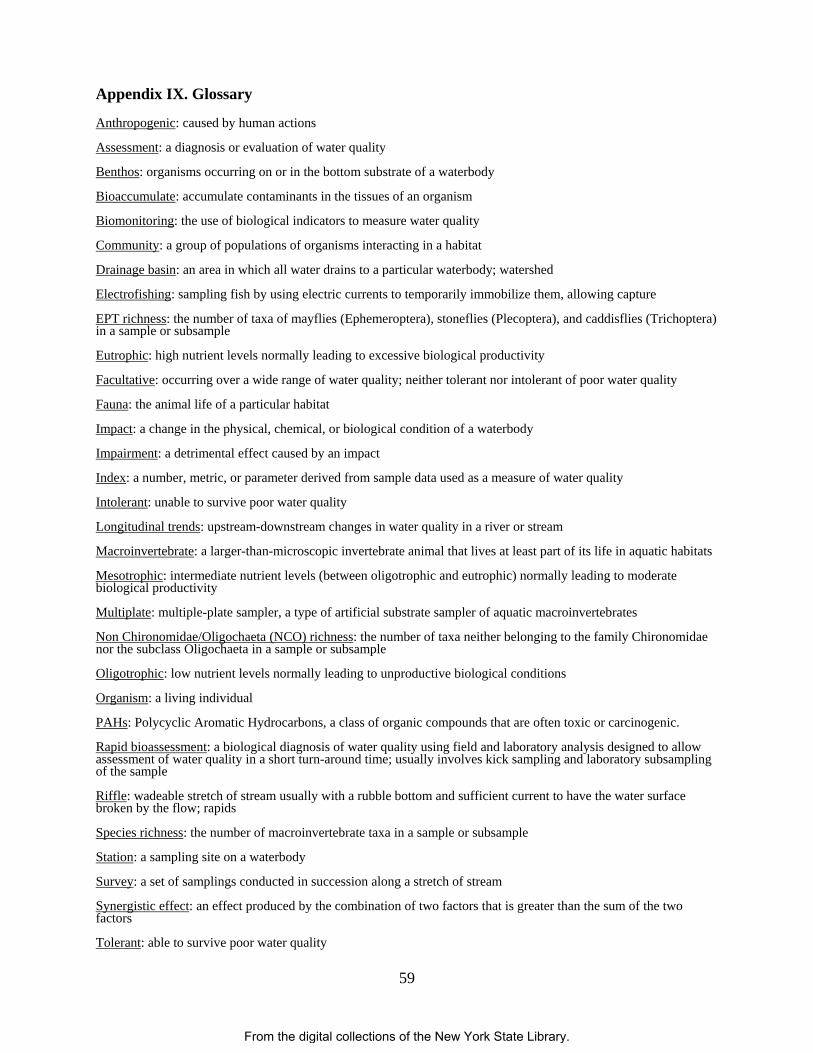
59
Appendix IX. Glossary Anthropogenic: caused by human actions Assessment: a diagnosis or evaluation of water quality Benthos: organisms occurring on or in the bottom substrate of a waterbody Bioaccumulate: accumulate contaminants in the tissues of an organism Biomonitoring: the use of biological indicators to measure water quality Community: a group of populations of organisms interacting in a habitat Drainage basin: an area in which all water drains to a particular waterbody; watershed Electrofishing: sampling fish by using electric currents to temporarily immobilize them, allowing capture EPT richness: the number of taxa of mayflies (Ephemeroptera), stoneflies (Plecoptera), and caddisflies (Trichoptera) in a sample or subsample Eutrophic: high nutrient levels normally leading to excessive biological productivity Facultative: occurring over a wide range of water quality; neither tolerant nor intolerant of poor water quality Fauna: the animal life of a particular habitat Impact: a change in the physical, chemical, or biological condition of a waterbody Impairment: a detrimental effect caused by an impact Index: a number, metric, or parameter derived from sample data used as a measure of water quality Intolerant: unable to survive poor water quality Longitudinal trends: upstream-downstream changes in water quality in a river or stream Macroinvertebrate: a larger-than-microscopic invertebrate animal that lives at least part of its life in aquatic habitats Mesotrophic: intermediate nutrient levels (between oligotrophic and eutrophic) normally leading to moderate biological productivity Multiplate: multiple-plate sampler, a type of artificial substrate sampler of aquatic macroinvertebrates Non Chironomidae/Oligochaeta (NCO) richness: the number of taxa neither belonging to the family Chironomidae nor the subclass Oligochaeta in a sample or subsample Oligotrophic: low nutrient levels normally leading to unproductive biological conditions Organism: a living individual PAHs: Polycyclic Aromatic Hydrocarbons, a class of organic compounds that are often toxic or carcinogenic. Rapid bioassessment: a biological diagnosis of water quality using field and laboratory analysis designed to allow assessment of water quality in a short turn-around time; usually involves kick sampling and laboratory subsampling of the sample Riffle: wadeable stretch of stream usually with a rubble bottom and sufficient current to have the water surface broken by the flow; rapids Species richness: the number of macroinvertebrate taxa in a sample or subsample Station: a sampling site on a waterbody Survey: a set of samplings conducted in succession along a stretch of stream Synergistic effect: an effect produced by the combination of two factors that is greater than the sum of the two factors Tolerant: able to survive poor water quality
From the digital collections of the New York State Library.

60
Trophic: referring to the biological productivity of a stream
From the digital collections of the New York State Library.
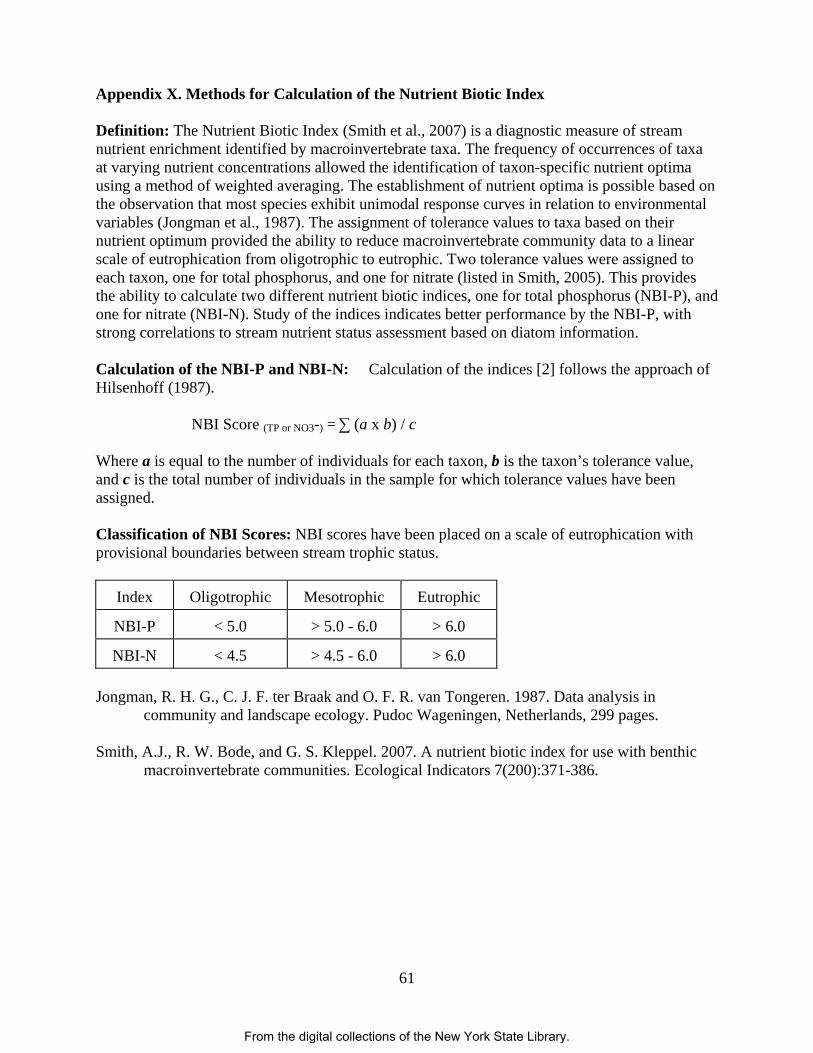
61
Appendix X. Methods for Calculation of the Nutrient Biotic Index Definition: The Nutrient Biotic Index (Smith et al., 2007) is a diagnostic measure of stream nutrient enrichment identified by macroinvertebrate taxa. The frequency of occurrences of taxa at varying nutrient concentrations allowed the identification of taxon-specific nutrient optima using a method of weighted averaging. The establishment of nutrient optima is possible based on the observation that most species exhibit unimodal response curves in relation to environmental variables (Jongman et al., 1987). The assignment of tolerance values to taxa based on their nutrient optimum provided the ability to reduce macroinvertebrate community data to a linear scale of eutrophication from oligotrophic to eutrophic. Two tolerance values were assigned to each taxon, one for total phosphorus, and one for nitrate (listed in Smith, 2005). This provides the ability to calculate two different nutrient biotic indices, one for total phosphorus (NBI-P), and one for nitrate (NBI-N). Study of the indices indicates better performance by the NBI-P, with strong correlations to stream nutrient status assessment based on diatom information. Calculation of the NBI-P and NBI-N: Calculation of the indices [2] follows the approach of Hilsenhoff (1987). NBI Score (TP or NO3-) = ∑ (a x b) / c Where a is equal to the number of individuals for each taxon, b is the taxon’s tolerance value, and c is the total number of individuals in the sample for which tolerance values have been assigned. Classification of NBI Scores: NBI scores have been placed on a scale of eutrophication with provisional boundaries between stream trophic status.
Index Oligotrophic Mesotrophic Eutrophic
NBI-P < 5.0 > 5.0 - 6.0 > 6.0
NBI-N < 4.5 > 4.5 - 6.0 > 6.0 Jongman, R. H. G., C. J. F. ter Braak and O. F. R. van Tongeren. 1987. Data analysis in community and landscape ecology. Pudoc Wageningen, Netherlands, 299 pages. Smith, A.J., R. W. Bode, and G. S. Kleppel. 2007. A nutrient biotic index for use with benthic
macroinvertebrate communities. Ecological Indicators 7(200):371-386.
From the digital collections of the New York State Library.
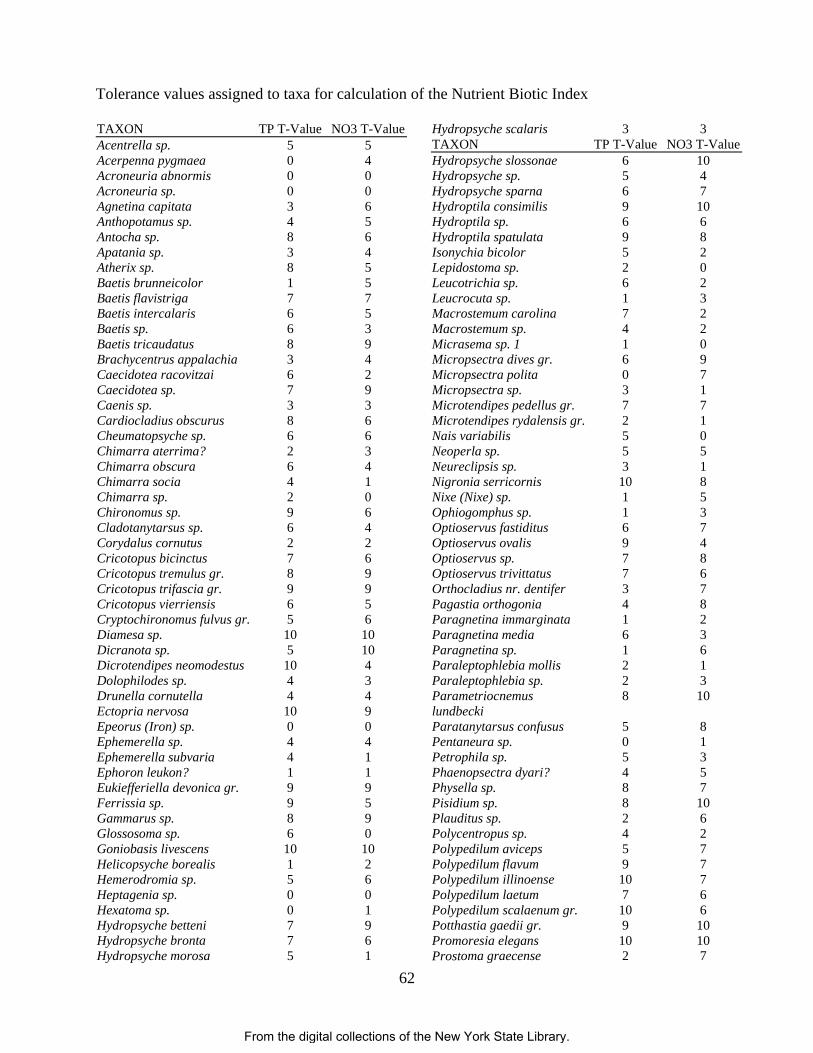
62
Tolerance values assigned to taxa for calculation of the Nutrient Biotic Index TAXON TP T-Value NO3 T-ValueAcentrella sp. 5 5 Acerpenna pygmaea 0 4 Acroneuria abnormis 0 0 Acroneuria sp. 0 0 Agnetina capitata 3 6 Anthopotamus sp. 4 5 Antocha sp. 8 6 Apatania sp. 3 4 Atherix sp. 8 5 Baetis brunneicolor 1 5 Baetis flavistriga 7 7 Baetis intercalaris 6 5 Baetis sp. 6 3 Baetis tricaudatus 8 9 Brachycentrus appalachia 3 4 Caecidotea racovitzai 6 2 Caecidotea sp. 7 9 Caenis sp. 3 3 Cardiocladius obscurus 8 6 Cheumatopsyche sp. 6 6 Chimarra aterrima? 2 3 Chimarra obscura 6 4 Chimarra socia 4 1 Chimarra sp. 2 0 Chironomus sp. 9 6 Cladotanytarsus sp. 6 4 Corydalus cornutus 2 2 Cricotopus bicinctus 7 6 Cricotopus tremulus gr. 8 9 Cricotopus trifascia gr. 9 9 Cricotopus vierriensis 6 5 Cryptochironomus fulvus gr. 5 6 Diamesa sp. 10 10 Dicranota sp. 5 10 Dicrotendipes neomodestus 10 4 Dolophilodes sp. 4 3 Drunella cornutella 4 4 Ectopria nervosa 10 9 Epeorus (Iron) sp. 0 0 Ephemerella sp. 4 4 Ephemerella subvaria 4 1 Ephoron leukon? 1 1 Eukiefferiella devonica gr. 9 9 Ferrissia sp. 9 5 Gammarus sp. 8 9 Glossosoma sp. 6 0 Goniobasis livescens 10 10 Helicopsyche borealis 1 2 Hemerodromia sp. 5 6 Heptagenia sp. 0 0 Hexatoma sp. 0 1 Hydropsyche betteni 7 9 Hydropsyche bronta 7 6 Hydropsyche morosa 5 1
Hydropsyche scalaris 3 3 TAXON TP T-Value NO3 T-ValueHydropsyche slossonae 6 10 Hydropsyche sp. 5 4 Hydropsyche sparna 6 7 Hydroptila consimilis 9 10 Hydroptila sp. 6 6 Hydroptila spatulata 9 8 Isonychia bicolor 5 2 Lepidostoma sp. 2 0 Leucotrichia sp. 6 2 Leucrocuta sp. 1 3 Macrostemum carolina 7 2 Macrostemum sp. 4 2 Micrasema sp. 1 1 0 Micropsectra dives gr. 6 9 Micropsectra polita 0 7 Micropsectra sp. 3 1 Microtendipes pedellus gr. 7 7 Microtendipes rydalensis gr. 2 1 Nais variabilis 5 0 Neoperla sp. 5 5 Neureclipsis sp. 3 1 Nigronia serricornis 10 8 Nixe (Nixe) sp. 1 5 Ophiogomphus sp. 1 3 Optioservus fastiditus 6 7 Optioservus ovalis 9 4 Optioservus sp. 7 8 Optioservus trivittatus 7 6 Orthocladius nr. dentifer 3 7 Pagastia orthogonia 4 8 Paragnetina immarginata 1 2 Paragnetina media 6 3 Paragnetina sp. 1 6 Paraleptophlebia mollis 2 1 Paraleptophlebia sp. 2 3 Parametriocnemus lundbecki
8 10
Paratanytarsus confusus 5 8 Pentaneura sp. 0 1 Petrophila sp. 5 3 Phaenopsectra dyari? 4 5 Physella sp. 8 7 Pisidium sp. 8 10 Plauditus sp. 2 6 Polycentropus sp. 4 2 Polypedilum aviceps 5 7 Polypedilum flavum 9 7 Polypedilum illinoense 10 7 Polypedilum laetum 7 6 Polypedilum scalaenum gr. 10 6 Potthastia gaedii gr. 9 10 Promoresia elegans 10 10 Prostoma graecense 2 7
From the digital collections of the New York State Library.
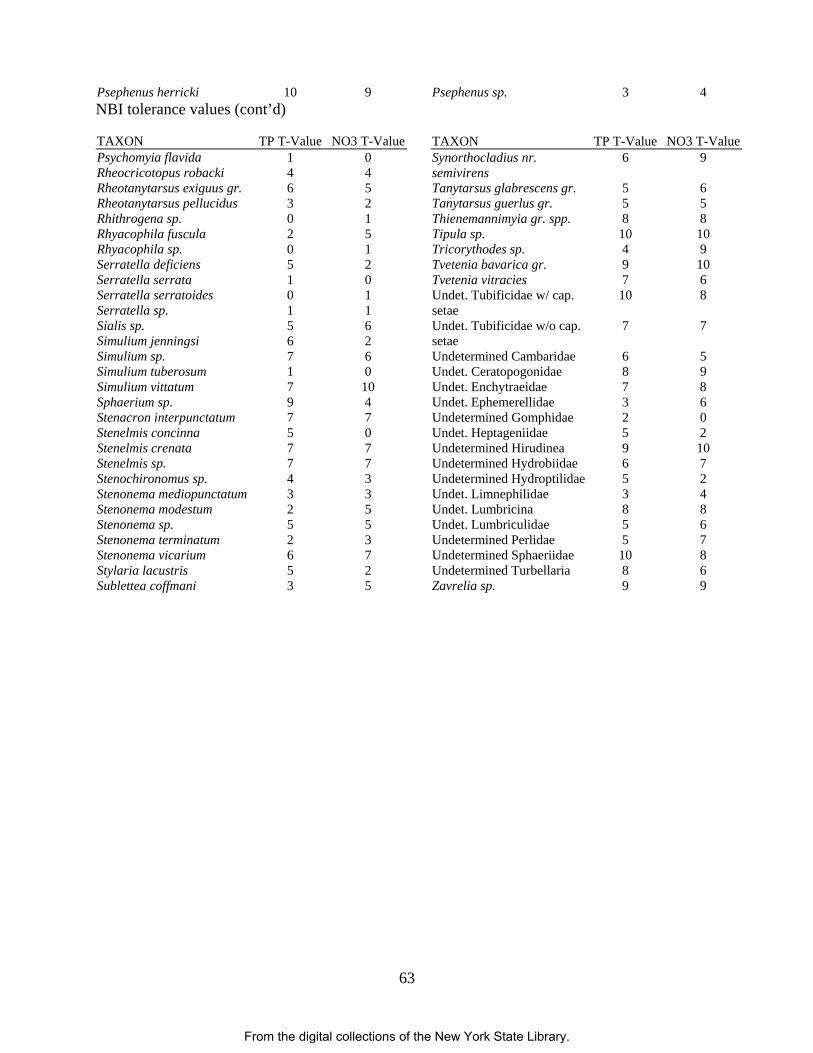
63
Psephenus herricki 10 9 Psephenus sp. 3 4 NBI tolerance values (cont’d) TAXON TP T-Value NO3 T-ValuePsychomyia flavida 1 0 Rheocricotopus robacki 4 4 Rheotanytarsus exiguus gr. 6 5 Rheotanytarsus pellucidus 3 2 Rhithrogena sp. 0 1 Rhyacophila fuscula 2 5 Rhyacophila sp. 0 1 Serratella deficiens 5 2 Serratella serrata 1 0 Serratella serratoides 0 1 Serratella sp. 1 1 Sialis sp. 5 6 Simulium jenningsi 6 2 Simulium sp. 7 6 Simulium tuberosum 1 0 Simulium vittatum 7 10 Sphaerium sp. 9 4 Stenacron interpunctatum 7 7 Stenelmis concinna 5 0 Stenelmis crenata 7 7 Stenelmis sp. 7 7 Stenochironomus sp. 4 3 Stenonema mediopunctatum 3 3 Stenonema modestum 2 5 Stenonema sp. 5 5 Stenonema terminatum 2 3 Stenonema vicarium 6 7 Stylaria lacustris 5 2 Sublettea coffmani 3 5
TAXON TP T-Value NO3 T-ValueSynorthocladius nr. semivirens
6 9
Tanytarsus glabrescens gr. 5 6 Tanytarsus guerlus gr. 5 5 Thienemannimyia gr. spp. 8 8 Tipula sp. 10 10 Tricorythodes sp. 4 9 Tvetenia bavarica gr. 9 10 Tvetenia vitracies 7 6 Undet. Tubificidae w/ cap. setae
10 8
Undet. Tubificidae w/o cap. setae
7 7
Undetermined Cambaridae 6 5 Undet. Ceratopogonidae 8 9 Undet. Enchytraeidae 7 8 Undet. Ephemerellidae 3 6 Undetermined Gomphidae 2 0 Undet. Heptageniidae 5 2 Undetermined Hirudinea 9 10 Undetermined Hydrobiidae 6 7 Undetermined Hydroptilidae 5 2 Undet. Limnephilidae 3 4 Undet. Lumbricina 8 8 Undet. Lumbriculidae 5 6 Undetermined Perlidae 5 7 Undetermined Sphaeriidae 10 8 Undetermined Turbellaria 8 6 Zavrelia sp. 9 9
From the digital collections of the New York State Library.
64
Appendix XI. Impact Source Determination Methods and Community Models Definition: Impact Source Determination (ISD) is the procedure for identifying types of impacts that exert deleterious effects on a waterbody. While the analysis of benthic macroinvertebrate communities has been shown to be an effective means of determining severity of water quality impacts, it has been less effective in determining what kind of pollution is causing the impact. ISD uses community types or models to ascertain the primary factor influencing the fauna. Development of methods: The method found to be most useful in differentiating impacts in New York State streams was the use of community types based on composition by family and genus. It may be seen as an elaboration of Percent Model Affinity (Novak and Bode, 1992), which is based on class and order. A large database of macroinvertebrate data was required to develop ISD methods. The database included several sites known or presumed to be impacted by specific impact types. The impact types were mostly known by chemical data or land use. These sites were grouped into the following general categories: agricultural nonpoint, toxic-stressed, sewage (domestic municipal), sewage/toxic, siltation, impoundment, and natural. Each group initially contained 20 sites. Cluster analysis was then performed within each group, using percent similarity at the family or genus level. Within each group, four clusters were identified. Each cluster was usually composed of 4-5 sites with high biological similarity. From each cluster, a hypothetical model was then formed to represent a model cluster community type; sites within the cluster had at least 50 percent similarity to this model. These community type models formed the basis for ISD (see tables following). The method was tested by calculating percent similarity to all the models and determining which model was the most similar to the test site. Some models were initially adjusted to achieve maximum representation of the impact type. New models are developed when similar communities are recognized from several streams. Use of the ISD methods: Impact Source Determination is based on similarity to existing models of community types (see tables following). The model that exhibits the highest similarity to the test data denotes the likely impact source type, or may indicate "natural," lacking an impact. In the graphic representation of ISD, only the highest similarity of each source type is identified. If no model exhibits a similarity to the test data of greater than 50 percent, the determination is inconclusive. The determination of impact source type is used in conjunction with assessment of severity of water quality impact to provide an overall assessment of water quality. Limitations: These methods were developed for data derived from subsamples of 100-organisms each that are taken from traveling kick samples of New York State streams. Application of these methods for data derived from other sampling methods, habitats, or geographical areas would likely require modification of the models.
From the digital collections of the New York State Library.
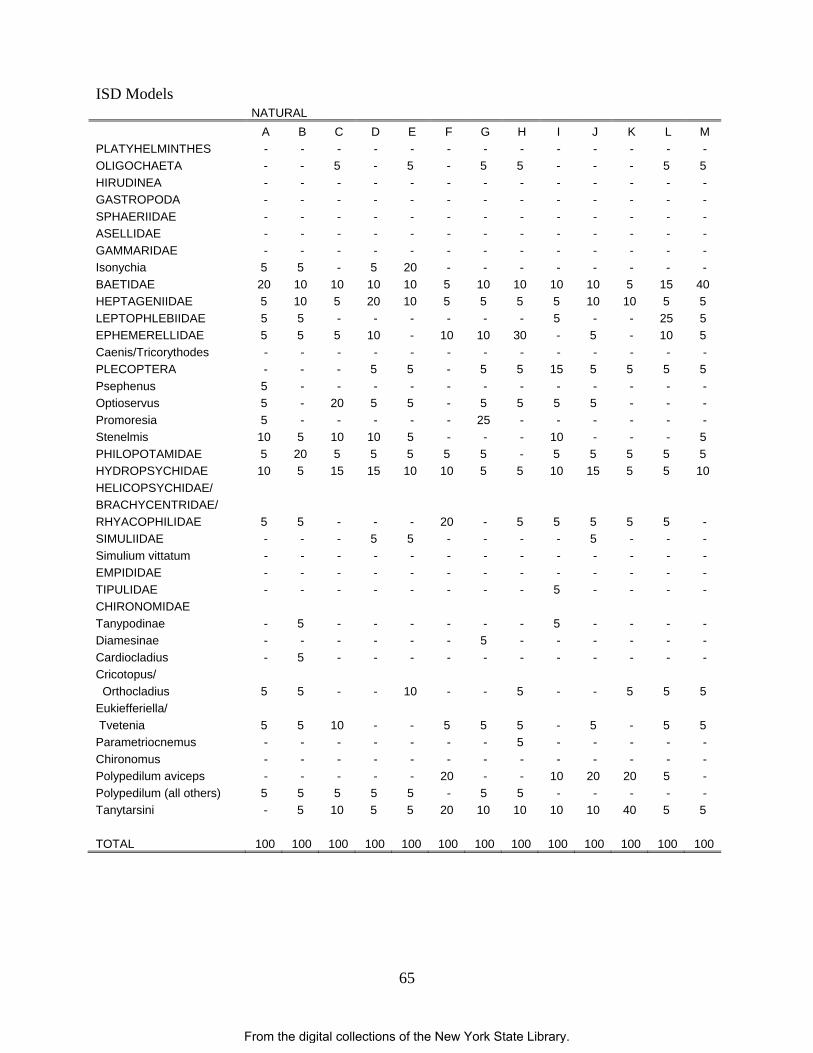
65
ISD Models NATURAL A B C D E F G H I J K L M PLATYHELMINTHES - - - - - - - - - - - - - OLIGOCHAETA - - 5 - 5 - 5 5 - - - 5 5 HIRUDINEA - - - - - - - - - - - - - GASTROPODA - - - - - - - - - - - - - SPHAERIIDAE - - - - - - - - - - - - - ASELLIDAE - - - - - - - - - - - - - GAMMARIDAE - - - - - - - - - - - - - Isonychia 5 5 - 5 20 - - - - - - - - BAETIDAE 20 10 10 10 10 5 10 10 10 10 5 15 40 HEPTAGENIIDAE 5 10 5 20 10 5 5 5 5 10 10 5 5 LEPTOPHLEBIIDAE 5 5 - - - - - - 5 - - 25 5 EPHEMERELLIDAE 5 5 5 10 - 10 10 30 - 5 - 10 5 Caenis/Tricorythodes - - - - - - - - - - - - - PLECOPTERA - - - 5 5 - 5 5 15 5 5 5 5 Psephenus 5 - - - - - - - - - - - - Optioservus 5 - 20 5 5 - 5 5 5 5 - - - Promoresia 5 - - - - - 25 - - - - - - Stenelmis 10 5 10 10 5 - - - 10 - - - 5 PHILOPOTAMIDAE 5 20 5 5 5 5 5 - 5 5 5 5 5 HYDROPSYCHIDAE 10 5 15 15 10 10 5 5 10 15 5 5 10 HELICOPSYCHIDAE/ BRACHYCENTRIDAE/ RHYACOPHILIDAE 5 5 - - - 20 - 5 5 5 5 5 - SIMULIIDAE - - - 5 5 - - - - 5 - - - Simulium vittatum - - - - - - - - - - - - - EMPIDIDAE - - - - - - - - - - - - - TIPULIDAE - - - - - - - - 5 - - - - CHIRONOMIDAE Tanypodinae - 5 - - - - - - 5 - - - - Diamesinae - - - - - - 5 - - - - - - Cardiocladius - 5 - - - - - - - - - - - Cricotopus/ Orthocladius 5 5 - - 10 - - 5 - - 5 5 5 Eukiefferiella/ Tvetenia 5 5 10 - - 5 5 5 - 5 - 5 5 Parametriocnemus - - - - - - - 5 - - - - - Chironomus - - - - - - - - - - - - - Polypedilum aviceps - - - - - 20 - - 10 20 20 5 - Polypedilum (all others) 5 5 5 5 5 - 5 5 - - - - - Tanytarsini - 5 10 5 5 20 10 10 10 10 40 5 5 TOTAL 100 100 100 100 100 100 100 100 100 100 100 100 100
From the digital collections of the New York State Library.
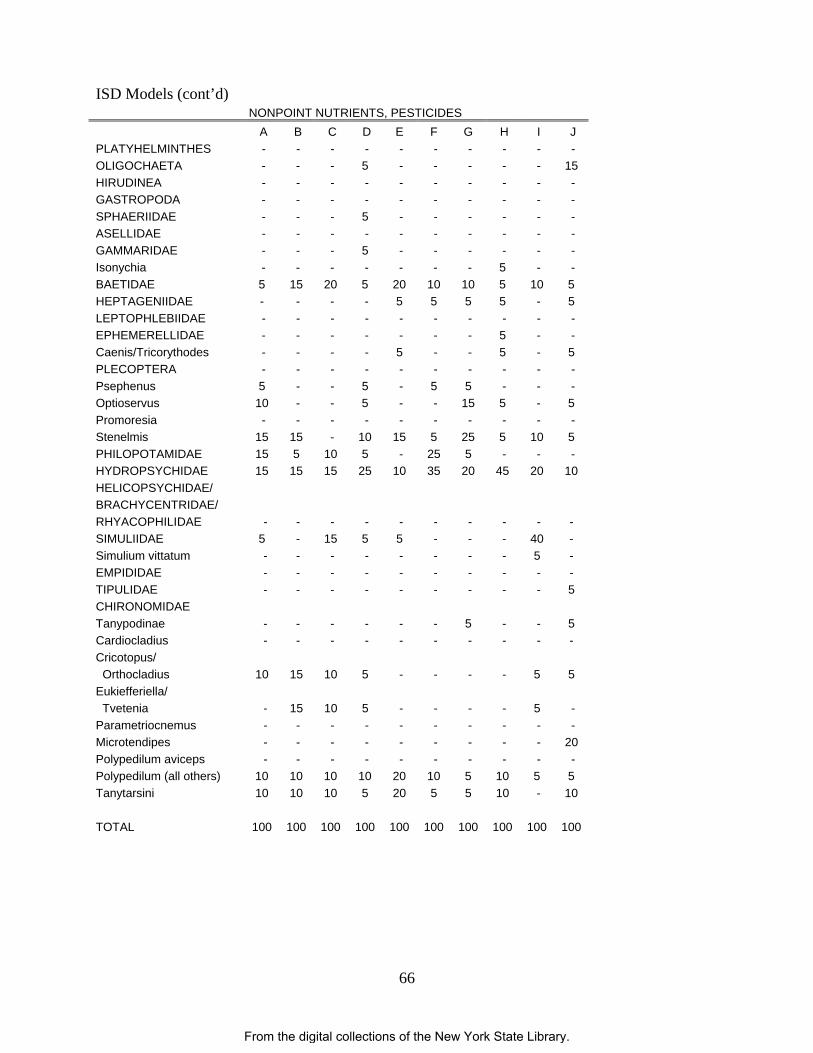
66
ISD Models (cont’d) NONPOINT NUTRIENTS, PESTICIDES A B C D E F G H I J PLATYHELMINTHES - - - - - - - - - - OLIGOCHAETA - - - 5 - - - - - 15 HIRUDINEA - - - - - - - - - - GASTROPODA - - - - - - - - - - SPHAERIIDAE - - - 5 - - - - - - ASELLIDAE - - - - - - - - - - GAMMARIDAE - - - 5 - - - - - - Isonychia - - - - - - - 5 - - BAETIDAE 5 15 20 5 20 10 10 5 10 5 HEPTAGENIIDAE - - - - 5 5 5 5 - 5 LEPTOPHLEBIIDAE - - - - - - - - - - EPHEMERELLIDAE - - - - - - - 5 - - Caenis/Tricorythodes - - - - 5 - - 5 - 5 PLECOPTERA - - - - - - - - - - Psephenus 5 - - 5 - 5 5 - - - Optioservus 10 - - 5 - - 15 5 - 5 Promoresia - - - - - - - - - - Stenelmis 15 15 - 10 15 5 25 5 10 5 PHILOPOTAMIDAE 15 5 10 5 - 25 5 - - - HYDROPSYCHIDAE 15 15 15 25 10 35 20 45 20 10 HELICOPSYCHIDAE/ BRACHYCENTRIDAE/ RHYACOPHILIDAE - - - - - - - - - - SIMULIIDAE 5 - 15 5 5 - - - 40 - Simulium vittatum - - - - - - - - 5 - EMPIDIDAE - - - - - - - - - - TIPULIDAE - - - - - - - - - 5 CHIRONOMIDAE Tanypodinae - - - - - - 5 - - 5 Cardiocladius - - - - - - - - - - Cricotopus/ Orthocladius 10 15 10 5 - - - - 5 5 Eukiefferiella/ Tvetenia - 15 10 5 - - - - 5 - Parametriocnemus - - - - - - - - - - Microtendipes - - - - - - - - - 20 Polypedilum aviceps - - - - - - - - - - Polypedilum (all others) 10 10 10 10 20 10 5 10 5 5 Tanytarsini 10 10 10 5 20 5 5 10 - 10 TOTAL 100 100 100 100 100 100 100 100 100 100
From the digital collections of the New York State Library.
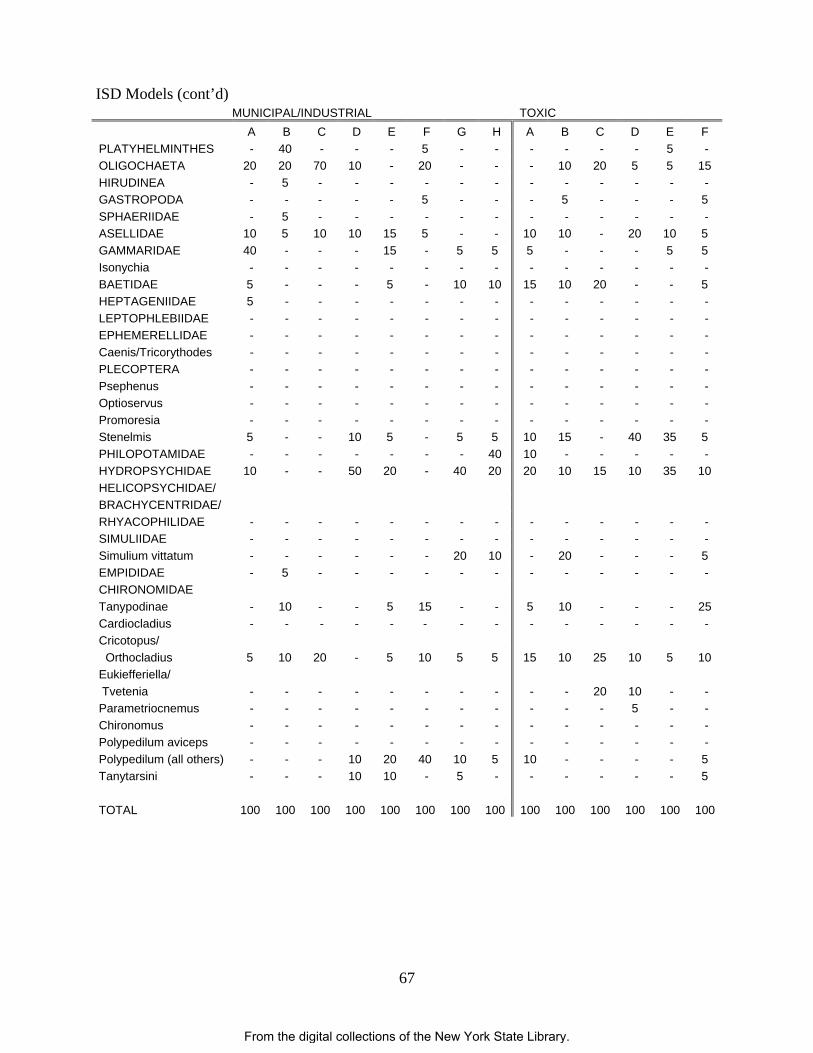
67
ISD Models (cont’d) MUNICIPAL/INDUSTRIAL TOXIC
A B C D E F G H A B C D E F PLATYHELMINTHES - 40 - - - 5 - - - - - - 5 - OLIGOCHAETA 20 20 70 10 - 20 - - - 10 20 5 5 15 HIRUDINEA - 5 - - - - - - - - - - - - GASTROPODA - - - - - 5 - - - 5 - - - 5 SPHAERIIDAE - 5 - - - - - - - - - - - - ASELLIDAE 10 5 10 10 15 5 - - 10 10 - 20 10 5 GAMMARIDAE 40 - - - 15 - 5 5 5 - - - 5 5 Isonychia - - - - - - - - - - - - - - BAETIDAE 5 - - - 5 - 10 10 15 10 20 - - 5 HEPTAGENIIDAE 5 - - - - - - - - - - - - - LEPTOPHLEBIIDAE - - - - - - - - - - - - - - EPHEMERELLIDAE - - - - - - - - - - - - - - Caenis/Tricorythodes - - - - - - - - - - - - - - PLECOPTERA - - - - - - - - - - - - - - Psephenus - - - - - - - - - - - - - - Optioservus - - - - - - - - - - - - - - Promoresia - - - - - - - - - - - - - - Stenelmis 5 - - 10 5 - 5 5 10 15 - 40 35 5 PHILOPOTAMIDAE - - - - - - - 40 10 - - - - - HYDROPSYCHIDAE 10 - - 50 20 - 40 20 20 10 15 10 35 10 HELICOPSYCHIDAE/ BRACHYCENTRIDAE/ RHYACOPHILIDAE - - - - - - - - - - - - - - SIMULIIDAE - - - - - - - - - - - - - - Simulium vittatum - - - - - - 20 10 - 20 - - - 5 EMPIDIDAE - 5 - - - - - - - - - - - - CHIRONOMIDAE Tanypodinae - 10 - - 5 15 - - 5 10 - - - 25 Cardiocladius - - - - - - - - - - - - - - Cricotopus/ Orthocladius 5 10 20 - 5 10 5 5 15 10 25 10 5 10 Eukiefferiella/ Tvetenia - - - - - - - - - - 20 10 - - Parametriocnemus - - - - - - - - - - - 5 - - Chironomus - - - - - - - - - - - - - - Polypedilum aviceps - - - - - - - - - - - - - - Polypedilum (all others) - - - 10 20 40 10 5 10 - - - - 5 Tanytarsini - - - 10 10 - 5 - - - - - - 5 TOTAL 100 100 100 100 100 100 100 100 100 100 100 100 100 100
From the digital collections of the New York State Library.
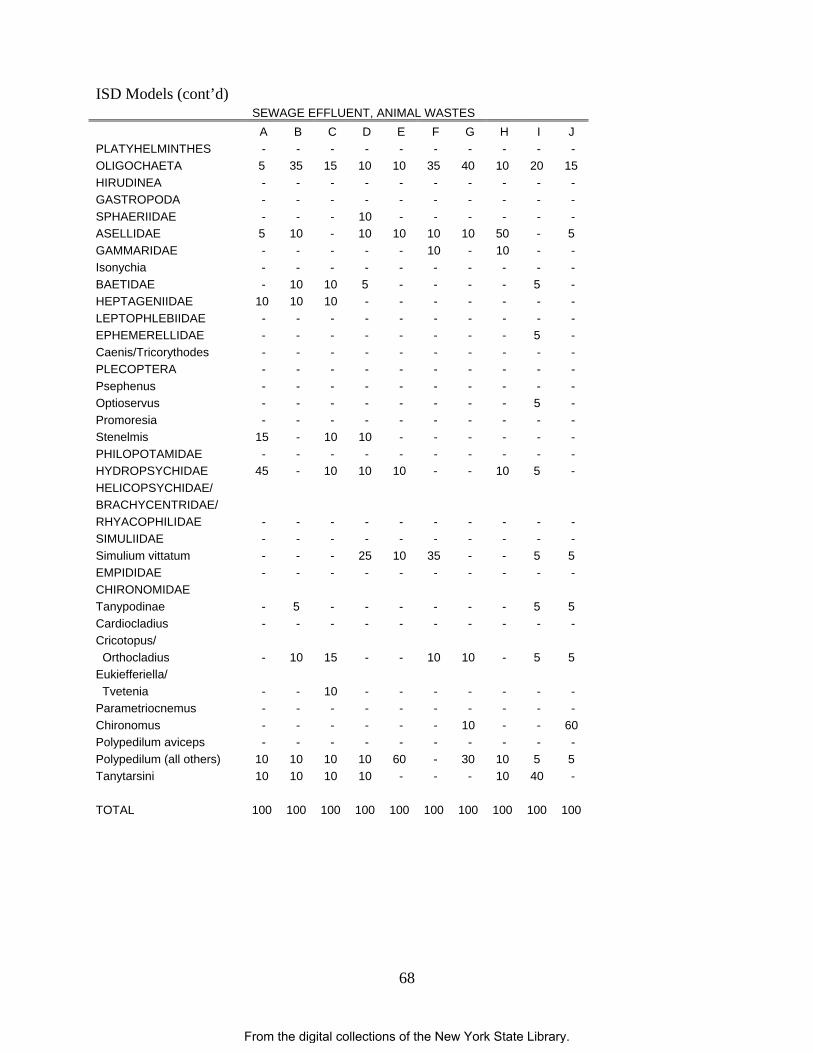
68
ISD Models (cont’d) SEWAGE EFFLUENT, ANIMAL WASTES
A B C D E F G H I J PLATYHELMINTHES - - - - - - - - - - OLIGOCHAETA 5 35 15 10 10 35 40 10 20 15 HIRUDINEA - - - - - - - - - - GASTROPODA - - - - - - - - - - SPHAERIIDAE - - - 10 - - - - - - ASELLIDAE 5 10 - 10 10 10 10 50 - 5 GAMMARIDAE - - - - - 10 - 10 - - Isonychia - - - - - - - - - - BAETIDAE - 10 10 5 - - - - 5 - HEPTAGENIIDAE 10 10 10 - - - - - - - LEPTOPHLEBIIDAE - - - - - - - - - - EPHEMERELLIDAE - - - - - - - - 5 - Caenis/Tricorythodes - - - - - - - - - - PLECOPTERA - - - - - - - - - - Psephenus - - - - - - - - - - Optioservus - - - - - - - - 5 - Promoresia - - - - - - - - - - Stenelmis 15 - 10 10 - - - - - - PHILOPOTAMIDAE - - - - - - - - - - HYDROPSYCHIDAE 45 - 10 10 10 - - 10 5 - HELICOPSYCHIDAE/ BRACHYCENTRIDAE/ RHYACOPHILIDAE - - - - - - - - - - SIMULIIDAE - - - - - - - - - - Simulium vittatum - - - 25 10 35 - - 5 5 EMPIDIDAE - - - - - - - - - - CHIRONOMIDAE Tanypodinae - 5 - - - - - - 5 5 Cardiocladius - - - - - - - - - - Cricotopus/ Orthocladius - 10 15 - - 10 10 - 5 5 Eukiefferiella/ Tvetenia - - 10 - - - - - - - Parametriocnemus - - - - - - - - - - Chironomus - - - - - - 10 - - 60 Polypedilum aviceps - - - - - - - - - - Polypedilum (all others) 10 10 10 10 60 - 30 10 5 5 Tanytarsini 10 10 10 10 - - - 10 40 - TOTAL 100 100 100 100 100 100 100 100 100 100
From the digital collections of the New York State Library.
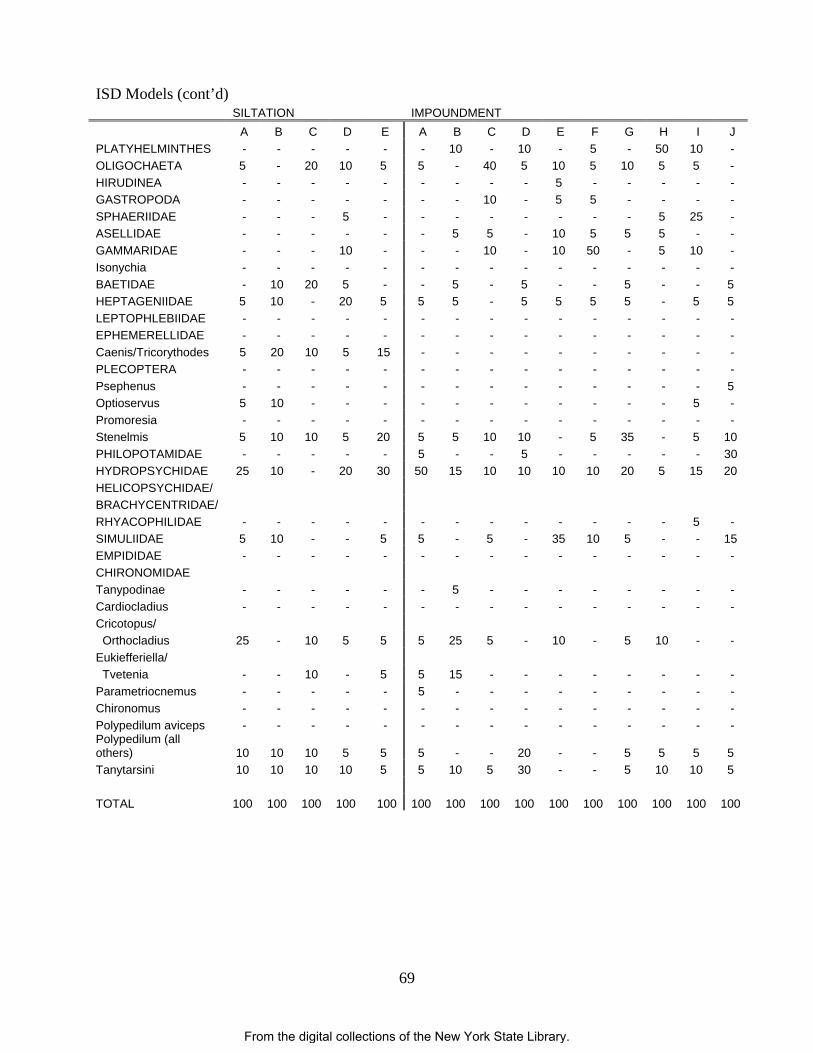
69
ISD Models (cont’d) SILTATION IMPOUNDMENT A B C D E A B C D E F G H I J PLATYHELMINTHES - - - - - - 10 - 10 - 5 - 50 10 - OLIGOCHAETA 5 - 20 10 5 5 - 40 5 10 5 10 5 5 - HIRUDINEA - - - - - - - - - 5 - - - - - GASTROPODA - - - - - - - 10 - 5 5 - - - - SPHAERIIDAE - - - 5 - - - - - - - - 5 25 - ASELLIDAE - - - - - - 5 5 - 10 5 5 5 - - GAMMARIDAE - - - 10 - - - 10 - 10 50 - 5 10 - Isonychia - - - - - - - - - - - - - - - BAETIDAE - 10 20 5 - - 5 - 5 - - 5 - - 5 HEPTAGENIIDAE 5 10 - 20 5 5 5 - 5 5 5 5 - 5 5 LEPTOPHLEBIIDAE - - - - - - - - - - - - - - - EPHEMERELLIDAE - - - - - - - - - - - - - - - Caenis/Tricorythodes 5 20 10 5 15 - - - - - - - - - - PLECOPTERA - - - - - - - - - - - - - - - Psephenus - - - - - - - - - - - - - - 5 Optioservus 5 10 - - - - - - - - - - - 5 - Promoresia - - - - - - - - - - - - - - - Stenelmis 5 10 10 5 20 5 5 10 10 - 5 35 - 5 10 PHILOPOTAMIDAE - - - - - 5 - - 5 - - - - - 30 HYDROPSYCHIDAE 25 10 - 20 30 50 15 10 10 10 10 20 5 15 20 HELICOPSYCHIDAE/ BRACHYCENTRIDAE/ RHYACOPHILIDAE - - - - - - - - - - - - - 5 - SIMULIIDAE 5 10 - - 5 5 - 5 - 35 10 5 - - 15 EMPIDIDAE - - - - - - - - - - - - - - - CHIRONOMIDAE Tanypodinae - - - - - - 5 - - - - - - - - Cardiocladius - - - - - - - - - - - - - - - Cricotopus/ Orthocladius 25 - 10 5 5 5 25 5 - 10 - 5 10 - - Eukiefferiella/ Tvetenia - - 10 - 5 5 15 - - - - - - - - Parametriocnemus - - - - - 5 - - - - - - - - - Chironomus - - - - - - - - - - - - - - - Polypedilum aviceps - - - - - - - - - - - - - - - Polypedilum (all others) 10 10 10 5 5 5 - - 20 - - 5 5 5 5 Tanytarsini 10 10 10 10 5 5 10 5 30 - - 5 10 10 5 TOTAL 100 100 100 100 100 100 100 100 100 100 100 100 100 100 100
From the digital collections of the New York State Library.
70
Appendix XII. Biological Impacts of Waters with High Conductivity Definition: Conductivity is a measure of the ability of an aqueous solution to carry an electric current. It may be used to estimate salinity, total dissolved solids (TDS), and chlorides. Salinity is the amount of dissolved salts in a given amount of solution. TDS, although not precisely equivalent to salinity, is closely related, and for most purposes can be considered synonymous. EPA has not established ambient water-quality criteria for salinity; for drinking water, maximum contaminant levels are 250 mg/L for chlorides, and 500 mg/L for dissolved solids (EPA, 1995). Measurement: Conductivity is measured as resistance and is reported in micromhos per centimeter (μmhos/cm), which is equivalent to microsiemens per centimeter (μS/cm). To estimate TDS and salinity, multiply conductivity by 0.64 and express the result in parts per million. For marine waters, salinity is usually expressed in parts per thousand. To estimate chlorides, multiply conductivity by 0.21 and express the result in parts per million. Departures from these estimates can occur when elevated conductivity is a result of natural conditions, such as in situations of high alkalinity (bicarbonates), or sulfates. Effects on macroinvertebrates: Bioassays on test animals found the toxicity threshold for Daphnia magna to be 6-10 parts per thousand salinity (6,000-10,000 mg/L) (Ingersoll et al., 1992). Levels of concern for this species were set at 0.3-6 parts per thousand salinity (300-6,000 mg/L) (U.S. Dept. of Interior, 1998). Stream Biomonitoring findings: Of 22 New York State streams sampled with specific conductance levels exceeding 800 μmhos/cm, 9% were assessed as severely impacted, 50% were assessed as moderately impacted, 32% were assessed as slightly impacted, and 9% were assessed as non-impacted. Many of the benthic communities in the impacted streams were dominated by oligochaetes, midges, and crustaceans (scuds and sowbugs). Thirty-five percent of the streams were considered to derive their high conductance primarily from natural sources, while the remainder were the result of contributions from point and nonpoint anthropogenic (human caused) sources. For nearly all streams with high conductivity, other contaminants are contained in the water column, making it difficult to isolate effects of high conductance. Recommendations: Conductivity may be best used as an indicator of elevated amounts of anthropogenic-source contaminants. Based on findings that the median impact at sites with specific conductance levels exceeding 800 μmhos/cm is moderate impact, 800 μmhos/cm is designated as a level of concern with expected biological impairments. Eight-hundred umhos/cm corresponds to ~170 mg/L chlorides, ~510 parts per million Total Dissolved Solids, and ~0.51 parts per thousand salinity. US Dept. of Interior. 1998. Guidelines for interpretation of the biological effects of selected
constituents in biota, water, and sediment. National Irrigation Water Quality Program Information Report No. 3.
Ingersoll, C.G., F.J. Dwyer, S.A. Burch, M.K. Nelson, D.R. Buckler, and J.B. Hunn. 1992. The
use of freshwater and saltwater animals to distinguish between the toxic effects of salinity and contaminants in irrigation drain water. Environmental Toxicology and Chemistry, 11:503-511.
U.S. EPA. 995. Drinking water regulations and health advisories. U.S. Environmental Protection
Agency, Office of Water, Washington, D.C., 11 pages.
From the digital collections of the New York State Library.
71
Appendix XIII. Methods for Collecting Biological Samples and Assessing Water Quality Using Net Jabs in Slow, Sandy Streams A. Rationale: The use of the standardized net jab method provides a biological assessment technique that lends itself to rapid assessments of stream water quality in slow, sandy streams where kick sampling does not apply due to a lack of riffle habitat. B. Site Selection: Sampling sites are selected based on these criteria: (1) The sampling location should be a slow moving stream or river where water levels are typically too deep to wade across, typically more than 1 meter, and a substrate of fine particles, typically sand, silt and clay or some combination. Current speed is usually less than 0.4 meter per second. (2) The site should have comparable current speed, substrate type, embeddedness, and canopy cover to both upstream and downstream sites to the degree possible. (3) Sites are chosen to have a safe and convenient access. C. Sampling: Macroinvertebrates are sampled using the standardized net jab method. An aquatic net is used to jab at the stream bottom disturbing only the top 1 – 2 inches of substrate. As the stream bottom is disturbed, the net is withdrawn into the water column and swept through the disturbed debris so dislodged organisms are carried into the net. This technique is continued for a period of 5 minutes over a 5-meter transect of stream. The contents of the net are emptied into a pan of stream water. The contents are then examined, and the major groups of organisms are recorded, usually on the ordinal level (e.g., stoneflies, mayflies, caddisflies). Larger rocks, sticks, and plants may be removed from the sample if organisms are first removed from them. The contents of the pan are poured into a U.S. No. 30 sieve and transferred to a quart jar. The sample is then preserved by adding 95% ethyl alcohol. D. Sample Sorting and Subsampling: In the laboratory, the sample is rinsed with tap water in a U.S. No. 40 standard sieve to remove any fine particles left in the residues from field sieving. The sample is transferred to an enamel pan and distributed homogeneously over the bottom of the pan. A small amount of the sample is randomly removed with a spatula, rinsed with water, and placed in a petri dish. This portion is examined under a dissecting stereomicroscope and 100 organisms are randomly removed from the debris. As they are removed, they are sorted into major groups, placed in vials containing 70 % alcohol, and counted. The total number of organisms in the sample is estimated by weighing the residue from the picked subsample and determining its proportion of the total sample weight. E. Organism Identification: All organisms are identified to the species level whenever possible. Chironomids and oligochaetes are slide-mounted and viewed through a compound microscope; most other organisms are identified as whole specimens using a dissecting stereomicroscope. The number of individuals in each species and the total number of individuals in the subsample are recorded on a data sheet. All organisms from the subsample are archived (either slide-mounted or preserved in alcohol). If the results of the identification process are ambiguous, suspected of being spurious, or do not yield a clear water quality assessment, additional subsampling may be required.
From the digital collections of the New York State Library.
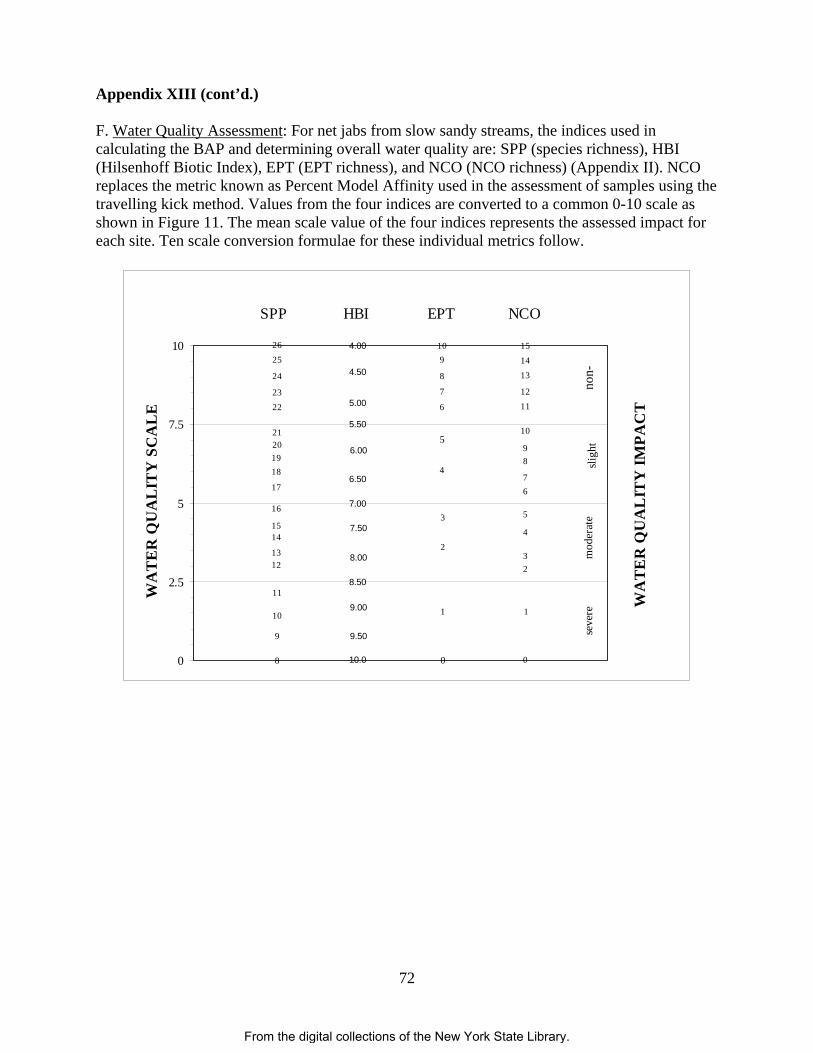
72
Appendix XIII (cont’d.) F. Water Quality Assessment: For net jabs from slow sandy streams, the indices used in calculating the BAP and determining overall water quality are: SPP (species richness), HBI (Hilsenhoff Biotic Index), EPT (EPT richness), and NCO (NCO richness) (Appendix II). NCO replaces the metric known as Percent Model Affinity used in the assessment of samples using the travelling kick method. Values from the four indices are converted to a common 0-10 scale as shown in Figure 11. The mean scale value of the four indices represents the assessed impact for each site. Ten scale conversion formulae for these individual metrics follow.
0
2.5
5
7.5
10
WA
TE
R Q
UA
LIT
Y S
CA
LE
non
-
WA
TE
R Q
UA
LIT
Y IM
PAC
T
sligh
tm
oder
ate
seve
re
1514
13
1211
10
8
6
0
26
23
18
15
13
10
8
109
8
5
7
6
4
3
2
1
0
SPP HBI EPT NCO
9
11
21
4.00
4.50
5.00
5.50
7.00
8.50
9.00
10.0
6.00
6.50
7.50
8.00
9.50
25
24
22
20
16
17
19
14
12
9
7
5
4
32
1
From the digital collections of the New York State Library.