stream and watershed restoration: guidance for restoring ... · stream and watershed restoration:...
TRANSCRIPT

Stream and Watershed Restoration: guidance for restoring riverine
processes and fish habitat
Philip RoniWatershed Sciences Lab
Cramer Fish Sciencesand
School of Aquatic and Fishery SciencesUniversity of Washington
Seattle, WA

River Restoration is a Growth Industry
• How many dollars annually?
• Ecosystem restoration initiatives
– Everglades
– Chesapeake Bay
– Great Lakes
– Puget Sound
– Pacific Coastal Salmon Recovery
– & others

What is Restoration?
Protection
Restoration To return an aquatic system or habitat to its
original, undisturbed state
Rehabilitation
Improvement
Reclamation
Mitigation/Creation
* Also called habitat enhancement
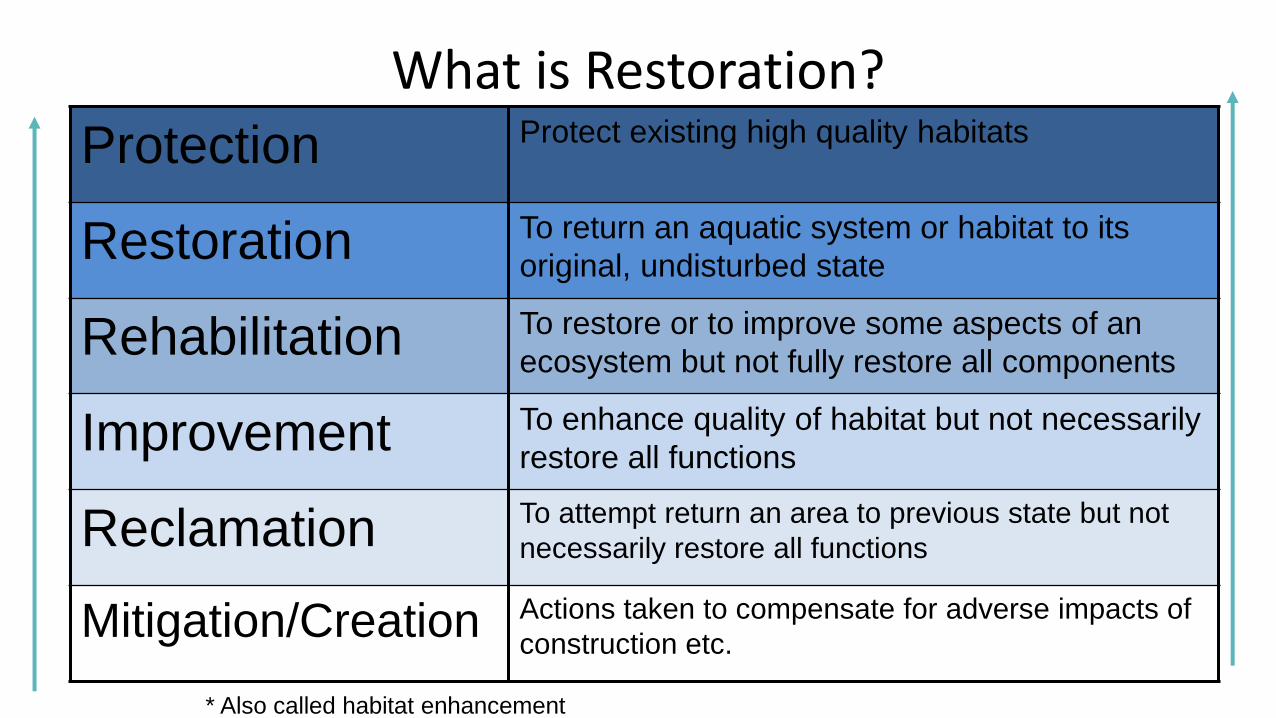
What is Restoration?
Protection Protect existing high quality habitats
Restoration To return an aquatic system or habitat to its
original, undisturbed state
Rehabilitation To restore or to improve some aspects of an
ecosystem but not fully restore all components
Improvement To enhance quality of habitat but not necessarily
restore all functions
Reclamation To attempt return an area to previous state but not
necessarily restore all functions
Mitigation/Creation Actions taken to compensate for adverse impacts of
construction etc.
* Also called habitat enhancement
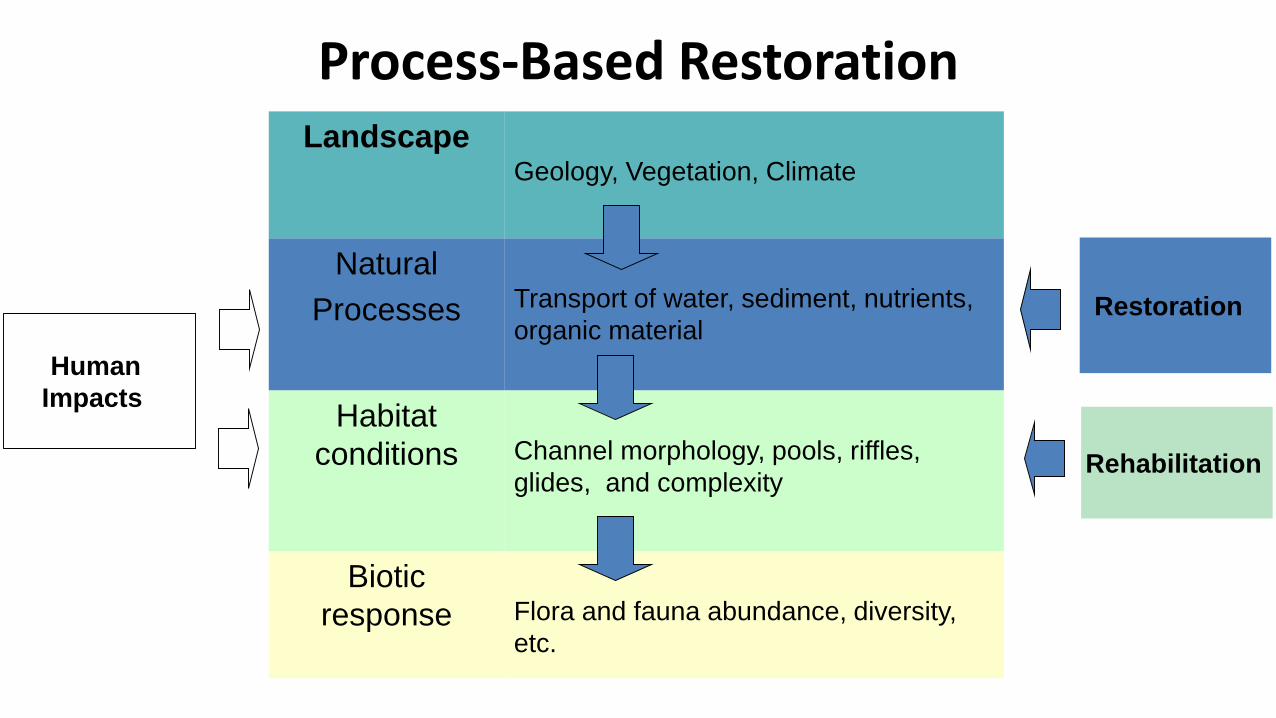
LandscapeGeology, Vegetation, Climate
Natural
Processes Transport of water, sediment, nutrients,
organic material
Habitat
conditions Channel morphology, pools, riffles,
glides, and complexity
Biotic
response Flora and fauna abundance, diversity,
etc.
Restoration
Rehabilitation
Process-Based Restoration
Human
Impacts

Reconnect Isolated Habitats
Mainstems
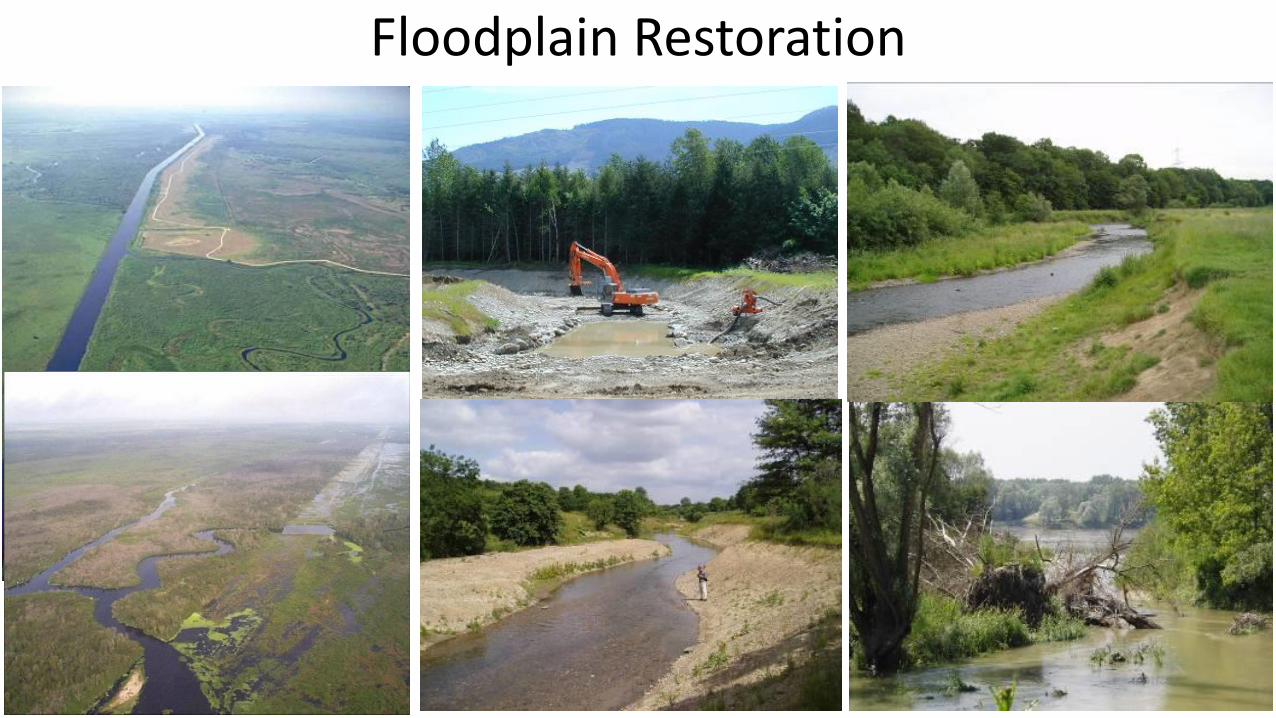
Floodplain Restoration

Roads, Hydrology and Sediment DeliveryUrban Roads Forest Roads

Riparian Restoration Techniques

Instream Habitat Improvement

Not All Projects Are Successful
10 Yrs After
5 Yrs After
1 Year After
Immediately After Restoration Before
7 Years After

Some common problems
• Inadequate habitat assessments
• Ecosystem processes
• Limiting factors
• Design of projects
• Prioritization of projects
• Monitoring and evaluation
• Total amount of restoration
Photo here

Key Steps in Restoration
Roni and Beechie 2013

Goals & Objectives
• For restoration
• For assessment
• For restoration design
• For prioritization
• For monitoring & evaluation
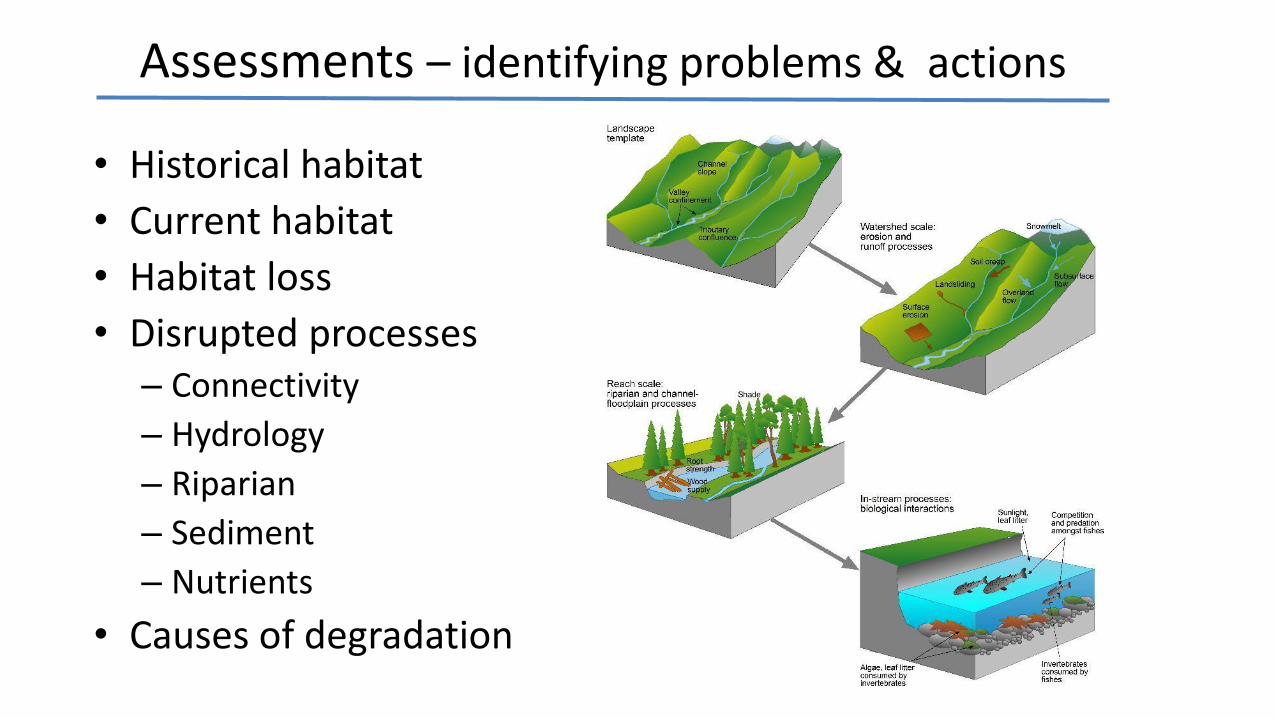
Assessments – identifying problems & actions
• Historical habitat
• Current habitat
• Habitat loss
• Disrupted processes– Connectivity
– Hydrology
– Riparian
– Sediment
– Nutrients
• Causes of degradation
Landscapeprocesses
Habitat conditions
Biota
Humans
Beechie et al. 2003

Assessments – data collection & analysis
• Remote Sensing
• Field Data Collection
• Analysis & Interpretation

Skagit Basin, WA Beechie et al. 2013
Broad Scale - Land Use Impacts & Processes

Grazing/Bank ErosionFine SedimentRiparian Cover
Eden River, UK - Beechie et al. 2013
Reach Scale – local impairments and restoration opportunities

Biological Assessment – IBI Example

Watershed programNorthwest Fisheries Science CenterNational Marine Fisheries Service
Limiting Factors Analysis to Identify Restoration
Photo by John McMillan
Spawning
habitatWinter
rearing
Summer
rearing
Smolt
(juvenile migrants)

What Habitat is Limiting?
0
5,000
10,000
15,000
20,000
25,000
30,000
35,000
40,000
45,000
Spawning Summer rearing Winter rearing
Co
ho
sm
olt
s (j
uve
nile
mig
ran
ts)
Historical Current
G. Pess unpublished

Selecting Restoration Techniques
• Process-based restoration vs. improvement
• Effectiveness of different techniques
• Restoration and Climate change
John McMillan photos
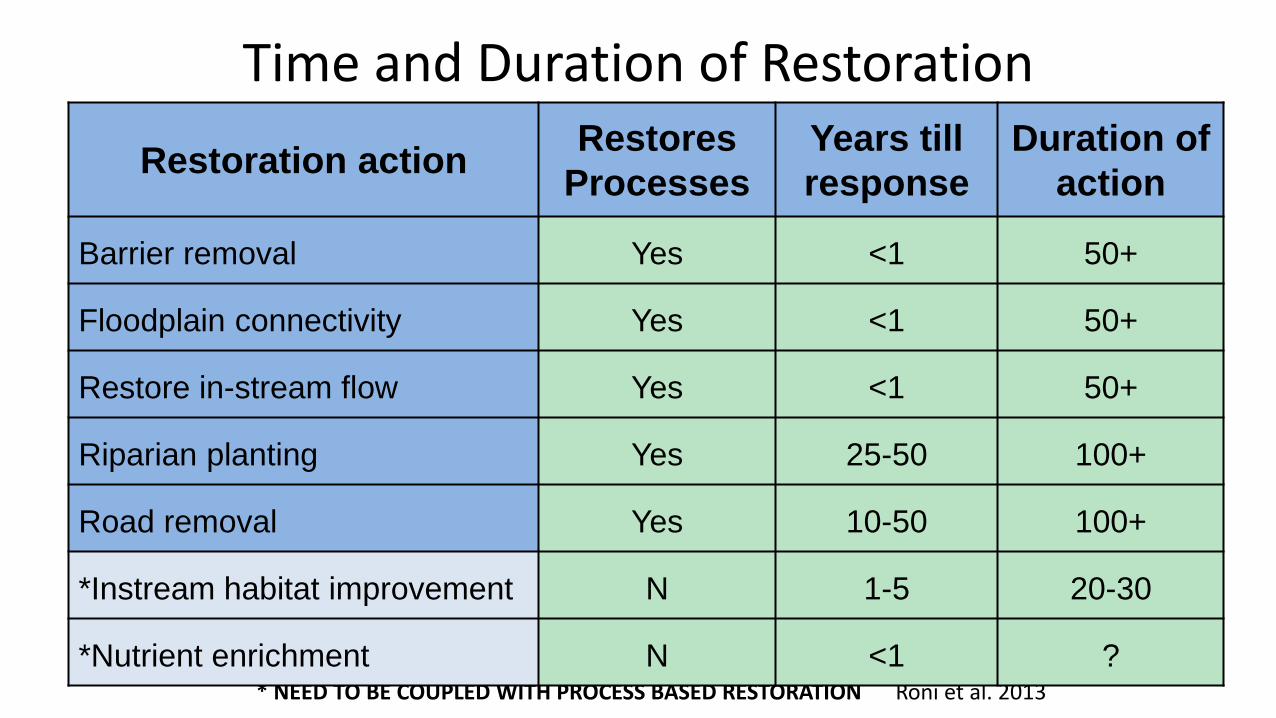
Time and Duration of Restoration
* NEED TO BE COUPLED WITH PROCESS BASED RESTORATION Roni et al. 2013
Restoration actionRestores
Processes
Years till
response
Duration of
action
Barrier removal Yes <1 50+
Floodplain connectivity Yes <1 50+
Restore in-stream flow Yes <1 50+
Riparian planting Yes 25-50 100+
Road removal Yes 10-50 100+
*Instream habitat improvement N 1-5 20-30
*Nutrient enrichment N <1 ?
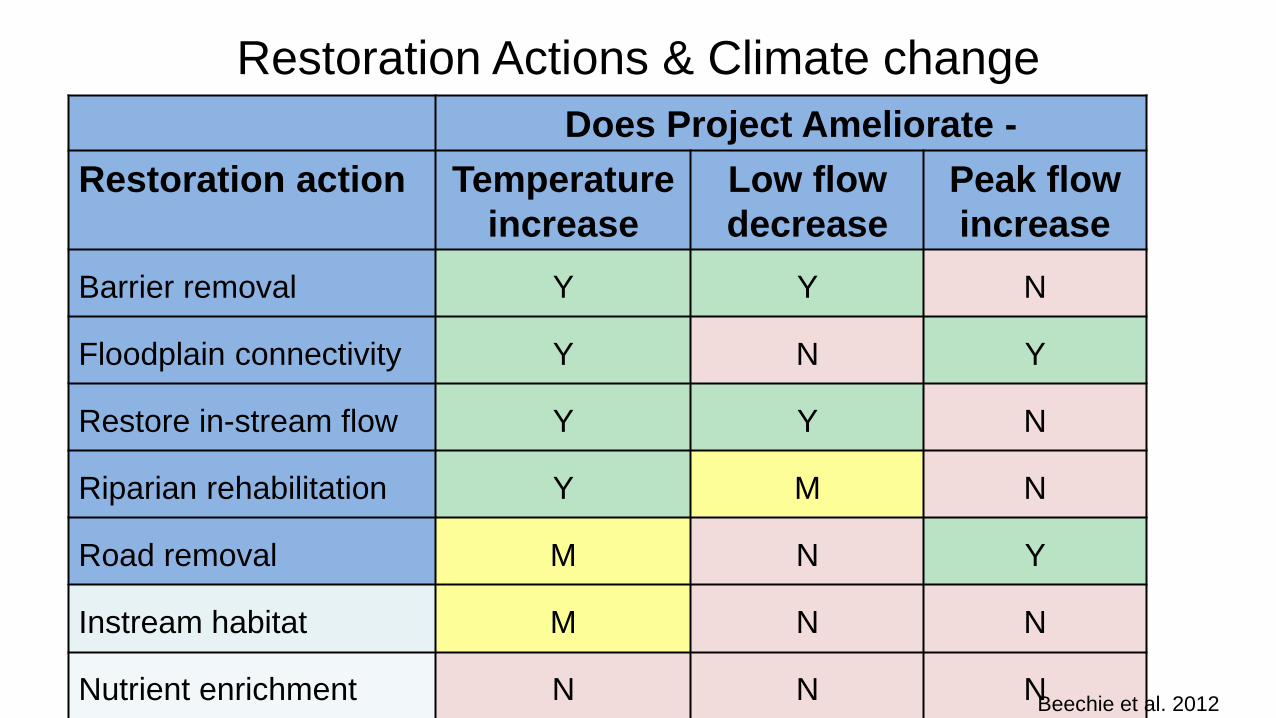
Restoration Actions & Climate change
Does Project Ameliorate -
Restoration action Temperature
increase
Low flow
decrease
Peak flow
increase
Barrier removal Y Y N
Floodplain connectivity Y N Y
Restore in-stream flow Y Y N
Riparian rehabilitation Y M N
Road removal M N Y
Instream habitat M N N
Nutrient enrichment N N NBeechie et al. 2012

Channel incisions
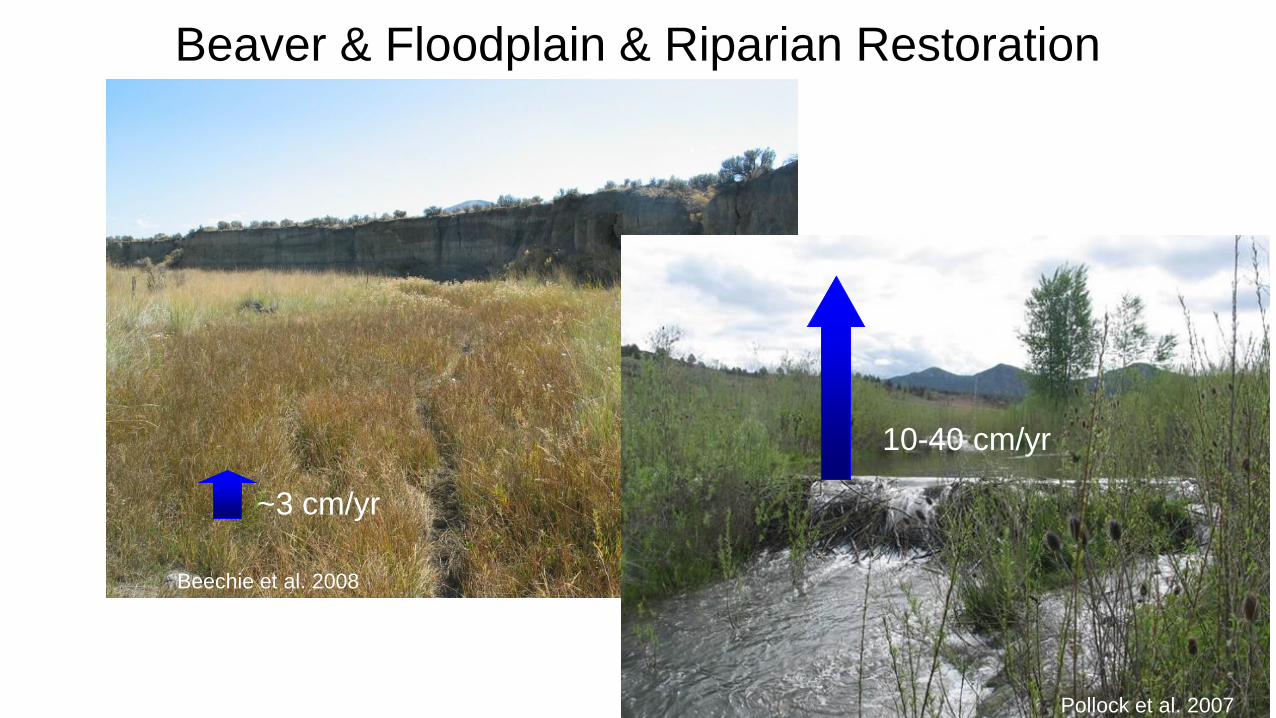
~3 cm/yr
10-40 cm/yr
Pollock et al. 2007
Beechie et al. 2008
Beaver & Floodplain & Riparian Restoration

Prioritization or Sequencing Restoration
• A variety of approaches
– Project type
– Location
– Complex models
– Multi-criteria scoring systems
Roni et al. 2013

Prioritization – Common Approaches
TechniqueLength treated Fish/yr
CostCost/Fish
# Species benefiting
Restores process
Wood placement
2 km 500 $100K $200 2 no
Floodplainreconnection
1 km 5,000 $500K $100 5 yes
Riparian planting
5 km ? $10K ? 4 yes
Road removal
8 km ? $750K ? 4 yes
Roni et al. 2002, Beechie et al. 2008

Prioritization – Scoring System
TechniqueLength treated
Fish/yr
CostCost/Fish
# species
Restoreprocess
Total score
Wood placement
2 4 3 3 2 1 15
Floodplainreconnection
1 5 2 4 5 5 18
Riparian planting
5 2 5 1 4 5 22
Road removal
5 2 1 1 4 5 18
Score of 1 to 5 – five being highest score

Cost-Benefit ExampleProposed Restoration Project Final Score
Reconnect isolated habitat Rkm 57 25
Remove Forest Road 37 22
Plant riparian Deer Creek Rkm 25 21
Wood Placement Clear Beaver Creek 17
Stanwood Levee Setback 17
Replace Impassible Culverts – Boulder River 17
Resurface 10 miles forest Road 37 16
Forest Glen Side Channel Reconnection 15
McDonald’s farm conservation easement 14
Log Jam placement in Clear Fork 14
Wood placement in Urban streams 12
Bioengineering of South Fork Levee 11

Need to Define Scores
Score (1 to 5)
Criterion 1 2 3 4 5Restores
processes
(Based on Roni
et al. 2013b
Restores
neither
processes nor
habitat
Restores physical
habitat
Restores one or
two processes
Restores more
than two
processes
Restores process
and habitat or
protects fully
functioning
habitat
Site access &
logistics
Helicopter only
(no roads or
staging)
No roads within
0.5 km of site,
but staging area if
equipment/
supplies/ LWD
brought in by
helicopter
Roads within 0.5
km of site. No
staging area.
Roads within 0.5
km of site. Good
staging area.
Roads and
staging area
adjacent to site
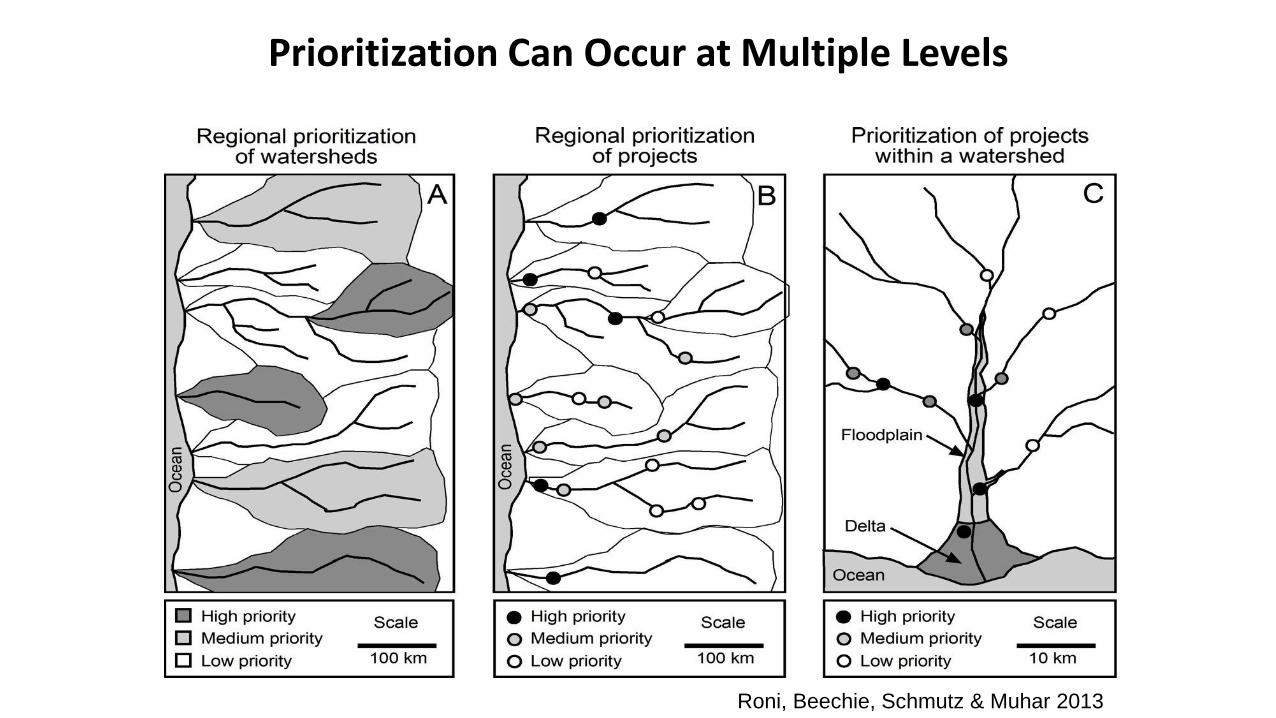
Prioritization Can Occur at Multiple Levels
Roni, Beechie, Schmutz & Muhar 2013
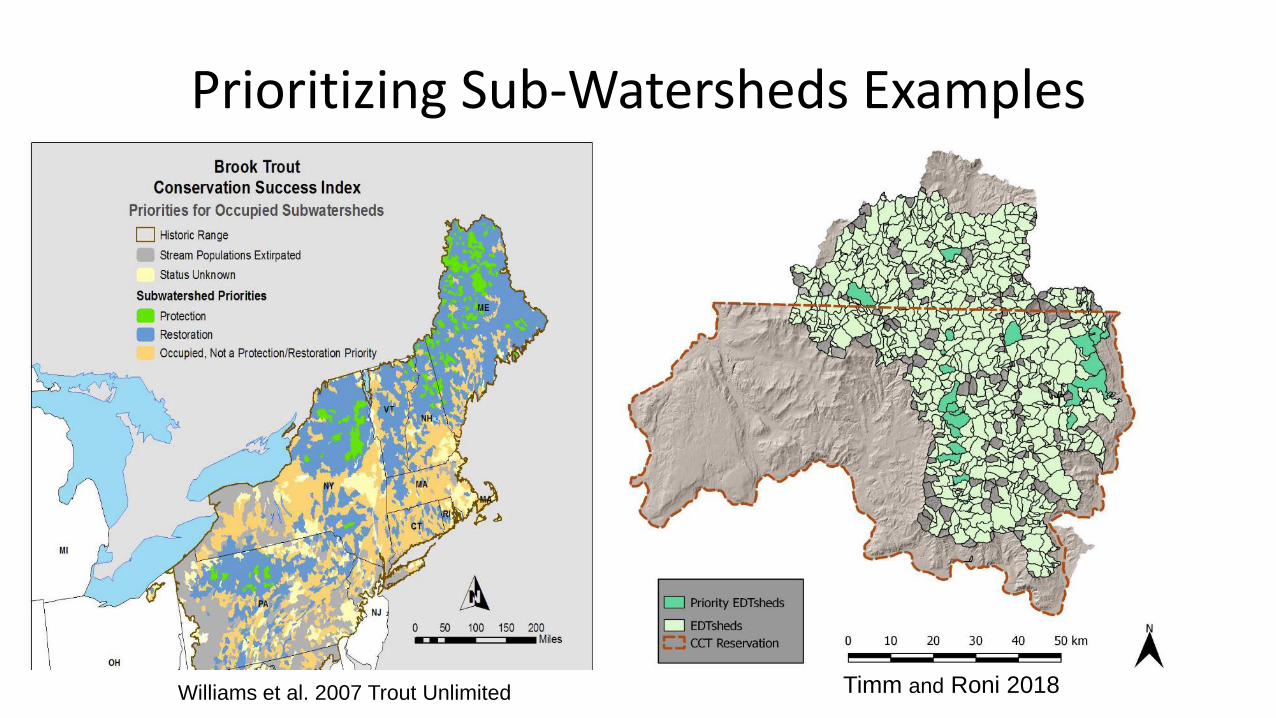
Prioritizing Sub-Watersheds Examples
Williams et al. 2007 Trout Unlimited Timm and Roni 2018

Prioritizing Barrier Removals Across a Basin -the Danube River Basin
Roni, Beechie, Schmutz & Muhar 2013

Restoration Design Steps
• Planning
–Problem Identification
–Context & assessment
–Project goals & objectives
–Alternatives evaluation
• Project design
• Implementation
• Monitoring & Evaluation
36RiverRAT – Design Tool http://www.restorationreview.com

Project Design and Watershed Processes
• Target root causes of degradation
• Tailor actions to local potential
• Match scale of action scale of problem
• Predict restoration outcomes
• Build uncertainty into design
• Design monitoring into project
Cluer et al. 2009, 2013;, Beechie et al. 2013

“Additional evaluation studies on stream
improvement, especially with reference to the effect
on the abundance of fish, are still urgently needed.”
Clarence M. Tarzwell, U.S. Bureau of Fisheries, 1937
Monitoring and Evaluation

Steps for Designing a Effectiveness Monitoring Program
• Define project goals and objectives
• Define scale
• Define questions/hypotheses
• Determine monitoring design
• Spatial and temporal replication
• Select parameters
• Selecting sampling scheme/protocol
• Implement monitoring

Key Questions or HypothesesReach or Project Scale• What is effect of project x on local habitat conditions or fish?
• What is effect of project like x on local habitat conditions or fish?
Watershed Scale• What is effect of project x on watershed conditions or a fish
population?
• What is effect of a suite of projects on watershed conditions or a population?

Key Questions or HypothesesReach or Project Scale
• What is effect of project like x on local habitat conditions or fish?
Watershed Scale
• What is effect of a suite of projects on watershed conditions or a population?

Experimental Designs
Before-After (BA)
Before-After Control-Impact (BACI)
Multiple BACI
Extensive Post-treatment (EPT or CI)
0
0.2
0.4
0.6
0.8
2005 2006 2007 2008 2009 2010 2011 2012
Fish
de
nsi
ty
Year
Treatment
0
0.2
0.4
0.6
0.8
2005 2006 2007 2008 2009 2010 2011 2012
Fish
de
nsi
ty
Year
Control
Treatment
Restoratio
n
Restoratio
n
Control Treatment
0
50
100
150
Poolhabitat
Salmonparr
Trout Salmonredds

What is the average of effect of LWD placement on habitat and fish?
Design Extensive post-treatment
Scale - Reach scale (paired treat. and cont.)
Replication – spatial n = 30
Parameter – fish, habitat, macroinvertebrates
Sampling - census of study reaches
Wood Placement in Streams
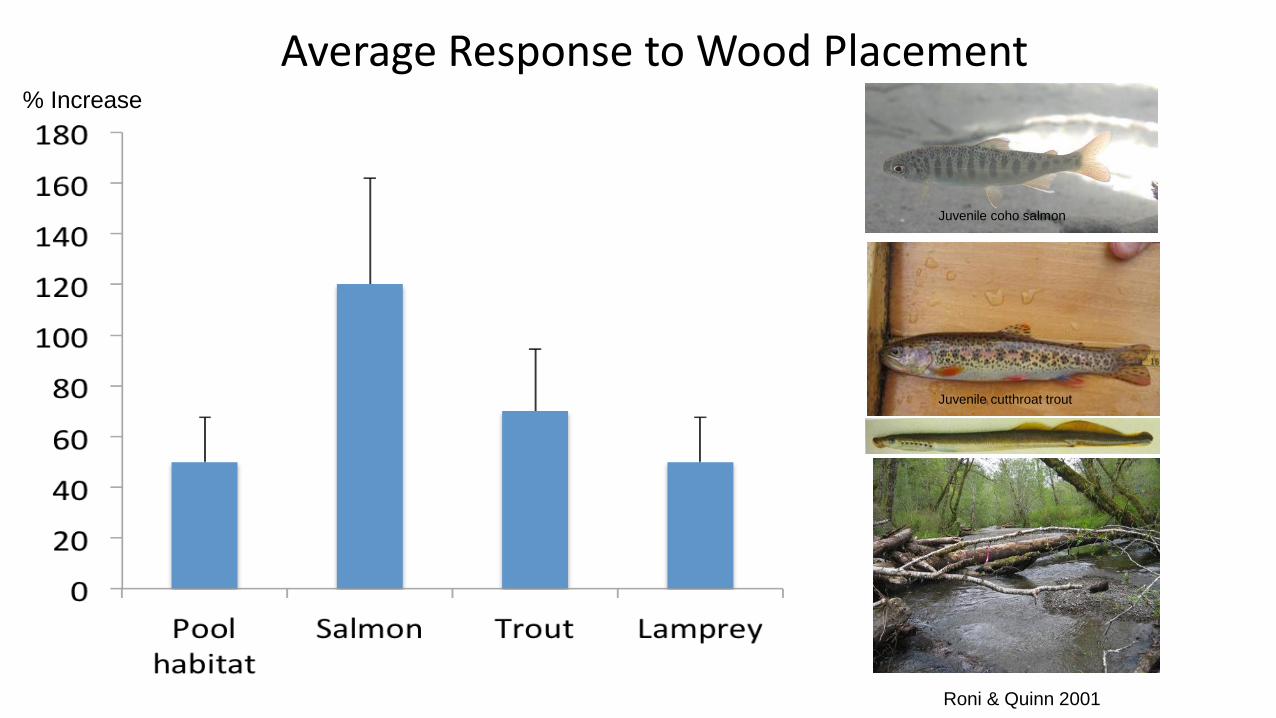
Average Response to Wood Placement
Juvenile coho salmon
Juvenile cutthroat trout
% Increase
Roni & Quinn 2001

Fish Response vs. Restoration Intensity
-0.10
-0.05
0.00
0.05
0.10
0.15
0.20
0.25
-0.25 -0.10 0.05 0.20 0.35 0.50 0.65
r2 = 0.57
Change in pool area
Ch
an
ge
in
la
mp
rey #

Strengths of Monitoring DesignsBefore-after Post-treatment
Strength BA BACI MBACI EPT
Interannual variation X X X
Correlate to physical X X
Broadly applicable results X X
Length of monitoring 10+ 10+ 5+ 1-3
Difficulty of implementation Low Low High Medium

When Selecting Parameters
Linked to key question/hypothesis
Change in measurable way linked to treatment
Have limited/manageable variability
Cost effective in space and time

Restoration Technique HabitatPrimary
productionInverts Fish
Culvert/PassageX X
FloodplainX X X X
RiparianX X X
Sediment reductionX X X ?
In-streamX ? X
NutrientsX X X X
What to monitor for various actions?

• How sites?
• How many years?50 years?
Spatial and Temporal Replication
5 years? 25 years?
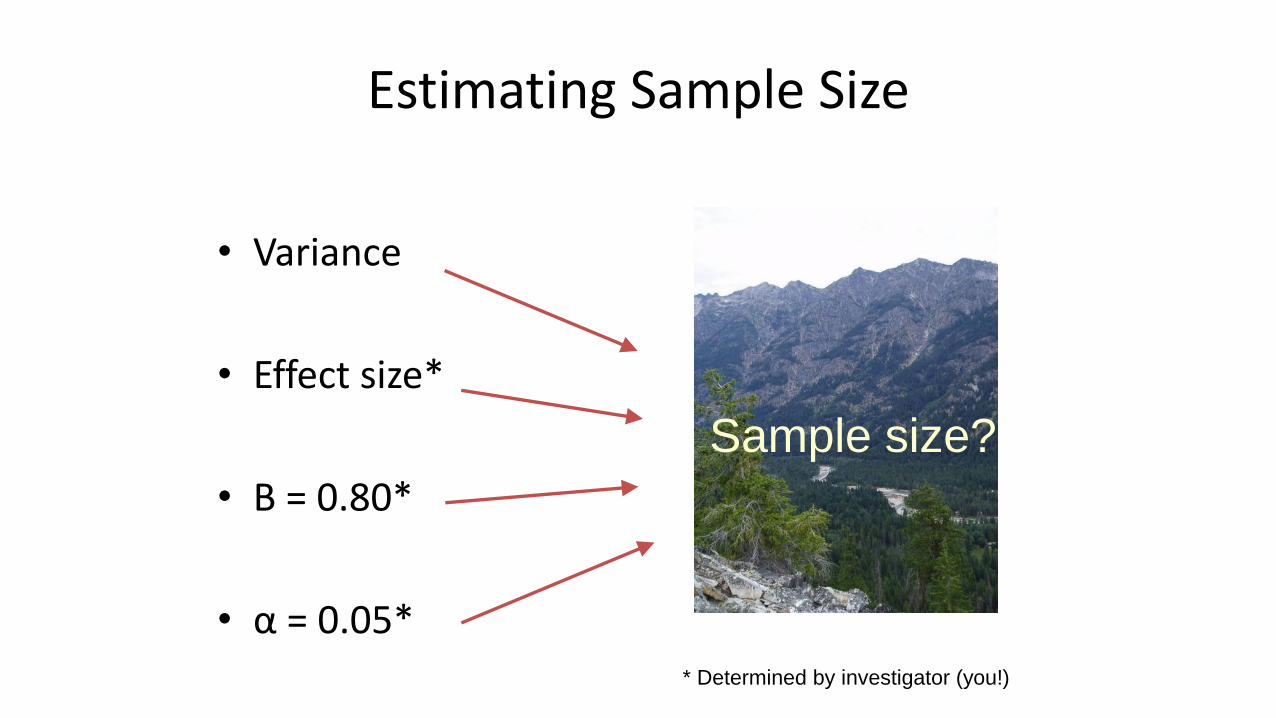
Estimating Sample Size
• Variance
• Effect size*
• B = 0.80*
• α = 0.05*
Sample size?
* Determined by investigator (you!)

What is the average of effect of LWD placement on habitat and fish?
Design Extensive post-treatment
Scale - Reach scale (paired treat. and cont.)
Replication – spatial n = 30
Parameter – fish, habitat, macroinvertebrates
Sampling - census of study reaches
Wood Placement in Streams

Post Treatment Design – Sample Size

Common Sampling Schemes
• Census
• Simple random
• Systematic
• Stratified random
• Line transect
Strata 1
Strata 2

Key Questions or Hypotheses
Reach or Project Scale
• What is effect of project like x on local habitat conditions or fish?• Sample many projects
Watershed Scale
• What is effect of a suite of projects on watershed conditions or a population?• IMW

Watershed Scale vs. Reach Scale
TC
C
C
CT
T
T
T
C
Watershed scale
monitoring location
Restoration site

Watershed-Scale Challenges
• Coordination of restoration, monitoring & other mgt. activities are critical to success!

Watershed-Scale Implementation Challenges?
Design Coordination Implementation Analysis Reporting
Less challenging More challenging
Wate
rshed S
ize

Evaluating a Regional Restoration Program
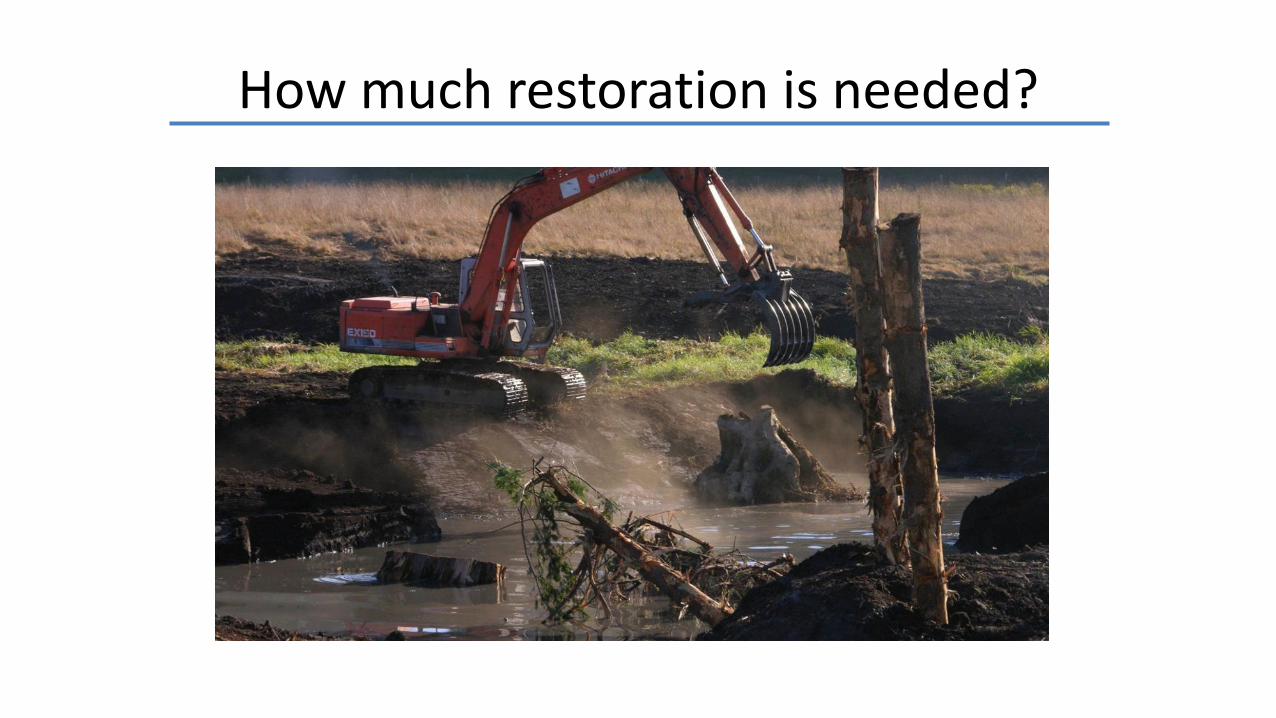
How much restoration is needed?

How Much Restoration Is Needed?Restoration Activities PCSRF 2000 to 2009
Metric or Restoration Activity
AllPCSRF
Per Watershed
Instream kilometers treated 1,413 3
Floodplain hectares treated 4,938 3
Barrier removal (km) 6,918 17

Mean Increase in Smolts
-0.30
-0.10
0.10
0.30
0.50
0.70
0.90
LWD Boulder weirs Logjams Floodplain Groundwater
channels
Barrier
removal
Sm
olt
s p
er
m o
r m
2
Coho
Steelhead
Roni et al. 2010
Mean Increase in Juvenile Migrants (smolts)
Ju
ven
ile m
igra
nts
m o
r m
2

Restoration Actions Applied to Watershed
Salmon Habitat Restoration type
Streams/Rivers
small – inaccessible Barrier removal
small - accessible Wood (LWD) addition
medium Boulder weirs
large Logjams
Floodplain habitat
lost side channels Groundwater channels
lost sloughs Floodplain reconnection

Increase in Juvenile Salmon (smolts)Scenario 1 – Restore All Habitat in a Watershed
95%
prediction
interval
95%
prediction
interval
Mean = 285,302
Roni et al. 2010

Summary of Estimates in Model Watershed
Strategy
CohoSmolts
(juvenile migrants)
Steelhead smolts(juvenile migrants)
Pre-restoration production 230,501 22,386
Scenario 1 – Restore All 285,302 28,001
Scenario 2 - Historic 15,022 1,195
Minimum detectable
difference (25%)** 57,625 5,596
** Need to restore about 20% of watershed to achieve thisRoni et al. 2010

Key Steps in Restoration
Roni and Beechie 2013

Key Points• Several Steps to Restoration Process
• Successful restoration requires following all of them
• Assessment of Watershed Conditions Critical
• Current, historic and habitat loss, causes of degradation
• Project selection
• Processes, duration, longevity & climate change
• Prioritization
• Multi-metric scoring systems most transparent
• Monitoring and evaluation
• Defining questions/hypotheses is critical
• Amount and intensity of restoration are important
