stratified flow phenomena, graphite oxidation, and mitigation strategies of air ingress accident inl...
Post on 20-Dec-2015
228 views
TRANSCRIPT
Stratified Flow Phenomena, Graphite Oxidation, and Mitigation Strategies of Air Ingress Accident
INL / Chang Oh, U.S. PI

Background and MotivationBackground and Motivation
• What happens following What happens following LOCA ?LOCA ? Depressurization Stratified Flow Diffusion Natural Convection
• T/H Safety IssuesT/H Safety Issues Core maximum temperature Potential core collapse
• Technical RequirementsTechnical Requirements Accurate stratified flow
modeling Accurate graphite oxidation
and collapse modeling Accurate power distribution
with neutronics model

ObjectivesObjectives
• To conduct experiments to supply information to model important phenomena in air-ingress accident, and code V&V. Effect of density-driven stratified flow on the air-ingress Oxidation and density variation of the graphite structures Internal pore area density of the graphite structures Effect of burn-off on the structural integrity of the graphite
structures
• To develop a coupled neutronics and thermal-hydraulic capability in the GAMMA code Development of core neutronics model Coupling neutronic-thermal hydraulic tools Coupled core model V&V
• To evaluate various methods for the mitigation of air-ingress

Project OrganizationProject Organization
Schematic diagram of all tasks involved
GAMMACode
Task 1 (INL)
Stratified Flow Analysis(CFD & GAMMA)
Task 2 (INL)
Stratified Flow Experiment
Validation
Stratified Flow Study
Models and Parameters
Task 4 (INL)
Full Air-ingress AnalysisAir-ingress Mitigation Study
Analysis
Task 3 (INL)
Advanced Graphite Oxidation Study
Task 5 (KAIST)
Experiment of Burn-offIn the Bottom Reflector
Task 6 (KAIST)
Structural Test of Burn-off Bottom Reflector
Task 7 (KAIST)
Coupling Neutronic Thermal Hydraulic Tool
Task 8 (KAIST)
Core Neutronic Model
Task 9 (KAIST)
Coupled Core ModelV&V
Advanced Graphite Oxidation Study
Models and Parameters
Core Neutronic Model
Models and Parameters

Stratified Flow in Air-ingress
• Previous air-ingress analyses are all based on the assumption that the main air-ingress is dominated by molecular diffusion.• •Previous analyses were performed using 1-D and a vertical geometry
• A new issue has been raised for the possibility of a convective flow driven by local density gradient.
• After depressurization, there is large density differences between inside(Helium) and outside(Air) of vessel.
• The density driven stratified flow can highly accelerate the whole air-ingress scenarios.
New Assumption on the Air-ingress AnalysisNew Assumption on the Air-ingress Analysis
Diffusion Assumption(40000 sec)
Stratified Flow Assumption(60 sec)

-0.2 0.0 0.2 0.4 0.6 0.8 1.0 1.2 1.4 1.6 1.8 2.0-0.5
0.0
0.5
1.0
1.5
2.0
2.5
3.0
3.5
4.0
Air
Ve
loci
ty (
m/s
)
Pipe Diameter (m)
Density-Gradient Driven Stratified FlowDensity-Gradient Driven Stratified Flow
Air
Helium Hα
Hα)-(1 H
L
AirHelium
centerP
HgHgPHgPP HeairaircenterHecentertop
222
HgHgPHgPP HeairHecenteraircenterbottom
2
)1(
2
)1(
2
)1(
(1) Volumetric flowrates of air and helium are the same.
(2) At the interface, the shear stresses are the same between Air and Helium.
HLf
gu
air
Heair
)1(
5.0
2
Air ingress velocities by density driven flow
He Air He Air He Air
(1) Depressurization (2) Onset-of Flow (3) Density-driven Flow

Density Driven Stratified FlowDensity Driven Stratified Flow
Helium Air
Water and Salted Water Experiment
WaterSalted Water

New Scenario for Air IngressNew Scenario for Air Ingress
HeliumAir Helium Air Helium Air Helium
(a) Depressurization (b) Stratified Flow (c) Diffusion (d) Natural Convection
Several Minute
Several Minute
Several Days

CFD Analysis on the Stratified Flow in VHTRCFD Analysis on the Stratified Flow in VHTR
23.7 m
5.4 m
11.0 m
2.4 m
4.5 m
0.4 m
GT-MHR 600 MWt
6.8m
0.5 m
01.5 m
12.1 m
25.2 m
0.4 m
Mesh (GAMBIT / FLUENT)
51,566 nodes

Porous Media Approach• Core and Plenum were assumed to be porous media.• Porosity and Permeability should be determined.
Porous Zones
imagii vvCvS
2
12
Additional Momentum Source
permeability Inertia resistance
Porous Media ParametersPorous Media Parameters

Porous Media ParametersPorous Media Parameters
Porosity
2
2
43
81
p
d
A
A
V
V
total
fluid
total
fluidcore
Core Hole Pattern(d = 1.58 cm, p = 3.27 cm)
Geometry of Lower Plenum(d = 0.212 m, p = 0.36 m)
2
22
43
81
43
LP
LPLP
total
fluid
total
fluidmlowerplenu
p
dp
A
A
V
V
In the Core
In the Lower Plenum
21.0core
68.0PlenumLower

Porous Media ParametersPorous Media Parameters
Friction Factor in the Circular Channel
Flow Resistance Parameters in the Core• Empirically determined based on the friction correlations• Flow resistance in the radial was assumed to be infinitely large.
In the Core
Re
55015.0 f
D
LuP 2
2
1
Re
55015.0
D
Lu
uDP 2
2
1
)/(
55015.0
22 2
1015.0
2
55u
Du
DL
P
262 1008.955
2mD
12 949.0
015.0 mD
C
1000 10000 100000 1000000 1E70.00
0.01
0.02
0.03
0.04
0.05
0.06
0.07
0.08
0.09
0.10
0.11
0.12
from Moody Chart
Laminar
f
Re
Turbulent

Porous Media ParametersPorous Media Parameters
1000 100000.0
0.2
0.4
0.6
0.8
1.0
1.2
1.4
Kays and London Chilton and Generaux Gunter-Shaw Zukauskas
fric
tion
fact
or
Re
Friction Factor in the Staggered Array
In the Lower Plenum
200769.0 m1
2 0326.0 mC
Re
20042.0 f
2002116.0 m1
2 913.0 mC
For axial direction
For radial direction
Flow Resistance Parameters in the Lower Plenum• Flow resistance in the radial direction was calculated based on the friction data in the staggered array.• Flow resistance in the axial direction was calculated based on the friction data in the circular pipe flow.

Simulation of Stratified FlowSimulation of Stratified Flow
Natural convection started about 160 sec after simulation.
Temperature
Air-Mole Fraction
Initial ConditionsStratified Flow Simulation (by FLUENT 6.3)

Turbulence ModelsTurbulence Models

Air-ingress AnalysisAir-ingress Analysis
Multi-step Approach for Air-ingress Analysis• Stratified flow phase was solved by CFD code (FLUENT).• Depressurization and Diffusion/natural convection phase were solved by GAMMA code.
520
515(9x2)
513(9x3)
604
603
512(9x1)
Block Core514
(9x10)
511
605
701
602
ReactorCavity300
(2x15)
350Vair=49,000 m3
160 110
105
115
130
200205
220
143(12)
141(12)
142(12)
165
210
225231~235
251~255
260 265
125
144(12)
145(12)
120(
7)
215~216
702
FLUENT Simulation GAMMA Simulation
1. Depressurization Analysis
2. Stratified Flow Analysis 3. Natural Convection AnalysisData Transfer
Data Transfer
CFD Code System Code

Air Ingress Analysis - ResultsAir Ingress Analysis - Results
0 100 200 300 400
800
900
1000
1100
1200
1300
1400
1500
1600
Tem
pera
ture
(C
)
Time (hrs)
DDA-1 DDA-2 SFDA-1 SFDA-2
Maximum Temperature Criteria
0 100 200 300 400550
600
650
700
750
800
850
900
950
1000
Tem
pera
ture
(C
)
Time (hrs)
DDA-1 DDA-2 SFDA-1 SFDA-2
0 100 200 300 4000.50
0.55
0.60
0.65
0.70
0.75
0.80
Vo
id F
ract
ion
of G
rap
hite
Str
uct
ure
Time (hrs)
DDA-1 DDA-2 SFDA-1 SFDA-2
Stratified Flow Assumption
Diffusion Assumption
Temperature(Core)
Temperature(Bottom Reflector)
Corrosion(Lower Plenum)
DDA-1Diffusion Dominated Air-IngressIn the Infinite Vault (1X10¹⁰ m3)
DDA-2Diffusion Dominated Air-IngressIn the Finite Vault (25,000 m3)
SFDA-1Stratified Flow Dominated Air-IntressIn the Infinite Vault (1X10¹⁰ m3)
SFDA-2Stratified Flow Dominated Air-IntressIn the finite Vault (25,000 m3)
0
(At the center of the core)
0
(At the center of the core)
0
(At the center of the core)

Experimental Plan - 1Experimental Plan - 1
HeliumPulsed Laser
Source
Pressurized Pressurized
CO2
PP
Vacuum Pump
CCD Camera
CO2 (10.6 atm)
N2 (6 atm)
Annular Pipe
Isothermal Experiment in the Horizontal Circular Pipe (TEST-1)
• Focused on the separate effect of stratified flow phenomena• A simple scaling method used for pipe sizing and test conditions.
1~1.5 m
0.5~1.0 m
1m
Tube diameter = 20 cm

Experimental Plan - 1Experimental Plan - 1
Scaling Analysis of Stratified Flow in a Simple Channel
Countercurrent stratified flow behavior in the VHTR hot duct
2/1,
2/1,
2/3 )()()()()( stdRstdRcRRR dP
C
HCLP
dgu
)(
5.0
RC
RRd
2/1
2/3
)(
)()(
2/1
)(RC
RLP
du
(Turner(1973))
By gas law By Reynolds number similitude
Air-Helium CO2-Helium Ar Helium Diameter ratio ( Rd ) 0.1 0.133 0.1 0.133 0.1 0.133
Viscosity ratio ( R ) 1 1 0.833 0.833 1.26 1.26
Density ratio at std ( R ) 1 1 1.571 1.571 1.43 1.43
Density different ratio at std ( R ) 1 1 1.667 1.667 1.5 1.5
Pressure ratio ( RP ) 31.6 20.5 16.2 10.6 26.6 17.2
Summary of Scaling Results (ratio = scaled down/full-scale)
2/1,
2/1,
2/3 )()()()()( stdRstdRcRRR dP
Experimental Plan - 2Experimental Plan - 2
Water In
Water Out
Pressure
Temperature
Flow Rate
Heater
Insulation(can be detached)
Water Tank
Valve-1
Valve-2Valve-3
Glass Chamber
Buffer Layer
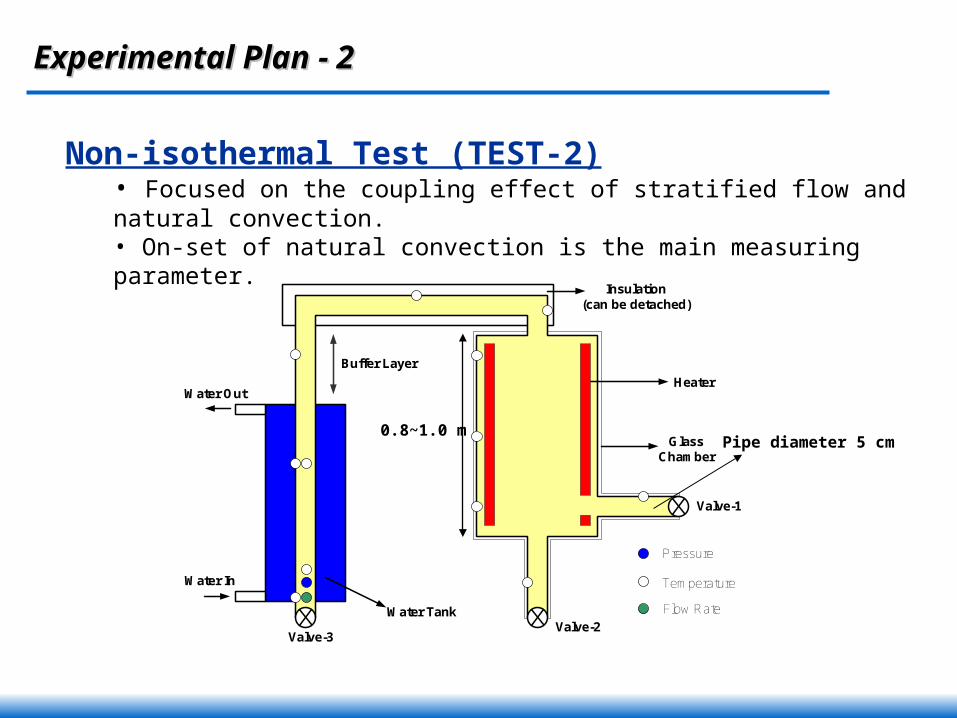
Non-isothermal Test (TEST-2)• Focused on the coupling effect of stratified flow and natural convection.• On-set of natural convection is the main measuring parameter.
0.8~1.0 mPipe diameter 5 cm

Experimental Plan - 2Experimental Plan - 2
10 sec 20 sec 40 sec 80 sec
300 sec 400 sec 410 sec 420 sec
Fluent Simulation for Density Driven Air-ingress Experiment
Onset of natural convection occurred at around 400 sec.
Experimental Plan - 2Experimental Plan - 2
Time (sec)
0 200 400 600 800 1000
Mas
s F
low
(kg
/s)
-0.002
-0.001
0.000
0.001
0.002
0.003
0.004
0.005
0.006
Time (Sec)
0 200 400 600 800 1000
Tem
pera
ture
(K
)
290
300
310
320
330
340
350
Time vs. TemperatureTime vs. Flow-rate
onset of natural convection
onset of natural convection
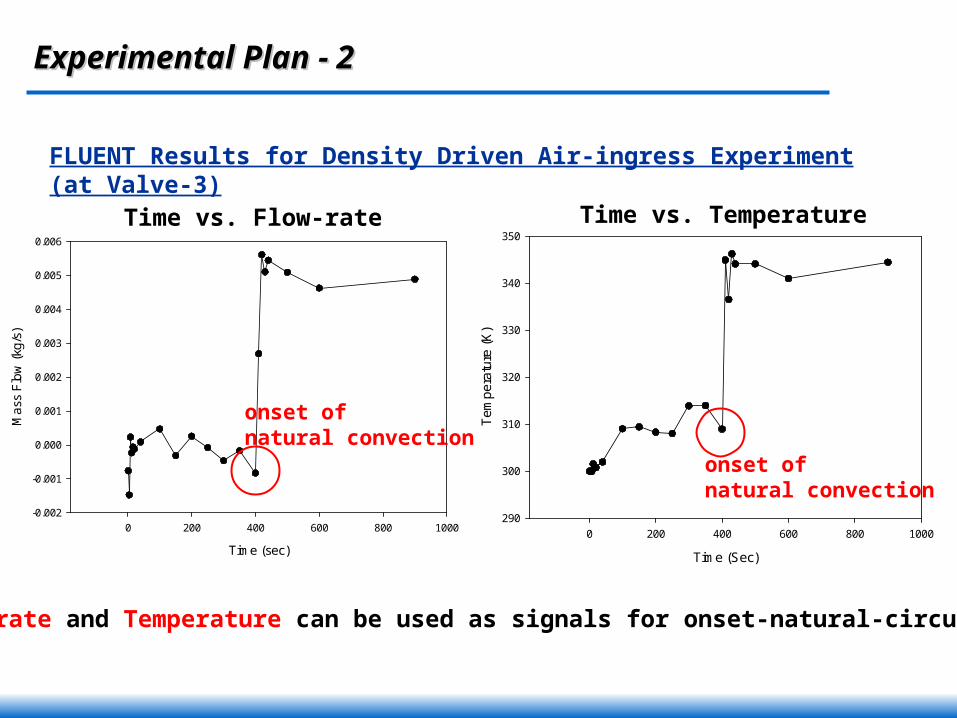
Flow rate and Temperature can be used as signals for onset-natural-circulation.
FLUENT Results for Density Driven Air-ingress Experiment (at Valve-3)

Experimental Plan – 3 and 4Experimental Plan – 3 and 4
Water In
Water Out
Pressure
Temperature
Flow Rate
Heater
Insulation(can be detached)
Water Tank
Valve-1
Valve-2Valve-3
Glass Chamber
Buffer Layer
Metal or Ceramic Pebbles
Water In
Water Out
Pressure
Temperature
Flow Rate
Heater
Insulation(can be detached)
Water Tank
Valve-1
Valve-2Valve-3
Glass Chamber
Buffer Layer
Metal or Ceramic Structure
Non-isothermal Test (TEST-3, TEST-4)• Focused on the coupling effects
Stratified Flow + Natural Convection + Porous Media + Chemical Reaction
• Basic Experimental Procedures are the same as TEST 2
Non-isothermal test with Pebbles Non-isothermal test with Structures
Metal (TEST-3) or Graphite (TEST-4)

Experiment on the Oxidized Graphite Experiment on the Oxidized Graphite FractureFracture
Experimental Set-up• The experiment was performed at 650 oC for uniform oxidation.• The test procedure and set-up is based on ASTM standard test method.• IG-110 and H451 graphite was used for testing.
Cage
Load
GraphiteSample
1 in
1 in
1 in
0.5 in
Sample load and holder

Experiment on the Oxidized Graphite Experiment on the Oxidized Graphite FractureFracture
0 20 40 60 80
0.0
0.2
0.4
0.6
0.8
1.0 Ishihara et al. (2004) This work Correlation (Eto and Growcock (1981)) Correlation (This Work)
Nor
mal
ized
Com
pres
sive
Str
engt
h
Burnoff [%]
IG-110
400
0.400 /17.0/83.0/ SS
5.600 // SS
0 20 40 60 80
0.0
0.2
0.4
0.6
0.8
1.0 Ishihara et al. (2004) This Work Correlation (Eto and Growcock (1981)) Correlation (This Work)
No
rma
lize
d C
om
pre
ssiv
e S
tre
ng
th
Burnoff [%]
H-451
400
5.30 )/(21.0)/(79.0/ oSS
25.600 )/(/ SS
Normal Compressive Stress vs. Burn-off
IG-110 H-451
old data
New dataNew data
old data

Graphite Surface Area DensityGraphite Surface Area Density
Graphite Surface Area Density (Unoxidized Initial Value)• The graphite surface area density was calculated from the BET surface area measured by previous investigations.
Density[g/m3]
Specific Surface Area[m2/g]
Surface Area Density[m2/m3]
NBG-18(Contescu (2008)) 1790 0.21 375.9
NGB-10(Contescu (2008)) 1790 0.29 519.1
PCEA(Contescu (2008)) 1790 0.21 375.9
20-20(Contescu (2008)) 1790 0.46 823.4
IG-11(Eto and Growcock (1981)) 1750 2.8 4900
IG-110(Nakano et al. (1997)) 1780 0.5 890
H451(Pawelko et al. (2001)) 1760 0.75 1320
PGX(Eto and Growcock (1981)) 1730 0.7 1211
Effect of Graphite Burn-off on the Oxidation Effect of Graphite Burn-off on the Oxidation RateRate
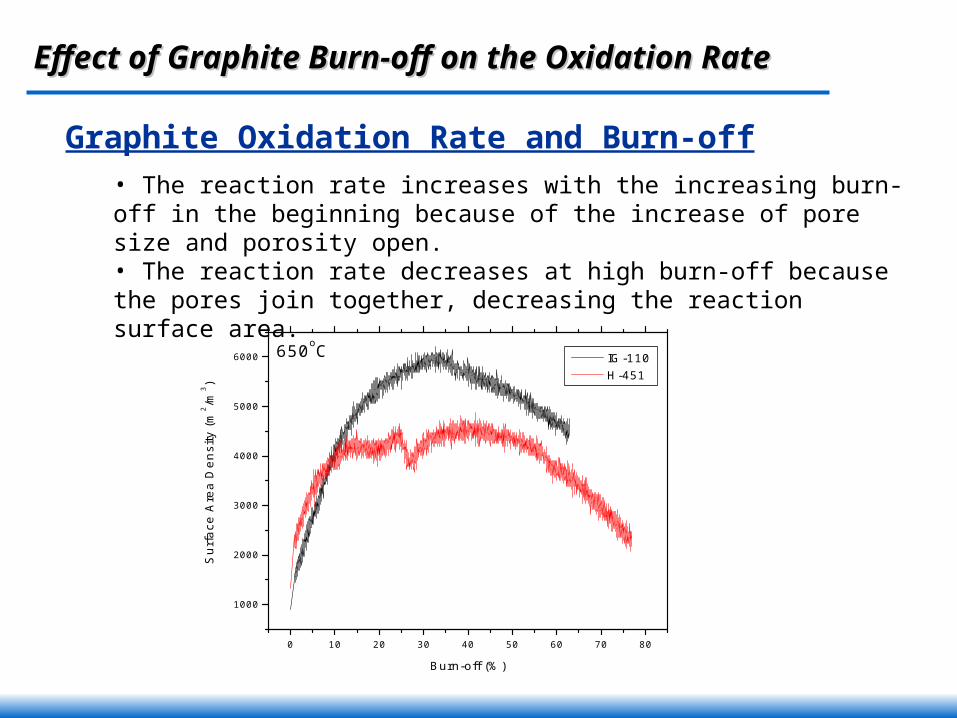
Graphite Oxidation Rate and Burn-off• The reaction rate increases with the increasing burn-off in the beginning because of the increase of pore size and porosity open.• The reaction rate decreases at high burn-off because the pores join together, decreasing the reaction surface area.
0 10 20 30 40 50 60 70 80
1000
2000
3000
4000
5000
6000
650oC
Su
rfa
ce A
rea
De
nsi
ty (
m2 /m
3 )
Burn-off (%)
IG-110 H-451

Modeling of Graphite Oxidation and Modeling of Graphite Oxidation and Fracture Fracture in Air-ingressin Air-ingress
23.7 m
5.4 m
11.0 m
2.4 m
4.5 m
0.4 m
GT-MHR 600 MWt
6.8m
0.5 m
01.5 m
12.1 m
25.2 m
0.4 m
Core Graphite Structure
Reference Reactors (GT-MHR 600 MWt)
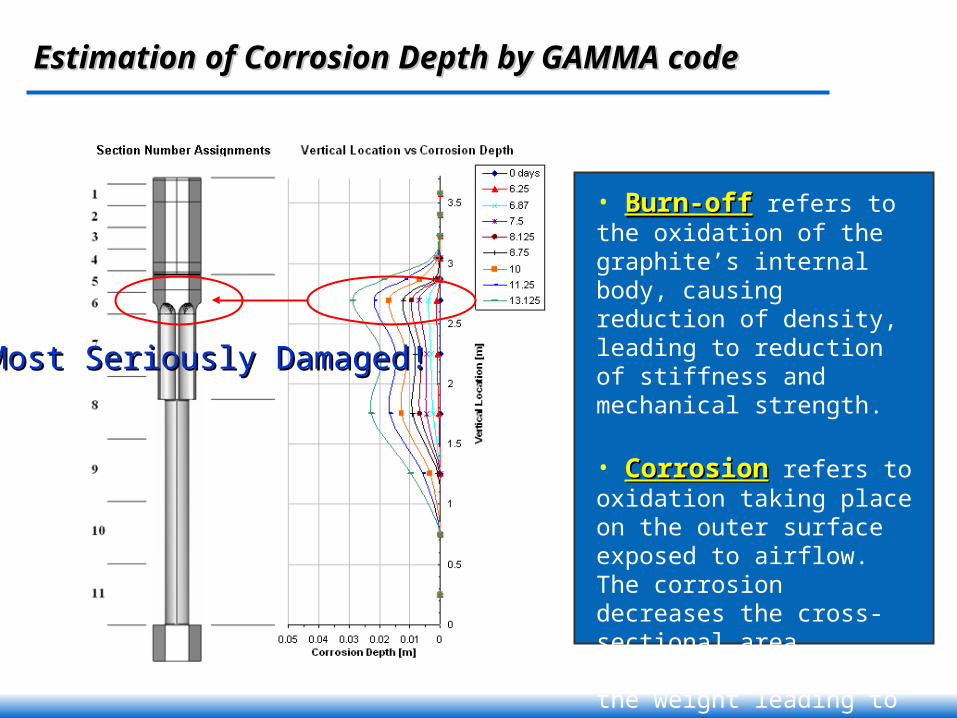
Estimation of Corrosion Depth by GAMMA Estimation of Corrosion Depth by GAMMA codecode
Most Seriously Damaged!Most Seriously Damaged!
• Burn-offBurn-off refers to the oxidation of the graphite’s internal body, causing reduction of density, leading to reduction of stiffness and mechanical strength.
• CorrosionCorrosion refers to oxidation taking place on the outer surface exposed to airflow. The corrosion decreases the cross-sectional area available to support the weight leading to stress concentration.

Detailed Geometry of the Supporting BlockDetailed Geometry of the Supporting Block
20c
c
DL
4j
s
DL
10jD
s
4.1jr
r
7pD
H jV
pV
Coolant channels from core
Lower reflector
blocks
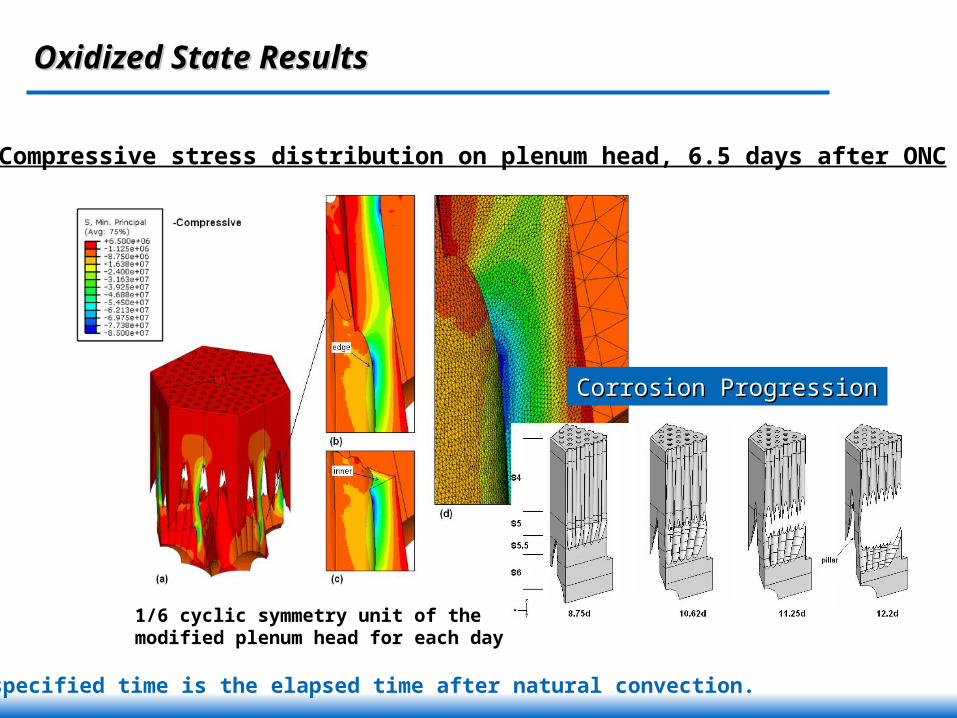
Oxidized State ResultsOxidized State Results
Compressive stress distribution on plenum head, 6.5 days after ONC
Corrosion ProgressionCorrosion Progression
1/6 cyclic symmetry unit of the modified plenum head for each day
* The specified time is the elapsed time after natural convection.

Oxidized State ResultsOxidized State Results
Failure occurs 5.5 to 6 days after the start of natural convection
Maximum Compressive Stress
0
10
20
30
40
50
60
70
80
90
5 6 7 8 9 10 11 12 13Time [days]
Str
ess
[MP
a]
EdgeInsideMinimum Compressive Strength
Maximum Tensile Stress
0
5
10
15
20
25
30
35
40
45
5 6 7 8 9 10 11 12 13Time [days]
Str
ess
[MP
a]
EdgeInsideMinimum Tensile Strength

Task 5 - Experimental facility Task 5 - Experimental facility
F
F
T
COOLER
GasAnalyzer
COCO2O2
2nd Regulator
MFCGas
Injection
Check Valve
Test Section
InfraredThermometer
He
O2
Vent Reservior
InductionHeater
P
TP
TT
Schematics of Experimental Facility
Kinetics
1. Activation energy2. Order of reaction
Experimental facility
1. Design2. Installation
Mass transfer
1. Heat/mass analogy
Other effects
1. Geometry2. Burn-off3. Moisture
Graphite selection
1. IG-1102. IG-4303. NBG-184. NBG-25
Bottom reflector Burn-off model
Task ProgressCompleted activityPlanned activity

Task 5 - Test ConditionTask 5 - Test Condition
Infrared Thermometer
Induction Heater
graphite
7.6 cm2.1 cm
3 cm
Graphite Temperature (Temperature (ooC)C) 540 ~ 800540 ~ 800
Flow rate (SLPM)Flow rate (SLPM) ~ 10 SLPM (0.04 m/s)~ 10 SLPM (0.04 m/s)
Oxygen fraction (%)Oxygen fraction (%) ~ 34 %~ 34 %
Picture of the Test Section

Task 5 – Kinetics (I)Task 5 – Kinetics (I)
IG-110 IG-430Activation energy (kJ/mol) 218 ± 4 158.5 ± 1.5Order of reaction, n 0.75 ± 0.15 0.37 ± 0.04
1.00 1.05 1.10 1.15 1.20 1.25-26.0
-25.5
-25.0
-24.5
-24.0
-23.5
-23.0
-22.5
-22.0
Ea = 158.5kJ/mol
ln(
Rg(k
g/s
) )
1000/T (K-1)
flow rate = 8 SLPMoxygen mole fraction = 5.26%
-5.0 -4.5 -4.0 -3.5 -3.0 -2.5 -2.0 -1.5 -1.0-23.4
-23.3
-23.2
-23.1
-23.0
-22.9
-22.8
-22.7
-22.6 923K, 10 SLPM Linear fit
ln(R
g(k
g/s
))
ln(PO2
(atm))
n = 0.371error = 0.03819
Effect of Temperature on Oxidation Rate Effect of Oxygen Concentration on Oxidation Rate

Task 5 – Kinetics (II)Task 5 – Kinetics (II)
Material Author T ( )℃Oxygen Mole
FractionFlow rate(SLPM)
Ea (kJ/mol) n Method
IG-110
Fuller 450~750 0.2 0.496 201 - TGA
Kawakami 550~650 0.2 - 210 - Gas Analysis
Ogawa 700~1500 0.05~0.19 0.2~4.5 200 - Gas Analysis
KAIST 540~630 0.03~0.32 7~18 218 0.75Gas
Analysis
IG-430
KAERI 608~808 0.2 10 161.5 - TGA
KAIST 540~800 0~0.34 8~10 158.5 0.37Gas
Analysis

Task 6 - Task ProgressTask 6 - Task Progress
Fresh graphite
Structure
1. Support column2. Support block3. Other components
Oxidized graphite
1. Uniform oxidation2. Non-uniform
oxidation
Failure test
Failure ModelDevelopment
Task ProgressCompleted activityPlanned activity
GAMMA
1. Estimation of burn-off Data collection
1. Mechanical test2. Structural analysis

D
Task 6 - Bottom structuresTask 6 - Bottom structures
Components Condition Relative temperature
Support column
A graphite column encounters oxygen first when an air-ingress event occurs
Low (cooling effect)
Support block A support block has a lot of channels. External surface is relatively large.
High (close to core)
Bottom reflector components and condition
Graphite support columns, GT-MHR 600MWth
Schematics of oxidation trend in graphite support columns

Task 6 - Test facility Task 6 - Test facility
Air outletVent
Graphite specimen
Support plate
Thermocouple
Insulating material
Air inletDistributor
Hardened steel plate
Test specimen
Spherical block
Machine cross head
Clear Plastic safety shield
Compression block
Picture of the failure test facility
Picture of the electric furnace

IG-110Φ15mm ×30mm 80.16 ± 1.97MPaΦ25mm ×50mm 78.75 ± 2.48 MPa
Average 79.46 MPa
0 10 20 30 40 500
20
40
60
80
Experimental data Linear fit of data
(M
Pa)
Slenderness ratio (L/r)
,cr buckling straight line
LC
r
91.31 MPastraight line
1.01C
79.46 91.34 1.01
11.76
L
rL
r
Buckling point:
Task 6 – Task 6 – Compressive and buckling strength of Compressive and buckling strength of fresh IG-110 columnfresh IG-110 column
Compressive strength of IG-110
Buckling strength

Task 6 - Task 6 - Compressive and buckling strength of Compressive and buckling strength of oxidized IG-110 columnoxidized IG-110 column
-2 0 2 4 6 8 10 12 14 16 18 20 22 24-4
-2
0
Strength data Linear fit
Ln
(
)
Decrease in bulk density(weight loss), d(%)
0 2 4 6 8 10 12 14 16 18 20 22 24
-2
0
x x x x x
Ln(
0)
Decrese in bulk density(weight loss), d(%)
Normalized compressive strength of oxidized graphite
Normalized compressive and buckling strength of oxidized graphite columns.
0
exp( )
0.111
kd
k
The strength of oxidized graphite column under axial load:

Sample 1 Sample 2 Sample 3
Geometry (Unit: mm)Top: Φ10 × 10Bottom: Φ20 × 10
Top: Φ10 × 20 Bottom: Φ20 × 20
Cylindrical column: Φ15 × 60 Cap: 15.1 × 10 (7 in depth)
Average fracture load (Unit: Kgf)590.1 531.3 1297.3
0 2 4 6 8 10 12 14 16 18 20 22 24 26 28 30
-4
-2
0
Sample 1 Sample 2 Sample 3
Ln(F
/F0)
Decreas in bulk density(weight loss), d(%)
Fracture load changes of oxidized complicated-shape samples
Task 6 - Task 6 - Fracture load changes of Fracture load changes of oxidized complicated-shape samplesoxidized complicated-shape samples
Table of complicated-shape sample test