strategy: european credit
TRANSCRIPT

MechanicsThe strategy provides diversified exposure to North American corporate credit, primarily investment grade. To emphasise credit risk and reduce direct interest rate risk, it takes exposure via two liquid CDS indices rather than corporate bonds:
- 80% iTraxx Europe 5yr (125 investment grade entities, equal weight)
- 20% iTraxx Crossover 5yr (75 sub-investment grade entities, equal weight)
The strategy reflects the return from selling protection on the current series of each CDS index. It takes total market exposure of 300%, allocated in an 80/20 ratio and rebalanced monthly. It assumes a yield of EONIA – 0.35% (subject to change) on cash and is calculated net of transaction costs.
PerformanceStrategy performance is simulated by Markit. Past performance (actual or simulated) is not a reliable indicator of future returns.
Strategy: European Performance Credit
Investor profile
✓ Looking for enhanced yield
✓ Positive view on European corporate credit
✓ Concerned about rising rates
Data: Tabula / Bloomberg, 30 Jun 2018. Volatility is the standard deviation of monthly returns.
Primarily investment grade
Enhances performance by scaling up exposure, rather than lowering credit rating
Minimal interest rate risk
Can be used for long-term exposure or tactical positioning
Jun 13 –Jun 14
Jun 14 –Jun 15
Jun 15 –Jun 16
Jun 16 –Jun 17
Jun 17 –Jun 18
10y return (ann.)
10y volatility
10y Sharpe ratio
Tabula European Performance Credit 23.5% 3.4% 0.0% 12.7% 2.2% 7.8% 10.0% 0.77
BBG Barclays Euro Aggregate Corp Bond 8.2% 3.5% 7.2% -2.0% 1.5% 4.8% 3.5% 1.28
iBoxx Euro Liquid HY 10.7% 1.4% 1.4% 8.0% 0.2% 6.2% 10.5% 0.59
Global financial crisis
Rising rates
20
60
100
140
180
220
2007 2008 2009 2010 2011 2012 2013 2014 2015 2016 2017
Tabula strategy BBG Barclays Euro Aggregate Corp Bond iBoxx EUR HY Index TRI

MechanicsThe strategy provides diversified exposure to North American corporate credit, primarily investment grade. To emphasise credit risk and reduce direct interest rate risk, it takes exposure via two liquid CDS indices rather than corporate bonds:
- 80% CDX North American Investment Grade 5yr (125 investment grade entities, equal weight)
- 20% CDX North America High Yield 5yr (100 sub-investment grade entities, equal weight)
The strategy reflects the return from selling protection on the current series of each CDS index. It takes total market exposure of 300%, allocated in an 80/20 ratio and rebalanced monthly. It assumes a yield of the Fed Funds rate – 0.15% (subject to change) on cash and is calculated net of transaction costs.
PerformanceStrategy performance is simulated by Tabula. Past performance (actual or simulated) is not a reliable indicator of future returns.
Strategy: North American Performance Credit
Investor profile
✓ Looking for enhanced yield
✓ Positive view on North American corporate credit
✓ Concerned about rising rates
Data: Tabula / Bloomberg, 31 Dec 2017. Volatility is the standard deviation of monthly returns.
Primarily investment grade
Enhances performance by scaling up exposure, rather than lowering credit rating
Minimal interest rate risk
Can be used for long-term exposure or tactical positioning
Dec 12 –Dec 13
Dec 13 –Dec 14
Dec 14 –Dec 15
Dec 15 –Dec 16
Dec 16 –Dec 17
10y return (ann.)
10y volatility
10y Sharpe ratio
Tabula North American Performance Credit 17.8% 5.1% 0.4% 11.0% 9.8% 7.1% 11.0% 0.62
iBoxx USD Liquid IG -2.4% 8.7% -0.7% 6.4% 7.3% 6.2% 7.1% 0.83
iBoxx USD Liquid HY 5.9% 2.1% -5.0% 15.3% 6.3% 6.5% 10.7% 0.58
20
60
100
140
180
220
2007 2008 2009 2010 2011 2012 2013 2014 2015 2016 2017
Tabula North American Performance Credit iBoxx USD Liquid IG iBoxx USD Liquid HY
Global financial crisis
Rising rates

MechanicsThe strategy provides diversified exposure to North American and European high yield corporate credit. To emphasise credit risk and reduce direct interest rate risk, it takes exposure via two liquid CDS indices rather than via corporate bonds:
– 50% CDX North America High Yield 5yr (100 sub-investment grade entities, equal weight)
– 50% iTraxx Crossover 5yr (75 sub-investment grade entities, equal weight)
The strategy reflects the return from selling protection on the current series of each CDS index and is rebalanced monthly. I t assumes a yield of the Fed Funds rate – 0.15% (subject to change) on cash and is calculated net of transaction costs.
PerformanceStrategy performance is simulated by Tabula. Past performance (actual or simulated) is not a reliable indicator of future returns.
Strategy: Global High Yield
Investor profile
✓ Looking for enhanced yield
✓ Positive view on sub-investment grade credit
✓ Concerned about rising rates
Dec 12 –Dec 13
Dec 13 –Dec 14
Dec 14 –Dec 15
Dec 15 –Dec 16
Dec 16 –Dec 17
10y return (ann.)
10y volatility
10y Sharpe ratio
Tabula Global HY 16.8% 4.7% 1.8% 7.6% 9.1% 7.0% 8.7% 0.76
iBoxx Euro Liquid HY 7.9% 4.0% -0.3% 8.1% 4.8% 6.0% 10.9% 0.50
iBoxx USD Liquid HY 5.9% 2.1% -5.0% 15.3% 6.3% 6.5% 10.7% 0.58
Data: Tabula / Bloomberg, 31 Dec 2017. Performance of Tabula Global HY and iBoxx US Liquid HY in USD, iBoxx Euro Liquid HY is in EUR. Volatility is the standard deviation of monthly returns.
Diversified exposure across North America and Europe
Uses CDS indices rather the corporate bonds, to enhance liquidity and minimise interest rate risk
Strong risk-adjusted return vs HY benchmarks
Can be used to replace long-term HY bond allocations or for tactical positioning
20
60
100
140
180
220
2007 2008 2009 2010 2011 2012 2013 2014 2015 2016 2017
Tabula Global HY iBoxx Euro Liquid HY iBoxx USD Liquid HY
Global financial crisis
US yield curve flattening
US yield curve
steepening
MechanicsThe strategy provides diversified exposure to North American and European high yield corporate credit. To emphasise credit risk and reduce direct interest rate risk, it takes exposure via two liquid CDS indices rather than via corporate bonds:
– 50% CDX North America High Yield 5yr (100 sub-investment grade entities, equal weight)
– 50% iTraxx Crossover 5yr (75 sub-investment grade entities, equal weight)
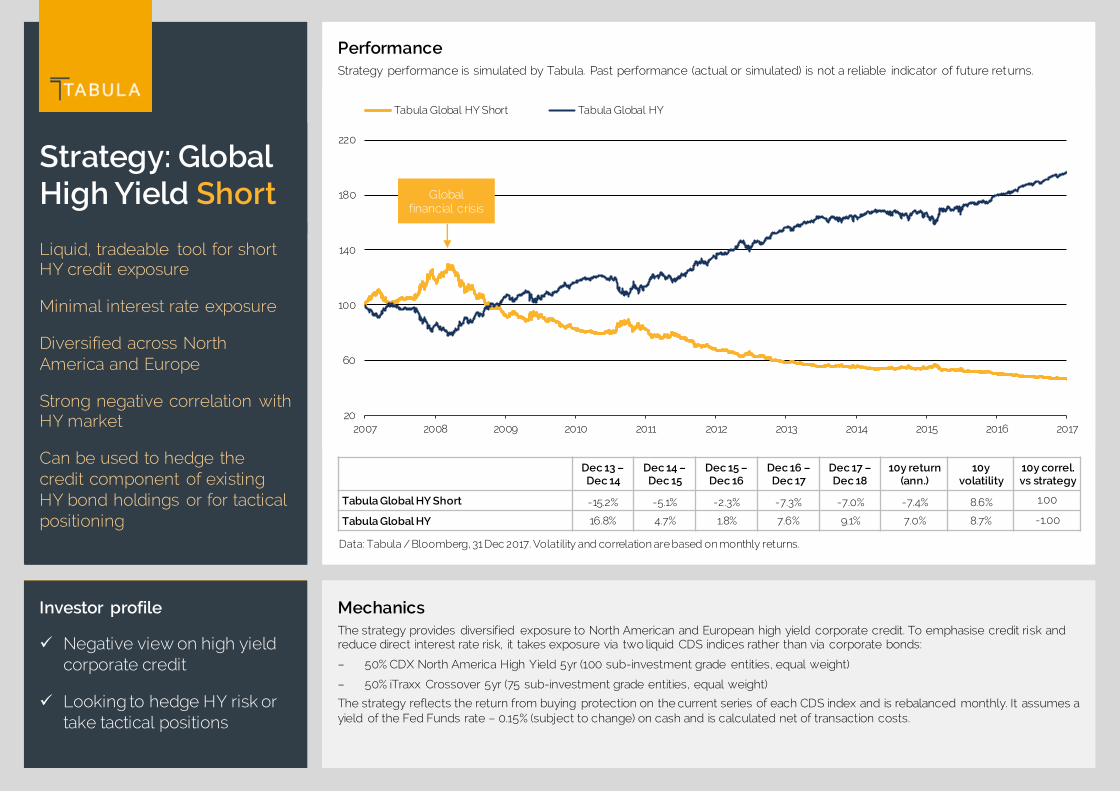
The strategy reflects the return from buying protection on the current series of each CDS index and is rebalanced monthly. It assumes a yield of the Fed Funds rate – 0.15% (subject to change) on cash and is calculated net of transaction costs.
PerformanceStrategy performance is simulated by Tabula. Past performance (actual or simulated) is not a reliable indicator of future returns.
Strategy: Global High Yield Short
Investor profile
✓ Negative view on high yield corporate credit
✓ Looking to hedge HY risk or take tactical positions
Dec 13 –Dec 14
Dec 14 –Dec 15
Dec 15 –Dec 16
Dec 16 –Dec 17
Dec 17 –Dec 18
10y return (ann.)
10y volatility
10y correl. vs strategy
Tabula Global HY Short -15.2% -5.1% -2.3% -7.3% -7.0% -7.4% 8.6% 1.00
Tabula Global HY 16.8% 4.7% 1.8% 7.6% 9.1% 7.0% 8.7% -1.00
Data: Tabula / Bloomberg, 31 Dec 2017. Volatility and correlation are based on monthly returns.
Liquid, tradeable tool for short HY credit exposure
Minimal interest rate exposure
Diversified across North America and Europe
Strong negative correlation with HY market
Can be used to hedge the credit component of existing HY bond holdings or for tactical positioning
20
60
100
140
180
220
2007 2008 2009 2010 2011 2012 2013 2014 2015 2016 2017
Tabula Global HY Short Tabula Global HY
Global financial crisis

MechanicsThe strategy provides diversified exposure to North American high yield corporate credit. To emphasise credit risk and reduce direct interest rate risk, it takes exposure via a liquid and well-established CDS index rather than via corporate bonds:
– CDX North America High Yield 5yr (100 sub-investment grade entities, equal weight)
The strategy reflects the return from selling protection on the current series of the CDS index. It takes 100% market exposure, rebalanced monthly. It assumes a yield of the Fed Funds rate – 0.15% (subject to change) on cash and is calculated net of transaction costs.
PerformanceStrategy performance is simulated by Tabula. Past performance (actual or simulated) is not a reliable indicator of future returns.
Strategy: North American High Yield
Investor profile
✓ Looking for enhanced yield
✓ Positive view on North American HY corporate credit
✓ Concerned about rising rates
Dec 12 –Dec 13
Dec 13 –Dec 14
Dec 14 –Dec 15
Dec 15 –Dec 16
Dec 16 –Dec 17
10y return (ann.)
10y volatility
10y Sharpe ratio
Tabula North American HY 15.8% 3.2% 1.1% 11.2% 7.7% 6.8% 9.9% 0.65
iBoxx USD Liquid HY 5.9% 2.1% -5.0% 15.3% 6.3% 6.5% 10.7% 0.58
Data: Tabula / Bloomberg, 31 Dec 2017. Volatility is the standard deviation of monthly returns.
Uses CDS indices rather the corporate bonds, to enhance liquidity and minimise interest rate risk
Strong risk-adjusted return vs HY benchmark index
Can be used to replace long-term HY bond allocations or for tactical positioning
20
60
100
140
180
220
2007 2008 2009 2010 2011 2012 2013 2014 2015 2016 2017
Tabula North American HY iBoxx USD Liquid HY
Global financial crisis
US yield curve flattening
US yield curve
steepening

MechanicsThe strategy provides diversified exposure to North American high yield corporate credit. To emphasise credit risk and reduce direct interest rate risk, it takes exposure via a liquid and well-established CDS index rather than via corporate bonds:
– CDX North America High Yield 5yr (100 sub-investment grade entities, equal weight)
The strategy reflects the return from buying protection on the current series of the CDS index. It takes 100% market exposure, rebalanced monthly. It assumes a yield of the Fed Funds rate – 0.15% (subject to change) on cash and is calculated net of transaction costs.
PerformanceStrategy performance is simulated by Tabula. Past performance (actual or simulated) is not a reliable indicator of future returns.
Strategy: North American High Yield Short
Investor profile
✓ Negative view on North American HY corporate credit
✓ Looking to hedge HY risk or take tactical positions
Dec 12 –Dec 13
Dec 13 –Dec 14
Dec 14 –Dec 15
Dec 15 –Dec 16
Dec 16 –Dec 17
10y return (ann.)
10y volatility
10y correl. vs strategy
Tabula North American HY Short -14.4% -3.5% -1.5% -10.2% -5.7% -7.0% 9.9% 1.00
Tabula North American HY 15.8% 3.2% 1.1% 11.2% 7.7% 6.8% 9.9% -1.00
iBoxx USD Liquid HY 5.9% 2.1% -5.0% 15.3% 6.3% 6.5% 10.7% -0.76
Data: Tabula / Bloomberg, 31 Dec 2017. Volatility and correlation are based on monthly returns.
Liquid, tradeable tool for short HY credit exposure
Strong negative correlation with North American HY market
Minimal interest rate exposure
Can be used to hedge the credit component of existing HY bond holdings or for tactical positioning
20
60
100
140
180
220
2007 2008 2009 2010 2011 2012 2013 2014 2015 2016 2017
Tabula North American HY Short Tabula North American HY iBoxx USD Liquid HY
Global financial crisis

MechanicsThe strategy provides diversified exposure to European high yield corporate credit. To emphasise credit risk and reduce direc t interest rate risk, it takes exposure via a liquid and well-established CDS index rather than via corporate bonds:
– iTraxx Crossover 5yr (75 sub-investment grade entities, equal weight)
The strategy reflects the return from selling protection on the current series of the CDS index. It takes 100% market exposure, rebalanced monthly. It assumes a yield of EONIA – 0.35% (subject to change) on cash and is calculated net of transaction costs.
PerformanceStrategy performance is simulated by Tabula. Past performance (actual or simulated) is not a reliable indicator of future returns.
Strategy: European High Yield
Investor profile
✓ Looking for enhanced yield
✓ Positive view on European high yield corporate credit
✓ Concerned about rising rates
Dec 12 –Dec 13
Dec 13 –Dec 14
Dec 14 –Dec 15
Dec 15 –Dec 16
Dec 16 –Dec 17
10y return (ann.)
10y volatility
10y Sharpe ratio
Tabula European HY 17.6% 7.8% 3.3% 3.5% 7.5% 7.4% 8.5% 0.80
iBoxx Euro Liquid HY Index 7.9% 4.0% -0.3% 8.1% 4.8% 6.0% 10.9% 0.50
Data: Tabula / Bloomberg, 31 Dec 2017. Volatility is the standard deviation of monthly returns.
Uses CDS indices rather the corporate bonds, to enhance liquidity and minimise interest rate risk
Stronger performance than HY benchmark, with lower volatility
Can be used to replace long-term HY bond allocations or for tactical HY positioning
20
60
100
140
180
220
2007 2008 2009 2010 2011 2012 2013 2014 2015 2016 2017
Tabula European HY iBoxx Euro Liquid HY
Global financial crisis
Spread tightening

MechanicsThe strategy provides diversified exposure to European high yield corporate credit. To emphasise credit risk and reduce direc t interest rate risk, it takes exposure via a liquid and well-established CDS index rather than via corporate bonds:
– iTraxx Crossover 5yr (75 sub-investment grade entities, equal weight)
The strategy reflects the return from buying protection on the current series of the CDS index. It takes 100% market exposure, rebalanced monthly. It assumes a yield of EONIA – 0.35% (subject to change) on cash and is calculated net of transaction costs.
PerformanceStrategy performance is simulated by Tabula. Past performance (actual or simulated) is not a reliable indicator of future returns.
Strategy: European High Yield Short
Investor profile
✓ Negative view on European HY corporate credit
✓ Looking to hedge HY risk or take tactical position
Dec 12 –Dec 13
Dec 13 –Dec 14
Dec 14 –Dec 15
Dec 15 –Dec 16
Dec 16 –Dec 17
10y return (ann.)
10y volatility
10y correl. v. strategy
Tabula European HY Short -15.9% -8.0% -4.5% -5.4% -8.5% -7.4% 8.5% 1.00
Tabula European HY 17.6% 7.8% 3.3% 3.5% 7.5% 7.4% 8.5% -1.00
iBoxx Euro Liquid HY Index 7.9% 4.0% -0.3% 8.1% 4.8% 6.0% 10.9% -0.77
Data: Tabula / Bloomberg, 31 Dec 2017. Volatility and correlations are based on monthly returns.
Liquid, tradeable tool for short HY credit exposure
Strong negative correlation with European HY market
Minimal interest rate exposure
Can be used to hedge the credit component of existing HY bond holdings or for tactical positioning
20
60
100
140
180
220
2007 2008 2009 2010 2011 2012 2013 2014 2015 2016 2017
Tabula European HY Short Tabula European HY iBoxx Euro Liquid HY
Global financial crisis
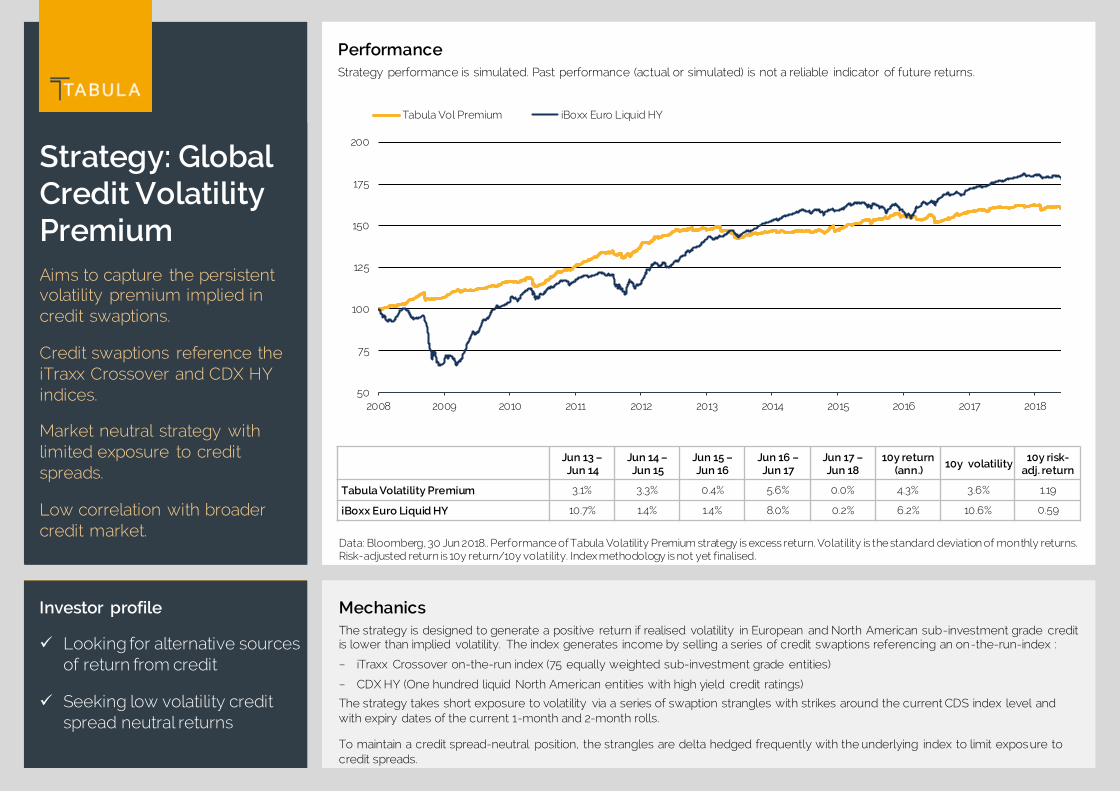
PerformanceStrategy performance is simulated. Past performance (actual or simulated) is not a reliable indicator of future returns.
Strategy: Global Credit VolatilityPremium
Investor profile
✓ Looking for alternative sources of return from credit
✓ Seeking low volatility credit spread neutral returns
Jun 13 –Jun 14
Jun 14 –Jun 15
Jun 15 –Jun 16
Jun 16 –Jun 17
Jun 17 –Jun 18
10y return (ann.)
10y volatility 10y risk-adj. return
Tabula Volatility Premium 3.1% 3.3% 0.4% 5.6% 0.0% 4.3% 3.6% 1.19
iBoxx Euro Liquid HY 10.7% 1.4% 1.4% 8.0% 0.2% 6.2% 10.6% 0.59
Data: Bloomberg, 30 Jun 2018.. Performance of Tabula Volatility Premium strategy is excess return. Volatility is the standard deviation of monthly returns. Risk-adjusted return is 10y return/10y volatility. Index methodology is not yet finalised.
Aims to capture the persistent volatility premium implied in credit swaptions.
Credit swaptions reference the iTraxx Crossover and CDX HY indices.
Market neutral strategy with limited exposure to credit spreads.
Low correlation with broader credit market.
MechanicsThe strategy is designed to generate a positive return if realised volatility in European and North American sub-investment grade credit is lower than implied volatility. The index generates income by selling a series of credit swaptions referencing an on-the-run-index :
− iTraxx Crossover on-the-run index (75 equally weighted sub-investment grade entities)
− CDX HY (One hundred liquid North American entities with high yield credit ratings)
The strategy takes short exposure to volatility via a series of swaption strangles with strikes around the current CDS index level and with expiry dates of the current 1-month and 2-month rolls.
To maintain a credit spread-neutral position, the strangles are delta hedged frequently with the underlying index to limit exposure to credit spreads.
50
75
100
125
150
175
200
2008 2009 2010 2011 2012 2013 2014 2015 2016 2017 2018
Tabula Vol Premium iBoxx Euro Liquid HY

PerformanceStrategy performance is simulated. Past performance (actual or simulated) is not a reliable indicator of future returns.
Strategy: Global Carry
Investor profile
✓ Concerned about unintended or uncontrolled risk within traditional bond portfolios
✓ Focused on risk-adjusted returns
Jun 13 –Jun 14
Jun 14 –Jun 15
Jun 15 –Jun 16
Jun 16 –Jun 17
Jun 17 –Jun 18
10y return (ann.)
10y volatility
10y risk-adj. return
Tabula Global Carry 9.4% 3.3% 1.4% 3.1% 0.1% 3.6% 2.9% 1.26
ICE US Treasury 3-7y Bond Index TR 1.94% 2.44% 5.04% -1.56% -1.1% 3.0% 3.4% 0.87
CDX NA IG 5y TR Index 2.91% 0.47% 0.38% 2.58% 2.0% 1.7% 1.8% 0.93
Data: J.P. Morgan / Bloomberg, 30 Jun 2018.. Performance of Global Carry Strategy is excess return. Volatility is the standar d deviation of monthly returns. Risk-adjusted return is 10y return/10y volatility
Designed to capture maximum value from interest rates and credit markets, across Europe and the US
Rules-based approach
Dynamic allocation to the assets with the highest carry relative to risk
Attractive risk-adjusted returns
MechanicsThis is a long-only strategy designed to capture carry across four key fixed income markets:
– US interest rates: 2y, 5y and 10y Treasury futures
– US credit: investment grade (CDX NA IG 5y) and high yield (CDX NA HY 5y)
– Euro interest rates: 2y, 5y, 10y German bond futures
– Euro credit: investment grade (iTraxx Europe 5y) and high yield (iTraxx Crossover 5y)
The strategy allocates equal risk to each of the four markets. However, within each market, it focuses on the assets with the highest expected return relative to risk. The strategy is rebalanced daily, with buffers to avoid excessive turnover, and is calculated net of transaction costs.
60
80
100
120
140
160
180
2007 2008 2009 2010 2011 2012 2013 2014 2015 2016 2017
Tabula Global Carry ICE US Treasury 3-7y Bond Index TR CDX NA IG 5y TR Index

Redefining passive fixed income
What’s next?
We are creating tradable strategies in ETF format, allowing you to add and reduce exposure easily as market conditions change.
Credit curve strategies
Taking advantage of the upward-sloping credit curve
? Global, regional or dynamic mix
? Specific maturities or dynamic strategy
? Stop losses for extreme scenarios
Compression and decompression strategies
Taking advantage of mispricing between different segments of credit market e.g.
Decompression in the US: buy protection on CDX NA HY, sell protection on CDX NA IG, benefit as less creditworthy companies reprice relative to the rest of the market
Compression in Europe: sell protection on iTraxx Crossover, buy protection on iTraxx Main
Convertibles strategies
Exploring ways to improve passive exposure
? Global or regional
? “Smart beta” approach to selection and weighting criteria (e.g. rating, maturity, liquidity, yield)
? Relative value vs. equities and bonds

Important information
Tabula Investment Management Limited is an appointed representative of Cheyne Capital Management (UK) LLP. Cheyne Capital Management (UK) LLP is authorised and regulated by the Financial Conduct Authority (“FCA”) have it registered office at Stornoway House, 13 Cleveland Row, London SW1A 1DH, United Kingdom. For your protection, calls are usually recorded.
This information is being provided for information purposes only, it does not constitute an offer to buy or sell any securities.
The Tabula strategies takes exposure to high yield indices. Companies represented within the indices which issue higher yield bonds typically have an increased risk of defaulting on repayments. When selling CDS on subordinate debt, such debt may be subordinate to senior debt. Economic conditions and interest rate levels may also impact significantly default rates, which in turn impact the return on the indices. In addition, returns may increase or decrease as a result of currency fluctuations.
All financial investments involve an element of risk, therefore the value of an investment and the income from it will vary and your initial investment amount cannot be guaranteed. For the avoidance of doubt, simulated past performance is simulated only, it is not a reliable indicator of future results and should not be the sole factor of consideration when selecting a strategy.
© 2018 Tabula Investment Management Limited.