strategies for improving production in rice based cropping systems b. gangwar project director...
TRANSCRIPT

Strategies for improving production in rice based cropping systems
B. GangwarProject Director
Project Directorate for Farming Systems Research, Modipuram, Meerut-250 110 (U.P.)

Major concern Increase in human population (1.2 Billion by 2020)
Decline in per capita availability of land (0.11 ha by 2020)
Stagnation in production (210-216 MT)
Food demand (280 MT by 2020)
Pulses and oil seeds are short in supply
Major predominant cropping systems are cereal based caused second generation problems

Major Cropping Systems in India
Rice – wheat (10.5 m ha)
Rice – rice (5.89 m ha)
Cotton – wheat (1.09 m ha)
Soybean – wheat (2.23 m ha)
Maize – wheat (1.86 m ha)
P. millet - wheat (2.26 m ha)

Crop Management Approaches for Improving Production
Site specific crop diversification
Site specific tillage and crop establishment
Site specific nutrient management
Site specific water management
Site specific weed management including pests

Site specific crop diversification

Efficient alternatives to rice-wheat cropping system
0
40000
80000
120000
160000
200000
Net
ret
urn
/ E
ner
gy
0
10
20
30
40
50
RE
Y
Net Return(Rs/ha/yr)
Energy(Kx1000cal)
REY(t/ha/yr)

Diversification of
rice-wheatArea under Rice-wheat: 10.5 m ha.
Av yield: 4.71 t/ha(REY).
Potential range of diversified systems 12-43 t/ha.
Expected gain if 10% area is diversified : 24.0 mt.

Efficient alternatives to rice-rice cropping system
0
40000
80000
120000
Net
ret
urn/
Ene
rgy
0
5
10
15
20
25
RE
Y
Net Return(Rs/ha/yr)Energy(Kx1000cal)REY(t/ha/yr)

Diversification of
Rice- RiceArea under Rice- Rice : 2.98 m ha.
Av yield: 4.81 t/ha.
Potential range of diversified systems 12-21 t/ha.
Expected gain if 10% area is diversified : 3-5 mt.

Site specific tillage
and crop establishment

Effect of Tillage/Crop establishment in Rice (hybrid) Based Cropping Systems(REY t/ha)
Treatment
(Tillage Practices)
Rice- wheat Rice- chickpea Rice- mustard
Direct-seeding (dry bed)
14.84 13.90 14.31
Drum-seeding (wet bed)
14.91 13.88 13.66
Mechanical transplanting (puddled)
13.75 11.07 12.28
Mechanical transplanting (unpuddled)
13.99 12.60 12.66
Manual transplanting (puddled)
13.43 10.89 12.22
Gangwar et.al.(2006)

Effect of planting techniques on productivity of rice based cropping systems
Cropping systems REY (t/ha) Productivity(kg/ha/day)
FB BBF FB BBF
Rice - wheat 7.96 8.23 35.2 36.5
Rice - mustard 5.89 6.14 28.8 31.2
Rice - groundnut 9.32 9.74 25.9 27.7
Gangwar et.al.(2005)

Site specific nutrient management

NUTRIENT DEFICIENCIES IN INDIAN SOILS
Nitrogen - Low in 228 districts, Medium in 118 districts, High in 18 districts.
Phosphorus - Low in 170 districts, Medium in 189 districts, High in 17districts.
Potassium - Low in 47 districts, Medium in 192 districts, High in 122 districts.
Sulpher - Low in 130 districts.
Magnesium - Kerala, AP, Parts of Tamil Nadu and Very acid soils.
Zinc - More than 50 % soils.
Iron - In most of calcareous soils, Mainly in groundnut,sugarcane, sorghum and upland rice.
Boron - Parts of West Bengal, Assam, Bihar and Karnataka.

-2000
-1500
-1000
-500
0
500
1000
1500
2000
2500
3000
N P KNu
trie
nts
( '000 t
)
Addition Removal Balance
Negative Nutrient Balance in Rice-Wheat System in Indo-Negative Nutrient Balance in Rice-Wheat System in Indo-Gangetic PlainsGangetic Plains

Effect of IPNS packages on rice equivalent yield in rice-wheat system
0100020003000400050006000700080009000
10000
Control 100 F 50F+FYM 50F+CR 50F+GM FP
REY
(kg/
ha) REY

0
5
10
15
20
25
Kg
RE
Y/K
g nu
trie
nt
Western HimalayanRegion(Jammu)
EasternPlateau&Hills
(Dumka)
Gujarat Plains &Hills (Jagudan)
NP
K
NPK

ECONOMIC RESPONSE OF RICE-WHEAT SYSTEM TO MAJOR NUTRIENTS
0
5
10
15
20
Rs
./Re
sp
en
t o
n n
utr
ien
t
Westernhimalayan
Region(Jammu)
Eastern Plateau& Hills (Dumka)
Gujarat Plains &Hills (Jagudan)
N
P
K
NPK

Effect of IPNS packages on REY in rice-rice system
0100020003000400050006000700080009000
10000
Control 100 F 50 F: FYM 50 F: CR 50 F: GM
REY
(kg/
ha)

0
5
10
15
20
25
30
35
40
Kg
rice
gra
in/K
g nu
trie
nt
Eastern Himalayan(Jorhat)
Easern Coast Plains &Hills(Anakapally)
Southern Plateau&Hills(Tirupathisaran) N
PK
NPK
RICE-RICE SYSTEM RESPONSE TO MAJOR NUTRIENTS

Economic Response Of Rice-Rice System To Major Nutrients
0
5
10
15
20
25
30
Rs
./R
e s
pe
nt
on
nu
trie
nt
EasternHimalayan
(Jorhat)
Eastern CoastPlains & Hills
(A.K.Pally)
SouthernPlateau Hills
(Tirup)
N
P
K
N
P
K

YIELD MAXIMIZATION
Effect of fertilizer doses, organic manure and plant population on rice-rice system yield (t/ha)
South Zone, Karamana (1993-97)
Treatments Mean grain yield of rice (4 years)
I II Total
Fertilizer doses (kg/ha)
F1 Rec. dose (90-40-40) 4.36 2.76 7.12
F2 125 % (113-50-50) 4.43 2.83 7.46
F3 150 % (135-60-60) 4.40 2.58 6.98
Farm yard manure (t/ha)
Mo control 4.39 2.71 7.10
M1 5 4.43 2.74 7.17
Plant population (spacing-cm)
P1 20 X 10 4.42 2.66 7.08
P2 15 X 10 4.40 2.79 7.19

Treatments Mean grain yield of rice (4 years)
I II Total
Fertilizer doses (kg/ha)
F1 Rec. dose (80-40-40) 3.28 3.41 6.69
F2 125 % (100-50-50) 3.81 3.75 7.56
F3 150 % (120-60-60) 3.88 3.89 7.77
Green manure (t/ha)
Mo control 3.49 3.43 6.92
M1 10 3.81 3.94 7.75
Plant population (spacing-cm)
P1 20 X 10 3.61 3.51 7.12
P2 15 X 10 3.71 3.85 7.56
East and South Eastern Coastal Zone, Bhubneshwar (1993-97)

Influence of secondary and micronutrients on the total productivity (kg/ha) of different cropping systemsTreatments Bhubneswar Maruteru
Rice-rice Rice-rice
T1 :Recommended NPK for kharif and rabi every year 6375 8738
T2 :T1 + Sulphur @ 25 kg/ha 6845 10240
T3 :T1 + Sulphur @ 50 kg/ha6980 10787
T4 :T1 + Zinc @ 5 kg/ha through ZnSO4
7542 9561
T5 :T1 + Zinc @ 10 kg/ha through ZnSO4
7898 9786

Zone: Southern & High Rainfall Zone (Tiruneveli)
Major Constraints: Micro-nutrient (Zinc deficiency)
Prevailing system: Rice-riceKharif rice (I) Rabi rice (II) Yield (kg/ha) %
increaseI II Total
T1 Farmer practice 62-25-25 kg NPK/ha
Farmer practice 62-25-25 kg NPK/ha 4046 3881 7927 -
T1 + ZnSo4 @ 25 kg/ha
T1 + ZnSo4 @ 25 kg/ha 4370 4123 8493 40.2
Full package (125-50-50 kg NPK/ha)
Full package (125-50-50 kg NPK/ha) 4917 4853 9770 46.5
CD (0.05) 122 172 - -

Zone: South Konkan Coastal Zone (Ratnagiri)
Major Constraints: Nutrient management
Prevailing system: Rice-groundnut
Kharif rice Groundnut Yield (kg/ha) % increase
I II Total
T1 45-15-15 kg NPK/ha
20-15-0 kg NPK/ha 4724 2436 9596 -
T2 100-50-50 kg NPK/ha
25-50-0 kg NPK/ha 6382 3116 12614 31.45
Full package Full package 7462 3774 15010 56.41
CD (0.05) 167 108 - -

Zone: Coastal Midland (Trissur)
Major Constraints: Nutrient application
Prevailing system: Rice-rice
Kharif rice (I) Rabi rice (II) Yield (kg/ha) % increaseI II Total
T1 Farmer practice 40-30-18 kg NPK/ha
Farmer practice 40-30-18 kg NPK/ha
4125 4850 8975 -
T2 T1 + cow dung @ 5 t/ha
T1 + cow dung @ 5 t/ha
4065 5500 9565 6.57
T3 Recommended practice (90-45-45 kg NPK/ha)
Recommended practice (90-45-45 kg NPK/ha)
4595 5600 10195 13.59
T4 T3 (1/3 as basal + 30 kg LCC-3)
T3 (1/3 as basal + 30 kg LCC-3)
4890 5750 10640 18.55
T5 T3 (1/3 as basal + 30 kg LCC-4)
T3 (1/3 as basal + 30 kg LCC-4)
4840 6050 10890 21.33
CD (0.05) 485 367
0 2 4 6 8 10 12 14 16 18
Sabour
Palampur
Ranchi
R.S. Pura
Ludhiana
Faizabad
Kanpur
Modipuram
Varanasi
Pantnagar
Mean
System productivity (t/ha)
Farmer's practice
SSNM
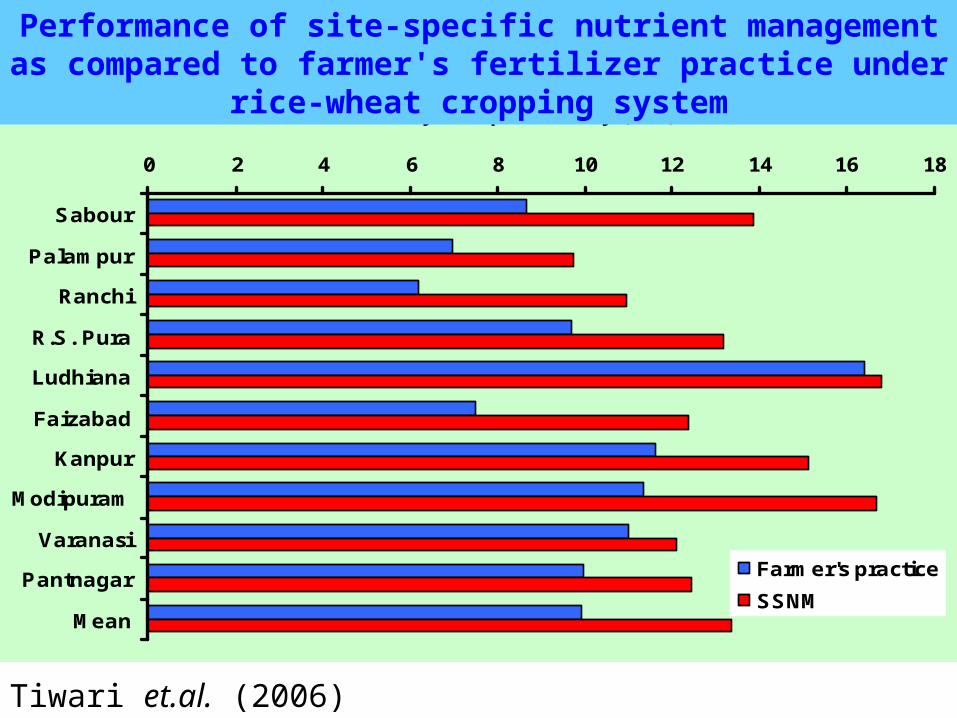
Performance of site-specific nutrient management as compared to farmer's fertilizer practice under rice-wheat cropping system
Tiwari et.al. (2006)

0 2 4 6 8 10 12 14 16 18 20
Maruteru
Jorhat
Navsari
Karjat
Coimbatore
Thanjavur
Mean
System productivity (t/ha)
Farmer's practice
SSNM
Performance of site-specific nutrient management as compared to Performance of site-specific nutrient management as compared to farmer's fertilizer practice under rice-rice cropping systemfarmer's fertilizer practice under rice-rice cropping system
Tiwari et.al. (2006)

Site specific water management

Effect of water management treatments on rice yield
Treatments Rice yield (t/ha)
Water use in R-W system(ha.Cm.)
Saving (%)
DP 4.73 152 -
HC 4.57 120 20.5
DP-Irrigation on disappearance of water
HC- Irrigation at hair line crack stage

Site specific weed and pest management

Effect of cropping systems on dry weight of weeds at 30 DASEffect of cropping systems on dry weight of weeds at 30 DAS
Cropping systems Weed dry weight (g/m2) Total
Kharif Pre. rabi Rabi Pre. kharif
Rice-wheat 10.08 - 12.98 - 23.06
Rice-wheat-greengram 7.70 - 11.15 3.23 22.07
Rice-wheat-sesbania 8.25 - 10.76 - 19.01
Rice-potato-wheat 9.73 9.70 1.81 - 21.24

Effect of intensification on Effect of intensification on Phalaris minor in wheat Phalaris minor in wheat cropcrop
Cropping systems Ist year IInd year IIIrd year Mean
Rice-wheat 105 114 133 117
Rice-pea-wheat-greengram
47
(55.2 %)
26
(77.2 %)
18
(86.5 %)
30
(74.3 %)
Rice-potato-wheat 14
(86.7 %)
12
(89.5 %)
5
(96.2 %)
10
(91.5 %)

Effect of interruption once in 3 years on Effect of interruption once in 3 years on Phalaris Phalaris minorminor in succeeding years at Modipuram in succeeding years at Modipuram
Cropping systems IInd year IIIrd year Mean
Rice-wheat (E) 114 133 124
Rice-berseem (F) 50 (56.1%) 62 (53.4 %) 56 (54.8 %)
Rice-mustard-greengram 61 (46.5 %) 69 (48.1 %) 65 (47.6 %)

Agronomic Management based on Regional Agronomic Management based on Regional Constraints (On Farm)Constraints (On Farm)Zone: North Eastern Zone (Viridhachalam)
Major Constraints: Weed Management
Prevailing system: Rice-rice
Kharif rice (I) Rabi rice (II) Yield (kg/ha) % increaseI II Total
T1 No weeding No weeding 3852 4019 7871 -
T2 Butachlor @ 2.5 lit./ha mixed with 50 kg sand on 5th DAT and one hand weeding at 30 DAT
Anilophos @ 1.25 lit./ha mixed with 50 kg sand on 5th DAT and one hand weeding at 30 DAT
4633 4815 9448 40.1
Full package Full package 5094 5246 10340 62.7
CD (0.05) 122 172 - -

CONCLUSIONS
The diversified rice based systems proved to be more efficient than existing rice based systems and calls for adoption of strategies as presented above.
The quantum jumps in total farm production are achievable with use of improved management practices under diversified systems as identified.