strategies for high throughput hplc analysis for ... · combinatorial library is subjected to high...
TRANSCRIPT
Strate gies for Hi gh Throu ghput HPLC
Anal ysis for Combinatorial Chemistr y
J. Carmody*, U. Neue, R. Crowley and C. Andrews, Waters
Corporation, Milford, MA 01757
Poster presented at Drug Discovery '98 in Boston at the Hynes Convention Center, August 10-13th
© 1998 Waters Corporation
© 1998 Waters Corporation
AbstractTraditionally, the search for biologically active molecules has involved the systhesis of one-molecule-at-a-time discovery strategies. This has proven to be a very time consuming and labor intensive process for the discovery of new drugs, catalysts and materials. New combinatorial chemistry techniques have reduced syntesis times by allowing simultaneous generation of a large number of chemical variants, several of which may be active leads. Once this lead generation process is complete the resultant combinatorial library is subjected to high throughput screening techniques, once of which is HPLC. Due to the plethora of compounds generated by the combinatorial chemistry technique, minimizing analysis time is paramount to meeting the major challenge of isolating the desired compound from other indigenous material as quickly as possible. Optimization of the HPLC screening process to achieve shorter analysis times is not always intrinsically straightforward. In order to achieve compressed analysis times there is a need to more completely understand the effect that the column characteristics (i.e. flow rate and gradient time) have on the selecitivity and resolution of the separation. The resolution and the selectivity being the two characteristics of the separation most affectd by changes in the column and operational parameters.
In this paper we will show straightforward HPLC strategies to developing fast gradient methods to quickly resolve target compounds from other inactive combinations.
© 1998 Waters Corporation
Outline
Introduction
Theory of Gradient Separations
Optimization of Gradient Separations to...achieve maximum throughputmaximize resolution
Conclusion

© 1998 Waters Corporation
Introduction
Goal...
Give you a strategy for rapid gradient methods development by showing you how to use operational parameters (such as gradient run time, flow rate and column length) to maximize the desirable aspects of a combinatorial separation:
Throughput Resolution Robustness
© 1998 Waters Corporation
Factors Influencin g Resolution in Gradient RP-HPLC Separations
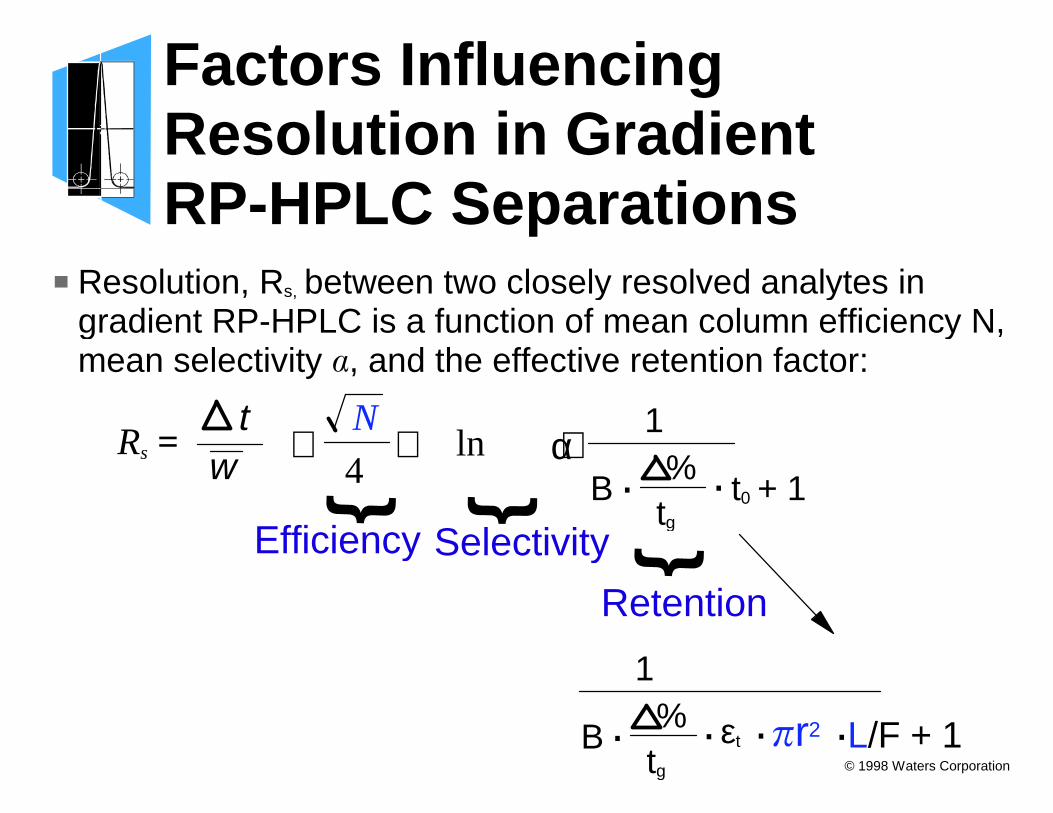
Resolution, Rs, between two closely resolved analytes in gradient RP-HPLC is a function of mean column efficiency N, mean selectivity �, and the effective retention factor:
α
% tg
Efficiency Selectivity
N⋅∼
4⋅} }
t w Rs = ln
t0 + 1
Retention
} % tg
B
1
. .
εtB
1
. . �r2. .L/F + 1
© 1998 Waters Corporation
HPLC System
Waters 2690XE Separations Module
Waters Millennium32 Data System
Waters 486 UV detector and 996 Photodiode Array detector
© 1998 Waters Corporation
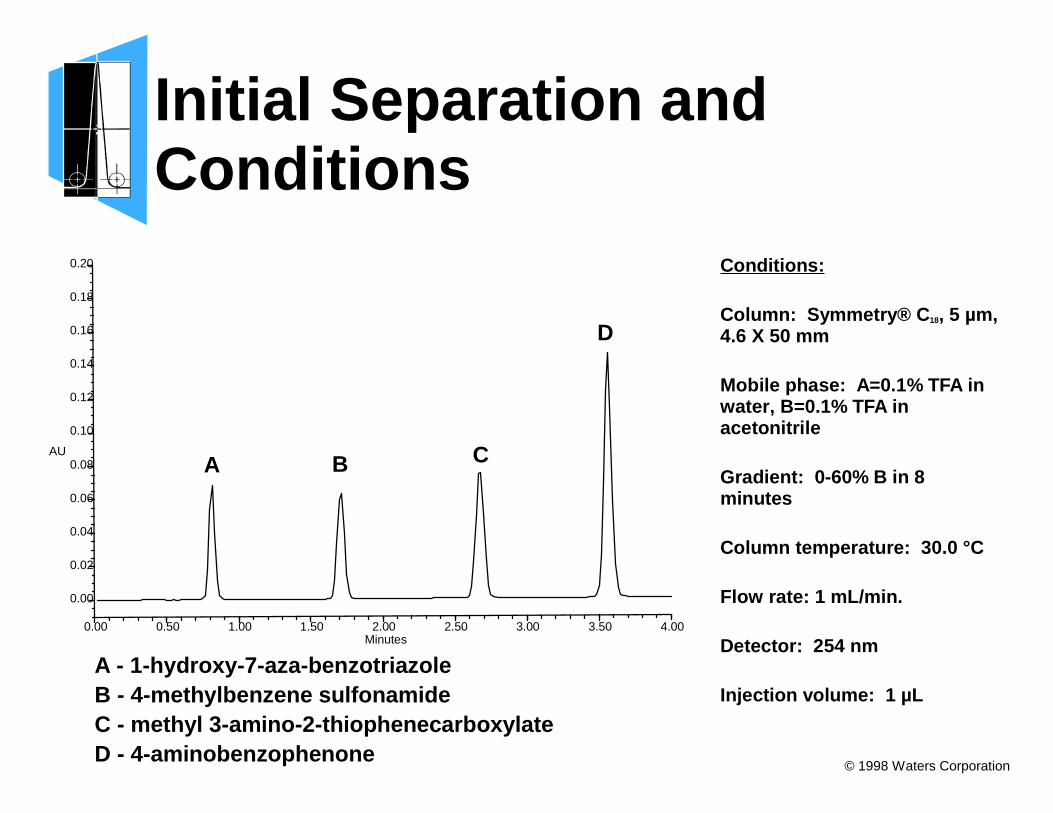
Initial Separation and Conditions
Conditions:
Column: Symmetry® C 18, 5 µm, 4.6 X 50 mm
Mobile phase: A=0.1% TFA in water, B=0.1% TFA in acetonitrile
Gradient: 0-60% B in 8 minutes
Column temperature: 30.0 °C
Flow rate: 1 mL/min.
Detector: 254 nm
Injection volume: 1 µL
AU
0.00
0.02
0.04
0.06
0.08
0.10
0.12
0.14
0.16
0.18
0.20
Minutes0.00 0.50 1.00 1.50 2.00 2.50 3.00 3.50 4.00
A - 1-hydroxy-7-aza-benzotriazoleB - 4-methylbenzene sulfonamideC - methyl 3-amino-2-thiophenecarboxylateD - 4-aminobenzophenone
A B C
D
© 1998 Waters Corporation
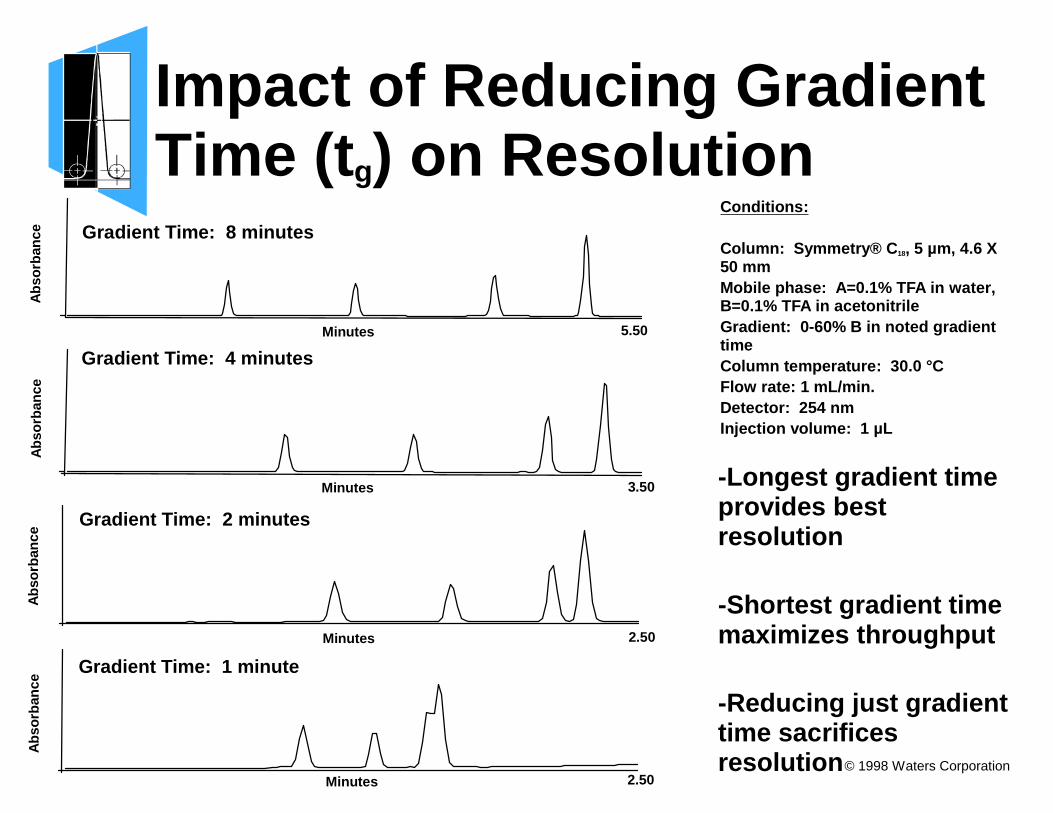
Impact of Reducin g Gradient Time (t g) on Resolution
Conditions:
Column: Symmetry® C 18, 5 µm, 4.6 X 50 mmMobile phase: A=0.1% TFA in water, B=0.1% TFA in acetonitrileGradient: 0-60% B in noted gradient timeColumn temperature: 30.0 °CFlow rate: 1 mL/min.Detector: 254 nmInjection volume: 1 µL
Gradient Time: 8 minutes
Gradient Time: 4 minutes
Gradient Time: 2 minutes
-Longest gradient time provides best resolution
-Shortest gradient time maximizes throughput
-Reducing just gradient time sacrifices resolution
Gradient Time: 1 minute
Minutes
Abs
orba
nce
5.50
Abs
orba
nce
Minutes 2.50
Abs
orba
nce
Minutes 2.50
Abs
orba
nce
Minutes 3.50
© 1998 Waters Corporation
Summar y - Impact of Gradient Run Time on Resolution
Resolution increases as gradient run time increases
Throughput decreases as gradient run time increases
© 1998 Waters Corporation
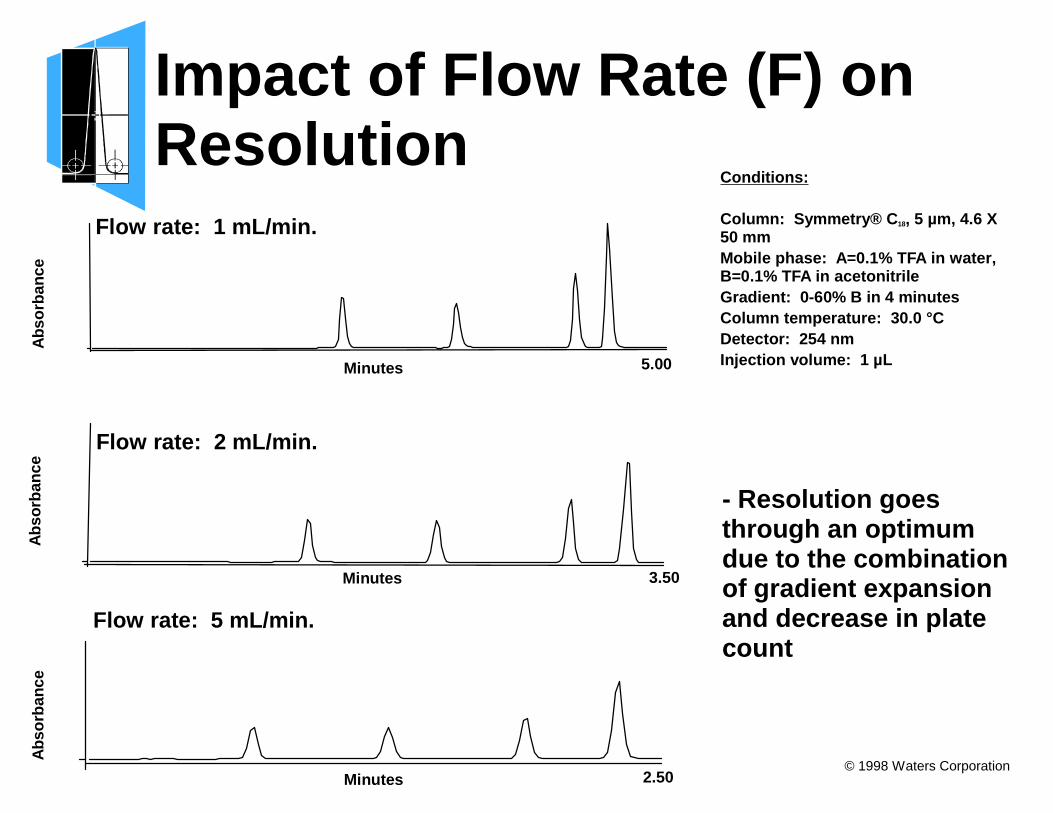
Impact of Flow Rate (F) on Resolution
Conditions:
Column: Symmetry® C 18, 5 µm, 4.6 X 50 mmMobile phase: A=0.1% TFA in water, B=0.1% TFA in acetonitrileGradient: 0-60% B in 4 minutesColumn temperature: 30.0 °CDetector: 254 nmInjection volume: 1 µL
- Resolution goes through an optimum due to the combination of gradient expansion and decrease in plate count
Abs
orba
nce
Minutes 5.00
Flow rate: 1 mL/min.
Abs
orba
nce
Minutes 2.50
Flow rate: 5 mL/min.
Abs
orba
nce
Minutes 3.50
Flow rate: 2 mL/min.
© 1998 Waters Corporation
Summar y - Impact of Flow Rate on Resolution
Resolution goes through an optimum due to the combination of gradient expansion and decrease in plate count
Optimum resolution around 1 to 2 mL/min for most practical separation problems
© 1998 Waters Corporation
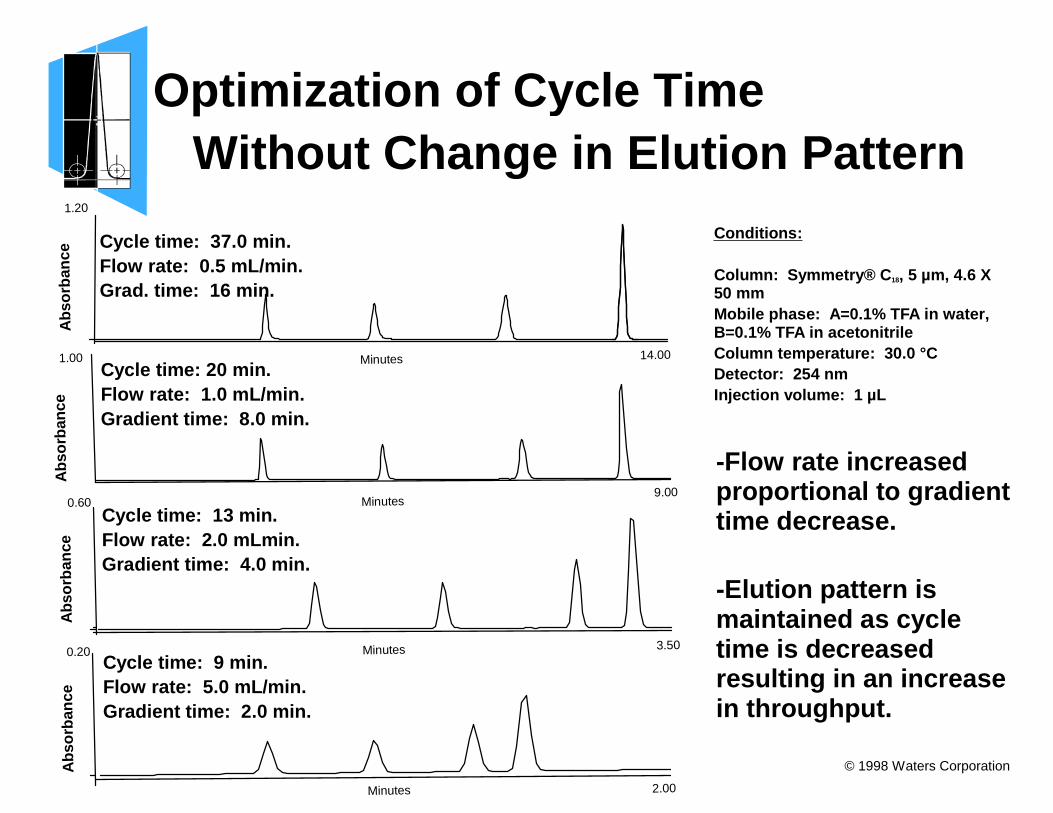
Optimization of C ycle Time Without Chan ge in Elution Pattern
Conditions:
Column: Symmetry® C 18, 5 µm, 4.6 X 50 mmMobile phase: A=0.1% TFA in water, B=0.1% TFA in acetonitrileColumn temperature: 30.0 °CDetector: 254 nmInjection volume: 1 µL
-Flow rate increased proportional to gradient time decrease.
-Elution pattern is maintained as cycle time is decreased resulting in an increase in throughput.
Cycle time: 37.0 min.Flow rate: 0.5 mL/min.Grad. time: 16 min.
Abs
orba
nce
0.60
3.50Minutes
Abs
orba
nce
0.20
Minutes 2.00
Abs
orba
nce
9.00
1.00
Minutes
Abs
orba
nce
Minutes 14.00
1.20
Cycle time: 20 min.Flow rate: 1.0 mL/min.Gradient time: 8.0 min.
Cycle time: 13 min.Flow rate: 2.0 mLmin.Gradient time: 4.0 min.
Cycle time: 9 min.Flow rate: 5.0 mL/min.Gradient time: 2.0 min.
© 1998 Waters Corporation
Summar y - Optimization of Cycle Time Without Sacrificin g Resolution
To obtain the maximum sample throughput without sacrificing resolution the gradient time must be adjusted proportionally to the flow rate.
As shown in the previous slide the sample throughput was increased by 800% upon increasing the flow rate to 5 mL/min. and reducing the gradient time to 2 minutes.
© 1998 Waters Corporation
Impact of Column Len gth on Resolution
How Short is Too Short?
It is not the column length which influences the separation in so much as the number of gradient volumes moving across the column.
© 1998 Waters Corporation
2 Approaches:
Approach 1: scale gradient volume in proportion to the column volume(such as change the gradient run time with the column length).
Approach 2: do not scale the gradient volume in proportion to the column volume (such as keep the gradient run time constant while changing the column length).
The Number of Column Volumes per Minute Impacts Resolution
© 1998 Waters Corporation
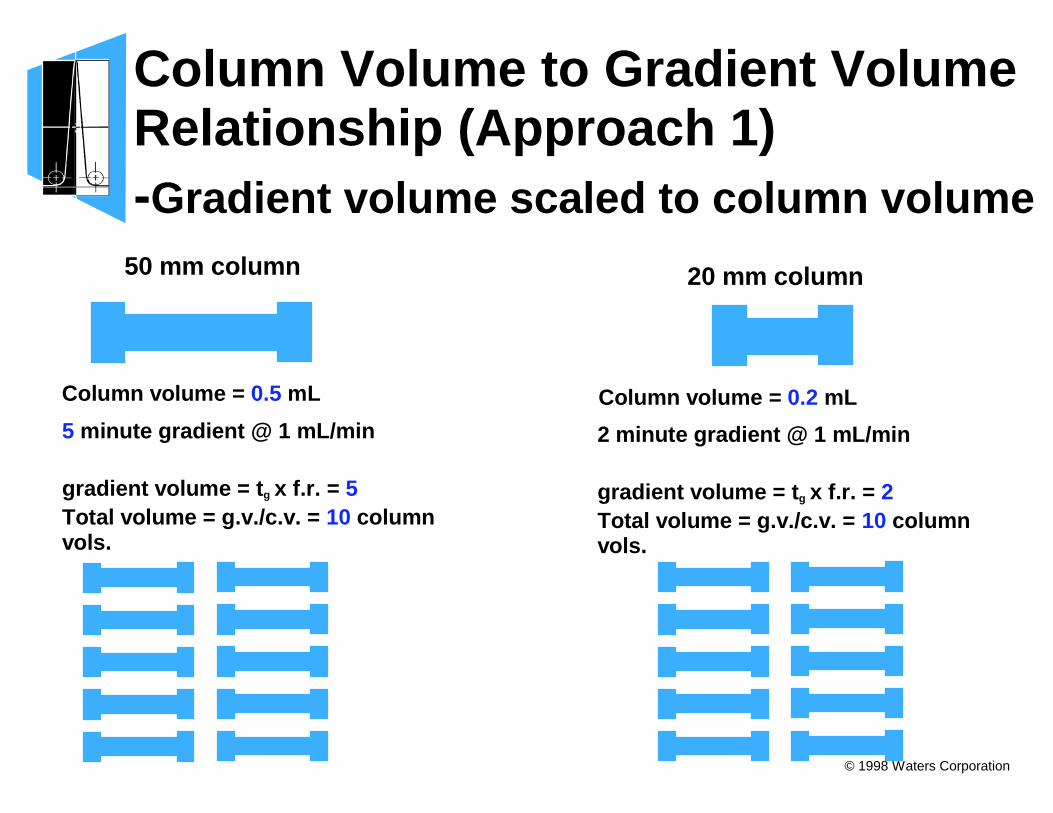
Column Volume to Gradient Volume Relationship (Approach 1)-Gradient volume scaled to column volume
Column volume = 0.5 mL Column volume = 0.2 mL
5 minute gradient @ 1 mL/min
gradient volume = t g x f.r. = 5 Total volume = g.v./c.v. = 10 column vols.
50 mm column 20 mm column
2 minute gradient @ 1 mL/min
gradient volume = t g x f.r. = 2 Total volume = g.v./c.v. = 10 column vols.
© 1998 Waters Corporation
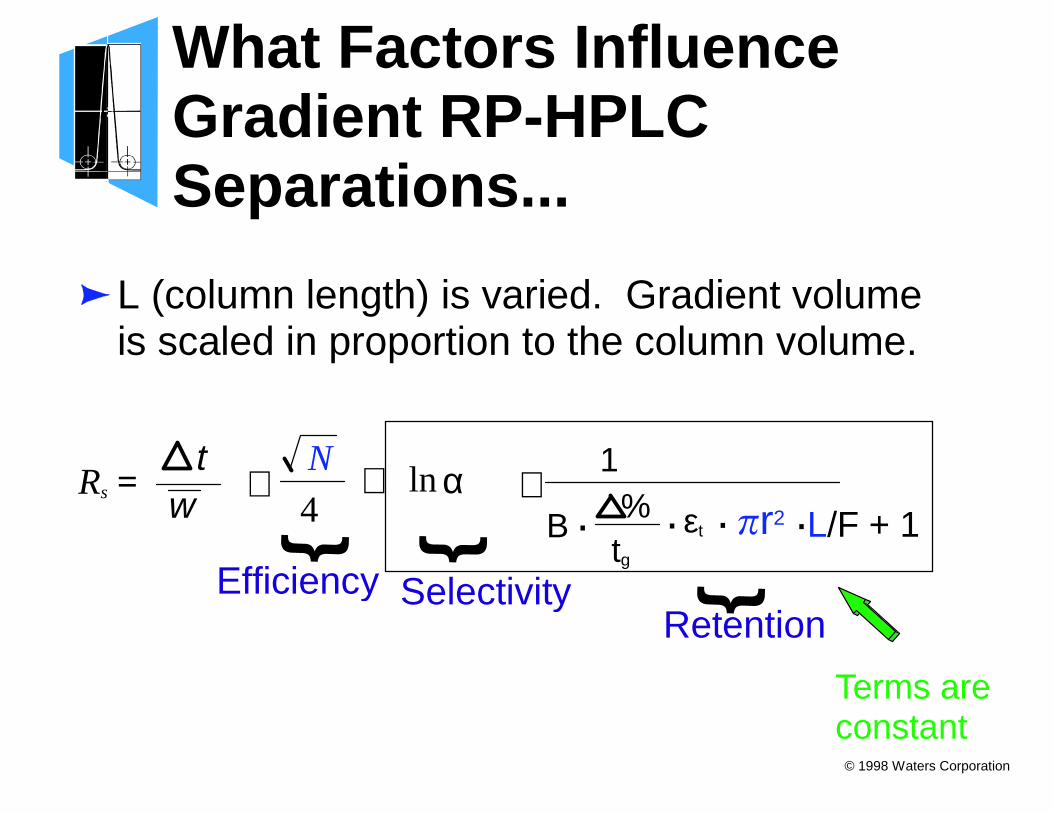
What Factors Influence Gradient RP-HPLC Separations...
L (column length) is varied. Gradient volume is scaled in proportion to the column volume.
Terms are constant
Retention
α
Efficiency Selectivity
⋅ ⋅} }
}
lnN
∼4
t w Rs =
εt % tg
B
1
. . . .L/F + 1�r2
© 1998 Waters Corporation
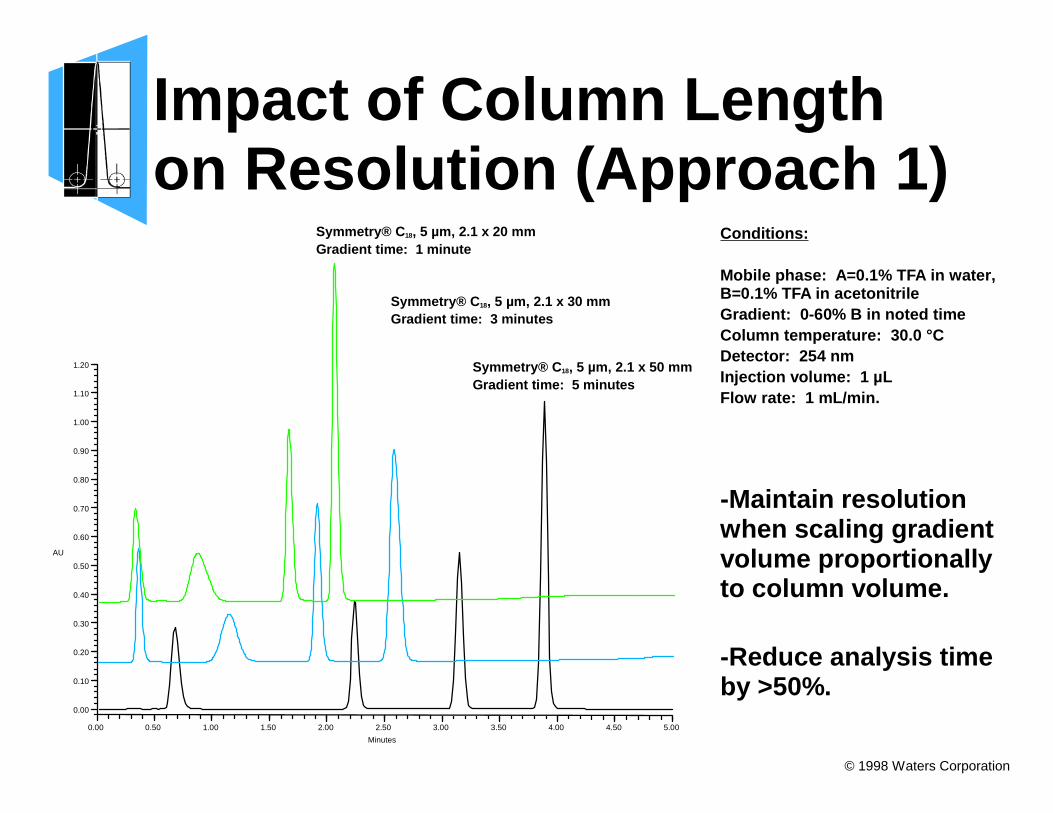
Impact of Column Len gth on Resolution (Approach 1)
Conditions:
Mobile phase: A=0.1% TFA in water, B=0.1% TFA in acetonitrileGradient: 0-60% B in noted timeColumn temperature: 30.0 °CDetector: 254 nmInjection volume: 1 µLFlow rate: 1 mL/min.
-Maintain resolution when scaling gradient volume proportionally to column volume.
-Reduce analysis time by >50%.
Symmetry® C 18, 5 µm, 2.1 x 50 mmGradient time: 5 minutes
Symmetry® C 18, 5 µm, 2.1 x 30 mmGradient time: 3 minutes
Symmetry® C 18, 5 µm, 2.1 x 20 mmGradient time: 1 minute
AU
0.00
0.10
0.20
0.30
0.40
0.50
0.60
0.70
0.80
0.90
1.00
1.10
1.20
Minutes
0.00 0.50 1.00 1.50 2.00 2.50 3.00 3.50 4.00 4.50 5.00
© 1998 Waters Corporation
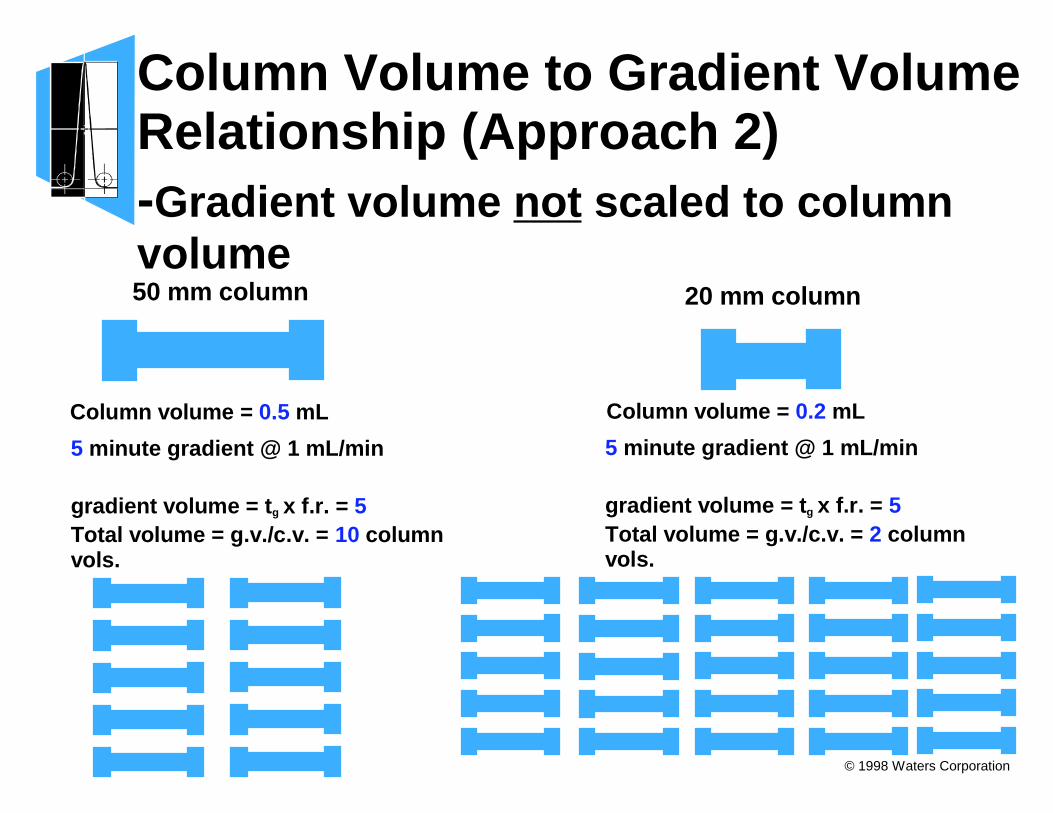
Column Volume to Gradient Volume Relationship (Approach 2)-Gradient volume not scaled to column volume
Column volume = 0.5 mL Column volume = 0.2 mL
20 mm column50 mm column
5 minute gradient @ 1 mL/min
gradient volume = t g x f.r. = 5 Total volume = g.v./c.v. = 10 column vols.
5 minute gradient @ 1 mL/min
gradient volume = t g x f.r. = 5 Total volume = g.v./c.v. = 2 column vols.
© 1998 Waters Corporation
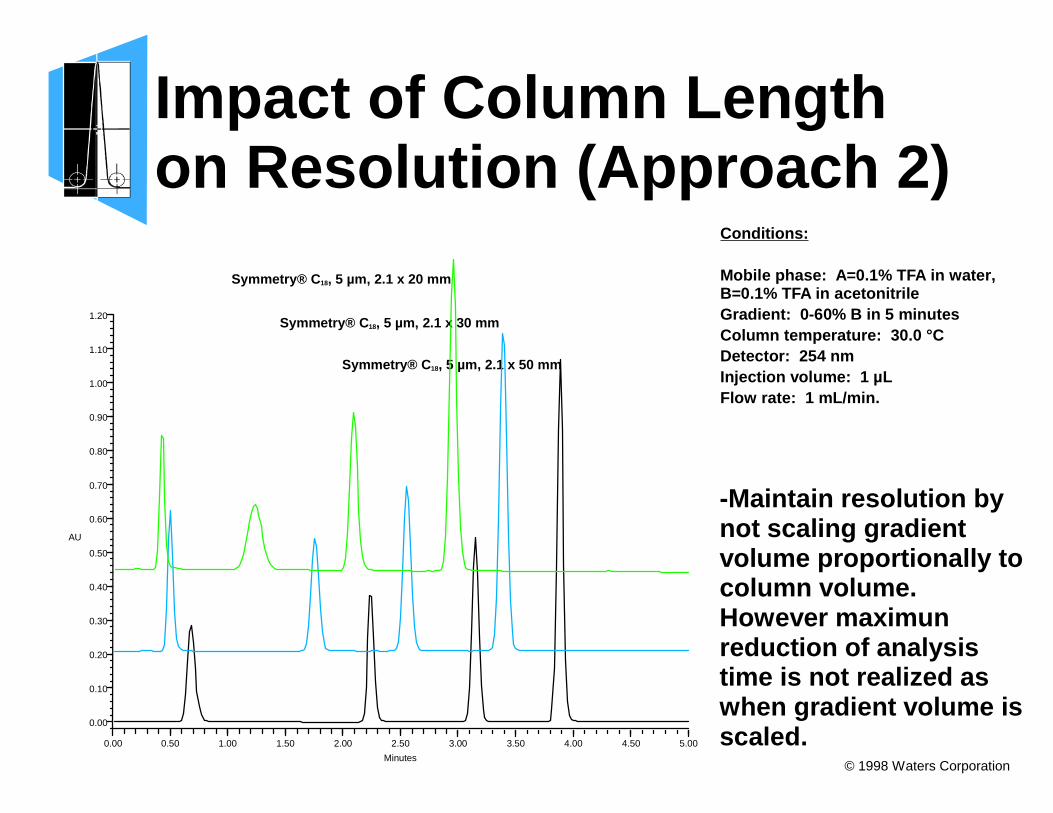
Impact of Column Len gth on Resolution (Approach 2)
Conditions:
Mobile phase: A=0.1% TFA in water, B=0.1% TFA in acetonitrileGradient: 0-60% B in 5 minutesColumn temperature: 30.0 °CDetector: 254 nmInjection volume: 1 µLFlow rate: 1 mL/min.
-Maintain resolution by not scaling gradient volume proportionally to column volume. However maximun reduction of analysis time is not realized as when gradient volume is scaled.
Symmetry® C 18, 5 µm, 2.1 x 50 mm
Symmetry® C 18, 5 µm, 2.1 x 30 mm
Symmetry® C 18, 5 µm, 2.1 x 20 mm
AU
0.00
0.10
0.20
0.30
0.40
0.50
0.60
0.70
0.80
0.90
1.00
1.10
1.20
Minutes
0.00 0.50 1.00 1.50 2.00 2.50 3.00 3.50 4.00 4.50 5.00
© 1998 Waters Corporation
Summar y - Impact of Column Len gth on Resolution
Resolution is maintained when taking either approach (scaling or not scaling).
However maximum sample throughput is realized when the gradient volume is scaled proportionally to the column volume.
© 1998 Waters Corporation
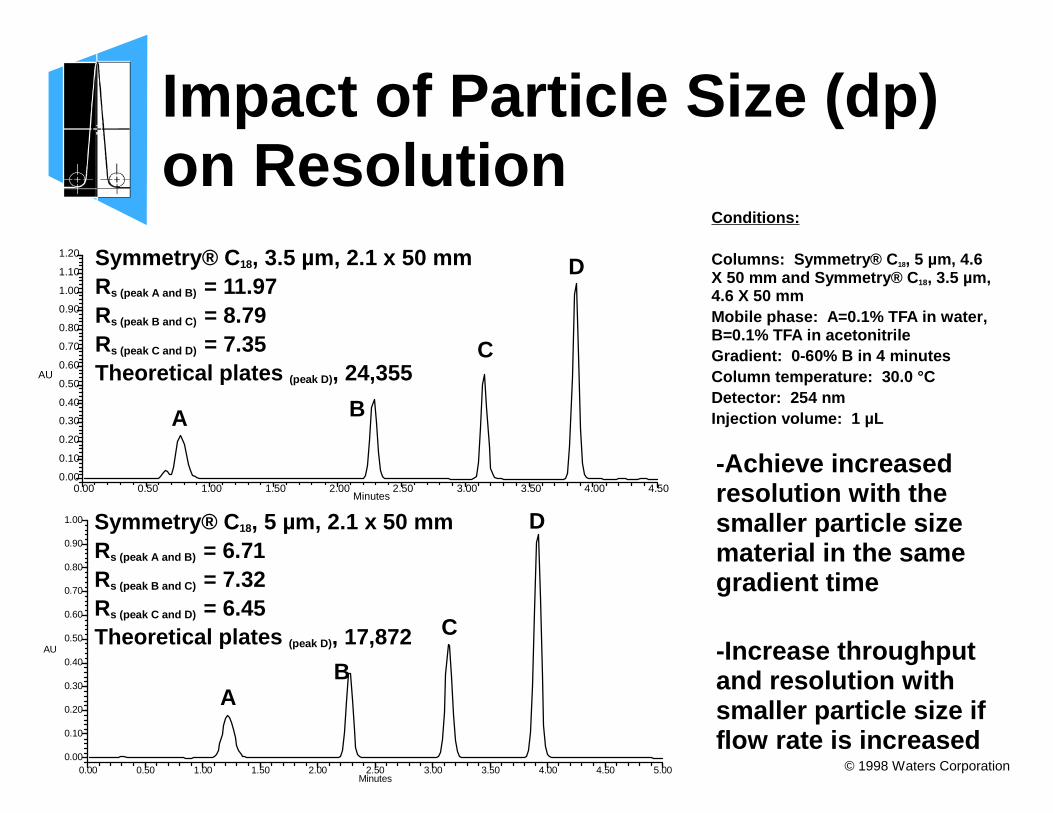
Impact of Particle Size (dp) on Resolution
Conditions:
Columns: Symmetry® C 18, 5 µm, 4.6 X 50 mm and Symmetry® C 18, 3.5 µm, 4.6 X 50 mmMobile phase: A=0.1% TFA in water, B=0.1% TFA in acetonitrileGradient: 0-60% B in 4 minutesColumn temperature: 30.0 °CDetector: 254 nmInjection volume: 1 µL
-Achieve increased resolution with the smaller particle size material in the same gradient time
-Increase throughput and resolution with smaller particle size if flow rate is increased
Symmetry® C 18, 3.5 µm, 2.1 x 50 mmRs (peak A and B) = 11.97Rs (peak B and C) = 8.79Rs (peak C and D) = 7.35Theoretical plates (peak D), 24,355
AU
0.00
0.10
0.20
0.30
0.40
0.50
0.60
0.70
0.80
0.90
1.00
Minutes0.00 0.50 1.00 1.50 2.00 2.50 3.00 3.50 4.00 4.50 5.00
AU
0.00
0.10
0.20
0.30
0.40
0.50
0.60
0.70
0.80
0.90
1.00
1.10
1.20
Minutes0.00 0.50 1.00 1.50 2.00 2.50 3.00 3.50 4.00 4.50
Symmetry® C 18, 5 µm, 2.1 x 50 mmRs (peak A and B) = 6.71Rs (peak B and C) = 7.32Rs (peak C and D) = 6.45Theoretical plates (peak D), 17,872
A
A
C
B
B
C
D
D
© 1998 Waters Corporation
Summar y - Impact of Particle Size on Resolution
Resolution is increased as a result of using a smaller particle size. This is due to the increase in the number of theoretical plates.
If the flow rate is increased as well as the particle size being decreased, an increase in sample throughput is realized with increasing resolution.
© 1998 Waters Corporation
ConclusionsTo maximize resolution and sample throughput: use shorter columns with a smaller particle size (i.e. 2.1 X 20 or 10 mm, 3.5 µm) with faster flow rates and scale gradient volume in proportion to column volume.
To maximize resolution with some increase in sample throughput: increase the flow rate or decrease the particle size.
Areas of investigation: effects of DMSO and maximizing column lifetimes.